Embed Size (px)
Citation preview

PBL-I
Data Science for ChemistryUsing Covid-19 Data Sets
2021/7/27

Schedule
• 7/27 Introduction < Now• How to describe chemical compounds
• Group work• Determine objective(s)• Build machine learning models, if necessary.• Discuss the outcome of your results • Prepare the presentation materials• 8 groups / Log in to Slack workspace
• 9/28 Presentations & Discussion• 9:20-12:30 L3 / Zoom• Presentation: 10 min (talk) + 3 min (discussion)• Presentation materials = English / talk = (English or Japanese)
• Report

• Task:1. Summarize the works of your group.
• Background and motivation• Materials and methods• Results• Discussion and evaluation• References
2. Explain your contribution in the group.Describe “when” (date or period) explicitly (thus, regular meetings are recommended).Any types of contributions would be OK(i.g. implementation, gathering new data, data cleansing, active suggestion in discussion, evaluation of results etc…)
• A4 2 pages (excluding figures and references)A template doc file is available on the PBL web page
Report

• Deadline: 10/12 (Tue) 23:59
• Contents:A4 2 pages (PDF file)A template doc file is available at our web site.http://www-dsc.naist.jp/dsc_jp/index.php/dsc-pbl/
• How to submitUpload to the NAIST report submission service Report box name: データサイエンスPBL I / Data Science PBL I [ID: 5013]
File name:{Student ID}_{LastName}_{FirstName}.pdf
Report

Compounds 化合物 Functions機能
Learn the
correlation
INPUT Unknown material
OUTPUT Function (ON/OFF or intensity)
Catalytic abilityMolecule
Solid Polymer
Conductive property
etc
Point!Compounds need to be represented as numerical numbers!化合物を数値・ベクトル等で表現する必要あり
Photo activity
Thermal durability
AI
5
Data Science in Chemistry

COVID-19 Outbreak• The most impactful viral disease of the 21st century
• Declared pandemic on 11th March 2020 by the WHO.• Affected more than 200 countries with millions of cases.• As of 23 July, around 200 million cases were reported and more than 4
million people died.
• Severe acute respiratory syndrome coronavirus-2(SARS-Cov-2) is the virus that causes COVID-19
• The virus has been massively studied• Infection mechanism (protein-protein interaction with ACE2) • SARS-Cov-2 main protease structure (PDB:6LU7)• It would need some time to develop drugs based on mechanism…
We need drugs against COVID-19 as soon as possible.

Drug Development Approach for COVID-19• Drug repositioning (repurposing)
• Reuse currently approved (clinically tested) drugs against COVID-19.
• We can skip time-consuming clinical trials and other experiments.
De-novo development
Repositioning
T. Ashburn and KB. Thor, Nature Reviews Drug Discovery 3, 673–683 (2004)

Currently Investigated Drugs (Repositioning)
As of 2020 July.From Sultana et al., Front. Pharmacol., 06, 2020 | https://doi.org/10.3389/fphar.2020.588654
and more…

Drug Candidates for COVID-19
Remdesivir (hepatitis C treatment)
O
OHN
PO
OO
O
HO
HO
N
NN
N
H2N
Cl
N
HN
NOH
Approved by FDA
Hydroxychloroquine (Malaria treatment)
N
ONH
O
NH2F
Favipiravir: Avigan (Influenza treatment)
O
HN
OH
NH
O
N O
NH
O
Lopinavir (HIV treatment)

In vitro Testing for Drug RepositioningThe cytopathic effect (CPE) reduction assay
Compound library化合物ライブラリ
compound1
compound2
compound3
compound4
compound5
Growth curve⽣育曲線Cell line (細胞株) Compound (化合物)
SARS-Cov-2
• Widely used assay format to screen for antiviral agents• Easy to measure the effects of compounds• The effectiveness of the compounds can be evaluated by the host cell viability.• Indirectly monitoring the compound ability to inhibit viral infection and replication.
Good!
Bad

Data Sets for COVID-19
Tested phenotypic assumptions
• NIH (National Center for Advancing Translational Sciences)• Lunch portal site for COVID-19 related databases (OpenData
Portal) https://opendata.ncats.nih.gov/covid19
• Not only screening data but other data set types, such as multi-omics data in COVID-19 are collected.

Data Sets of Cytopathic Effect Assay• High throughput experimental data sets (HTE) for
searching candidate drugs against COVID-19.
Target Category Live virus infectivity
Target Viral infection and replication
Assay Type Cell viability
Cell Line Vero E6
Detection Type Luminescence
Date Screened 2020-04-29
Throughput 384-well
Positive control Cells without SARS-Cov-2
Negative control DMSO
Assay description
https://opendata.ncats.nih.gov/covid19/assay?aid=14
Normalization/Assay interpretationData is normalized to the negative control (DMSO) and positive controls (cells without virus and Calpain inhibitor IV) for each plate. In the SARS-CoV2 CPE assay, an inactive compound yields a !at line, with 0% response; a compound the inhibits the viral induced cytopathic e"ect produces a curve that approaches 100% response.
Target Type
Cell Line (if applicable)
Readout
Direction of activity
Controls used
Phenotypic
Vero E6 selected for high ACE2 expression (PMID: 17200104)
Luminescence
Activation (rescue of cytopathic e"ect, CPE)
Positive control: Cells without SARS-CoV-2; Calpain inhibitor IV (Millipore Sigma, Cat #: 208724)Negative control: DMSO
SARS-CoV-2 Cytopathic E!ect Assay
Negative Response
-9 -8 -7 -6 -5-100
-50
0
50
100
Concentration, Log[M]
Res
pons
e (%
)
Positive Response
-9 -8 -7 -6 -5-100
-50
0
50
100
Concentration, Log[M]
Res
pons
e (%
)

Data Sheet (cytopathic effect data)Normalization/Assay interpretationData is normalized to the negative control (DMSO) and positive controls (cells without virus and Calpain inhibitor IV) for each plate. In the SARS-CoV2 CPE assay, an inactive compound yields a !at line, with 0% response; a compound the inhibits the viral induced cytopathic e"ect produces a curve that approaches 100% response.
Target Type
Cell Line (if applicable)
Readout
Direction of activity
Controls used
Phenotypic
Vero E6 selected for high ACE2 expression (PMID: 17200104)
Luminescence
Activation (rescue of cytopathic e"ect, CPE)
Positive control: Cells without SARS-CoV-2; Calpain inhibitor IV (Millipore Sigma, Cat #: 208724)Negative control: DMSO
SARS-CoV-2 Cytopathic E!ect Assay
Negative Response
-9 -8 -7 -6 -5-100
-50
0
50
100
Concentration, Log[M]
Res
pons
e (%
)
Positive Response
-9 -8 -7 -6 -5-100
-50
0
50
100
Concentration, Log[M]
Res
pons
e (%
)
AC50
Example:AC50 = 5.0 X 10⁻⁷ [M]pAC50 = -log10(5.0 X 10⁻⁷)
= 6.3
The higher a pAC50 value is, the stronger the cytopathic reduction ability of the compound is.
Blank cellsInactive compounds
Active compound

Data Curation for Assay ResultsAC50 is assigned, but this compound reduced cell activity (killing host cells)
Normalization/Assay interpretationData is normalized to the negative control (DMSO) and positive controls (cells without virus and Calpain inhibitor IV) for each plate. In the SARS-CoV2 CPE assay, an inactive compound yields a !at line, with 0% response; a compound the inhibits the viral induced cytopathic e"ect produces a curve that approaches 100% response.
Target Type
Cell Line (if applicable)
Readout
Direction of activity
Controls used
Phenotypic
Vero E6 selected for high ACE2 expression (PMID: 17200104)
Luminescence
Activation (rescue of cytopathic e"ect, CPE)
Positive control: Cells without SARS-CoV-2; Calpain inhibitor IV (Millipore Sigma, Cat #: 208724)Negative control: DMSO
SARS-CoV-2 Cytopathic E!ect Assay
Negative Response
-9 -8 -7 -6 -5-100
-50
0
50
100
Concentration, Log[M]
Resp
onse
(%)
Positive Response
-9 -8 -7 -6 -5-100
-50
0
50
100
Concentration, Log[M]
Resp
onse
(%)
AC50
We have to curate the data so as to• identify “truly” active compounds• remove inconsistent assay results if multiple assays were conducted• E.g. inconsistent AC50 values

“MDL”: a standard format for chemical structureTitle-1
11 11 0 0 0 0 0 0 0 0999 V2000-0.3985 1.2800 -5.6905 C 0 0 0 0 0 0 0 0 0 0 0 0-0.3985 0.2517 -4.6890 C 0 0 0 0 0 0 0 0 0 0 0 0-0.3985 0.8935 -3.4894 C 0 0 0 0 0 0 0 0 0 0 0 0-0.3985 2.2456 -3.6705 O 0 0 0 0 0 0 0 0 0 0 0 0-0.3985 2.4623 -5.0173 C 0 0 0 0 0 0 0 0 0 0 0 0-0.3985 1.1510 -6.7631 H 0 0 0 0 0 0 0 0 0 0 0 0-0.3985 0.5573 -2.4644 H 0 0 0 0 0 0 0 0 0 0 0 0-0.3985 3.4958 -5.3264 H 0 0 0 0 0 0 0 0 0 0 0 0-0.3985 -1.2026 -4.9030 N 0 0 0 0 0 0 0 0 0 0 0 0-0.7770 -1.5012 -5.7170 H 0 0 0 0 0 0 0 0 0 0 0 0-0.7770 -1.7446 -4.1381 H 0 0 0 0 0 0 0 0 0 0 0 0
1 5 2 0 0 0 01 2 1 0 0 0 02 3 2 0 0 0 03 7 1 0 0 0 04 3 1 0 0 0 05 4 1 0 0 0 06 1 1 0 0 0 08 5 1 0 0 0 09 2 1 0 0 0 09 11 1 0 0 0 0
10 9 1 0 0 0 0M END$$$$
ü MDL format
・A standard format・ Cartesian coordinates of atoms・ Connectivity between atoms
・各原⼦のXYZ座標と原⼦間の結合の様⼦で分⼦を表現
ü SDF file
・Series of MOL format・Properties can be also included
・複数の化合物のMOLを集めたもの・化合物の性質も書き込める
Cartesian Coordinate Atom Name
Bond order
Index of each atom

“SMILES”: Simplified Molecular Input Line Entry Specification
ü SMILES format
・A linear notation・Coordinates are not stored ・Compact than connectivity table・各原⼦のつながりを線形で表記・分⼦構造のコンパクトな表現
Bond order
Index of each atom
NC1=COC=C1
• Atoms• element name: C, N, Cl • aromatic/aliphatic: c/C
• Bonds• single, double, triple: -, =, #
• Branching and rings• substituents are put in round brackets ( )• rings are indicated by digits following
ring atoms
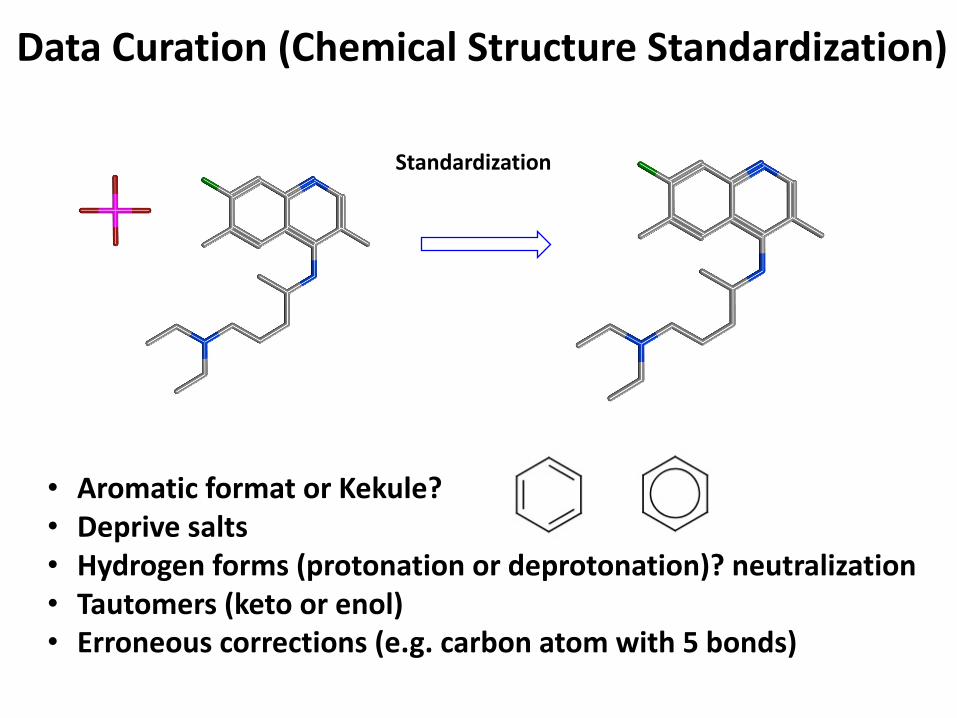
Data Curation (Chemical Structure Standardization)
Standardization
• Aromatic format or Kekule?• Deprive salts• Hydrogen forms (protonation or deprotonation)? neutralization• Tautomers (keto or enol)• Erroneous corrections (e.g. carbon atom with 5 bonds)

Data Curation Procedure(Cytopathic effect (CPE) data as an example)
CPE data set9,479
CPE counter assay data set
Toxicity against the cell(pAC50 > 5) = False positive
Measuring toxicity against host cells without SARS-Cov-2 virus
Active747
Inactive8,752
Active601
Remove false positives
Drop duplicated moleculesaccording to curated SMILES
Active567
Inactive7,939
Active515
Drop actives with Inconsistent active class
Drop duplicated moleculeaccording to curated SMILES
Download form OpenDataPortal

Prepared Data Sets
Objective of this project
Get “useful” insight or tools for future COVID-19 drug design(Any analysis would be acceptable!)
Standardized molecule (SMILES)
Active / Inactive
primary mode of action= original drug mechanism
For detecting inconsistency
Including “drug” name
The number of duplicated chemical structures

Other Analysis Strategies
Analyzing a different HTS data set• Inhibitors of spike (SARS-CoV-2) mediated cell entry.
Mechanism of the protection of virus infection is taken into account.
CZ. Chen et al., ACS Pharmacol. Transl. Sci. 2020, 3, 6, 1165–1175
NCATS Data Portal

Other Analysis Strategies
Mode of action identification (the main protease: Mpro in SARS-Cov-2)
The main protease (Mpro: aka papain-like protease 3CL ) in SARS-Cov-2 is responsible for cleaving poly proteins into 16 non-strucual proteins.• Improtant for viral replication• Dissimilar to human proteins• Promising candidate for SARS-Cov 2 drugs

Prepared Data Sets
# Active # Inactive Total
Cytopathic effect 515 7939 8454
Pseudotypedparticle entry 1872 2317 4189
Main protease (3CL) 311 9154 9465
Although you can use the data sets above, using other data sets is acceptable!

Group work
(2) Conduct the analysis / 解析• Using machine learning
(3) Discuss the outcome and get insight about compounds or models you get. 解析結果の考察:⽬的と照らし合わせよう。• Most important points in this PBL• ここがこのPBLで⼀番⼤事なポイント• For example
• 活性に重要となる要素を特定する• Importance of each descriptor• 各記述⼦の意味・重要性を調べてみよう
(1) Determine the objective / 解析の⽬的を決めようExamples (例)• コロナウイルスの増殖(侵⼊)を防ぐ化合物を予測するモデルの構築• データマイニングによる、活性化合物に共通する特徴量抽出• コロナウイルスの増殖を防ぐメカニズム(e.g.Mproの阻害)を推定• Other analyzes will be welcomed !! (Original approaches are highly evaluated)

Materials• Curated Data Sets
• Original Data:• NCATS OpenData Portalhttps://opendata.ncats.nih.gov/covid19/index.html
• Related information• Machine learning approaches using the same data sets (cell entry): NCATS
H. Sun et al., Bioorg. Med. Chem., 2021, 38, 116119https://doi.org/10.1016/j.bmc.2021.116119
• Review article on computational approaches for drug developments for SARS-CoV-2
Alves V.M. et al, Mol. Inf. 2021, 40, 2000113https://doi.org/10.1002/minf.202000113
• There are so many publications by googling with a key word “SARS-CoV-2 drug repositioning”

Data Science PBL1 in 2020

Exemplary Analysis from 2020 PBL
Objective of this project
Get “useful” insight or tools for future anti-cancer drug design or tumor killing compounds.(Any analysis would be acceptable!)
NSC Washed_smiles CCRF-CEM HL-60(TB) K-562 MOLT-4 RPMI-8226 SR1 CC1=CC(=O)C=CC1=O 5.6 5.5 5.4 5.5 5.4 5.417 CCCCCCCCCCCCCCCc1cc(ccc1N)O 7.3 6.8 5.0 6.7 6.7 5.726 c1ccc(cc1)C(CCI)(c2ccccc2)c3ccccc3 5.4 5.8 5.6 5.4 5.789 CN(C)CCC(=O)c1ccccc1 4.6 4.9 4.6 4.7 5.0 4.5112 Cc1cc(c(c(c1C)C)C[N+](C)(C)C)C 6.7 6.3 6.4 6.5 6.2 6.1171 c1ccnc(c1)C(=O)O 4.0 4.0 4.0 4.0 4.0
Cell line name
pGI50
No data
From 2020 PBL
Cancer cell line data sets cancer cell + compounds → cell response (GI: growth inhibition)

Exemplary Case of Chemoinformatics AnalysisNSC Washed_smiles CCRF-CEM HL-60(TB) K-562 MOLT-4 RPMI-8226 SR1 CC1=CC(=O)C=CC1=O 5.6 5.5 5.4 5.5 5.4 5.417 CCCCCCCCCCCCCCCc1cc(ccc1N)O 7.3 6.8 5.0 6.7 6.7 5.726 c1ccc(cc1)C(CCI)(c2ccccc2)c3ccccc3 5.4 5.8 5.6 5.4 5.789 CN(C)CCC(=O)c1ccccc1 4.6 4.9 4.6 4.7 5.0 4.5112 Cc1cc(c(c(c1C)C)C[N+](C)(C)C)C 6.7 6.3 6.4 6.5 6.2 6.1171 c1ccnc(c1)C(=O)O 4.0 4.0 4.0 4.0 4.0
I want to make a model distinguishing active and inactive compounds for the CCRF-CEM cell line (Leukemia).
NSC Washed_smiles CCRF-CEM Active1 CC1=CC(=O)C=CC1=O 5.6 017 CCCCCCCCCCCCCCCc1cc(ccc1N)O 7.3 126 c1ccc(cc1)C(CCI)(c2ccccc2)c3ccccc3 5.4 089 CN(C)CCC(=O)c1ccccc1 4.6 0112 Cc1cc(c(c(c1C)C)C[N+](C)(C)C)C 6.7 1171 c1ccnc(c1)C(=O)O 4.0 0
pGI50 > 6: activepGI50 < 6: inactive

Convert the “SMILES” into descriptors
Descriptors記述⼦
Descriptors記述⼦
SMILES
Active or Inactive活性の有無
Build the model

Examples of program (python)
import pandas as pdimport numpy as npfrom numpy import vectorize as vecimport scipy as spimport sklearnfrom sklearn.model_selection import train_test_splitimport matplotlibimport matplotlib.pyplot as plt%matplotlib inlineimport seaborn as sns
from rdkit import Chemfrom rdkit.Chem.Draw import IPythonConsolefrom rdkit.Chem import Descriptors,PandasToolsfrom rdkit.ML.Descriptors import MoleculeDescriptors
Import packages and modules.

from google.colab import filesfiles.upload() # upload the SMILES file (washed-nr-er-neutral.tsv)
Upload the NCI60 data sets to google colab.
mols = pd.read_csv('pGI50_mols.tsv', sep='¥t', index_col=0)mols.head(3)
Load the SMILES file
An example of the program (python)

ccrf = mols[['Washed_smiles', 'CCRF-CEM']]ccrf['Active'] = ccrf['CCRF-CEM'] > 6ccrf.head(3)
Extract CCRF-CEM cell line and convert pGI50 to active(1) or not (0)
An example of the program (python)
Chem.PandasTools.AddMoleculeColumnToFrame(ccrf, smilesCol='Washed_smiles', molCol='ROMol')
Convert SMILES to Molecule (ROMol)

ccrf.iloc[1000:1003,:] # random visualization
Visualize molecules (random selection)
An example of the program (python/RDKit)

names = [x[0] for x in Descriptors._descList]print("Number of descriptors in the rdkit: ", len(names))np.array(names)
List up the descriptors in RDKit
Number of descriptors in the rdkit: 200
array(['MolWt', 'HeavyAtomMolWt', 'ExactMolWt', 'NumValenceElectrons', 'NumRadicalElectrons', 'MaxPartialCharge', 'MinPartialCharge', 'MaxAbsPartialCharge', 'MinAbsPartialCharge', 'MaxEStateIndex', 'MinEStateIndex', 'MaxAbsEStateIndex', 'MinAbsEStateIndex', 'BalabanJ', 'BertzCT', 'Chi0', 'Chi0n', 'Chi0v', 'Chi1', 'Chi1n', 'Chi1v', 'Chi2n', 'Chi2v', 'Chi3n', **snip**
An example of the program (python/RDKit)

# Arbitrary selectiondesc_for_now = ['TPSA','SlogP_VSA1','EState_VSA1','SMR_VSA1','MolLogP','MolMR','BalabanJ','HallKierAlpha','Kappa1','Kappa2','Kappa3','RingCount','NumHAcceptors','NumHDonors']
calculator = MoleculeDescriptors.MolecularDescriptorCalculator(desc_for_now)from collections import OrderedDictdesc = OrderedDict()
for mol in ccrf.index:desc[mol] = calculator.CalcDescriptors(ccrf.loc[mol, 'ROMol'])
desc_mols = pd.DataFrame.from_dict(desc, orient='index', columns=desc_for_now)
Select descriptors ( in blue ) and calculate them. You can choose all.
An example of the program (python/RDKit)
desc_mols.to_csv('descriptors.tsv', sep='¥t')
Just in case. Save the descriptors calculated.

def set_color(L):O = []for l in L:
if l == '1':O.append("red")
else:O.append("palegreen")
return O
pd.plotting.scatter_matrix(mols_desc,figsize=(16,16), hist_kwds={'bins':15}, marker='+', s=8, alpha=.5, c=set_color(ccrf.Active))
plt.show()
Check the descriptors Visualize correlations between each pair of descriptors.

X_train, X_test, y_train, y_test = train_test_split(desc_mols, ccrf.Active, train_size=0.25, test_size=0.75, random_state=0)
print("Training Data")print("Number of active molecules: ", list(y_train).count(1))print("Number of inactive molecules: ", list(y_train).count(0))print("Test Data")print("Number of active molecules: ", list(y_test).count(1))print("Number of inactive molecules: ", list(y_test).count(0))
Check the number of data
Training DataNumber of active molecules: 4101Number of inactive molecules: 34282Test DataNumber of active molecules: 1386Number of inactive molecules: 11409
Separate into training and test data

Build the model
from sklearn.ensemble import RandomForestClassifiermodel = RandomForestClassifier(random_state=0)model.fit(X_train, y_train)print("Accuracy on training set: {:.3f}".format(model.score(X_train, y_train)))print("Accuracy on test set: {:.3f}".format(model.score(X_test, y_test)))
例えば… RandomForestを使ってみる
Accuracy on training set: 0.997Accuracy on test set: 0.909
他にも色々試してみよう例 K近傍法, Neural Network, etc…
特徴量の重要度を測れないか検討してみようヒント feature_importances_
記述子の意味を調べる際は、Rdkitのマニュアルを参照することhttp://www.rdkit.org/RDKit_Docs.2012_12_1.pdf