Embed Size (px)
Citation preview

2011 PennsylvaniaYouth Survey Report
New Hope-Solebury School District
Conducted byPennsylvania Commission on Crime and Delinquency


New Hope-Solebury School District Report 2011 Pennsylvania Youth Survey
Table of ContentsSection 1: The Survey ....................................................................................................................1
Introduction......................................................................................................................... 1Summary of Results ............................................................................................................ 2Exploring PAYS Results Online via SmartTrackTM ............................................................ 3Survey Methodology ......................................................................................................... 3Demographic Profile of Surveyed Youth........................................................................ 6
Section 2: School Climate and Safety .........................................................................................9Introduction......................................................................................................................... 9Bullying at School and Internet Safety............................................................................ 9Violence and Drugs on School Property ...................................................................... 11Gang Involvement........................................................................................................... 11Other Antisocial Behaviors.............................................................................................. 12
Section 3: Alcohol, Tobacco and Other Drug Use ...................................................................15Measurement ................................................................................................................... 15Results Summary............................................................................................................... 15Item-Level Results ............................................................................................................. 20Prescription Drugs............................................................................................................. 28Risk of Harm....................................................................................................................... 31Disapproval of Drug Use ................................................................................................. 32Social Norms about ATOD Use....................................................................................... 33Parental Disapproval of Drug Use ................................................................................. 34Frequency of Drug Use.................................................................................................... 35
Section 4: Special Topics ............................................................................................................39Introduction....................................................................................................................... 39Age of Onset of ATOD Use and Other Antisocial Behavior....................................... 39Driving after Alcohol or Marijuana Use......................................................................... 40Willingness to Try or Use ATODs ...................................................................................... 41Gambling .......................................................................................................................... 42Symptoms of Depression................................................................................................. 42
Section 5: Risk and Protective Factors.......................................................................................45Introduction....................................................................................................................... 45Results Summary............................................................................................................... 47Protective Factors ............................................................................................................ 52Risk Factors ........................................................................................................................ 56
Appendix A: Risk and Protective Factor Scale Construction Summary.................................69Appendix B: List of Tables and Graphs......................................................................................83Appendix C: Other Resources ...................................................................................................87

New Hope-Solebury School District Report 2011 Pennsylvania Youth Survey
Web Sites .......................................................................................................................... 87Prevention Program Guides........................................................................................... 87Prevention Planning ........................................................................................................ 87
References .................................................................................................................................. 89

New Hope-Solebury School District Report 2011 Pennsylvania Youth Survey- 1 -
Section 1: The Survey
IntroductionSince 1989, the Commonwealth of Pennsylvania has conducted a survey of secondary school students ontheir behavior, attitudes and knowledge concerning alcohol, tobacco, other drugs and violence. ThePennsylvania Youth Survey (PAYS) of 6th, 8th, 10th and 12th grade public school students is conducted everytwo years. The findings from the PAYS build upon the data gathered during the five previous waves of thesurvey in 2001, 2003, 2005, 2007 and 2009, as well as the Generation at Risk survey, a biennial study ofdrug use prevalence rates that was conducted from 1989 through 1997.
This survey was sponsored by the Pennsylvania Commission on Crime and Delinquency (PCCD). ThePCCD contracted with SmartTrack, Inc., to conduct the survey, which was administered in fall of 2011.This report was prepared by Rothenbach Research and Consulting, LLC.
The data gathered in the PAYS serve two primary needs. First, the survey results provide an importantbenchmark for alcohol, tobacco, and other drug (ATOD) use and delinquent behavior among youngPennsylvanians, and help indicate whether prevention and treatment programs are achieving their intendedresults. Second, the survey assesses risk factors that are related to these behaviors and the protectivefactors that guard against them. This information allows community leaders and school administrators todirect prevention resources to areas where they are likely to have the greatest impact.
The Communities That Care Youth Survey (CTCYS) was adopted as the basis for the PAYS. Based on thework of Dr. J. David Hawkins and Dr. Richard F. Catalano, the CTCYS is designed to identify the levels ofrisk factors related to problem behaviors such as ATOD use—and to identify the levels of protectivefactors that help guard against those behaviors. In addition to measuring risk and protective factors, theCTCYS also measures the actual prevalence of drug use, violence and other antisocial behaviors amongsurveyed students. Three articles (Pollard, Hawkins & Arthur, 1999; Arthur, Hawkins, Pollard, Catalano &Baglioni, 2002; Glaser, Van Horn, Arthur, Hawkins & Catalano, 2005) describe the CTCYS, its uses andits ongoing development.
By administering the PAYS, New Hope-Solebury School District has assessed the risk and protectivefactors its young people face. This report identifies the risk and protective factors most in need of attention
Section 1The Survey

New Hope-Solebury School District Report 2011 Pennsylvania Youth Survey- 2 -
in the community. This information can be used to guide prevention efforts, to help address existingproblems, and to promote healthy and positive youth development.
Of course, the survey would not have been possible without the support and cooperation of schoolsuperintendents, parents and students throughout the Commonwealth. The PCCD would like to take thisopportunity to thank these individuals for supporting this valuable and worthwhile endeavor.
All together, 289 students in grades 8, 10 and 12 participated in the survey.
Summary of ResultsThis report presents findings on a number of topics, including ATOD use and risk and protective factors.A brief summary of the findings from each of these sections is presented here. A more detailed summary ispresented at the start of each section, followed by an item-by-item discussion of the results.
Alcohol, Tobacco and Other Drug UseNew Hope-Solebury School District students recorded the highest lifetime prevalence-of-use rates foralcohol (57.1%), marijuana (33.8%), cigarettes (28.4%) and smokeless tobacco (16.8%). Other lifetimeprevalence rates ranged from 0.7% for heroin and methamphetamine to 5.1% for hallucinogens. There wasno reported lifetime crack cocaine or steroid use. The rate of illicit drug use excluding marijuana issummarized by the indicator “any illicit drug (other than marijuana),” with 9.8% of surveyed studentsreporting use of these drugs in their lifetimes. New Hope-Solebury School District students reported thehighest past-30-day prevalence-of-use rates for alcohol (38.8%), marijuana (14.7%) and cigarettes (6.6%).Other past-30-day prevalence rates ranged from 0.4% for heroin and methamphetamine to 4.4% forEcstasy. There was no reported past-30-day crack cocaine or steroid use. Overall, 8.3% of New Hope-Solebury School District students reported the use of any illicit drug (other than marijuana) in the past 30days.
National data from the Monitoring the Future survey provide a valuable reference point for evaluating theseverity of drug use behavior. Compared to their national counterparts, New Hope-Solebury SchoolDistrict students reported lower average levels of lifetime inhalant and cigarette use. For past-30-dayATOD use, students reported higher average levels of alcohol and Ecstasy use and binge drinking thantheir national counterparts and lower average levels of cigarette and smokeless tobacco use.
Risk and Protective Factor ProfileFor the overall sample of 8th, 10th and 12th graders in New Hope-Solebury School District, percentilescores across the six protective factor scales range from a low of 35 to a high of 71, with an average scoreof 57, which is seven points higher than the normative average of 50. The two lowest overall scores werefor the following protective factor scales: Religiosity (35) and Community Opportunities for ProsocialInvolvement (49). New Hope-Solebury School District students reported the two highest overall scores forthe following protective factor scales: School Rewards for Prosocial Involvement (71) and SchoolOpportunities for Prosocial Involvement (64).
Overall percentile scores across the 18 risk factor scales range from a low of 27 to a high of 57, with anaverage score of 45, which is five points lower than the normative average of 50. New Hope-SoleburySchool District students reported the two highest overall scores for the following risk factor scales:Parental Attitudes Favorable toward Antisocial Behavior (57) and Parental Attitudes Favorable towardATOD Use (56). The two lowest overall scores were for the following risk factor scales: Poor AcademicPerformance (28) and Early Initiation of Drug Use (27).
While policies that target any risk or protective factor could potentially be an important resource forstudents in New Hope-Solebury School District, focusing prevention planning in high risk and low

New Hope-Solebury School District Report 2011 Pennsylvania Youth Survey- 3 -
protection areas could be especially beneficial. Similarly, factors with low risk or high protection representstrengths that New Hope-Solebury School District can build on. These objective data, in conjunction witha review of community-specific issues and resources, can help direct prevention efforts for New Hope-Solebury School District. It is important to keep in mind, however, that overall scores can mask problemswithin individual grades. Section 5 of this report provides grade-level results that will enable preventionplanners to more precisely target opportunities for intervention.
Exploring PAYS Results Online via SmartTrackTM
This report includes a detailed review of findings from each content area of the PAYS questionnaire. Somecounties and schools, however, may wish to go beyond these key metrics. In order to facilitate thisprocess, all 2011 survey participants will have the ability to review their results using the SmartTrackTM
online data browsing system.
SmartTrack’s internet-based reporting tools allow for instant presentation of various reports, ranging fromfrequency distributions to crosstabulations. Data can be viewed in both table and graph formats (viaExcel), and users can review results for any appropriate aggregation or subsample.
Here is an example of an Excel chart generated using SmartTrack. In this report, an educator is examiningstudent perception of the risk associated with smoking cigarettes.
How much do you think people risk harming themselves (physically or in other ways) if they:
No risk Slight risk Moderate risk Great risk Skips Totals
Smoke one or more packs ofcigarettes per day?
07.22% 05.60% 27.15% 59.23% 0.80% 100%
SmartTrack online access will be available to authorized users beginning in late January and will continuethrough the end of the 2012-2013 school year. For more information on accessing your results, or anyother questions about SmartTrack, you can visit the website at www.thesmarttrack.com, [email protected], or call (866) 714-8080.
Survey MethodologyThe CTCYS was developed to provide scientifically sound information to communities. It measures avariety of risk and protective factors by using groups of survey items, which are called scales. Please notethat some of the risk factors are measured with more than one scale.
The CTCYS was developed from research funded by the Center for Substance Abuse Prevention of theU.S. Department of Health and Human Services. This research supported the development of a studentsurvey to measure the following items:
■ risk and protective factors that predict alcohol, tobacco and other drug (ATOD) use, delinquencyand other problem behaviors in adolescents.
■ the prevalence and frequency of drug use.
■ the prevalence and frequency of antisocial behaviors.
This survey instrument became the CTCYS. The original research involved data collection in five states:Kansas, Maine, Oregon, South Carolina and Washington. Over 72,000 students participated in thesestatewide surveys, and analysis of the collected data contributed to the development of the CTCYS.

New Hope-Solebury School District Report 2011 Pennsylvania Youth Survey- 4 -
The PAYS QuestionnaireParticipating school districts are offered two versions of the PAYS questionnaire. The standard versionincludes the full set of survey items for school climate and safety, ATOD use, and risk and protectivefactors. The alternative version omits the items used to calculate the family domain risk and protectivefactors.
The 2011 PAYS questionnaires are identical to the ones used in 2009. Please note, however, that thefollowing questionnaire changes were introduced in the 2009 survey cycle:
■ Items from the 2007 questionnaire assessing the abuse of prescription drugs were replaced withsix new questions designed to measure prevalence-of-use rates across the three prescription drugcategories: pain relievers, stimulants and tranquilizers.
■ The risk factor scale Laws and Norms Favorable to Handguns was dropped from thequestionnaire. All other risk and protective factor scales from the 2007 questionnaire wereretained in full.
■ The 2009 questionnaire included six items addressing student experiences with gambling. Two ofthe six gambling questions—the past-12-months and past-30-days gambling for “money oranything of value” items—are identical to questions used on the 2005 and 2007 surveys. Thesports betting, lottery ticket, and table gaming questions are similar to questions used in the 2007survey.
■ Starting in 2009, the PAYS asked students a series of eight questions about bullying at school andinternet safety.
■ The ordering of items throughout the 2009 questionnaire was changed so that data points mostcritical to the prevention planning process would be collected in first sections of the survey. Thischange improves the response rate for these key items.
■ For some survey items, the layout of the question and response options was changed in order toimprove readability.
AdministrationThe survey was administered in the classroom and required approximately one class period to complete.Each teacher received an appropriate number of surveys and survey collection envelopes. The teachersreviewed the instructions with their students and asked the students to complete the survey. Theinstructions informed the students that there were no right or wrong answers. The instructions alsoexplained the proper way to mark the answers. In some schools, some or all of the student respondentscompleted the survey in a computer lab using an internet-based survey administration system. Thecontractor, SmartTrack, Inc., managed the internet administration. Please see the statewide 2011 PAYSreport for more information on this system.
Students were asked to complete the survey but were also told that participation is voluntary. Furthermore,students were told that they could skip any question that they were not comfortable answering. Both theteacher and the written instructions on the front of the survey form assured students that the survey wasanonymous and confidential.
Survey ValidationFour strategies were used to assess the validity of the surveys. The first two strategies eliminated thesurveys of students who appeared to exaggerate their drug use and other antisocial behavior. The third

New Hope-Solebury School District Report 2011 Pennsylvania Youth Survey- 5 -
strategy eliminated students who reported use of a fictitious drug. The fourth strategy eliminated thesurveys of students who repeatedly reported logically inconsistent patterns of drug use.
■ In the first strategy, surveys from students who reported an average of four or more daily uses ofthe following drugs—inhalants, cocaine, hallucinogens, Ecstasy, methamphetamine and heroin—were eliminated from the survey data set. This strategy removes from the analysis any student whodid not take it seriously.
■ The second strategy supplements the drug use exaggeration test by examining the frequency offour other antisocial behaviors: Attacking Someone with Intent to Harm, Attempting to Steal aVehicle, Being Arrested, and Getting Suspended. Respondents who reported an unrealistically highfrequency of these behaviors—more than 80 instances within the past year—were removed fromthe analysis.
■ In the third strategy, students were asked if they had used a fictitious drug in the past 30 days or intheir lifetimes. If students reported any use of the fictitious drug, their surveys were not includedin the analysis of the findings.
■ The fourth strategy was used to detect logical inconsistencies among responses to the drug-relatedquestions. Students were identified as inconsistent responders in the following circumstances only:(1) if they were inconsistent on two or more of the following drugs: alcohol, cigarettes, smokelesstobacco and marijuana/hashish; or (2) if they were inconsistent on two or more of the remainingdrugs. An example of an inconsistent response would be if a student reported that he or she hadused alcohol three to five times in the past 30 days but had never used alcohol in his or herlifetime.
New Hope-Solebury School District students were cooperative—all but nine students (3.0%) completedvalid surveys. Of the nine surveys identified and eliminated by one or more of the four strategies describedabove, four exaggerated drug use (strategy 1), two exaggerated other antisocial behavior (strategy 2), sixreported the use of the fictitious drug (strategy 3) and six responded in a logically inconsistent way(strategy 4). The elimination total produced by these four strategies equals more than nine because somesurveys were identified by more than one strategy.
New Hope-Solebury School District Report 2011 Pennsylvania Youth Survey- 6 -
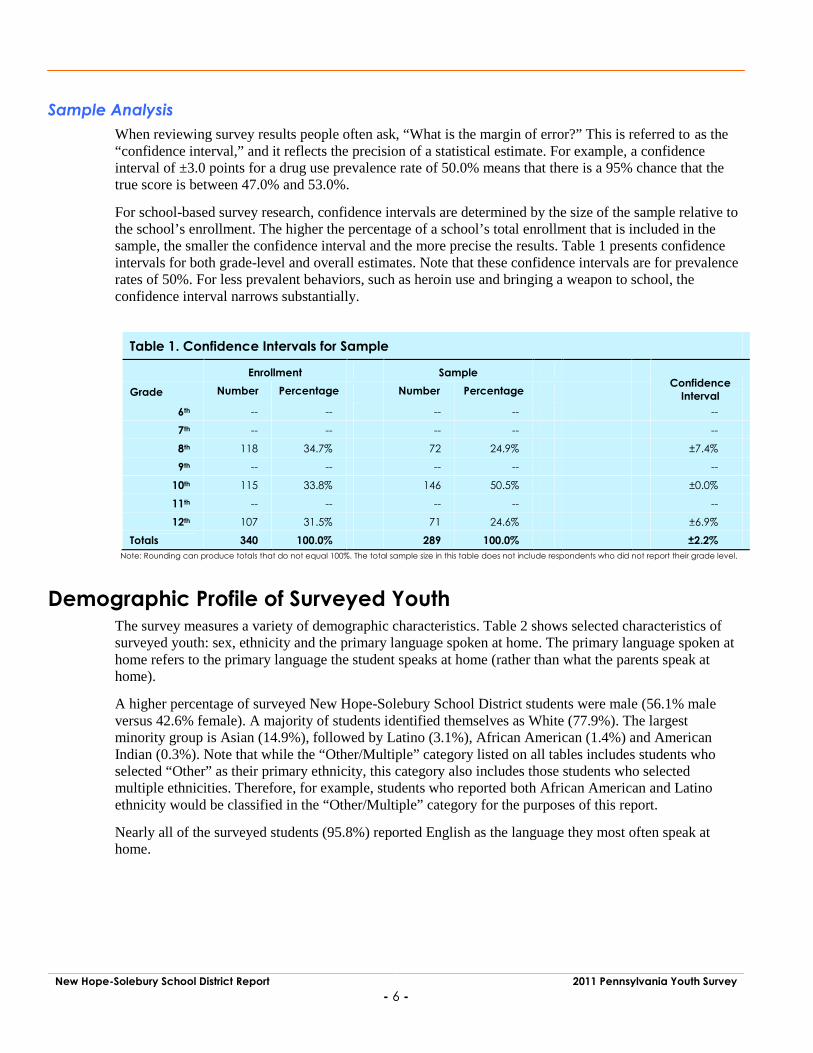
Sample AnalysisWhen reviewing survey results people often ask, “What is the margin of error?” This is referred to as the“confidence interval,” and it reflects the precision of a statistical estimate. For example, a confidenceinterval of ±3.0 points for a drug use prevalence rate of 50.0% means that there is a 95% chance that thetrue score is between 47.0% and 53.0%.
For school-based survey research, confidence intervals are determined by the size of the sample relative tothe school’s enrollment. The higher the percentage of a school’s total enrollment that is included in thesample, the smaller the confidence interval and the more precise the results. Table 1 presents confidenceintervals for both grade-level and overall estimates. Note that these confidence intervals are for prevalencerates of 50%. For less prevalent behaviors, such as heroin use and bringing a weapon to school, theconfidence interval narrows substantially.
Table 1. Confidence Intervals for Sample
Enrollment SampleConfidence
IntervalGrade Number Percentage Number Percentage
6th -- -- -- -- --
7th -- -- -- -- --
8th 118 34.7% 72 24.9% ±7.4%
9th -- -- -- -- --
10th 115 33.8% 146 50.5% ±0.0%
11th -- -- -- -- --
12th 107 31.5% 71 24.6% ±6.9%
Totals 340 100.0% 289 100.0% ±2.2%Note: Rounding can produce totals that do not equal 100%. The total sample size in this table does not include respondents who did not report their grade level.
Demographic Profile of Surveyed YouthThe survey measures a variety of demographic characteristics. Table 2 shows selected characteristics ofsurveyed youth: sex, ethnicity and the primary language spoken at home. The primary language spoken athome refers to the primary language the student speaks at home (rather than what the parents speak athome).
A higher percentage of surveyed New Hope-Solebury School District students were male (56.1% maleversus 42.6% female). A majority of students identified themselves as White (77.9%). The largestminority group is Asian (14.9%), followed by Latino (3.1%), African American (1.4%) and AmericanIndian (0.3%). Note that while the “Other/Multiple” category listed on all tables includes students whoselected “Other” as their primary ethnicity, this category also includes those students who selectedmultiple ethnicities. Therefore, for example, students who reported both African American and Latinoethnicity would be classified in the “Other/Multiple” category for the purposes of this report.
Nearly all of the surveyed students (95.8%) reported English as the language they most often speak athome.

New Hope-Solebury School District Report 2011 Pennsylvania Youth Survey- 7 -
Table 2. Demographic Characteristics of Surveyed YouthNumber of Students Percentage of Students
Overall Valid Surveys 289 100.0%Sex
Male 162 56.1%Female 123 42.6%Did not respond 4 1.4%
EthnicityWhite 225 77.9%Black or African American 4 1.4%Spanish/Hispanic/Latino 9 3.1%American Indian/Native American, Eskimo or Aleut 1 0.3%Asian or Pacific Islander 43 14.9%Other/Multiple 5 1.7%Did not respond 2 0.7%
Primary Language Spoken at HomeEnglish 277 95.8%Spanish 3 1.0%Other Language 7 2.4%Did not respond 2 0.7%
Note: Rounding can produce totals that do not equal 100%.


New Hope-Solebury School District Report 2011 Pennsylvania Youth Survey- 9 -
Section 2: School Climate and Safety
IntroductionOver the last 15 years, many youth survey programs, including PAYS, have moved to incorporate risk andprotective factor data alongside more traditional health behavior assessments. As this approach hasevolved, school climate and safety have emerged as focal points for prevention programming and policyplanning.
Over the last several survey cycles, PAYS has responded to this shift by adding a number of new items. Inprevious years, response data from these climate and safety questions were presented in the OtherAntisocial Behavior, Special Topics, and Additional Prevention Planning Data sections of PAYS countyand district reports. To better meet the needs of PAYS data users, this year’s report has been reorganized,with key school climate and safety data being aggregated in this new section.
Bullying at School and Internet SafetyWhile bullying is not a new phenomenon, the growing awareness that bullying has serious consequencesfor both schools and students is new. Bullying behavior contributes to lower attendance rates, lowerstudent achievement, low self-esteem and depression, as well as higher rates of both juvenile and adultcrime (Banks, 1997). While the problem of bullying is receiving increased public attention, actualincidences of bullying often go undetected by both teachers and parents (Skiba and Fontanini, 2000).Adults often fail to both identify bullying incidences and understand the dynamics of the behavior.Without adequate training adults may actually endorse the bullying behavior, either by sending childrenthe message that bullying is “part of growing up” or by simply ignoring the behavior (U.S. Department ofEducation, 1998).
The most effective means of addressing bullying is through comprehensive, school-wide programs (Atlasand Pepler, 1998; Garrity et al., 1997; Skiba and Fontanini, 2000). A student survey is one of the mostcommon methods for identifying a potential bullying problem in a school (Leff, Power, and Goldstein,2004). Starting in 2009, the PAYS asked students a series of eight questions about bullying at school andinternet safety. These include past-12-month prevalence measures for: (1) being “hit, kicked, pushed,shoved around, or locked indoors,” (2) being “called names, made fun of, or teased in a hurtful way,” (3)being “left out of things on purpose by other students,” (4) other students telling lies or spreading false
Section 2School Climate and Safety

New Hope-Solebury School District Report 2011 Pennsylvania Youth Survey- 10 -
rumors, (5) other students taking money or damaging your things, (6) other students threatening or forcing“you to do things you do not want to do,” (7) other students using “the internet or a cell phone to threatenor embarrass you,” and (8) someone on the internet trying “to get you to talk online about sex, look atsexual pictures, or do something else sexual when you did not want to.”
Results for New Hope-Solebury School District students are presented in Table 3, and comparison datafrom the statewide survey are presented in Table 4. (Please note that throughout this report tables thatinclude statewide results are shaded orange, while tables that include county or district results are shadedblue.) As they are throughout the majority of this report, survey results for this topic are presented asprevalence rates. Each data point shows the percentage of students who reported being bullied or sexuallyharassed on one or more occasions within the past year.
Table 3. Percentage of Youth Reporting Bullying at School or Sexual Harassment on theInternet in the Past Year, New Hope-Solebury School District 2011
Female Male 6th 7th 8th 9th 10th 11th 12th Overall% % % % % % % % % %
Been hit, kicked, pushed, or shoved around 5.0 22.6 -- -- 25.0 -- 10.3 -- 14.5 14.8Been called names, made fun of, or teased 53.7 68.1 -- -- 66.2 -- 65.1 -- 52.1 62.1Been left out of things on purpose 52.1 58.8 -- -- 67.6 -- 56.8 -- 43.7 56.1Other students telling lies or spreading falserumors 66.9 49.7 -- -- 77.4 -- 47.3 -- 57.7 56.6
Other students taking money or damaging yourthings 28.0 29.4 -- -- 47.6 -- 18.5 -- 32.4 28.6
Other students threatening or forcing you to dothings 10.2 13.1 -- -- 19.0 -- 4.8 -- 21.1 12.1
Other students using the internet or a cell phoneto threaten or embarrass you 16.1 11.9 -- -- 22.2 -- 8.2 -- 16.9 13.6
Sexual harassment on the internet 13.6 6.3 -- -- 19.0 -- 1.4 -- 16.9 9.3Note: The symbol “--” indicates that data are not available because students were not surveyed.
Table 4. Percentage of Youth Reporting Bullying at School or Sexual Harassment on theInternet in the Past Year, Pennsylvania Statewide 2011
Female Male 6th 7th 8th 9th 10th 11th 12th Overall% % % % % % % % % %
Been hit, kicked, pushed, or shoved around 12.5 19.5 20.0 -- 21.5 -- 13.2 -- 9.4 15.9Been called names, made fun of, or teased 43.7 39.8 39.1 -- 48.4 -- 43.2 -- 35.9 41.7Been left out of things on purpose 38.2 27.7 30.4 -- 36.2 -- 33.4 -- 31.5 32.9Other students telling lies or spreading falserumors 54.6 45.8 45.3 -- 55.7 -- 50.9 -- 48.8 50.3
Other students taking money or damaging yourthings 18.7 20.9 16.3 -- 23.6 -- 20.3 -- 18.6 19.8
Other students threatening or forcing you to dothings 11.4 11.9 11.4 -- 15.0 -- 11.5 -- 8.9 11.7
Other students using the internet or a cell phoneto threaten or embarrass you 15.6 8.6 7.3 -- 14.7 -- 13.3 -- 13.0 12.1
Sexual harassment on the internet 15.5 9.0 6.1 -- 13.9 -- 15.0 -- 13.4 12.3Note: The symbol “--” indicates that data are not available because students were not surveyed.

New Hope-Solebury School District Report 2011 Pennsylvania Youth Survey- 11 -
Violence and Drugs on School PropertyPennsylvania students were also surveyed regarding the frequency with which they have been threatenedor attacked on school property within the past year, and whether they were offered, given, or sold illegaldrugs on school property within the past year. Results for New Hope-Solebury School District students arepresented in Table 5, and comparison data from the statewide survey are presented in Table 6.
Table 5. Percentage of Youth Reporting Violence or Drugs on School Property in the Past Year,New Hope-Solebury School District 2011
6th 7th 8th 9th 10th 11th 12th Overall% % % % % % % %
Threatened to be hit or beaten up -- -- 18.9 -- 8.9 -- 8.5 10.7Attacked or beaten up -- -- 5.7 -- 4.1 -- 2.8 4.1Threatened with a weapon -- -- 1.9 -- 1.4 -- 2.8 1.9Attacked with a weapon -- -- 1.9 -- 0.0 -- 0.0 0.4Been offered, given, or sold an illegaldrug -- -- 10.9 -- 12.3 -- 16.9 13.2
Note: The symbol “--” indicates that data are not available because students were not surveyed.
Table 6. Percentage of Youth Reporting Violence or Drugs on School Property in the Past Year,Pennsylvania Statewide 2011
6th 7th 8th 9th 10th 11th 12th Overall% % % % % % % %
Threatened to be hit or beaten up 16.0 -- 21.6 -- 17.5 -- 12.9 17.0Attacked or beaten up 8.2 -- 8.3 -- 6.4 -- 4.6 6.8Threatened with a weapon 2.6 -- 2.9 -- 2.9 -- 1.9 2.6Attacked with a weapon 1.0 -- 0.9 -- 1.0 -- 0.9 0.9Been offered, given, or sold an illegaldrug 1.5 -- 7.2 -- 15.0 -- 18.3 10.8
Note: The symbol “--” indicates that data are not available because students were not surveyed.
Gang InvolvementGangs have long been associated with crime, violence and other antisocial behaviors. Evidence suggeststhat gangs contribute to antisocial behavior beyond simple association with delinquent peers. Table 7presents the percentage of surveyed youth indicating gang involvement. Comparison data from thestatewide survey are presented in Table 8.
Table 7. Percentage of Youth Who Indicated Gang Involvement, New Hope-Solebury SchoolDistrict 2011
6th 7th 8th 9th 10th 11th 12th Overall% % % % % % % %
Ever Belonged to a Gang -- -- 4.8 -- 0.7 -- 2.8 2.1Belonged to a Gang with a Name -- -- 4.8 -- 0.7 -- 2.8 2.1
Note: The symbol “--” indicates that data are not available because students were not surveyed.

New Hope-Solebury School District Report 2011 Pennsylvania Youth Survey- 12 -
Table 8. Percentage of Youth Who Indicated Gang Involvement, Pennsylvania Statewide 20116th 7th 8th 9th 10th 11th 12th Overall% % % % % % % %
Ever Belonged to a Gang 3.8 -- 5.2 -- 4.7 -- 4.0 4.4Belonged to a Gang with a Name 2.9 -- 4.5 -- 4.6 -- 4.0 4.0
Note: The symbol “--” indicates that data are not available because students were not surveyed.
Other Antisocial BehaviorsThe PAYS measures a series of seven other problem, or antisocial, behaviors—that is, behaviors that runcounter to established norms of good behavior. For the first six other antisocial behaviors, prevalence ratesare presented for the incidence of behavior over the past 12 months. For Bringing a Weapon (Such as aGun, Knife or Club) to School, prevalence rates are reported for the past 30 days. Results for New Hope-Solebury School District students are presented in Table 9, and comparison data from the statewide surveyare presented in Table 10.
Table 9. Prevalence of Other Antisocial Behaviors, New Hope-Solebury School District 20116th 7th 8th 9th 10th 11th 12th Overall% % % % % % % %
Attacking Someone with Intent to Harm -- -- 5.9 -- 4.8 -- 7.0 5.6Attempting to Steal a Vehicle -- -- 1.8 -- 0.0 -- 0.0 0.4Being Arrested -- -- 0.0 -- 1.4 -- 5.6 2.2Being Drunk or High at School -- -- 0.0 -- 24.0 -- 18.3 16.8Getting Suspended -- -- 9.8 -- 0.7 -- 4.2 3.4Selling Drugs -- -- 0.0 -- 2.7 -- 5.6 2.9Bringing a Weapon to School -- -- 0.0 -- 1.4 -- 1.4 1.1Average -- -- 2.5 -- 5.0 -- 6.0 4.6
Note: The symbol “--” indicates that data are not available because students were not surveyed.
Table 10. Prevalence of Other Antisocial Behaviors, Pennsylvania Statewide 20116th 7th 8th 9th 10th 11th 12th Overall% % % % % % % %
Attacking Someone with Intent to Harm 5.2 -- 8.8 -- 9.2 -- 8.6 8.0Attempting to Steal a Vehicle 0.3 -- 1.2 -- 1.7 -- 1.8 1.3Being Arrested 1.0 -- 3.0 -- 4.3 -- 4.8 3.4Being Drunk or High at School 1.0 -- 4.7 -- 11.5 -- 15.9 8.5Getting Suspended 5.1 -- 7.5 -- 7.9 -- 8.0 7.2Selling Drugs 0.3 -- 1.7 -- 6.1 -- 9.8 4.6Bringing a Weapon to School 1.0 -- 1.8 -- 2.1 -- 2.7 1.9Average 2.0 -- 4.1 -- 6.1 -- 7.4 5.0
Note: The symbol “--” indicates that data are not available because students were not surveyed.

New Hope-Solebury School District Report 2011 Pennsylvania Youth Survey- 13 -
Frequency of Bringing a Weapon to SchoolMore detailed survey results for of bringing a weapon (such as a gun, knife or club) to school arepresented in Tables 11 and 12. These tables show the percentage of students who reported bringing aweapon to school on a specific number of occasions in the past 30 days.
Table 11. Past-30-Day Frequency of Bringing a Weapon to School, New Hope-Solebury SchoolDistrict 2011
6th 7th 8th 9th 10th 11th 12th Overall% % % % % % % %
Never -- -- 100.0 -- 98.6 -- 98.6 98.91 or 2 times -- -- 0.0 -- 0.7 -- 1.4 0.73 to 5 times -- -- 0.0 -- 0.7 -- 0.0 0.46 to 9 times -- -- 0.0 -- 0.0 -- 0.0 0.010 to 19 times -- -- 0.0 -- 0.0 -- 0.0 0.020 to 29 times -- -- 0.0 -- 0.0 -- 0.0 0.030 to 39 times -- -- 0.0 -- 0.0 -- 0.0 0.040+ times -- -- 0.0 -- 0.0 -- 0.0 0.0
Note: Rounding can produce totals that do not equal 100%. The symbol “--” indicates that data are not available because students were not surveyed.
Table 12. Past-30-Day Frequency of Bringing a Weapon to School, Pennsylvania Statewide2011
6th 7th 8th 9th 10th 11th 12th Overall% % % % % % % %
Never 99.0 -- 98.2 -- 97.9 -- 97.3 98.11 or 2 times 0.8 -- 1.3 -- 1.4 -- 1.3 1.23 to 5 times 0.1 -- 0.1 -- 0.1 -- 0.4 0.26 to 9 times 0.0 -- 0.1 -- 0.1 -- 0.2 0.110 to 19 times 0.0 -- 0.0 -- 0.1 -- 0.1 0.120 to 29 times 0.0 -- 0.0 -- 0.0 -- 0.1 0.130 to 39 times 0.0 -- 0.1 -- 0.0 -- 0.2 0.140+ times 0.1 -- 0.2 -- 0.3 -- 0.4 0.2
Note: Rounding can produce totals that do not equal 100%. The symbol “--” indicates that data are not available because students were not surveyed.


New Hope-Solebury School District Report 2011 Pennsylvania Youth Survey- 15 -
Section 3: Alcohol, Tobacco and Other Drug Use
MeasurementAlcohol, tobacco and other drug (ATOD) use is measured in the PAYS by a set of 36 questions. Thequestions are similar to those used in the Monitoring the Future study, a nationwide study of drug use bymiddle and high school students. Consequently, national data as well as data from other similar surveyscan be easily compared to data from the PAYS.
Prevalence-of-use tables and graphs show the percentages of students who reported using ATODs. Theseresults are presented for both lifetime and past-30-day prevalence of use periods. Lifetime prevalence ofuse (whether the student has ever used the drug) is a good measure of student experimentation. Past-30-day prevalence of use (whether the student has used the drug within the last month) is a good measure ofcurrent use. In addition to the standard lifetime and past-30-day prevalence rates for alcohol use, bingedrinking behavior (defined as a report of five or more drinks in a row within the past two weeks) is alsomeasured.
A multi-question indicator—“any illicit drug (other than marijuana)”—measures the use of one or more ofthe following drugs: inhalants, cocaine, crack cocaine, heroin, hallucinogens, methamphetamine, Ecstasyand steroids. The purpose of this drug combination rate is to provide prevention planners with an overallgauge of so-called “hard” drug use (Johnston, O’Malley, Bachman & Schulenberg, 2011a).
The survey also includes six questions designed to measure nonmedical use of prescription drugs. Thequestions cover three general categories of nonmedical prescription drug use: pain relievers, tranquilizersand stimulants.
Results SummaryOverall Results
ATOD prevalence rates for the combined sample of 8th, 10th and 12th graders are presented in Graph 1, andin the overall results column of Tables 13 and 14. As these results show, New Hope-Solebury SchoolDistrict students recorded the highest lifetime prevalence-of-use rates for alcohol (57.1%), marijuana(33.8%), cigarettes (28.4%) and smokeless tobacco (16.8%). Other lifetime prevalence rates ranged from0.7% for heroin and methamphetamine to 5.1% for hallucinogens. There was no reported lifetime crack
Section 3Alcohol, Tobacco and OtherDrug Use

New Hope-Solebury School District Report 2011 Pennsylvania Youth Survey- 16 -
cocaine or steroid use. The rate of illicit drug use excluding marijuana is summarized by the indicator “anyillicit drug (other than marijuana),” with 9.8% of surveyed students reporting use of these drugs in theirlifetimes.
New Hope-Solebury School District students reported the highest past-30-day prevalence-of-use rates foralcohol (38.8%), marijuana (14.7%) and cigarettes (6.6%). Other past-30-day prevalence rates ranged from0.4% for heroin and methamphetamine to 4.4% for Ecstasy. There was no reported past-30-day crackcocaine or steroid use. Overall, 8.3% of New Hope-Solebury School District students reported the use ofany illicit drug (other than marijuana) in the past 30 days.
Graph 1. Overall Lifetime and Past-30-Day Prevalence of Alcohol, Tobacco and OtherDrug Use1

New Hope-Solebury School District Report 2011 Pennsylvania Youth Survey- 17 -
Grade-Level ResultsATOD prevalence rates for individualgrade levels are presented in Graph 2 andTables 13 and 14. Typically, prevalencerates for the use of most substancesincrease as students enter higher grades. Inmany communities, however, inhalant useprovides an exception to this pattern, oftenpeaking during the late middle school orearly high school years. This may bebecause inhalants are relatively easy foryounger students to obtain. Past-30-dayalcohol use in New Hope-Solebury SchoolDistrict ranges from a low of 7.2% among8th graders to a high of 57.7% among 12th
graders. Past-30-day marijuana use rangesfrom a low of 2.9% among 8th graders to ahigh of 32.4% among 12th graders. Past-30-day cigarette use ranges from a low of0.0% among 8th graders to a high of 15.5% among 12th graders. Past-30-day inhalant use ranges from alow of 2.1% among 10th graders to a high of 5.6% among 12th graders.
Comparisons to National ResultsComparing and contrasting findings from a county- or school-district-level survey to relevant data from anational survey provides a valuable perspective on local data. In this report, national comparisons forATOD use will be made to the 2011 Monitoring the Future study. The Monitoring the Future surveyproject, which provides prevalence-of-use information for ATODs from a nationally representative sampleof 8th, 10th and 12th graders, is conducted annually by the Survey Research Center of the Institute for SocialResearch at the University of Michigan (see www.monitoringthefuture.org). For a review of themethodology of this study, please see Johnston et al. (2011a).
In addition to a complete report of prevalence-of-use rates for each surveyed grade, Tables 13 and 14present national results from the Monitoring the Future study. Across the three comparison grades (8th,10th and 12th), students in New Hope-Solebury School District reported lower average levels of lifetimeinhalant and cigarette use than their national counterparts. The largest grade-level differences in lifetimesubstance use were for smokeless tobacco in the 10th grade (26.0% versus 15.6% for Monitoring theFuture), marijuana in the 8th grade (5.2% versus 16.4% for Monitoring the Future) and cigarettes in the 8th
grade (4.4% versus 18.4% for Monitoring the Future).
For past-30-day ATOD use, students in New Hope-Solebury School District reported higher averagelevels of alcohol and Ecstasy use and binge drinking than their national counterparts and lower averagelevels of cigarette and smokeless tobacco use. The largest grade-level differences in past-30-day substanceuse were for binge drinking in the 12th grade (40.8% versus 21.6% for Monitoring the Future) and alcoholin the 10th and 12th grades (44.5% and 57.7% versus 27.2% and 40.0% for Monitoring the Future).
Graph 2. Past-30-Day Use of Selected ATODs

New Hope-Solebury School District Report 2011 Pennsylvania Youth Survey- 18 -
Table 13. Lifetime Use of Alcohol, Tobacco and Other Drugs
New Hope-Solebury School District 2011 Monitoring theFuture1
6th 7th 8th 9th 10th 11th 12th Overall 8th 10th 12th
% % % % % % % % % % %Alcohol -- -- 29.3 -- 61.0 -- 71.8 57.1 33.1 56.0 70.0
Cigarettes -- -- 4.4 -- 37.0 -- 33.8 28.4 18.4 30.4 40.0
Smokeless Tobacco -- -- 0.0 -- 26.0 -- 14.1 16.8 9.7 15.6 16.9
Marijuana -- -- 5.2 -- 38.4 -- 47.9 33.8 16.4 34.5 45.5
Inhalants -- -- 5.2 -- 2.1 -- 5.6 3.6 13.1 10.1 8.1
Cocaine -- -- 0.0 -- 0.7 -- 5.6 1.8 2.2 3.3 5.2
Crack Cocaine -- -- 0.0 -- 0.0 -- 0.0 0.0 1.5 1.6 1.9
Heroin -- -- 0.0 -- 0.0 -- 2.8 0.7 1.2 1.2 1.4
Hallucinogens -- -- 0.0 -- 5.5 -- 8.5 5.1 3.3 6.0 8.3
Methamphetamine -- -- 0.0 -- 0.0 -- 2.8 0.7 1.3 2.1 2.1
Ecstasy -- -- 0.0 -- 4.8 -- 7.0 4.4 2.6 6.6 8.0
Steroids -- -- 0.0 -- 0.0 -- 0.0 0.0 1.2 1.4 1.8Any Illicit Drug (Otherthan Marijuana) -- -- 5.1 -- 8.2 -- 16.9 9.8 -- -- --
Note: The symbol “--” indicates that data are not available because students were not surveyed, the drug was not included in the survey, or a comparableaggregate calculation was not available. Monitoring the Future data are only available for 8th, 10th and 12th graders.
1 Johnston et al. (2011b).
Table 14. Past-30-Day Use of Alcohol, Tobacco and Other Drugs
New Hope-Solebury School District 2011 Monitoring theFuture1
6th 7th 8th 9th 10th 11th 12th Overall 8th 10th 12th
% % % % % % % % % % %Alcohol -- -- 7.2 -- 44.5 -- 57.7 38.8 12.7 27.2 40.0
Binge Drinking -- -- 1.5 -- 15.8 -- 40.8 18.6 6.4 14.7 21.6
Cigarettes -- -- 0.0 -- 5.5 -- 15.5 6.6 6.1 11.8 18.7
Smokeless Tobacco -- -- 0.0 -- 5.5 -- 4.2 3.9 3.5 6.6 8.3
Marijuana -- -- 2.9 -- 11.6 -- 32.4 14.7 7.2 17.6 22.6
Inhalants -- -- 3.4 -- 2.1 -- 5.6 3.3 3.2 1.7 1.0
Cocaine -- -- 0.0 -- 0.7 -- 2.9 1.1 0.8 0.7 1.1
Crack Cocaine -- -- 0.0 -- 0.0 -- 0.0 0.0 0.5 0.4 0.5
Heroin -- -- 0.0 -- 0.0 -- 1.4 0.4 0.4 0.4 0.4
Hallucinogens -- -- 0.0 -- 4.8 -- 4.2 3.6 1.0 1.4 1.6
Methamphetamine -- -- 0.0 -- 0.0 -- 1.4 0.4 0.4 0.5 0.6
Ecstasy -- -- 1.7 -- 4.1 -- 7.0 4.4 0.6 1.6 2.3
Steroids -- -- 0.0 -- 0.0 -- 0.0 0.0 0.4 0.5 0.7Any Illicit Drug (Otherthan Marijuana) -- -- 5.1 -- 7.5 -- 12.7 8.3 -- -- --
Note: The symbol “--” indicates that data are not available because students were not surveyed, the drug was not included in the survey, or a comparableaggregate calculation was not available. Monitoring the Future data are only available for 8th, 10th and 12th graders.
1 Johnston et al. (2011b).

New Hope-Solebury School District Report 2011 Pennsylvania Youth Survey- 19 -
Comparisons to Pennsylvania Statewide ResultsAdditional context for evaluating the pattern of ATOD use reported by New Hope-Solebury SchoolDistrict students is provided by a comparison to statewide results from the 2011 PAYS. This comparison—as well as other comparisons to statewide results throughout this report—focuses on results recorded forindividual grade levels. Comparisons of overall results can be valuable as well, but consideration shouldbe given to how differences in the composition of each sample across grade levels may impact the validityof the comparison. For example, overall results from a school district that only surveyed students in grades6 and 8 are not directly comparable to overall results from a statewide survey that included students ingrades 6, 8, 10 and 12.
Lifetime and past-30-day prevalence rates for surveyed students in Pennsylvania are presented in Tables15 and 16. Across the three comparison grades (8th, 10th and 12th), students in New Hope-Solebury SchoolDistrict reported a higher average level of lifetime marijuana use than Pennsylvania statewide and loweraverage levels of lifetime inhalant and cigarette use. The largest grade-level differences in lifetimesubstance use were for smokeless tobacco in the 10th grade (26.0% versus 13.4% for Pennsylvaniastatewide), marijuana in the 10th grade (38.4% versus 24.9% for Pennsylvania statewide) and cigarettes inthe 8th grade (4.4% versus 15.6% for Pennsylvania statewide).
For past-30-day ATOD use, students in New Hope-Solebury School District reported higher averagelevels of alcohol and Ecstasy use and binge drinking than Pennsylvania statewide and lower average levelsof cigarette and smokeless tobacco use. The largest grade-level differences in past-30-day substance usewere for binge drinking in the 12th grade (40.8% versus 26.9% for Pennsylvania statewide) and alcohol inthe 10th and 12th grades (44.5% and 57.7% versus 28.9% and 44.2% for Pennsylvania statewide).
Table 15. Lifetime Use of Alcohol, Tobacco and Other Drugs, Pennsylvania Statewide 20116th 7th 8th 9th 10th 11th 12th Overall% % % % % % % %
Alcohol 14.9 -- 36.7 -- 53.2 -- 68.4 44.0
Cigarettes 4.2 -- 15.6 -- 28.5 -- 43.1 23.3
Smokeless Tobacco 1.7 -- 6.5 -- 13.4 -- 23.6 11.5
Marijuana 0.7 -- 7.9 -- 24.9 -- 40.5 19.0
Inhalants 6.6 -- 10.5 -- 8.7 -- 8.6 8.6
Cocaine 0.1 -- 0.5 -- 1.5 -- 4.0 1.6
Crack Cocaine 0.1 -- 0.5 -- 0.5 -- 1.2 0.6
Heroin 0.0 -- 0.2 -- 0.3 -- 1.0 0.4
Hallucinogens 0.1 -- 0.9 -- 3.2 -- 6.1 2.5
Methamphetamine 0.1 -- 0.3 -- 0.4 -- 1.1 0.5
Ecstasy 0.1 -- 0.7 -- 2.0 -- 5.5 2.1
Steroids 0.4 -- 0.5 -- 0.8 -- 1.4 0.8Any Illicit Drug (Otherthan Marijuana) 6.9 -- 11.3 -- 11.8 -- 15.4 11.4
Note: The symbol “--” indicates that data are not available because students were not surveyed.

New Hope-Solebury School District Report 2011 Pennsylvania Youth Survey- 20 -
Table 16. Past-30-Day Use of Alcohol, Tobacco and Other Drugs, Pennsylvania Statewide 20116th 7th 8th 9th 10th 11th 12th Overall% % % % % % % %
Alcohol 4.0 -- 14.1 -- 28.9 -- 44.2 23.3
Binge Drinking 1.5 -- 5.1 -- 15.0 -- 26.9 12.4
Cigarettes 0.7 -- 5.3 -- 11.7 -- 19.4 9.5
Smokeless Tobacco 0.5 -- 3.1 -- 7.3 -- 11.4 5.7
Marijuana 0.5 -- 4.5 -- 14.9 -- 21.9 10.7
Inhalants 4.7 -- 6.4 -- 4.0 -- 3.2 4.5
Cocaine 0.0 -- 0.4 -- 0.8 -- 1.4 0.7
Crack Cocaine 0.1 -- 0.5 -- 0.2 -- 0.5 0.3
Heroin 0.0 -- 0.1 -- 0.1 -- 0.6 0.2
Hallucinogens 0.0 -- 0.9 -- 1.7 -- 2.4 1.3
Methamphetamine 0.1 -- 0.2 -- 0.3 -- 0.5 0.3
Ecstasy 0.1 -- 0.5 -- 0.8 -- 2.4 1.0
Steroids 0.2 -- 0.6 -- 0.4 -- 0.9 0.5Any Illicit Drug (Otherthan Marijuana) 4.9 -- 7.3 -- 6.2 -- 6.8 6.3
Note: The symbol “--” indicates that data are not available because students were not surveyed.
Item-Level ResultsAlcohol
Alcohol, including beer, wine and hard liquor,is the drug used most often by adolescentstoday. Findings from the Monitoring the Futurestudy highlight the pervasiveness of alcohol inmiddle and high schools today. In comparison,cigarette use (the second most pervasivecategory of ATOD use) is only about half asprevalent as alcohol use. Given the nationalpattern, it is not surprising that alcohol is themost used drug among students in New Hope-Solebury School District.
Lifetime Use:
■ Lifetime prevalence of alcohol use ranges from a low of 29.3% for 8th graders to a high of71.8% for 12th graders. Overall, 57.1% of New Hope-Solebury School District students haveused alcohol at least once in their lifetimes.
■ Compared to national findings, 8th graders reported a lower rate of lifetime alcohol use, 10th
graders reported a higher rate and 12th graders reported a similar rate of use.
■ Compared to Pennsylvania statewide, students in New Hope-Solebury School Districtreported rates of lifetime use that were higher among 10th and 12th graders and lower among8th graders.

New Hope-Solebury School District Report 2011 Pennsylvania Youth Survey- 21 -
Past-30-Day Use:
■ Past-30-day prevalence of alcohol use ranges from a low of 7.2% for 8th graders to a high of57.7% for 12th graders. Overall, 38.8% of New Hope-Solebury School District students haveused alcohol at least once in the last 30 days.
■ Compared to national findings, 8th graders reported a lower rate of past-30-day alcohol useand 10th and 12th graders reported higher rates of use.
■ Compared to Pennsylvania statewide, students in New Hope-Solebury School Districtreported rates of past-30-day use that were higher among 10th and 12th graders and loweramong 8th graders.
Binge drinking (defined as a report of five ormore drinks in a row within the past two weeks)is extremely dangerous. Several studies haveshown that binge drinking is related to higherprobabilities of drinking and driving as well asinjury due to intoxication. As with alcohol usein general, binge drinking tends to become morepervasive as students grow older.
■ Across grades, the prevalence rate ofbinge drinking ranges from a low of1.5% for 8th graders to a high of 40.8%for 12th graders. Overall, 18.6% of New Hope-Solebury School District students havereported at least one episode of binge drinking in the past two weeks.
■ Compared to national findings, 8th graders reported a lower rate of binge drinking, 10th
graders reported a similar rate and 12th graders reported a higher rate of use.
■ Compared to Pennsylvania statewide, students in New Hope-Solebury School Districtreported rates of use that were higher among 12th graders, lower among 8th graders and similaramong 10th graders.
TobaccoThroughout the 1990s, tobacco (includingcigarettes and smokeless tobacco) was thesecond most commonly used drug amongadolescents. National smoking rates, however,have declined substantially in recent years(Johnston et al., 2011b).
Lifetime Cigarette Use:
■ Lifetime prevalence of cigarette useranges from a low of 4.4% for 8th
graders to a high of 37.0% for 10th
graders. Overall, 28.4% of New Hope-Solebury School District students have used cigarettesat least once in their lifetimes.
■ Compared to national findings, 8th and 12th graders reported lower rates of lifetime cigaretteuse and 10th graders reported a higher rate of use.

New Hope-Solebury School District Report 2011 Pennsylvania Youth Survey- 22 -
■ Compared to Pennsylvania statewide, students in New Hope-Solebury School Districtreported rates of lifetime use that were higher among 10th graders and lower among 8th and12th graders.
Past-30-Day Cigarette Use:
■ Past-30-day prevalence of cigarette use ranges from a low of 0.0% for 8th graders to a high of15.5% for 12th graders. Overall, 6.6% of New Hope-Solebury School District students haveused cigarettes at least once in the last 30 days.
■ Compared to national findings, 8th, 10th and 12th graders reported lower rates of past-30-daycigarette use.
■ Compared to Pennsylvania statewide, students in New Hope-Solebury School Districtreported rates of past-30-day use that were lower across all of the comparison grades.
Lifetime Smokeless Tobacco Use:
■ Lifetime prevalence of smokelesstobacco use ranges from a low of 0.0%for 8th graders to a high of 26.0% for10th graders. Overall, 16.8% of NewHope-Solebury School Districtstudents have used smokeless tobaccoat least once in their lifetimes.
■ Compared to national findings, 8th and12th graders reported lower rates oflifetime smokeless tobacco use and 10th graders reported a higher rate of use.
■ Compared to Pennsylvania statewide, students in New Hope-Solebury School Districtreported rates of lifetime use that were higher among 10th graders and lower among 8th and12th graders.
Past-30-Day Smokeless Tobacco Use:
■ Past-30-day prevalence of smokeless tobacco use ranges from a low of 0.0% for 8th graders toa high of 5.5% for 10th graders. Overall, 3.9% of New Hope-Solebury School Districtstudents have used smokeless tobacco at least once in the last 30 days.
■ Compared to national findings, 8th and 12th graders reported lower rates of past-30-daysmokeless tobacco use and 10th graders reported a similar rate of use.
■ Compared to Pennsylvania statewide, students in New Hope-Solebury School Districtreported rates of past-30-day use that were lower among 8th and 12th graders and similaramong 10th graders.

New Hope-Solebury School District Report 2011 Pennsylvania Youth Survey- 23 -
MarijuanaDuring the 1990s, there were major changes intrends of marijuana use throughout the UnitedStates. Results from the Monitoring the Futurestudy show dramatic increases in both lifetimeand past-30-day prevalence rates through theearly and mid 1990s (Johnston et al., 2011b).For 8th and 10th graders the past-30-day ratesmore than doubled during this period. Since1996 and 1997, when marijuana use peaked,rates started a gradual decline that lastedthrough the mid to late 2000s. Over the last twoyears, however, this trend has reversed and theprevalence of marijuana use has increased.
Lifetime Use:
■ Lifetime prevalence of marijuana use ranges from a low of 5.2% for 8th graders to a high of47.9% for 12th graders. Overall, 33.8% of New Hope-Solebury School District students haveused marijuana at least once in their lifetimes.
■ Compared to national findings, 8th graders reported a lower rate of lifetime marijuana use and10th and 12th graders reported higher rates of use.
■ Compared to Pennsylvania statewide, students in New Hope-Solebury School Districtreported rates of lifetime use that were higher among 10th and 12th graders and lower among8th graders.
Past-30-Day Use:
■ Past-30-day prevalence of marijuana use ranges from a low of 2.9% for 8th graders to a highof 32.4% for 12th graders. Overall, 14.7% of New Hope-Solebury School District studentshave used marijuana at least once in the last 30 days.
■ Compared to national findings, 8th and 10th graders reported lower rates of past-30-daymarijuana use and 12th graders reported a higher rate of use.
■ Compared to Pennsylvania statewide, students in New Hope-Solebury School Districtreported rates of past-30-day use that were higher among 12th graders, lower among 10th
graders and similar among 8th graders.
InhalantsInhalant use is more prevalent with youngerstudents, perhaps because inhalants are often theeasiest drugs for them to obtain. The healthconsequences of inhalant use can be substantial,including brain damage and heart failure.Inhalant use was measured by the surveyquestion “On how many occasions (if any) haveyou used inhalants (whippets, butane, paintthinner, or glue to sniff, etc.)?” Comparisonswith the Monitoring the Future study (nationalresults) should be made carefully because thereare differences in survey questions for this class

New Hope-Solebury School District Report 2011 Pennsylvania Youth Survey- 24 -
of drugs.
Lifetime Use:
■ Lifetime prevalence of inhalant use ranges from a low of 2.1% for 10th graders to a high of5.6% for 12th graders. Overall, 3.6% of New Hope-Solebury School District students haveused inhalants at least once in their lifetimes.
■ Compared to national findings, 8th, 10th and 12th graders reported lower rates of lifetimeinhalant use.
■ Compared to Pennsylvania statewide, students in New Hope-Solebury School Districtreported rates of lifetime use that were lower across all of the comparison grades.
Past-30-Day Use:
■ Past-30-day prevalence of inhalant use ranges from a low of 2.1% for 10th graders to a high of5.6% for 12th graders. Overall, 3.3% of New Hope-Solebury School District students haveused inhalants at least once in the last 30 days.
■ Compared to national findings, 8th and 10th graders reported similar rates of past-30-dayinhalant use and 12th graders reported a higher rate of use.
■ Compared to Pennsylvania statewide, students in New Hope-Solebury School Districtreported rates of past-30-day use that were higher among 12th graders, lower among 8th
graders and similar among 10th graders.
Other Illicit DrugsThe PAYS also measures the prevalence of use for a variety of other drugs. This includes student use of thefollowing: cocaine, crack cocaine, heroin, hallucinogens, methamphetamine, Ecstasy and steroids. Therates for prevalence of use of these other drugs are generally lower than the rates for alcohol, tobacco,marijuana and inhalants. Additionally, use of these other drugs tends to be concentrated in the upper gradelevels.
Cocaine
Cocaine is a powerfully addictive stimulant that directly affects the brain. Users may develop toleranceand need more and more of the drug to feel the same effects. Cocaine use can cause a variety of physicalproblems, including chest pain, strokes, seizures and abnormal heart rhythm.
Lifetime Use:
■ Lifetime prevalence of cocaine use ranges from a low of 0.0% for 8th graders to a high of5.6% for 12th graders. Overall, 1.8% of New Hope-Solebury School District students haveused cocaine at least once in their lifetimes.
■ Compared to national findings, 8th and 10th graders reported lower rates of lifetime cocaineuse and 12th graders reported a similar rate of use.
■ Compared to Pennsylvania statewide, students in New Hope-Solebury School Districtreported rates of lifetime use that were similar across all of the comparison grades.
Past-30-Day Use:
■ Past-30-day prevalence of cocaine use ranges from a low of 0.0% for 8th graders to a high of2.9% for 12th graders. Overall, 1.1% of New Hope-Solebury School District students haveused cocaine at least once in the last 30 days.

New Hope-Solebury School District Report 2011 Pennsylvania Youth Survey- 25 -
■ Compared to national findings, 8th and 12th graders reported similar rates of past-30-daycocaine use and 10th graders reported the same rate of use.
■ Compared to Pennsylvania statewide, students in New Hope-Solebury School Districtreported rates of past-30-day use that were similar across all of the comparison grades.
Crack Cocaine
“Crack” is the street name given to the freebase form of cocaine, which has been processed into a lessexpensive, smokeable drug. Because crack is smoked, the user experiences a very quick, intense, butshort-term high. Smoking large quantities of crack can cause acute problems, including cough, shortnessof breath, and severe chest pains.
Lifetime Use:
■ No students reported lifetime crack cocaine use.
■ Compared to national findings, 8th, 10th and 12th graders reported similar rates of lifetimecrack cocaine use.
■ Compared to Pennsylvania statewide, students in New Hope-Solebury School Districtreported rates of lifetime use that were similar across all of the comparison grades.
Past-30-Day Use:
■ No students reported past-30-day crack cocaine use.
■ Compared to national findings, 8th, 10th and 12th graders reported similar rates of past-30-daycrack cocaine use.
■ Compared to Pennsylvania statewide, students in New Hope-Solebury School Districtreported rates of past-30-day use that were similar across all of the comparison grades.
Heroin
Heroin is a highly addictive drug with rapid effects. Processed from morphine, heroin is usually injected,snorted or smoked. Physical dependence on the drug often develops among users. Long-term healthproblems caused by heroin use include collapsed veins, kidney or liver disease and bacterial infections.
Lifetime Use:
■ Lifetime prevalence of heroin use ranges from a low of 0.0% for 8th and 10th graders to a highof 2.8% for 12th graders. Overall, 0.7% of New Hope-Solebury School District students haveused heroin at least once in their lifetimes.
■ Compared to national findings, 8th, 10th and 12th graders reported similar rates of lifetimeheroin use.
■ Compared to Pennsylvania statewide, students in New Hope-Solebury School Districtreported rates of lifetime use that were similar across all of the comparison grades.
Past-30-Day Use:
■ Past-30-day prevalence of heroin use ranges from a low of 0.0% for 8th and 10th graders to ahigh of 1.4% for 12th graders. Overall, 0.4% of New Hope-Solebury School District studentshave used heroin at least once in the last 30 days.
■ Compared to national findings, 8th, 10th and 12th graders reported similar rates of past-30-dayheroin use.

New Hope-Solebury School District Report 2011 Pennsylvania Youth Survey- 26 -
■ Compared to Pennsylvania statewide, students in New Hope-Solebury School Districtreported rates of past-30-day use that were similar across all of the comparison grades.
Hallucinogens
Hallucinogenic drugs can have short- and long-term effects on perception and mood. For instance, users ofLSD, the most potent mood- and perception-altering drug, may have unpredictable experiences (known as“trips”) ranging from pleasant hallucinations to terrifying thoughts and feelings. LSD can also causephysical complications, including increased blood pressure and heart rate, dizziness, loss of appetite,nausea and numbness. For the purposes of the PAYS, hallucinogens were defined as “hallucinogens (acid,LSD, and ’shrooms).”
Lifetime Use:
■ Lifetime prevalence of hallucinogen use ranges from a low of 0.0% for 8th graders to a highof 8.5% for 12th graders. Overall, 5.1% of New Hope-Solebury School District students haveused hallucinogens at least once in their lifetimes.
■ Compared to national findings, 8th graders reported a lower rate of lifetime hallucinogen useand 10th and 12th graders reported similar rates of use.
■ Compared to Pennsylvania statewide, students in New Hope-Solebury School Districtreported rates of lifetime use that were higher among 10th and 12th graders and similar among8th graders.
Past-30-Day Use:
■ Past-30-day prevalence of hallucinogen use ranges from a low of 0.0% for 8th graders to ahigh of 4.8% for 10th graders. Overall, 3.6% of New Hope-Solebury School District studentshave used hallucinogens at least once in the last 30 days.
■ Compared to national findings, 8th graders reported a similar rate of past-30-day hallucinogenuse and 10th and 12th graders reported higher rates of use.
■ Compared to Pennsylvania statewide, students in New Hope-Solebury School Districtreported rates of past-30-day use that were higher among 10th graders and similar among 8th
and 12th graders.
Methamphetamine
Methamphetamine is a highly addictive stimulant with effects similar to cocaine. Use ofmethamphetamine can cause physical and psychological problems, such as rapid or irregular heart rate,increased blood pressure, anxiety and insomnia.
Lifetime Use:
■ Lifetime prevalence of methamphetamine use ranges from a low of 0.0% for 8th and 10th
graders to a high of 2.8% for 12th graders. Overall, 0.7% of New Hope-Solebury SchoolDistrict students have used methamphetamine at least once in their lifetimes.
■ Compared to national findings, 8th and 12th graders reported similar rates of lifetimemethamphetamine use and 10th graders reported a lower rate of use.
■ Compared to Pennsylvania statewide, students in New Hope-Solebury School Districtreported rates of lifetime use that were similar across all of the comparison grades.

New Hope-Solebury School District Report 2011 Pennsylvania Youth Survey- 27 -
Past-30-Day Use:
■ Past-30-day prevalence of methamphetamine use ranges from a low of 0.0% for 8th and 10th
graders to a high of 1.4% for 12th graders. Overall, 0.4% of New Hope-Solebury SchoolDistrict students have used methamphetamine at least once in the last 30 days.
■ Compared to national findings, 8th, 10th and 12th graders reported similar rates of past-30-daymethamphetamine use.
■ Compared to Pennsylvania statewide, students in New Hope-Solebury School Districtreported rates of past-30-day use that were similar across all of the comparison grades.
Ecstasy
Ecstasy (also known as MDMA) has both stimulant and hallucinogenic effects. After showing an increasein use nationwide from 1998 to 2001, use of Ecstasy appears to have declined in recent years, while theproportion of young people perceiving it as dangerous has increased (Johnston et al., 2011b).
Lifetime Use:
■ Lifetime prevalence of Ecstasy use ranges from a low of 0.0% for 8th graders to a high of7.0% for 12th graders. Overall, 4.4% of New Hope-Solebury School District students haveused Ecstasy at least once in their lifetimes.
■ Compared to national findings, 8th graders reported a lower rate of lifetime Ecstasy use and10th and 12th graders reported similar rates of use.
■ Compared to Pennsylvania statewide, students in New Hope-Solebury School Districtreported rates of lifetime use that were higher among 10th graders and similar among 8th and12th graders.
Past-30-Day Use:
■ Past-30-day prevalence of Ecstasy use ranges from a low of 1.7% for 8th graders to a high of7.0% for 12th graders. Overall, 4.4% of New Hope-Solebury School District students haveused Ecstasy at least once in the last 30 days.
■ Compared to national findings, 8th graders reported a similar rate of past-30-day Ecstasy useand 10th and 12th graders reported higher rates of use.
■ Compared to Pennsylvania statewide, students in New Hope-Solebury School Districtreported rates of past-30-day use that were higher among 10th and 12th graders and similaramong 8th graders.
Steroids
The primary use for steroids in humans is to raise inadequate levels of testosterone. However, someathletes misuse the drug to “improve” their appearance or athletic performance. Improper use of steroidscan prematurely stop the lengthening of bones as well as cause infertility and liver tumors.
Lifetime Use:
■ No students reported lifetime steroid use.
■ Compared to national findings, 8th, 10th and 12th graders reported similar rates of lifetimesteroid use.
■ Compared to Pennsylvania statewide, students in New Hope-Solebury School Districtreported rates of lifetime use that were similar across all of the comparison grades.

New Hope-Solebury School District Report 2011 Pennsylvania Youth Survey- 28 -
Past-30-Day Use:
■ No students reported past-30-day steroid use.
■ Compared to national findings, 8th, 10th and 12th graders reported similar rates of past-30-daysteroid use.
■ Compared to Pennsylvania statewide, students in New Hope-Solebury School Districtreported rates of past-30-day use that were similar across all of the comparison grades.
Any Illicit Drug (Other than Marijuana)
The final ATOD indicator reports on the use ofany illicit drug other than marijuana. This drugcombination rate—which includes use of one ormore of the following drugs: inhalants, cocaine,crack cocaine, heroin, hallucinogens,methamphetamine, Ecstasy and steroids—provides prevention planners with an overallindicator of so-called “hard” drug use.Marijuana use is excluded from this indexbecause the higher prevalence of marijuana usetends to obscure the presence or absence of the other drugs. In other words, an indicator of “Any IllicitDrug Use (Including Marijuana)” primarily measures marijuana use. Direct comparisons to Monitoring theFuture results are not available for this measure.
Lifetime Use:
■ Lifetime prevalence of any illicit drug (other than marijuana) use ranges from a low of 5.1%for 8th graders to a high of 16.9% for 12th graders. Overall, 9.8% of New Hope-SoleburySchool District students have used any illicit drug (other than marijuana) at least once in theirlifetimes.
■ Compared to Pennsylvania statewide, students in New Hope-Solebury School Districtreported rates of lifetime use that were lower among 8th and 10th graders and similar among12th graders.
Past-30-Day Use:
■ Past-30-day prevalence of any illicit drug (other than marijuana) use ranges from a low of5.1% for 8th graders to a high of 12.7% for 12th graders. Overall, 8.3% of New Hope-SoleburySchool District students have used any illicit drug (other than marijuana) at least once in thelast 30 days.
■ Compared to Pennsylvania statewide, students in New Hope-Solebury School Districtreported rates of past-30-day use that were higher among 12th graders, lower among 8th
graders and similar among 10th graders.
Prescription DrugsIn recent years the nonmedical use of prescription drugs has emerged as a major public health issue. Boththe National Survey on Drug Use and Health (Substance Abuse and Mental Health ServicesAdministration, 2003) and the Monitoring the Future study (Johnston et al., 2011a), two major sources ofyouth drug abuse prevalence data, have reported increases in the unauthorized use of prescription drugs.

New Hope-Solebury School District Report 2011 Pennsylvania Youth Survey- 29 -
This trend is particularly troubling given the adverse health consequences related to prescription drugabuse, which include addiction, physical dependence and the possibility of overdose.
Despite these concerns, the research community is still in the early stages of developing survey methodsthat can accurately measure the prevalence of prescription drug abuse. If anonymity is ensured, moststudents will honestly and accurately report their use of alcohol, tobacco, marijuana and other easilyrecognized categories of illicit drugs. The measurement of prescription drug use, however, is morecomplex. There are many prescription medicines that are subject to abuse, making it impossible to presentan exhaustive list. Also, respondents may have difficulty identifying the names of prescription drugs theyhave used, and they may have difficulty distinguishing between prescription and over-the-countermedications.
With these challenges in mind, the 2009 PAYS added six questions designed to measure prevalence-of-userates across the three prescription drug categories that, according to the National Institute on Drug Abuse,are among the most likely to be abused: pain relievers, stimulants and tranquilizers. Each question includesexamples of some of the best known drugs within that category. Results for New Hope-Solebury SchoolDistrict are presented in Tables 17 and 18, and results for Pennsylvania statewide are presented in Tables19 and 20.
On how many occasions (if any) have you:
Used prescription pain relievers, such as Vicodin®, OxyContin® or Tylox®, without a doctor’sorders, in your lifetime?
Used prescription pain relievers, such as Vicodin®, OxyContin® or Tylox®, without a doctor’sorders, during the past 30 days?
Used prescription tranquilizers, such as Xanax®, Valium® or Ambien®, without a doctor’s orders,in your lifetime?
Used prescription tranquilizers, such as Xanax®, Valium® or Ambien®, without a doctor’s orders,during the past 30 days?
Used prescription stimulants, such as Ritalin® or Adderall®, without a doctor’s orders, in yourlifetime?
Used prescription stimulants, such as Ritalin® or Adderall®, without a doctor’s orders, during thepast 30 days?
Pain Relievers
Lifetime Use:
■ Lifetime prevalence of prescription pain reliever use ranges from a low of 3.6% for 8th
graders to a high of 5.6% for 12th graders. Overall, 5.1% of New Hope-Solebury SchoolDistrict students have used prescription pain relievers at least once in their lifetimes.
■ Compared to Pennsylvania statewide, students in New Hope-Solebury School Districtreported rates of lifetime use that were lower among 10th and 12th graders and similar among8th graders.
Past-30-Day Use:
■ Past-30-day prevalence of prescription pain reliever use ranges from a low of 4.1% for 10th
graders to a high of 5.2% for 8th graders. Overall, 4.4% of New Hope-Solebury SchoolDistrict students have used prescription pain relievers at least once in the last 30 days.

New Hope-Solebury School District Report 2011 Pennsylvania Youth Survey- 30 -
■ Compared to Pennsylvania statewide, students in New Hope-Solebury School Districtreported rates of past-30-day use that were lower among 12th graders and similar among 8th
and 10th graders.
Tranquilizers
Lifetime Use:
■ Lifetime prevalence of tranquilizer use ranges from a low of 0.0% for 8th graders to a high of2.8% for 12th graders. Overall, 1.8% of New Hope-Solebury School District students haveused tranquilizers at least once in their lifetimes.
■ Compared to Pennsylvania statewide, students in New Hope-Solebury School Districtreported rates of lifetime use that were lower among 12th graders and similar among 8th and10th graders.
Past-30-Day Use:
■ Past-30-day prevalence of tranquilizer use ranges from a low of 0.0% for 8th graders to a highof 2.8% for 12th graders. Overall, 1.1% of New Hope-Solebury School District students haveused tranquilizers at least once in the last 30 days.
■ Compared to Pennsylvania statewide, students in New Hope-Solebury School Districtreported rates of past-30-day use that were similar across all of the comparison grades.
Stimulants
Lifetime Use:
■ Lifetime prevalence of stimulant use ranges from a low of 0.0% for 8th graders to a high of12.7% for 12th graders. Overall, 4.8% of New Hope-Solebury School District students haveused stimulants at least once in their lifetimes.
■ Compared to Pennsylvania statewide, students in New Hope-Solebury School Districtreported rates of lifetime use that were higher among 12th graders and similar among 8th and10th graders.
Past-30-Day Use:
■ Past-30-day prevalence of stimulant use ranges from a low of 1.7% for 8th graders to a high of9.9% for 12th graders. Overall, 4.0% of New Hope-Solebury School District students haveused stimulants at least once in the last 30 days.
■ Compared to Pennsylvania statewide, students in New Hope-Solebury School Districtreported rates of past-30-day use that were higher among 12th graders and similar among 8th
and 10th graders.
Table 17. Lifetime Use of Prescription Drugs, New Hope-Solebury School District 20116th 7th 8th 9th 10th 11th 12th Overall% % % % % % % %
Pain Relievers -- -- 3.6 -- 5.5 -- 5.6 5.1Tranquilizers -- -- 0.0 -- 2.1 -- 2.8 1.8Stimulants -- -- 0.0 -- 2.8 -- 12.7 4.8
Note: The symbol “--” indicates that data are not available because students were not surveyed.

New Hope-Solebury School District Report 2011 Pennsylvania Youth Survey- 31 -
Table 18. Past-30-Day Use of Prescription Drugs, New Hope-Solebury School District 20116th 7th 8th 9th 10th 11th 12th Overall% % % % % % % %
Pain Relievers -- -- 5.2 -- 4.1 -- 4.2 4.4Tranquilizers -- -- 0.0 -- 0.7 -- 2.8 1.1Stimulants -- -- 1.7 -- 2.1 -- 9.9 4.0
Note: The symbol “--” indicates that data are not available because students were not surveyed.
Table 19. Lifetime Use of Prescription Drugs, Pennsylvania Statewide 20116th 7th 8th 9th 10th 11th 12th Overall% % % % % % % %
Pain Relievers 1.1 -- 3.7 -- 8.1 -- 13.1 6.7Tranquilizers 0.1 -- 1.1 -- 3.1 -- 6.1 2.7Stimulants 0.2 -- 1.2 -- 4.4 -- 8.2 3.6
Note: The symbol “--” indicates that data are not available because students were not surveyed.
Table 20. Past-30-Day Use of Prescription Drugs, Pennsylvania Statewide 20116th 7th 8th 9th 10th 11th 12th Overall% % % % % % % %
Pain Relievers 0.8 -- 3.3 -- 6.0 -- 7.9 4.6Tranquilizers 0.1 -- 0.9 -- 2.0 -- 3.2 1.6Stimulants 0.1 -- 1.1 -- 2.9 -- 4.9 2.3
Note: The symbol “--” indicates that data are not available because students were not surveyed.
Risk of HarmPerception of risk is an important determinant in the decision-making process young people go throughwhen deciding whether or not to use alcohol, tobacco or other drugs (Bachman, Johnston, O’Malley &Humphrey, 1988). Data analysis across a range of Communities That Care Youth Survey communitiesshows a consistent negative correlation between perception of risk and the level of reported ATOD use.That is, generally when the perceived risk of harm is high, reported frequency of use is low. Evidence alsosuggests that perceptions of the risks and benefits associated with drug use sometimes serve as a leadingindicator of future drug use patterns in a community (Bachman, Johnston, O’Malley & Humphrey, 1986).Table 21 presents prevalence rates for surveyed youth assigning “great risk” of harm to four drug usebehaviors: regular use of alcohol (one or two drinks nearly every day), regular use of cigarettes (a pack ormore daily), trying marijuana once or twice, and regular use of marijuana. These four survey items formthe risk factor scale Low Perceived Risks of Drug Use (see Section 5). Comparison data from the statewidesurvey are presented in Table 22.

New Hope-Solebury School District Report 2011 Pennsylvania Youth Survey- 32 -
Table 21. Percentage of Youth Who Reported Perception of “Great Risk” of Harm, New Hope-Solebury School District 2011
6th 7th 8th 9th 10th 11th 12th Overall% % % % % % % %
Drinking Alcohol Regularly -- -- 37.7 -- 32.9 -- 21.1 31.1Smoking Cigarettes Regularly -- -- 71.0 -- 67.8 -- 71.8 69.6Trying Marijuana Once or Twice -- -- 31.9 -- 15.8 -- 7.0 17.5Smoking Marijuana Regularly -- -- 72.5 -- 35.6 -- 29.6 43.0
Note: The symbol “--” indicates that data are not available because students were not surveyed.
Table 22. Percentage of Youth Who Reported Perception of “Great Risk” of Harm, PennsylvaniaStatewide 2011
6th 7th 8th 9th 10th 11th 12th Overall% % % % % % % %
Drinking Alcohol Regularly 38.0 -- 33.7 -- 27.9 -- 27.4 31.6Smoking Cigarettes Regularly 66.3 -- 70.4 -- 66.1 -- 65.5 67.1Trying Marijuana Once or Twice 40.6 -- 36.2 -- 21.8 -- 17.5 28.7Smoking Marijuana Regularly 76.6 -- 75.4 -- 53.5 -- 44.2 62.1
Note: The symbol “--” indicates that data are not available because students were not surveyed.
Disapproval of Drug UsePersonal approval or disapproval is another key attitudinal construct that influences drug use behavior(Bachman et al., 1988). Like risk of harm, disapproval is negatively correlated with the level of reportedATOD use across a range of Communities That Care Youth Survey communities. Personal disapproval wasmeasured by asking surveyed youth how wrong it would be for someone their age to drink alcoholregularly, smoke cigarettes, smoke marijuana, or use other illicit drugs (“LSD, cocaine, amphetamines oranother illegal drug”). The rates presented in Table 23 represent the percentages of surveyed youth whothought it would be “wrong” or “very wrong” to use each drug. These four survey items form the riskfactor scale Favorable Attitudes toward ATOD Use (see Section 5). Comparison data from the statewidesurvey are presented in Table 24.
Table 23. Percentage of Youth Who Indicated Personal Disapproval of Drug Use, New Hope-Solebury School District 2011
6th 7th 8th 9th 10th 11th 12th Overall% % % % % % % %
Drinking Alcohol Regularly -- -- 85.7 -- 46.6 -- 31.0 52.3Smoking Cigarettes -- -- 92.9 -- 80.1 -- 60.6 78.4Smoking Marijuana -- -- 85.7 -- 71.9 -- 45.1 68.6Using Other Illicit Drugs -- -- 95.7 -- 97.9 -- 84.5 94.1
Note: The symbol “--” indicates that data are not available because students were not surveyed.

New Hope-Solebury School District Report 2011 Pennsylvania Youth Survey- 33 -
Table 24. Percentage of Youth Who Indicated Personal Disapproval of Drug Use, PennsylvaniaStatewide 2011
6th 7th 8th 9th 10th 11th 12th Overall% % % % % % % %
Drinking Alcohol Regularly 97.1 -- 86.6 -- 66.2 -- 51.2 74.7Smoking Cigarettes 97.7 -- 88.4 -- 76.3 -- 60.0 80.2Smoking Marijuana 98.2 -- 89.8 -- 73.1 -- 61.4 80.1Using Other Illicit Drugs 98.6 -- 96.5 -- 92.9 -- 90.6 94.6
Note: The symbol “--” indicates that data are not available because students were not surveyed.
Social Norms about ATOD UseIn addition to students’ own attitudes, social norms—the written and unwritten rules and expectationsabout what constitutes desirable behavior—shape drug use choices. Since drug-related attitudes andbehaviors are often acquired through peer group interactions, expectations of how one’s peer group mightreact have an especially strong impact on whether or not young people choose to use drugs. The datapresented in Table 25 show the percentage of surveyed youth who said that there is a “pretty good” or“very good” chance that they would be seen as cool if they smoked cigarettes, drank alcohol regularly(once or twice a month) or smoked marijuana. These three survey items form part of the risk factor scalePeer Rewards for Antisocial Behavior (see Section 5). Comparison data from the statewide survey arepresented in Table 26.
Table 25. Percentage of Youth Who Indicated Peer Approval of Drug Use, New Hope-SoleburySchool District 2011
6th 7th 8th 9th 10th 11th 12th Overall% % % % % % % %
Drinking Alcohol Regularly -- -- 1.4 -- 30.1 -- 33.8 24.1Smoking Cigarettes -- -- 1.4 -- 0.7 -- 5.6 2.1Smoking Marijuana -- -- 4.4 -- 11.0 -- 22.5 12.3
Note: The symbol “--” indicates that data are not available because students were not surveyed.
Table 26. Percentage of Youth Who Indicated Peer Approval of Drug Use, PennsylvaniaStatewide 2011
6th 7th 8th 9th 10th 11th 12th Overall% % % % % % % %
Drinking Alcohol Regularly 1.1 -- 4.8 -- 14.1 -- 21.1 10.5Smoking Cigarettes 1.0 -- 3.7 -- 6.0 -- 7.1 4.6Smoking Marijuana 1.0 -- 4.7 -- 15.0 -- 17.8 9.9
Note: The symbol “--” indicates that data are not available because students were not surveyed.
In addition to peer attitudes, social norms toward drug use were measured by asking how mostneighborhood adults would view student alcohol, cigarette and marijuana use. Table 27 presents thepercentage of surveyed youth who thought other adults would feel it was “wrong” or “very wrong” to useeach drug. These three survey items form part of the risk factor scale Laws and Norms Favorable to DrugUse (see Section 5). Comparison data from the statewide survey are presented in Table 28.

New Hope-Solebury School District Report 2011 Pennsylvania Youth Survey- 34 -
Table 27. Percentage of Youth Who Indicated “Other Adults” Disapprove of Drug Use, NewHope-Solebury School District 2011
6th 7th 8th 9th 10th 11th 12th Overall% % % % % % % %
Drinking Alcohol -- -- 88.6 -- 58.9 -- 47.9 63.4Smoking Cigarettes -- -- 88.6 -- 89.7 -- 60.6 82.2Smoking Marijuana -- -- 94.3 -- 89.0 -- 67.6 85.0
Note: The symbol “--” indicates that data are not available because students were not surveyed.
Table 28. Percentage of Youth Who Indicated “Other Adults” Disapprove of Drug Use,Pennsylvania Statewide 2011
6th 7th 8th 9th 10th 11th 12th Overall% % % % % % % %
Drinking Alcohol 91.2 -- 84.6 -- 72.4 -- 60.0 76.8Smoking Cigarettes 91.8 -- 86.2 -- 77.1 -- 61.7 79.0Smoking Marijuana 95.3 -- 91.9 -- 83.0 -- 75.9 86.3
Note: The symbol “--” indicates that data are not available because students were not surveyed.
Parental Disapproval of Drug UseParental disapproval was measured by asking surveyed youth “how wrong do your parents feel it would befor you to” drink alcohol regularly, smoke cigarettes, and smoke marijuana. The rates presented in Table29 represent the percentages of surveyed youth who reported that their parents feel it would be “verywrong” to use each drug. These three survey items form the risk factor scale Parental Attitudes Favorabletoward ATOD Use (see Section 5). Comparison data from the statewide survey are presented in Table 30.
Table 29. Percentage of Youth Who Indicated Parental Disapproval of Drug Use, New Hope-Solebury School District 2011
6th 7th 8th 9th 10th 11th 12th Overall% % % % % % % %
Drink Alcohol Regularly -- -- 87.1 -- 46.6 -- 38.0 54.4Smoke Cigarettes -- -- 91.4 -- 62.3 -- 71.8 71.8Smoke Marijuana -- -- 87.1 -- 61.0 -- 67.6 69.0
Note: The symbol “--” indicates that data are not available because students were not surveyed.
Table 30. Percentage of Youth Who Indicated Parental Disapproval of Drug Use, PennsylvaniaStatewide 2011
6th 7th 8th 9th 10th 11th 12th Overall% % % % % % % %
Drinking Alcohol Regularly 93.6 -- 85.6 -- 70.3 -- 55.2 75.7Smoke Cigarettes 95.2 -- 89.3 -- 79.9 -- 66.8 82.5Smoke Marijuana 97.3 -- 92.2 -- 81.4 -- 74.1 86.0
Note: The symbol “--” indicates that data are not available because students were not surveyed.

New Hope-Solebury School District Report 2011 Pennsylvania Youth Survey- 35 -
Frequency of Drug UseWhile prevalence rates are useful for determining how many students are currently using or haveexperimented with a drug, they give no indication of the frequency or intensity of use. A respondent whoreports 1 or 2 occasions of use in the past 30 days is counted the same as one who reports 40 or moreoccasions of use, even though the level of use is drastically different. Tables 31-38 present the past-30-dayfrequency of use reported by surveyed youth for the following drugs: alcohol, cigarettes, marijuana, andinhalants.
Table 31. Past-30-Day Frequency of Alcohol Use, New Hope-Solebury School District 20116th 7th 8th 9th 10th 11th 12th Overall% % % % % % % %
0 occasions -- -- 92.8 -- 55.5 -- 42.3 61.21 or 2 occasions -- -- 4.3 -- 13.7 -- 22.5 13.63 to 5 occasions -- -- 1.4 -- 27.4 -- 18.3 18.96 to 9 occasions -- -- 1.4 -- 1.4 -- 9.9 3.510 to 19 occasions -- -- 0.0 -- 2.1 -- 7.0 2.820 to 39 occasions -- -- 0.0 -- 0.0 -- 0.0 0.040 or more occasions -- -- 0.0 -- 0.0 -- 0.0 0.0
Note: Rounding on the above table can produce totals that do not equal 100%. The symbol “--” indicates that data are not available because students werenot surveyed.
Table 32. Past-30-Day Frequency of Alcohol Use, Pennsylvania Statewide 20116th 7th 8th 9th 10th 11th 12th Overall% % % % % % % %
0 occasions 96.0 -- 85.9 -- 71.1 -- 55.8 76.71 or 2 occasions 3.3 -- 10.3 -- 18.3 -- 24.9 14.43 to 5 occasions 0.5 -- 2.6 -- 6.5 -- 10.7 5.26 to 9 occasions 0.1 -- 0.6 -- 2.0 -- 4.9 1.910 to 19 occasions 0.0 -- 0.4 -- 1.1 -- 2.7 1.120 to 39 occasions 0.0 -- 0.1 -- 0.4 -- 0.4 0.240 or more occasions 0.0 -- 0.2 -- 0.5 -- 0.6 0.3
Note: Rounding on the above table can produce totals that do not equal 100%. The symbol “--” indicates that data are not available because students werenot surveyed.
Table 33. Past-30-Day Frequency of Cigarette Use, New Hope-Solebury School District 20116th 7th 8th 9th 10th 11th 12th Overall% % % % % % % %
Not at all -- -- 100.0 -- 94.5 -- 84.5 93.4Less than one cigarette per day -- -- 0.0 -- 3.4 -- 8.5 3.8One to five cigarettes per day -- -- 0.0 -- 0.0 -- 4.2 1.0About one-half pack per day -- -- 0.0 -- 1.4 -- 0.0 0.7About one pack per day -- -- 0.0 -- 0.0 -- 2.8 0.7About one and one-half packs per day -- -- 0.0 -- 0.7 -- 0.0 0.3Two packs or more per day -- -- 0.0 -- 0.0 -- 0.0 0.0
Note: Rounding on the above table can produce totals that do not equal 100%. The symbol “--” indicates that data are not available because students werenot surveyed.

New Hope-Solebury School District Report 2011 Pennsylvania Youth Survey- 36 -
Table 34. Past-30-Day Frequency of Cigarette Use, Pennsylvania Statewide 20116th 7th 8th 9th 10th 11th 12th Overall% % % % % % % %
Not at all 99.3 -- 94.7 -- 88.3 -- 80.6 90.5Less than one cigarette per day 0.6 -- 3.0 -- 5.4 -- 7.1 4.1One to five cigarettes per day 0.1 -- 1.4 -- 3.7 -- 6.0 2.9About one-half pack per day 0.0 -- 0.4 -- 1.3 -- 3.8 1.4About one pack per day 0.0 -- 0.2 -- 0.6 -- 1.7 0.6About one and one-half packs per day 0.0 -- 0.1 -- 0.2 -- 0.5 0.2Two packs or more per day 0.0 -- 0.2 -- 0.5 -- 0.3 0.3
Note: Rounding on the above table can produce totals that do not equal 100%. The symbol “--” indicates that data are not available because students werenot surveyed.
Table 35. Past-30-Day Frequency of Marijuana Use, New Hope-Solebury School District 20116th 7th 8th 9th 10th 11th 12th Overall% % % % % % % %
0 occasions -- -- 97.1 -- 88.4 -- 67.6 85.31 or 2 occasions -- -- 2.9 -- 6.2 -- 15.5 7.73 to 5 occasions -- -- 0.0 -- 2.1 -- 4.2 2.16 to 9 occasions -- -- 0.0 -- 0.0 -- 2.8 0.710 to 19 occasions -- -- 0.0 -- 0.7 -- 4.2 1.420 to 39 occasions -- -- 0.0 -- 2.1 -- 2.8 1.740 or more occasions -- -- 0.0 -- 0.7 -- 2.8 1.0
Note: Rounding on the above table can produce totals that do not equal 100%. The symbol “--” indicates that data are not available because students werenot surveyed.
Table 36. Past-30-Day Frequency of Marijuana Use, Pennsylvania Statewide 20116th 7th 8th 9th 10th 11th 12th Overall% % % % % % % %
0 occasions 99.5 -- 95.5 -- 85.1 -- 78.1 89.31 or 2 occasions 0.3 -- 2.2 -- 5.7 -- 7.8 4.13 to 5 occasions 0.1 -- 0.8 -- 2.5 -- 3.1 1.76 to 9 occasions 0.0 -- 0.5 -- 1.6 -- 2.1 1.110 to 19 occasions 0.0 -- 0.4 -- 1.7 -- 2.8 1.320 to 39 occasions 0.0 -- 0.1 -- 1.6 -- 2.5 1.140 or more occasions 0.1 -- 0.3 -- 1.7 -- 3.7 1.5
Note: Rounding on the above table can produce totals that do not equal 100%. The symbol “--” indicates that data are not available because students werenot surveyed.

New Hope-Solebury School District Report 2011 Pennsylvania Youth Survey- 37 -
Table 37. Past-30-Day Frequency of Inhalant Use, New Hope-Solebury School District 20116th 7th 8th 9th 10th 11th 12th Overall% % % % % % % %
0 occasions -- -- 96.6 -- 97.9 -- 94.4 96.71 or 2 occasions -- -- 3.4 -- 0.7 -- 4.2 2.23 to 5 occasions -- -- 0.0 -- 0.0 -- 0.0 0.06 to 9 occasions -- -- 0.0 -- 0.7 -- 1.4 0.710 to 19 occasions -- -- 0.0 -- 0.0 -- 0.0 0.020 to 39 occasions -- -- 0.0 -- 0.7 -- 0.0 0.440 or more occasions -- -- 0.0 -- 0.0 -- 0.0 0.0
Note: Rounding on the above table can produce totals that do not equal 100%. The symbol “--” indicates that data are not available because students werenot surveyed.
Table 38. Past-30-Day Frequency of Inhalant Use, Pennsylvania Statewide 20116th 7th 8th 9th 10th 11th 12th Overall% % % % % % % %
0 occasions 95.3 -- 93.6 -- 96.0 -- 96.8 95.51 or 2 occasions 3.6 -- 4.5 -- 2.7 -- 1.8 3.13 to 5 occasions 0.5 -- 1.2 -- 0.8 -- 0.8 0.86 to 9 occasions 0.2 -- 0.4 -- 0.1 -- 0.3 0.310 to 19 occasions 0.1 -- 0.1 -- 0.2 -- 0.1 0.120 to 39 occasions 0.0 -- 0.1 -- 0.0 -- 0.0 0.140 or more occasions 0.2 -- 0.1 -- 0.1 -- 0.1 0.1
Note: Rounding on the above table can produce totals that do not equal 100%. The symbol “--” indicates that data are not available because students werenot surveyed.


New Hope-Solebury School District Report 2011 Pennsylvania Youth Survey- 39 -
Section 4: Special Topics
IntroductionThe PAYS included questions on the following special topics: age of onset of ATOD use and otherantisocial behavior, driving under the influence of alcohol or marijuana, willingness to try or use ATODs,gambling, symptoms of depression, and the frequency of having been threatened or attacked at school.
Age of Onset of ATOD Use and Other Antisocial BehaviorUsing age-of-initiation data to coordinate the timing of prevention efforts can be an important tool formaximizing program effectiveness. For example, programs delivered after the majority of potential drugusers have already initiated the behavior may have limited impact. Alternatively, very early interventionmight prove less effective because it is not close enough to the critical initiation period.
New Hope-Solebury School District students were asked nine questions about the age at which they firstused ATODs and participated in other antisocial behaviors. The topics covered include: trying alcohol(“more than a sip or two”), drinking alcohol regularly (“at least once or twice a month”), smokingcigarettes, smoking marijuana, being suspended from school, being arrested, carrying a handgun, attackingsomeone with intent to harm, and belonging to a gang. Results for New Hope-Solebury School Districtstudents are presented in Table 39, and comparison data from the statewide survey are presented in Table40.
While the average age of onset is typically lower in the earlier grades than it is in the later ones, thisshould not be interpreted as indicating that the younger cohorts are initiating substance use at an earlierage than the older cohorts did. Rather, the average age for each cohort increases as its members progressthrough school and more of them initiate experimentation with ATODs and engage in other antisocialbehaviors. For this reason, the question “When do students first start using alcohol?” is best answered byexamining the responses of students in the highest grade level surveyed because they can best reflect ontheir high school and/or middle school experiences and accurately report the age they first started usingdrugs or engaging in other antisocial behaviors.
Section 4Special Topics

New Hope-Solebury School District Report 2011 Pennsylvania Youth Survey- 40 -
Table 39. Average Age of Onset of ATOD Use and Other Antisocial Behaviors, New Hope-Solebury School District 2011
6th 7th 8th 9th 10th 11th 12th Overall
Trying Alcohol -- -- 12.3 -- 14.0 -- 14.9 14.1
Drinking Alcohol Regularly -- -- 13.0 -- 14.8 -- 16.0 15.5
Smoking Cigarettes -- -- 11.3 -- 13.7 -- 15.0 14.2
Smoking Marijuana -- -- 13.0 -- 14.0 -- 15.6 14.8
Being Suspended from School -- -- 12.7 -- 10.7 -- 14.3 12.6
Being Arrested -- -- -- -- 14.5 -- 15.6 15.3
Carrying a Handgun -- -- 12.2 -- 11.5 -- 10.7 11.6
Attacking Someone with Intent to Harm -- -- 13.0 -- 12.6 -- 13.5 13.0
Belonging to a Gang -- -- 11.5 -- 10.0 -- 10.0 10.9Note: The symbol “--” indicates that data are not available because students were not surveyed.
Table 40. Average Age of Onset of ATOD Use and Other Antisocial Behaviors, PennsylvaniaStatewide 2011
6th 7th 8th 9th 10th 11th 12th Overall
Trying Alcohol 10.5 -- 11.7 -- 13.3 -- 14.5 13.2
Drinking Alcohol Regularly 11.5 -- 12.5 -- 14.2 -- 15.7 14.8
Smoking Cigarettes 10.7 -- 11.7 -- 13.0 -- 14.1 13.2
Smoking Marijuana 12.0 -- 12.3 -- 13.6 -- 14.9 14.1
Being Suspended from School 10.4 -- 11.4 -- 12.6 -- 13.5 12.4
Being Arrested 10.7 -- 12.0 -- 13.1 -- 14.7 13.4
Carrying a Handgun 10.5 -- 11.3 -- 12.5 -- 13.1 12.0
Attacking Someone with Intent to Harm 10.4 -- 11.3 -- 12.4 -- 13.2 12.1
Belonging to a Gang 10.7 -- 11.8 -- 12.6 -- 13.4 12.2Note: The symbol “--” indicates that data are not available because students were not surveyed.
Driving after Alcohol or Marijuana UseDriving a car requires clear thinking and good hand-eye coordination. Operating a vehicle after usingalcohol or marijuana may impair driving skills, making the driver a hazard on any roadway. The impact ofATOD usage on automobile safety is assessed with two items: (1) “How often have you driven a car whileor shortly after drinking?” and (2) “How often have you driven a car while or shortly after smoking pot?”Results for New Hope-Solebury School District students are presented in Table 41, and comparison datafrom the statewide survey are presented in Table 42.

New Hope-Solebury School District Report 2011 Pennsylvania Youth Survey- 41 -
Table 41. Percentage of Youth Reporting Any Occasion of Driving Under the Influence, NewHope-Solebury School District 2011
6th 7th 8th 9th 10th 11th 12th Overall% % % % % % % %
Driving after Alcohol Use -- -- 0.0 -- 1.4 -- 21.1 6.4Driving after Marijuana Use -- -- 0.0 -- 3.4 -- 32.4 10.5
Note: The symbol “--” indicates that data are not available because students were not surveyed.
Table 42. Percentage of Youth Reporting Any Occasion of Driving Under the Influence,Pennsylvania Statewide 2011
6th 7th 8th 9th 10th 11th 12th Overall% % % % % % % %
Driving after Alcohol Use 0.5 -- 1.3 -- 2.8 -- 16.2 5.4Driving after Marijuana Use 0.2 -- 0.9 -- 3.5 -- 18.4 5.9
Note: The symbol “--” indicates that data are not available because students were not surveyed.
Willingness to Try or Use ATODsAlong with perceptions of risk and level of disapproval (Bachman et al., 1988), willingness to try or useATODs may be viewed as one of the attitudinal constructs that facilitates drug use. Pennsylvania studentswere questioned regarding their willingness to try or use alcohol, marijuana, cocaine, hallucinogens andinhalants. Results for New Hope-Solebury School District students are presented in Table 43, andcomparison data from the statewide survey are presented in Table 44.
Table 43. Percentage of Youth Reporting Willingness to Try Selected ATODs, New Hope-Solebury School District 2011
6th 7th 8th 9th 10th 11th 12th Overall% % % % % % % %
Alcohol -- -- 45.5 -- 63.7 -- 78.9 64.0Marijuana -- -- 14.5 -- 42.5 -- 46.5 37.9Cocaine -- -- 5.5 -- 1.4 -- 8.6 4.1Hallucinogens -- -- 3.6 -- 4.8 -- 11.3 6.3Inhalants -- -- 5.6 -- 1.4 -- 4.2 3.0
Note: The percentages reported in this table represent the percentage of students who indicated “would use it any chance I got,” “would like to try it or use it”or “not sure whether or not I would use it.” Students who indicated “probably wouldn’t use it” or “would never use it” were considered to be unwilling to try thesubstance. The symbol “--” indicates that data are not available because students were not surveyed.
Table 44. Percentage of Youth Reporting Willingness to Try Selected ATODs, PennsylvaniaStatewide 2011
6th 7th 8th 9th 10th 11th 12th Overall% % % % % % % %
Alcohol 14.5 -- 35.7 -- 57.3 -- 73.3 46.0Marijuana 1.8 -- 11.4 -- 28.8 -- 37.5 20.4Cocaine 1.1 -- 2.1 -- 3.5 -- 4.8 2.9Hallucinogens 0.7 -- 2.9 -- 8.5 -- 11.6 6.1Inhalants 0.9 -- 2.5 -- 3.3 -- 3.6 2.6
Note: The percentages reported in this table represent the percentage of students who indicated “would use it any chance I got,” “would like to try it or use it”or “not sure whether or not I would use it.” Students who indicated “probably wouldn’t use it” or “would never use it” were considered to be unwilling to try thesubstance. The symbol “--” indicates that data are not available because students were not surveyed.

New Hope-Solebury School District Report 2011 Pennsylvania Youth Survey- 42 -
GamblingThe 2011 PAYS asks students a series of six questions about their experiences with gambling. Theseinclude past-12-month prevalence measures for: gambling for “money or anything of value,” betting“money or anything of value on sporting events,” buying “lottery tickets,” betting “money using theinternet,” and betting “money or anything of value on table games like poker or other card games, dice,backgammon, or dominoes.” A question about gambling for “money or anything of value” in the past 30days is also asked. Results for New Hope-Solebury School District students are presented in Table 45, andcomparison data from the statewide survey are presented in Table 46.
Please note that two of the six gambling questions—the past-12-months and past-30-days gambling for“money or anything of value” items—have been in use since the 2005 survey. The sports betting, lotteryticket, and table gaming questions were introduced in 2007 and modified in 2009.
Table 45. Percentage of Youth Reporting Gambling or Gambling-Related Problems, NewHope-Solebury School District 2011
6th 7th 8th 9th 10th 11th 12th Overall% % % % % % % %
Gambled for money in the past year -- -- 18.9 -- 30.8 -- 28.2 27.8Gambled for money in the past 30 days -- -- 13.2 -- 24.0 -- 15.5 19.6Bet on sporting events in the past year -- -- 37.7 -- 37.7 -- 33.8 36.7Bought lottery tickets in the past year -- -- 18.9 -- 30.8 -- 28.2 27.8Bet money using the internet in the past year -- -- 5.7 -- 2.7 -- 4.2 3.7Bet money on table games in the past year -- -- 13.2 -- 26.7 -- 23.9 23.3
Note: The symbol “--” indicates that data are not available because students were not surveyed.
Table 46. Percentage of Youth Reporting Gambling or Gambling-Related Problems,Pennsylvania Statewide 2011
6th 7th 8th 9th 10th 11th 12th Overall% % % % % % % %
Gambled for money in the past year 7.9 -- 13.9 -- 17.6 -- 20.8 15.3Gambled for money in the past 30 days 4.9 -- 7.9 -- 9.5 -- 12.6 8.8Bet on sporting events in the past year 13.5 -- 20.1 -- 23.0 -- 25.0 20.6Bought lottery tickets in the past year 10.9 -- 11.9 -- 13.2 -- 20.1 14.1Bet money using the internet in the past year 2.7 -- 3.7 -- 3.7 -- 3.7 3.5Bet money on table games in the past year 8.1 -- 12.2 -- 13.4 -- 15.6 12.5
Note: The symbol “--” indicates that data are not available because students were not surveyed.
Symptoms of DepressionA number of scientific studies have identified a link between mental health problems, such as depression,and the use of alcohol, tobacco and other drugs during adolescence. The PAYS includes four questions thatasks students about feelings—sadness, hopelessness and worthlessness—that can be symptoms ofdepression. Results for New Hope-Solebury School District students are presented in Table 47, andcomparison data from the statewide survey are presented in Table 48.

New Hope-Solebury School District Report 2011 Pennsylvania Youth Survey- 43 -
Table 47. Percentage of Youth Reporting Symptoms of Depression, New Hope-Solebury SchoolDistrict 2011
6th 7th 8th 9th 10th 11th 12th Overall% % % % % % % %
In the past year, felt depressed or sad most days -- -- 22.6 -- 16.4 -- 28.2 20.7Sometimes I think that life is not worth it -- -- 25.0 -- 11.0 -- 16.9 15.2At times I think I am no good at all -- -- 26.4 -- 18.5 -- 26.8 22.2All in all, I am inclined to think that I am a failure -- -- 17.0 -- 11.0 -- 12.7 12.6
Note: The numbers reported in this table represent the percentage of students who answered either “yes” or “Yes!” to each question. The symbol “--” indicatesthat data are not available because students were not surveyed.
Table 48. Percentage of Youth Reporting Symptoms of Depression, Pennsylvania Statewide2011
6th 7th 8th 9th 10th 11th 12th Overall% % % % % % % %
In the past year, felt depressed or sad most days 27.6 -- 30.1 -- 32.8 -- 33.4 31.1Sometimes I think that life is not worth it 15.0 -- 20.2 -- 21.7 -- 20.4 19.4At times I think I am no good at all 23.0 -- 27.3 -- 31.2 -- 29.6 28.0All in all, I am inclined to think that I am a failure 10.2 -- 13.0 -- 14.1 -- 13.7 12.9
Note: The numbers reported in this table represent the percentage of students who answered either “yes” or “Yes!” to each question. The symbol “--” indicatesthat data are not available because students were not surveyed.


New Hope-Solebury School District Report 2011 Pennsylvania Youth Survey- 45 -
Section 5: Risk and Protective Factors
IntroductionJust as eating a high-fat diet is a risk factor for heart disease and getting regular exercise is a protectivefactor for heart disease and other health problems, there are factors that can help protect youth from, or putthem at risk for, drug use and other problem behaviors.
Protective factors, also known as “assets,” are conditions that buffer children and youth from exposure torisk by either reducing the impact of the risks or changing the way that young people respond to risks.Protective factors identified through research include strong bonding to family, school, community andpeers. These groups support the development of healthy behaviors for children by setting andcommunicating healthy beliefs and clear standards for children’s behavior. Young people are more likelyto follow the standards for behavior set by these groups if the bonds are strong. Strong bonds areencouraged by providing young people with opportunities to make meaningful contributions, by teachingthem the skills they need to be successful in these new opportunities, and by recognizing theircontributions.
Risk factors are conditions that increase the likelihood of a young person becoming involved in drug use,delinquency, school dropout and/or violence. For example, children living in families with poor parentalmonitoring are more likely to become involved in these problems.
Research during the past 30 years supports the view that delinquency; alcohol, tobacco and other drug use;school achievement; and other important outcomes in adolescence are associated with specificcharacteristics in the student’s community, school and family environments, as well as with characteristicsof the individual (Hawkins, Catalano & Miller, 1992). In fact, these characteristics have been shown to bemore important in understanding these behaviors than ethnicity, income or family structure (Blum et al.,2000).
There is a substantial amount of research showing that adolescents’ exposure to a greater number of riskfactors is associated with more drug use and delinquency. There is also evidence that exposure to anumber of protective factors is associated with lower prevalence of these problem behaviors (Bry,McKeon & Pandina, 1982; Newcomb, Maddahian & Skager, 1987; Newcomb & Felix-Ortiz, 1992;Newcomb, 1995; Pollard et al., 1999).
Section 5Risk and Protective Factors

New Hope-Solebury School District Report 2011 Pennsylvania Youth Survey- 46 -
The analysis of risk and protective factors is the most powerful tool available for understanding whatpromotes both positive and negative adolescent behavior and for helping design successful preventionprograms for young people. To promote positive development and prevent problem behavior, it isnecessary to address the factors that predict these outcomes. By measuring these risk and protectivefactors, specific factors that are elevated should be prioritized in the community. This process also helps inselecting targeted tested-effective prevention programming shown to address those elevated factors andconsequently provide the greatest likelihood for success.
This system of risk and protective factors is organized into a strategy that families can use to help childrendevelop healthy behaviors—the Social Development Strategy (Hawkins, Catalano & Associates, 1992).The Social Development Strategy is a theoretical framework that organizes risk and protective factors foradolescent problem behavior prevention.
MeasurementThe Communities That Care Youth Survey, the survey upon which the PAYS was based, provides the mostcomprehensive measurement of risk and protective factors currently available for 6th to 12th graders. Riskand protective factors are measured by sets of survey items called scales. All together, the PAYS assesses22 risk factor and nine protective factor scales across four domains: Community Domain, Family Domain,School Domain, and Peer and Individual Domain. Please see Appendix for a list of the survey items usedto form each scale.
Risk and protective factor scales are scored against the Communities That Care normative database. Likethe scoring systems used by many national testing programs—such as the SAT® and ACT™—this methodgenerates percentile scores ranging from 0 to 100. A score of 50, which matches the normative median,indicates that 50% of the respondents in the normative sample reported a score that is lower than theaverage for New Hope-Solebury School District and 50% reported a score that is higher. Similarly, a scoreof 75 indicates that 75% of the normative sample reported a lower score and 25% reported a higher score.Because risk is associated with negative behavioral outcomes, it is better to have lower risk factor scalescores, not higher. Conversely, because protective factors are associated with better behavioral outcomes,it is better to have higher protective factor scale scores, not lower.
The Communities That Care normative database contains survey responses from over 280,000 students ingrades 6 through 12. It compiled by combining the results of selected Communities That Care YouthSurvey efforts conducted in 2000, 2001 and 2002. To enhance representativeness, statistical weights wereapplied to adjust the sample to exactly match the population of U.S. public school students on four keydemographic variables: ethnicity, sex, socioeconomic status and urbanicity. Information on the U.S. publicschool student population was obtained from the Common Core of Data program at the U.S. Departmentof Education’s National Center for Education Statistics.
The risk and protective factor measurement and scoring model employed in the 2011 PAYS is identical tothe 2009 model and nearly identical to the 2007 model, with the only difference being that the risk factorscale Laws and Norms Favorable to Handguns is not included in this year's survey. Please note that anumber of changes to the model were introduced in 2007. Please see your 2007 report for a description ofthese changes. Also note that some school districts elected to administer a secondary version of the PAYSthat excluded questions measuring risk and protective factors within the family. In these cases, scale scoresfor the Family Domain risk and protective factors are not available.

New Hope-Solebury School District Report 2011 Pennsylvania Youth Survey- 47 -
Results SummaryOverall Results
Overall risk and protective factor scale scores are presented in Graphs 3 and 4. These results provide ageneral description of the prevention needs of New Hope-Solebury School District 8th, 10th and 12th
graders as a whole.
As Graph 3 shows, overall percentile scores across the six protective factor scales range from a low of 35to a high of 71, with an average score of 57, which is seven points higher than the normative average of50. The two lowest overall scores were for the following protective factor scales: Religiosity (35) andCommunity Opportunities for Prosocial Involvement (49). While policies that target any protective factorcould potentially be an important resource for students in New Hope-Solebury School District, focusingprevention planning in these areas could be especially beneficial. New Hope-Solebury School Districtstudents reported the two highest overall scores for the following protective factor scales: School Rewardsfor Prosocial Involvement (71) and School Opportunities for Prosocial Involvement (64). The higherscores reported by students in these areas represent strengths that New Hope-Solebury School District canbuild on.
As Graph 4 shows, overall scores across the 18 risk factor scales range from a low of 27 to a high of 57,with an average score of 45, which is five points lower than the normative average of 50. The two highestrisk factor scales are Parental Attitudes Favorable toward Antisocial Behavior (57) and Parental AttitudesFavorable toward ATOD Use (56). Once again, while policies that target any risk factor could potentiallybe an important resource for students in New Hope-Solebury School District, directing preventionprogramming in these areas is likely to be especially beneficial. The two lowest risk factor scales are EarlyInitiation of Drug Use (27) and Poor Academic Performance (28). The lower scores reported by studentsin these areas represent strengths that New Hope-Solebury School District can build on.

New Hope-Solebury School District Report 2011 Pennsylvania Youth Survey- 48 -
Graph 3. Overall Protective Factor Scale Scores, 2011
Graph 4. Overall Risk Factor Scale Scores, 2011

New Hope-Solebury School District Report 2011 Pennsylvania Youth Survey- 49 -
Grade-Level ResultsWhile overall scores provide a general picture of the risk and protective factor profile for New Hope-Solebury School District, they can mask problems within individual grades. Tables 49 and 50 presentindividual-grade data for risk and protective factor scale scores. This detailed information providesprevention planners with a snapshot revealing which risk and protective factor scales are of greatestconcern by grade. It allows those prevention planners to focus on the most appropriate points in youthdevelopment for preventive intervention action—and to target their prevention efforts as precisely aspossible.
For example, younger students tend to report different factors than older students as being the mostelevated or suppressed. New Hope-Solebury School District 8th graders reported their five highest levels ofrisk for Perceived Availability of Drugs (59), Parental Attitudes Favorable toward Antisocial Behavior(58), Community Disorganization (53), Laws and Norms Favorable to Drug Use (49) and Lack ofCommitment to School (49). New Hope-Solebury School District 12th graders reported their four highestlevels of risk for Peer Rewards for Antisocial Behavior (68), Community Disorganization (61), LowPerceived Risks of Drug Use (61) and Parental Attitudes Favorable toward Antisocial Behavior (59).
Comparisons to Pennsylvania StatewideAdditional insight into the protective factor profile for New Hope-Solebury School District can be gainedthrough a comparison to results from Pennsylvania statewide. Table 51 presents protective factor scalescores for Pennsylvania statewide. The differences between profiles from New Hope-Solebury SchoolDistrict and Pennsylvania statewide can be summarized by comparing the average protective factor scalescore within each grade level. As the bottom rows of Tables 49 and 51 show, students in New Hope-Solebury School District reported a higher average level of protection than students in Pennsylvaniastatewide as a whole. This trend is particularly pronounced in the 12th grade, where New Hope-SoleburySchool District students reported an average protection score that was notably higher than theirPennsylvania statewide counterparts (62 for New Hope-Solebury School District versus 53 forPennsylvania statewide). Across the six protective factor scales, the most pronounced differences inaverage levels of protection were for the following three scales: Community Opportunities for ProsocialInvolvement, Religiosity and Community Rewards for Prosocial Involvement.
Table 52 presents grade-level risk factor scale scores for Pennsylvania statewide. Like the protectivefactors, the differences between New Hope-Solebury School District and Pennsylvania statewide are bestsummarized by comparing the average risk factor scale score within each grade level. As the bottom rowsof Tables 50 and 52 show, there is no clear pattern of grade-level differences in average risk betweenstudents in New Hope-Solebury School District and students in Pennsylvania statewide as a whole. Acrossthe 16 risk factor scales, the most pronounced differences in average levels of risk were for the followingthree scales: Community Disorganization, Poor Academic Performance and Perceived Availability ofHandguns.

New Hope-Solebury School District Report 2011 Pennsylvania Youth Survey- 50 -
Table 49. Protective Factor Scale Scores, New Hope-Solebury School District 20116th 7th 8th 9th 10th 11th 12th Overall
CommunityDomain
Community Opportunities for Prosocial Involvement -- -- 52 -- 44 -- 55 49
Community Rewards for Prosocial Involvement -- -- 45 -- 61 -- 70 60
FamilyDomain
Family Attachment -- -- -- -- -- -- -- --
Family Opportunities for Prosocial Involvement -- -- -- -- -- -- -- --Family Rewards for Prosocial Involvement -- -- -- -- -- -- -- --
SchoolDomain
School Opportunities for Prosocial Involvement -- -- 54 -- 61 -- 78 64
School Rewards for Prosocial Involvement -- -- 56 -- 75 -- 77 71
Peer andIndividualDomain
Religiosity -- -- 44 -- 31 -- 35 35
Belief in the Moral Order -- -- 59 -- 63 -- 56 61
Average -- -- 52 -- 56 -- 62 57
Table 50. Risk Factor Scale Scores, New Hope-Solebury School District 20116th 7th 8th 9th 10th 11th 12th Overall
CommunityDomain
Low Neighborhood Attachment -- -- 47 -- 37 -- 35 38
Community Disorganization -- -- 53 -- 46 -- 61 52Transitions and Mobility -- -- 40 -- 33 -- 53 39Laws and Norms Favorable to Drug Use -- -- 49 -- 55 -- 53 53Perceived Availability of Drugs -- -- 59 -- 53 -- 57 55Perceived Availability of Handguns -- -- 48 -- 39 -- 46 43
FamilyDomain
Poor Family Management -- -- -- -- -- -- -- --
Family Conflict -- -- -- -- -- -- -- --
Family History of Antisocial Behavior -- -- -- -- -- -- -- --Parental Attitudes Favorable toward ATOD Use -- -- 41 -- 63 -- 53 56Parental Attitudes Favorable toward AntisocialBehavior -- -- 58 -- 56 -- 59 57
SchoolDomain
Poor Academic Performance -- -- 30 -- 28 -- 29 28
Lack of Commitment to School -- -- 49 -- 43 -- 52 47
Peer andIndividualDomain
Rebelliousness -- -- 36 -- 46 -- 45 44
Friends’ Delinquent Behavior -- -- 38 -- 34 -- 39 36Friends’ Use of Drugs -- -- 32 -- 45 -- 47 42Peer Rewards for Antisocial Behavior -- -- 40 -- 52 -- 68 53Favorable Attitudes toward Antisocial Behavior -- -- 45 -- 35 -- 53 42Favorable Attitudes toward ATOD Use -- -- 43 -- 50 -- 58 51Low Perceived Risks of Drug Use -- -- 42 -- 58 -- 61 54Early Initiation of Drug Use -- -- 26 -- 27 -- 31 27Sensation Seeking -- -- 44 -- 35 -- 49 41
Average -- -- 43 -- 44 -- #50 45

New Hope-Solebury School District Report 2011 Pennsylvania Youth Survey- 51 -
Table 51. Protective Factor Scale Scores, Pennsylvania Statewide 20116th 7th 8th 9th 10th 11th 12th Overall
CommunityDomain
Community Opportunities for Prosocial Involvement 31 -- 38 -- 40 -- 40 37
Community Rewards for Prosocial Involvement 51 -- 52 -- 54 -- 53 53
FamilyDomain
Family Attachment 59 -- 57 -- 57 -- 53 56
Family Opportunities for Prosocial Involvement 54 -- 54 -- 54 -- 52 54Family Rewards for Prosocial Involvement 54 -- 55 -- 55 -- 52 54
SchoolDomain
School Opportunities for Prosocial Involvement 62 -- 63 -- 61 -- 59 61
School Rewards for Prosocial Involvement 63 -- 64 -- 67 -- 64 64
Peer andIndividualDomain
Religiosity 40 -- 44 -- 45 -- 43 43
Belief in the Moral Order 63 -- 63 -- 62 -- 59 62
Average 53 -- 54 -- 55 -- 53 54
Table 52. Risk Factor Scale Scores, Pennsylvania Statewide 20116th 7th 8th 9th 10th 11th 12th Overall
CommunityDomain
Low Neighborhood Attachment 43 -- 45 -- 45 -- 44 44
Community Disorganization 75 -- 64 -- 66 -- 70 69Transitions and Mobility 44 -- 47 -- 44 -- 48 46Laws and Norms Favorable to Drug Use 47 -- 45 -- 49 -- 53 49Perceived Availability of Drugs 51 -- 51 -- 48 -- 49 49Perceived Availability of Handguns 57 -- 56 -- 51 -- 49 53
FamilyDomain
Poor Family Management 43 -- 43 -- 44 -- 45 44
Family Conflict 47 -- 51 -- 50 -- 53 50
Family History of Antisocial Behavior 39 -- 43 -- 39 -- 44 41Parental Attitudes Favorable toward ATOD Use 45 -- 44 -- 47 -- 48 46Parental Attitudes Favorable toward AntisocialBehavior 55 -- 52 -- 54 -- 58 55
SchoolDomain
Poor Academic Performance 41 -- 38 -- 41 -- 41 40
Lack of Commitment to School 43 -- 43 -- 46 -- 45 44
Peer andIndividualDomain
Rebelliousness 35 -- 37 -- 40 -- 41 38
Friends’ Delinquent Behavior 41 -- 40 -- 41 -- 42 41Friends’ Use of Drugs 42 -- 38 -- 38 -- 40 39Peer Rewards for Antisocial Behavior 42 -- 40 -- 47 -- 54 46Favorable Attitudes toward Antisocial Behavior 44 -- 42 -- 44 -- 43 43Favorable Attitudes toward ATOD Use 44 -- 42 -- 45 -- 46 44Low Perceived Risks of Drug Use 51 -- 47 -- 53 -- 55 52Early Initiation of Drug Use 38 -- 35 -- 34 -- 36 36Sensation Seeking 42 -- 42 -- 41 -- 42 42
Average 46 -- 45 -- 46 -- #48 46

New Hope-Solebury School District Report 2011 Pennsylvania Youth Survey- 52 -
Protective FactorsProtective factors are characteristics that are known to decrease the likelihood that a student will engage inproblem behaviors. For example, bonding to parents reduces the risk of an adolescent engaging in problembehaviors.
The Social Development Strategy organizes the research on protective factors. Protective factors canbuffer young people from risks and promote positive youth development. To develop these healthypositive behaviors, young people must be immersed in environments that consistently communicatehealthy beliefs and clear standards for behavior; that foster the development of strong bonds to membersof their family, school and community; and that recognize the individual characteristics of each youngperson.
Community Opportunities for Prosocial InvolvementWhen young people become involved in their communities byparticipating in activities and organizations that foster healthydevelopment, they are more likely to form connections withprosocial peers. Community involvement also provides theopportunity to bond with adult role models—such as neighbors,police, clergy and other community leaders—who can give moralguidance and emotional support. This protective factor ismeasured by survey items such as “Which of the followingactivities for people your age are available in your community:Sports teams, Scouting, Boys and girls clubs, 4-H clubs, ServiceClubs?”
■ Overall, New Hope-Solebury School District students received a percentile score of 49 on theCommunity Opportunities for Prosocial Involvement scale, one point lower than thenormative average of 50.
■ Across grade levels, percentile scores for Community Opportunities for ProsocialInvolvement range from a low of 44 among 10th graders to a high of 55 among 12th graders.
■ Overall, New Hope-Solebury School District students received a percentile score of 49 on theCommunity Opportunities for Prosocial Involvement scale, 12 points higher than thestatewide score of 37.
Community Rewards for Prosocial InvolvementYoung people experience bonding as feeling valued and beingseen as an asset. Students who feel recognized and rewarded bytheir community are less likely to engage in negative behaviors,because that recognition helps increase a student’s self-esteem andthe feeling of bondedness to that community. Community Rewardsfor Prosocial Involvement is measured by such items as “Thereare people in my neighborhood who are proud of me when I dosomething well.”
■ Overall, New Hope-Solebury School District studentsreceived a percentile score of 60 on the CommunityRewards for Prosocial Involvement scale, 10 pointshigher than the normative average of 50.

New Hope-Solebury School District Report 2011 Pennsylvania Youth Survey- 53 -
■ Across grade levels, percentile scores for Community Rewards for Prosocial Involvementrange from a low of 45 among 8th graders to a high of 70 among 12th graders.
■ Overall, New Hope-Solebury School District students received a percentile score of 60 on theCommunity Rewards for Prosocial Involvement scale, seven points higher than the statewidescore of 53.
Family AttachmentOne of the most effective ways to buffer children against riskfactors is to strengthen their bonds with family members whoembody healthy beliefs and clear standards. If children areattached to their parents and want to please them, they will be lesslikely to threaten that connection by doing things that their parentsstrongly disapprove of. This protective factor is measured by suchitems on the survey as “Do you share your thoughts and feelingswith your mother?”
■ This scale was not included in the New Hope-SoleburySchool District survey.
Family Opportunities for Prosocial InvolvementWhen students have the opportunity to make meaningfulcontributions to their families, they feel closer to their familymembers and are less likely to get involved in risky behaviors.These opportunities for involvement reinforce family bonds andcause students to more easily adopt the norms projected by theirfamilies. For instance, children whose parents have highexpectations for their school success and achievement are lesslikely to drop out of school. This protective factor is surveyed bysuch items as “My parents ask me what I think before most familydecisions affecting me are made.”
■ This scale was not included in the New Hope-SoleburySchool District survey.

New Hope-Solebury School District Report 2011 Pennsylvania Youth Survey- 54 -
Family Rewards for Prosocial InvolvementWhen family members reward their children for positiveparticipation in activities, it further strengthens the bonds thechildren feel to their families, and helps promote clear standardsfor behavior. This protective factor is measured by such surveyitems as “How often do your parents tell you they’re proud of youfor something you’ve done?”
■ This scale was not included in the New Hope-SoleburySchool District survey.
School Opportunities for Prosocial InvolvementGiving students opportunities to participate in important activitiesat school helps to create a feeling of personal investment in theirschool. This results in greater bonding and adoption of theschool’s standards of behavior, reducing the likelihood that theywill become involved in problem behaviors. This protective factoris measured by survey items such as “In my school, students havelots of chances to help decide things like class activities andrules.”
■ Overall, New Hope-Solebury School District studentsreceived a percentile score of 64 on the SchoolOpportunities for Prosocial Involvement scale, 14 pointshigher than the normative average of 50.
■ Across grade levels, percentile scores for School Opportunities for Prosocial Involvementrange from a low of 54 among 8th graders to a high of 78 among 12th graders.
■ Overall, New Hope-Solebury School District students received a percentile score of 64 on theSchool Opportunities for Prosocial Involvement scale, three points higher than the statewidescore of 61.
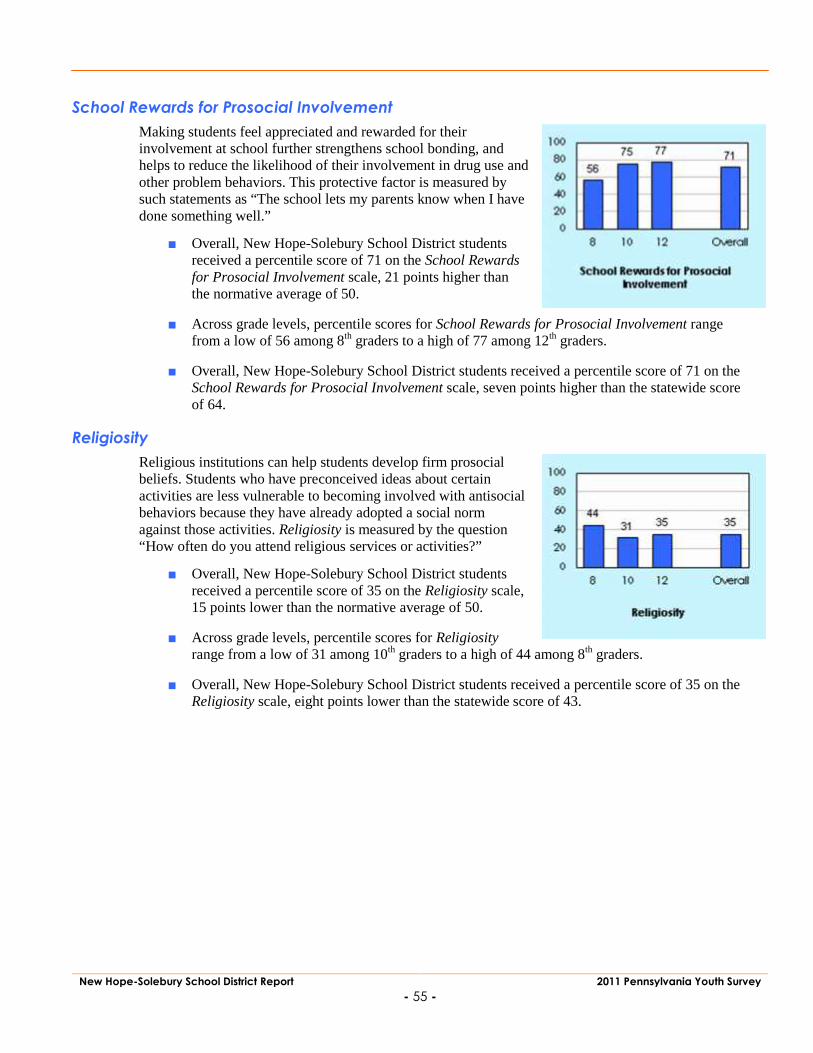
New Hope-Solebury School District Report 2011 Pennsylvania Youth Survey- 55 -
School Rewards for Prosocial InvolvementMaking students feel appreciated and rewarded for theirinvolvement at school further strengthens school bonding, andhelps to reduce the likelihood of their involvement in drug use andother problem behaviors. This protective factor is measured bysuch statements as “The school lets my parents know when I havedone something well.”
■ Overall, New Hope-Solebury School District studentsreceived a percentile score of 71 on the School Rewardsfor Prosocial Involvement scale, 21 points higher thanthe normative average of 50.
■ Across grade levels, percentile scores for School Rewards for Prosocial Involvement rangefrom a low of 56 among 8th graders to a high of 77 among 12th graders.
■ Overall, New Hope-Solebury School District students received a percentile score of 71 on theSchool Rewards for Prosocial Involvement scale, seven points higher than the statewide scoreof 64.
ReligiosityReligious institutions can help students develop firm prosocialbeliefs. Students who have preconceived ideas about certainactivities are less vulnerable to becoming involved with antisocialbehaviors because they have already adopted a social normagainst those activities. Religiosity is measured by the question“How often do you attend religious services or activities?”
■ Overall, New Hope-Solebury School District studentsreceived a percentile score of 35 on the Religiosity scale,15 points lower than the normative average of 50.
■ Across grade levels, percentile scores for Religiosityrange from a low of 31 among 10th graders to a high of 44 among 8th graders.
■ Overall, New Hope-Solebury School District students received a percentile score of 35 on theReligiosity scale, eight points lower than the statewide score of 43.

New Hope-Solebury School District Report 2011 Pennsylvania Youth Survey- 56 -
Belief in the Moral OrderWhen people feel bonded to society, they are more motivated tofollow society’s standards and expectations. Therefore, it isimportant for families, schools and communities to have clearlystated policies on ATOD use. Young people who have developeda positive belief system, and a clear sense of right and wrong, areless likely to become involved in problem behaviors. For example,young people who believe that drug use is wrong might beprotected against peer influences to use drugs. Belief in the MoralOrder is measured by items on the survey such as “It is all right tobeat up people if they start the fight.”
■ Overall, New Hope-Solebury School District studentsreceived a percentile score of 61 on the Belief in the Moral Order scale, 11 points higher thanthe normative average of 50.
■ Across grade levels, percentile scores for Belief in the Moral Order range from a low of 56among 12th graders to a high of 63 among 10th graders.
■ Overall, New Hope-Solebury School District students received a percentile score of 61 on theBelief in the Moral Order scale, one point lower than the statewide score of 62.
Risk FactorsRisk factors are characteristics in the community, family, school and individual’s environments that areknown to increase the likelihood that a student will engage in one or more problem behaviors. Forexample, a risk factor in the community environment is the existence of laws and norms favorable to druguse, which can affect the likelihood that a young person will try alcohol, tobacco or other drugs. In thosecommunities where there is acceptance or tolerance of drug use, students are more likely to engage inalcohol, tobacco and other drug use.
Low Neighborhood AttachmentHigher rates of drug problems, delinquency and violence occur incommunities or neighborhoods where people feel little attachmentto the community. Perhaps the most significant issue affectingcommunity attachment is whether residents feel they can make adifference in their own lives. If the key players in theneighborhood—such as merchants, teachers, clergy, police andsocial services personnel—live outside the neighborhood,residents’ sense of commitment will be lower. This low sense ofcommitment may be reflected in lower rates of voter participationand parental involvement in schools.
The Low Neighborhood Attachment scale on the survey uses threeitems to measure the level of attachment that students feel to their neighborhoods. This risk factor ismeasured by items such as “I’d like to get out of my neighborhood” and “If I had to move, I would missthe neighborhood I now live in.”
■ Overall, New Hope-Solebury School District students received a percentile score of 38 on theLow Neighborhood Attachment scale, 12 points lower than the normative average of 50.

New Hope-Solebury School District Report 2011 Pennsylvania Youth Survey- 57 -
■ Across grade levels, percentile scores for Low Neighborhood Attachment range from a low of35 among 12th graders to a high of 47 among 8th graders.
■ Overall, New Hope-Solebury School District students received a percentile score of 38 on theLow Neighborhood Attachment scale, six points lower than the statewide score of 44.
Community DisorganizationThe Community Disorganization scale pertains to students’feelings and perceptions regarding their communities and otherexternal attributes. It is based on students’ responses to five items,four of which indicate a neighborhood in disarray (e.g., theexistence of graffiti, abandoned buildings, fighting and drugselling). The fifth item is “I feel safe in my neighborhood.”
■ Overall, New Hope-Solebury School District studentsreceived a percentile score of 52 on the CommunityDisorganization scale, two points higher than thenormative average of 50.
■ Across grade levels, percentile scores for Community Disorganization range from a low of 46among 10th graders to a high of 61 among 12th graders.
■ Overall, New Hope-Solebury School District students received a percentile score of 52 on theCommunity Disorganization scale, 17 points lower than the statewide score of 69.
Transitions and MobilityEven normal school transitions are associated with an increase inproblem behaviors. When children move from elementary schoolto middle school or from middle school to high school, significantincreases in the rates of drug use, school dropout and antisocialbehavior may occur. This is thought to occur because by making atransition to a new environment, students no longer have thebonds they had in their old environment. Consequently, studentsmay be less likely to become attached to their schools andneighborhoods, and do not develop the bonds that protect themfrom involvement in problem behaviors.
The Transitions and Mobility scale on the survey measures howoften the student has changed homes or schools in the past year and since kindergarten. This risk factor ismeasured with items such as “How many times have you changed schools (including changing fromelementary to middle and middle to high school) since kindergarten?” and “How many times have youchanged homes since kindergarten?”
■ Overall, New Hope-Solebury School District students received a percentile score of 39 on theTransitions and Mobility scale, 11 points lower than the normative average of 50.
■ Across grade levels, percentile scores for Transitions and Mobility range from a low of 33among 10th graders to a high of 53 among 12th graders.
■ Overall, New Hope-Solebury School District students received a percentile score of 39 on theTransitions and Mobility scale, seven points lower than the statewide score of 46.

New Hope-Solebury School District Report 2011 Pennsylvania Youth Survey- 58 -
Laws and Norms Favorable to Drug UseStudents’ perceptions of the rules and regulations concerningalcohol, tobacco and other drug use that exist in theirneighborhoods are also associated with problem behaviors inadolescence. Community norms—the attitudes and policies acommunity holds in relation to drug use and other antisocialbehaviors—are communicated in a variety of ways: through lawsand written policies, through informal social practices and throughthe expectations parents and other members of the communityhave of young people. When laws and community standards arefavorable toward drug use, violence and/or other crime, or evenwhen they are just unclear, young people are more likely toengage in negative behaviors (Bracht and Kingsbury, 1990).
An example of conflicting messages about drug use can be found in the acceptance of alcohol use as asocial activity within the community. The beer gardens popular at street fairs and community festivals arein contrast to the “Just Say No” messages that schools and parents may be promoting. These conflictingand ambiguous messages are problematic in that they do not have the positive impact on preventingalcohol and other drug use that a clear, consistent, community-level, anti-drug message can have.
This risk factor is measured by six items on the survey, such as “How wrong would most adults in yourneighborhood think it was for kids your age to drink alcohol?” and “If a kid smoked marijuana in yourneighborhood, would he or she be caught by the police?”
■ Overall, New Hope-Solebury School District students received a percentile score of 53 on theLaws and Norms Favorable to Drug Use scale, three points higher than the normativeaverage of 50.
■ Across grade levels, percentile scores for Laws and Norms Favorable to Drug Use rangefrom a low of 49 among 8th graders to a high of 55 among 10th graders.
■ Overall, New Hope-Solebury School District students received a percentile score of 53 on theLaws and Norms Favorable to Drug Use scale, four points higher than the statewide score of49.

New Hope-Solebury School District Report 2011 Pennsylvania Youth Survey- 59 -
Perceived Availability of DrugsThe perceived availability of drugs, alcohol and handguns in acommunity is directly related to the prevalence of delinquentbehaviors. In schools where children believe that drugs are moreavailable, a higher rate of drug use occurs.
The Perceived Availability of Drugs scale on the survey isdesigned to assess students’ feelings about how easily they can getalcohol, tobacco and other drugs. Elevation of this risk factor scalemay indicate the need to make alcohol, tobacco and other drugsmore difficult for students to acquire. For instance, a number ofpolicy changes have been shown to reduce the availability ofalcohol and cigarettes. Minimum-age requirements, taxation andresponsible beverage service have all been shown to affect the perception of availability of alcohol.
This risk factor is measured by four items on the survey, such as “If you wanted to get some marijuana,how easy would it be for you to get some?”
■ Overall, New Hope-Solebury School District students received a percentile score of 55 on thePerceived Availability of Drugs scale, five points higher than the normative average of 50.
■ Across grade levels, percentile scores for Perceived Availability of Drugs range from a low of53 among 10th graders to a high of 59 among 8th graders.
■ Overall, New Hope-Solebury School District students received a percentile score of 55 on thePerceived Availability of Drugs scale, six points higher than the statewide score of 49.
Perceived Availability of HandgunsIf students believe that it would be difficult to get a handgun, theyare less likely to become involved with the unauthorized andunsupervised use of firearms. Perceived Availability of Handgunsis measured by the question “If you wanted to get a handgun, howeasy would it be for you to get one?”
■ Overall, New Hope-Solebury School District studentsreceived a percentile score of 43 on the PerceivedAvailability of Handguns scale, seven points lower thanthe normative average of 50.
■ Across grade levels, percentile scores for PerceivedAvailability of Handguns range from a low of 39 among 10th graders to a high of 48 among 8th
graders.
■ Overall, New Hope-Solebury School District students received a percentile score of 43 on thePerceived Availability of Handguns scale, 10 points lower than the statewide score of 53.

New Hope-Solebury School District Report 2011 Pennsylvania Youth Survey- 60 -
Poor Family ManagementThe risk factor scale Poor Family Management measures twocomponents of family life: “poor family supervision,” which isdefined as parents failing to supervise and monitor their children,and “poor family discipline,” which is defined as parents failing tocommunicate clear expectations for behavior and givingexcessively severe, harsh or inconsistent punishment. Childrenwho experience poor family supervision and poor familydiscipline are at higher risk of developing problems with drug use,delinquency, violence and school dropout.
Sample items used to survey Poor Family Management include“Would your parents know if you did not come home on time?”and “My family has clear rules about alcohol and drug use.”
■ This scale was not included in the New Hope-Solebury School District survey.
Family ConflictBonding between family members, especially between childrenand their parents or guardians, is a key component in thedevelopment of positive social norms. High levels of familyconflict interfere with the development of these bonds, andincrease the likelihood that young people will engage in illegaldrug use and other forms of delinquent behavior.
Family Conflict is measured by four items on the survey, such as“People in my family often insult or yell at each other.”
■ This scale was not included in the New Hope-SoleburySchool District survey.

New Hope-Solebury School District Report 2011 Pennsylvania Youth Survey- 61 -
Family History of Antisocial BehaviorIf children are raised in a family where a history of addiction toalcohol or other drugs exists, the risk of their having alcohol orother drug problems themselves increases. If children are born orraised in a family where criminal activity or behavior is normal,their risk for delinquency increases. Similarly, children who areborn to a teenage mother are more likely to become teen parents,and children of dropouts are more likely to drop out of schoolthemselves. Children whose parents engage in violent behaviorinside or outside the home are at greater risk for exhibiting violentbehavior themselves. Students’ perceptions of their families’behavior and standards regarding drug use and other antisocialbehaviors are measured by the survey. Family History ofAntisocial Behavior is assessed by items such as “Has anyone in your family ever had a severe alcohol ordrug problem?”
■ This scale was not included in the New Hope-Solebury School District survey.
Parental Attitudes Favorable toward ATOD UseStudents’ perceptions of their parents’ opinions about alcohol,tobacco and other drug use are an important risk factor. Infamilies where parents use illegal drugs, are heavy users ofalcohol or are tolerant of use by their children, children are morelikely to become drug users in adolescence. Parental AttitudesFavorable toward ATOD Use is measured by survey items suchas “How wrong do your parents feel it would be for you to smokemarijuana?”
■ Overall, New Hope-Solebury School District studentsreceived a percentile score of 56 on the ParentalAttitudes Favorable toward ATOD Use scale, six pointshigher than the normative average of 50.
■ Across grade levels, percentile scores for Parental Attitudes Favorable toward ATOD Userange from a low of 41 among 8th graders to a high of 63 among 10th graders.
■ Overall, New Hope-Solebury School District students received a percentile score of 56 on theParental Attitudes Favorable toward ATOD Use scale, 10 points higher than the statewidescore of 46.

New Hope-Solebury School District Report 2011 Pennsylvania Youth Survey- 62 -
Parental Attitudes Favorable toward Antisocial BehaviorStudents’ perceptions of their parents’ opinions about antisocialbehavior are also an important risk factor. Parental attitudes andbehavior regarding crime and violence influence the attitudes andbehavior of children. If parents approve of or excuse their childrenfor breaking the law, then the children are more likely to developproblems with juvenile delinquency. Parental Attitudes Favorabletoward Antisocial Behavior is measured by survey items such as“How wrong do your parents feel it would be for you to pick afight with someone?”
■ Overall, New Hope-Solebury School District studentsreceived a percentile score of 57 on the ParentalAttitudes Favorable toward Antisocial Behavior scale, seven points higher than the normativeaverage of 50.
■ Across grade levels, percentile scores for Parental Attitudes Favorable toward AntisocialBehavior range from a low of 56 among 10th graders to a high of 59 among 12th graders.
■ Overall, New Hope-Solebury School District students received a percentile score of 57 on theParental Attitudes Favorable toward Antisocial Behavior scale, two points higher than thestatewide score of 55.
Poor Academic PerformanceBeginning in the late elementary grades, poor academicperformance increases the risk of drug use, delinquency, violenceand school dropout. Children fail for many reasons, but it appearsthat the experience of failure increases the risk of these problembehaviors.
Poor Academic Performance—students’ feelings about theirperformance at school—is measured with two questions on thesurvey: “Putting them all together, what were your grades like lastyear?” and “Are your school grades better than the grades of moststudents in your class?” Elevated findings for this risk factor scalesuggest that students believe that they have lower grades thanwould be expected, and they perceive they have below-average grades, compared to their peers.
■ Overall, New Hope-Solebury School District students received a percentile score of 28 on thePoor Academic Performance scale, 22 points lower than the normative average of 50.
■ Across grade levels, percentile scores for Poor Academic Performance range from a low of28 among 10th graders to a high of 30 among 8th graders.
■ Overall, New Hope-Solebury School District students received a percentile score of 28 on thePoor Academic Performance scale, 12 points lower than the statewide score of 40.

New Hope-Solebury School District Report 2011 Pennsylvania Youth Survey- 63 -
Lack of Commitment to SchoolNine items on the survey assess Lack of Commitment to School—astudent’s general feelings about his or her schooling. Survey itemsinclude “How important do you think the things you are learningin school are going to be for your later life?” and “Now, thinkingback over the past year in school, how often did you enjoy beingin school?” Elevated findings for this risk factor scale suggest thatstudents feel less attached to, or connected with, their classes andschool environments. Lack of commitment to school means thechild has ceased to see the role of student as a positive one. Youngpeople who have lost this commitment to school are at higher riskfor a variety of problem behaviors.
■ Overall, New Hope-Solebury School District students received a percentile score of 47 on theLack of Commitment to School scale, three points lower than the normative average of 50.
■ Across grade levels, percentile scores for Lack of Commitment to School range from a low of43 among 10th graders to a high of 52 among 12th graders.
■ Overall, New Hope-Solebury School District students received a percentile score of 47 on theLack of Commitment to School scale, three points higher than the statewide score of 44.
RebelliousnessThe survey also assesses the number of young people who feelthey are not part of society, who feel they are not bound by rules,and who don’t believe in trying to be successful or responsible.These students are at higher risk of drug use, delinquency andschool dropout. Rebelliousness is measured by three items, suchas “I ignore the rules that get in my way.”
■ Overall, New Hope-Solebury School District studentsreceived a percentile score of 44 on the Rebelliousnessscale, six points lower than the normative average of 50.
■ Across grade levels, percentile scores for Rebelliousnessrange from a low of 36 among 8th graders to a high of 46 among 10th graders.
■ Overall, New Hope-Solebury School District students received a percentile score of 44 on theRebelliousness scale, six points higher than the statewide score of 38.

New Hope-Solebury School District Report 2011 Pennsylvania Youth Survey- 64 -
Friends’ Delinquent BehaviorYoung people who associate with peers who engage in delinquentbehavior are much more likely to engage in delinquent behaviorthemselves. This is one of the most consistent predictors identifiedby research. Even when young people come from well-managedfamilies and do not experience other risk factors, spending timewith peers who engage in delinquent behavior greatly increasesthe risk of their becoming involved in delinquent behavior.Friends’ Delinquent Behavior is measured by survey items suchas “In the past year, how many of your four best friends have beensuspended from school?”
■ Overall, New Hope-Solebury School District studentsreceived a percentile score of 36 on the Friends’ Delinquent Behavior scale, 14 points lowerthan the normative average of 50.
■ Across grade levels, percentile scores for Friends’ Delinquent Behavior range from a low of34 among 10th graders to a high of 39 among 12th graders.
■ Overall, New Hope-Solebury School District students received a percentile score of 36 on theFriends’ Delinquent Behavior scale, five points lower than the statewide score of 41.
Friends’ Use of DrugsYoung people who associate with peers who engage in substanceuse are much more likely to engage in it themselves. This is oneof the most consistent predictors identified by research. Evenwhen young people come from well-managed families and do notexperience other risk factors, spending time with peers who usedrugs greatly increases a youth’s risk of becoming involved insuch behavior. Friends’ Use of Drugs is measured by survey itemssuch as “In the past year, how many of your best friends haveused marijuana?”
■ Overall, New Hope-Solebury School District studentsreceived a percentile score of 42 on the Friends’ Use ofDrugs scale, eight points lower than the normative average of 50.
■ Across grade levels, percentile scores for Friends’ Use of Drugs range from a low of 32among 8th graders to a high of 47 among 12th graders.
■ Overall, New Hope-Solebury School District students received a percentile score of 42 on theFriends’ Use of Drugs scale, three points higher than the statewide score of 39.

New Hope-Solebury School District Report 2011 Pennsylvania Youth Survey- 65 -
Peer Rewards for Antisocial BehaviorStudents’ perceptions of their peer groups’ social norms are alsoan important predictor of involvement in problem behavior. Anyindication that students feel that they get positive feedback fromtheir peers if they use alcohol, tobacco or other drugs, or if theyget involved in delinquent behaviors, is important to note andunderstand. When young people believe that their peer groups areinvolved in antisocial behaviors, they are more likely to becomeinvolved in antisocial behaviors themselves. This risk factor ismeasured by items such as “What are the chances you would beseen as cool if you smoked marijuana?”
■ Overall, New Hope-Solebury School District studentsreceived a percentile score of 53 on the Peer Rewards for Antisocial Behavior scale, threepoints higher than the normative average of 50.
■ Across grade levels, percentile scores for Peer Rewards for Antisocial Behavior range from alow of 40 among 8th graders to a high of 68 among 12th graders.
■ Overall, New Hope-Solebury School District students received a percentile score of 53 on thePeer Rewards for Antisocial Behavior scale, seven points higher than the statewide score of46.
Favorable Attitudes toward Antisocial BehaviorDuring the elementary school years, children usually expressanticrime and prosocial attitudes and have difficulty imaginingwhy people commit crimes or drop out of school. However, inmiddle school, as others they know participate in such activities,their attitudes often shift toward greater acceptance of thesebehaviors. This acceptance places them at higher risk for theseantisocial behaviors.
These attitudes are measured on the survey by items like “Howwrong do you think it is for someone your age to pick a fight withsomeone?”
■ Overall, New Hope-Solebury School District students received a percentile score of 42 on theFavorable Attitudes toward Antisocial Behavior scale, eight points lower than the normativeaverage of 50.
■ Across grade levels, percentile scores for Favorable Attitudes toward Antisocial Behaviorrange from a low of 35 among 10th graders to a high of 53 among 12th graders.
■ Overall, New Hope-Solebury School District students received a percentile score of 42 on theFavorable Attitudes toward Antisocial Behavior scale, one point lower than the statewidescore of 43.

New Hope-Solebury School District Report 2011 Pennsylvania Youth Survey- 66 -
Favorable Attitudes toward ATOD UseDuring the elementary school years, children usually express anti-drug attitudes and have difficulty imagining why people usedrugs. However, in middle school, as others they know participatein such activities, their attitudes often shift toward greateracceptance of these behaviors. This acceptance places them athigher risk. This risk factor scale, Favorable Attitudes towardATOD Use, assesses risk by asking young people how wrong theythink it is for someone their age to use drugs. Survey items used tomeasure this risk factor include “How wrong do you think it is forsomeone your age to drink beer, wine or hard liquor (for example,vodka, whiskey or gin) regularly?” An elevated score for this risk factor scale can indicate that studentssee little wrong with using drugs.
■ Overall, New Hope-Solebury School District students received a percentile score of 51 on theFavorable Attitudes toward ATOD Use scale, one point higher than the normative average of50.
■ Across grade levels, percentile scores for Favorable Attitudes toward ATOD Use range froma low of 43 among 8th graders to a high of 58 among 12th graders.
■ Overall, New Hope-Solebury School District students received a percentile score of 51 on theFavorable Attitudes toward ATOD Use scale, seven points higher than the statewide score of44.
Low Perceived Risks of Drug UseThe perception of harm from drug use is related to bothexperimentation and regular use. The less harm that an adolescentperceives as the result of drug use, the more likely it is that he orshe will use drugs. Low Perceived Risks of Drug Use is measuredwith four survey items, such as “How much do you think peoplerisk harming themselves if they try marijuana once or twice?” Anelevated score can indicate that students are not aware of, or donot comprehend, the possible harm resulting from drug use.
■ Overall, New Hope-Solebury School District studentsreceived a percentile score of 54 on the Low PerceivedRisks of Drug Use scale, four points higher than thenormative average of 50.
■ Across grade levels, percentile scores for Low Perceived Risks of Drug Use range from a lowof 42 among 8th graders to a high of 61 among 12th graders.
■ Overall, New Hope-Solebury School District students received a percentile score of 54 on theLow Perceived Risks of Drug Use scale, two points higher than the statewide score of 52.

New Hope-Solebury School District Report 2011 Pennsylvania Youth Survey- 67 -
Early Initiation of Drug UseThe initiation of alcohol, tobacco or other drug use at an early ageis linked to a number of negative outcomes. The earlier thatexperimentation with drugs begins, the more likely it is thatexperimentation will become consistent, regular use. Earlyinitiation may lead to the use of a greater range of drugs, as wellas other problem behaviors. This scale is measured by surveyitems that ask when drug use began.
■ Overall, New Hope-Solebury School District studentsreceived a percentile score of 27 on the Early Initiationof Drug Use scale, 23 points lower than the normativeaverage of 50.
■ Across grade levels, percentile scores for Early Initiation of Drug Use range from a low of 26among 8th graders to a high of 31 among 12th graders.
■ Overall, New Hope-Solebury School District students received a percentile score of 27 on theEarly Initiation of Drug Use scale, nine points lower than the statewide score of 36.
Sensation SeekingConstitutional factors are individual characteristics that may havea biological or physiological basis. Constitutional factors thatincrease risk are often seen as sensation seeking, low harmavoidance and lack of impulse control. They appear to increasethe risk of young people using drugs, engaging in delinquentbehavior and/or committing violent acts. Sensation Seeking ismeasured by survey items such as “How many times have youdone crazy things even if they are a little dangerous?”
■ Overall, New Hope-Solebury School District studentsreceived a percentile score of 41 on the SensationSeeking scale, nine points lower than the normativeaverage of 50.
■ Across grade levels, percentile scores for Sensation Seeking range from a low of 35 among10th graders to a high of 49 among 12th graders.
■ Overall, New Hope-Solebury School District students received a percentile score of 41 on theSensation Seeking scale, one point lower than the statewide score of 42.


New Hope-Solebury School District Report 2011 Pennsylvania Youth Survey- 69 -
Appendix A: Risk and Protective Factor Scale Construction Summary
Appendix ARisk and Protective FactorScale Construction Summary

New Hope-Solebury School District Report 2011 Pennsylvania Youth Survey- 70 -
Community Domain ScalesRISK FACTORS
CO
MM
UNITY
DOM
AIN
Low Neighborhood Attachment
Q109 I’d like to get out of my neighborhood.
Q102 I like my neighborhood.
Q100 If I had to move, I would miss the neighborhood I now live in.
Community Disorganization
Q103aHow much do each of the following statements describe your neighborhood:crime and/or drug selling.
Q103bHow much do each of the following statements describe your neighborhood:fights.
Q103cHow much do each of the following statements describe your neighborhood:lots of empty or abandoned buildings.
Q103dHow much do each of the following statements describe your neighborhood:lots of graffiti.
Q107 I feel safe in my neighborhood.
Transitions and Mobility
Q110 Have you changed homes in the past year?
Q104 How many times have you changed homes since kindergarten?
Q106Have you changed schools (including changing from elementary to middle andmiddle to high school) in the past year?
Q108 How many times have you changed schools since kindergarten?

New Hope-Solebury School District Report 2011 Pennsylvania Youth Survey- 71 -
RISK FACTORS, CONTINUEDC
OM
MUN
ITYDO
MA
IN
Laws and Norms Favorable to Drug Use
Q33aHow wrong would most adults (over 21) in your neighborhood think it was forkids your age: to use marijuana?
Q33bHow wrong would most adults (over 21) in your neighborhood think it was forkids your age: to drink alcohol?
Q33cHow wrong would most adults (over 21) in your neighborhood think it was forkids your age: to smoke cigarettes?
Q29If a kid drank some beer, wine or hard liquor (for example, vodka, whiskey, orgin) in your neighborhood, would he or she be caught by the police?
Q27If a kid smoked marijuana in your neighborhood, would he or she be caught bythe police?
Perceived Availability of Drugs
Q25If you wanted to get some beer, wine or hard liquor (for example, vodka,whiskey, or gin), how easy would it be for you to get some?
Q26 If you wanted to get some cigarettes, how easy would it be for you to get some?
Q32If you wanted to get some marijuana, how easy would it be for you to getsome?
Q28 If you wanted to get a drug like cocaine, LSD, or amphetamines, how easywould it be for you to get some?
Perceived Availability of Handguns
Q30 If you wanted to get a handgun, how easy would it be for you to get one?

New Hope-Solebury School District Report 2011 Pennsylvania Youth Survey- 72 -
PROTECTIVE FACTORS
CO
MM
UNITY
DOM
AIN
Community Rewards for Prosocial Involvement
Q101 My neighbors notice when I am doing a good job and let me know.
Q111 There are people in my neighborhood who encourage me to do my best.
Q105 There are people in my neighborhood who are proud of me when I dosomething well.
Community Opportunities for Prosocial Involvement
Q2912 Which of the following activities for people your age are available in yourcommunity: sports teams?
Q2913 Which of the following activities for people your age are available in yourcommunity: scouting?
Q2914 Which of the following activities for people your age are available in yourcommunity: boys and girls clubs?
Q2915 Which of the following activities for people your age are available in yourcommunity: 4-H clubs?
Q2916 Which of the following activities for people your age are available in yourcommunity: service clubs?
Q555 There are lots of adults in my neighborhood I could talk to about somethingimportant.
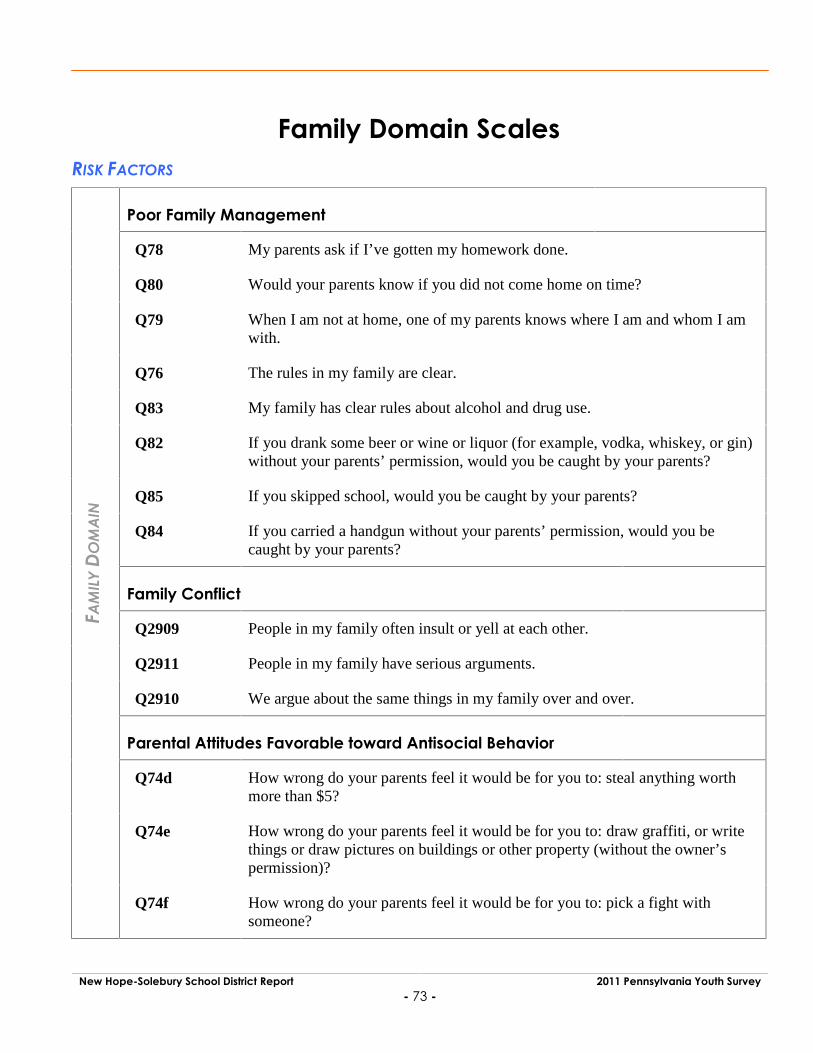
New Hope-Solebury School District Report 2011 Pennsylvania Youth Survey- 73 -
Family Domain ScalesRISK FACTORS
FAM
ILY
DOM
AIN
Poor Family Management
Q78 My parents ask if I’ve gotten my homework done.
Q80 Would your parents know if you did not come home on time?
Q79 When I am not at home, one of my parents knows where I am and whom I amwith.
Q76 The rules in my family are clear.
Q83 My family has clear rules about alcohol and drug use.
Q82 If you drank some beer or wine or liquor (for example, vodka, whiskey, or gin)without your parents’ permission, would you be caught by your parents?
Q85 If you skipped school, would you be caught by your parents?
Q84 If you carried a handgun without your parents’ permission, would you becaught by your parents?
Family Conflict
Q2909 People in my family often insult or yell at each other.
Q2911 People in my family have serious arguments.
Q2910 We argue about the same things in my family over and over.
Parental Attitudes Favorable toward Antisocial Behavior
Q74d How wrong do your parents feel it would be for you to: steal anything worthmore than $5?
Q74e How wrong do your parents feel it would be for you to: draw graffiti, or writethings or draw pictures on buildings or other property (without the owner’spermission)?
Q74f How wrong do your parents feel it would be for you to: pick a fight withsomeone?

New Hope-Solebury School District Report 2011 Pennsylvania Youth Survey- 74 -
RISK FACTORS, CONTINUED
FAM
ILY
DOM
AIN
Parental Attitudes Favorable toward ATOD Use
Q74a How wrong do your parents feel it would be for you to: drink beer, wine orhard liquor (for example, vodka, whiskey or gin) regularly?
Q74b How wrong do your parents feel it would be for you to: smoke cigarettes?
Q74c How wrong do your parents feel it would be for you to: smoke marijuana?
Family History of Antisocial Behavior
Q77 Has anyone in your family ever had a severe alcohol or drug problem?
Q75a Have any of your brothers or sisters ever: drunk beer, wine or hard liquor (forexample, vodka, whiskey or gin)?
Q75b Have any of your brothers or sisters ever: smoked marijuana?
Q75c Have any of your brothers or sisters ever: smoked cigarettes?
Q75d Have any of your brothers or sisters ever: taken a handgun to school?
Q75e Have any of your brothers or sisters ever: been suspended or expelled fromschool?
Q34a About how many adults (over 21) have you known personally who in the pastyear have: used marijuana, crack, cocaine, or other drugs?
Q34b About how many adults (over 21) have you known personally who in the pastyear have: sold or dealt drugs?
Q34c About how many adults (over 21) have you known personally who in the pastyear have: done other things that could get them in trouble with the police, likestealing, selling stolen goods, mugging or assaulting others, etc?
Q34d About how many adults (over 21) have you known personally who in the pastyear have: gotten drunk or high?

New Hope-Solebury School District Report 2011 Pennsylvania Youth Survey- 75 -
PROTECTIVE FACTORS
FAM
ILY
DOM
AIN
Family Attachment
Q87 Do you feel very close to your mother?
Q88 Do you share your thoughts and feelings with your mother?
Q97 Do you feel very close to your father?
Q92 Do you share your thoughts and feelings with your father?
Family Opportunities for Prosocial Involvement
Q99 My parents give me lots of chances to do fun things with them.
Q89 My parents ask me what I think before most family decisions affecting me aremade.
Q96 If I had a personal problem, I could ask my mom or dad for help.
Family Rewards for Prosocial Involvement
Q86 My parents notice when I am doing a good job and let me know about it.
Q91 How often do your parents tell you they’re proud of you for something you’vedone?
Q93 Do you enjoy spending time with your mother?
Q94 Do you enjoy spending time with your father?

New Hope-Solebury School District Report 2011 Pennsylvania Youth Survey- 76 -
School Domain ScalesRISK FACTORS
SCHO
OL
DOM
AIN
Poor Academic Performance
Q13 Putting them all together, what were your grades like last year?
Q23 Are your school grades better than the grades of most students in your class?
Lack of Commitment to School
Q3681 How often do you feel that the schoolwork you are assigned is meaningful andimportant?
Q3682 How interesting are most of your courses to you?
Q3683 How important do you think the things you are learning in school are going tobe for your later life?
Q3684 Now, thinking back over the past year in school, how often did you: Enjoybeing in school?
Q3685 Now, thinking back over the past year in school, how often did you: Hate beingin school?
Q3686 Now, thinking back over the past year in school, how often did you: Try to doyour best work in school?
Q738 During the LAST FOUR WEEKS, how many whole days have you missedbecause you skipped or “cut”?
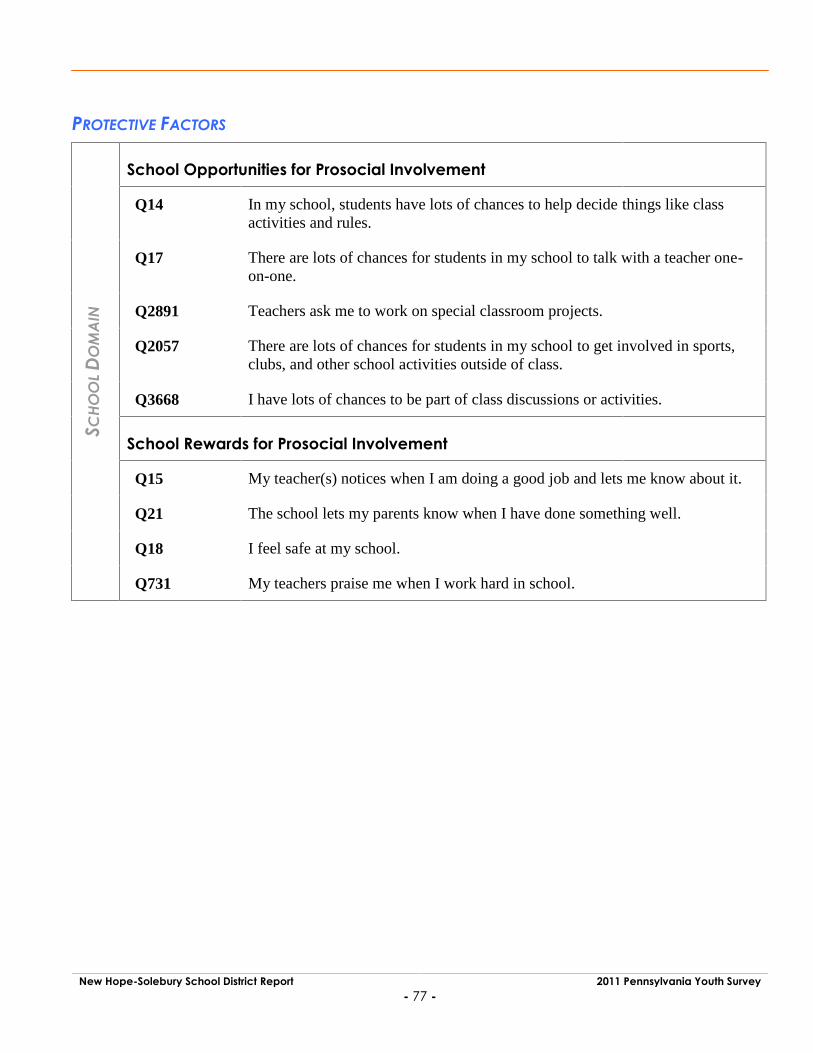
New Hope-Solebury School District Report 2011 Pennsylvania Youth Survey- 77 -
PROTECTIVE FACTORS
SCHO
OL
DOM
AIN
School Opportunities for Prosocial Involvement
Q14 In my school, students have lots of chances to help decide things like classactivities and rules.
Q17 There are lots of chances for students in my school to talk with a teacher one-on-one.
Q2891 Teachers ask me to work on special classroom projects.
Q2057 There are lots of chances for students in my school to get involved in sports,clubs, and other school activities outside of class.
Q3668 I have lots of chances to be part of class discussions or activities.
School Rewards for Prosocial Involvement
Q15 My teacher(s) notices when I am doing a good job and lets me know about it.
Q21 The school lets my parents know when I have done something well.
Q18 I feel safe at my school.
Q731 My teachers praise me when I work hard in school.

New Hope-Solebury School District Report 2011 Pennsylvania Youth Survey- 78 -
Peer and Individual Domain ScalesRISK FACTORS
PEER
AN
DIN
DIVI
DUA
LDO
MA
IN
Low Perceived Risks of Drug Use
Q3687 How much do you think people risk harming themselves (physically or in otherways) if they: smoke one or more packs of cigarettes per day?
Q3679 How much do you think people risk harming themselves (physically or in otherways) if they: try marijuana once or twice?
Q3688 How much do you think people risk harming themselves (physically or in otherways) if they: smoke marijuana regularly?
Q3680 How much do you think people risk harming themselves (physically or in otherways) if they: take one or two drinks of an alcoholic beverage (beer, wine,liquor) nearly every day?
Early Initiation of Drug Use
Q60a How old were you when you first: smoked marijuana?
Q60b How old were you when you first: smoked a cigarette, even just a puff?
Q60c How old were you when you first: had more than a sip or two of beer, wine orhard liquor (for example, vodka, whiskey, or gin)?
Q60d How old were you when you first: began drinking alcoholic beveragesregularly, that is, at least once or twice a month?
Sensation Seeking
Q57a How many times have you done the following things? Done what feels good nomatter what.
Q57b How many times have you done the following things? Done somethingdangerous because someone dared you to do it.
Q57c How many times have you done the following things? Done crazy things evenif they are a little dangerous.

New Hope-Solebury School District Report 2011 Pennsylvania Youth Survey- 79 -
RISK FACTORS, CONTINUED
PEER
AN
DIN
DIVI
DUA
LDO
MA
IN
Rebelliousness
Q55 I do the opposite of what people tell me, just to get them mad.
Q62 I ignore rules that get in my way.
Q73 I like to see how much I can get away with.
Friends’ Delinquent Behavior
Q65a Think of your four best friends (the friends you feel closest to). In the past year(12 months), how many of your best friends have been suspended from school?
Q65b Think of your four best friends (the friends you feel closest to). In the past year(12 months), how many of your best friends have carried a handgun?
Q65c Think of your four best friends (the friends you feel closest to). In the past year(12 months), how many of your best friends have sold illegal drugs?
Q65d Think of your four best friends (the friends you feel closest to). In the past year(12 months), how many of your best friends have stolen or tried to steal a motorvehicle such as a car or motorcycle?
Q65e Think of your four best friends (the friends you feel closest to). In the past year(12 months), how many of your best friends have been arrested?
Q65f Think of your four best friends (the friends you feel closest to). In the past year(12 months), how many of your best friends have dropped out of school?

New Hope-Solebury School District Report 2011 Pennsylvania Youth Survey- 80 -
RISK FACTORS, CONTINUED
PEER
AN
DIN
DIVI
DUA
LDO
MA
IN
Friends’ Use of Drugs
Q58a Think of your four best friends (the friends you feel closest to). In the past year(12 months), how many of your best friends have smoked cigarettes?
Q58b Think of your four best friends (the friends you feel closest to). In the past year(12 months), how many of your best friends have tried beer, wine or hard liquor(for example, vodka, whiskey or gin) when their parents didn’t know about it?
Q58c Think of your four best friends (the friends you feel closest to). In the past year(12 months), how many of your best friends have used marijuana?
Q58d Think of your four best friends (the friends you feel closest to). In the past year(12 months), how many of your best friends have used LSD, cocaine,amphetamines, or other illegal drugs?
Peer Rewards for Antisocial Behavior
Q59a What are the chances you would be seen as cool if you smoked cigarettes?
Q59b What are the chances you would be seen as cool if you began drinkingalcoholic beverages regularly, that is, at least once or twice a month?
Q59c What are the chances you would be seen as cool if you smoked marijuana?
Q59d What are the chances you would be seen as cool if you carried a handgun?

New Hope-Solebury School District Report 2011 Pennsylvania Youth Survey- 81 -
RISK FACTORS, CONTINUED
PEER
AN
DIN
DIVI
DUA
LDO
MA
IN
Favorable Attitudes toward Antisocial Behavior
Q61a How wrong do you think it is for someone your age to take a handgun toschool?
Q61b How wrong do you think it is for someone your age to steal anything worthmore than $5?
Q61c How wrong do you think it is for someone your age to pick a fight withsomeone?
Q61d How wrong do you think it is for someone your age to attack someone with theidea of seriously hurting him or her?
Q61e How wrong do you think it is for someone your age to stay away from schoolall day when their parents think they are at school?
Favorable Attitudes toward ATOD Use
Q67a How wrong do you think it is for someone your age to drink beer, wine or hardliquor (for example, vodka, whiskey or gin) regularly?
Q67b How wrong do you think it is for someone your age to smoke cigarettes?
Q67c How wrong do you think it is for someone your age to smoke marijuana?
Q67d How wrong do you think it is for someone your age to use LSD, cocaine,amphetamines or another illegal drug?

New Hope-Solebury School District Report 2011 Pennsylvania Youth Survey- 82 -
PROTECTIVE FACTORS
PEER
AN
DIN
DIVI
DUA
LDO
MA
IN
Religiosity
Q54 How often do you attend religious services or activities?
Belief in the Moral Order
Q56 I think it is okay to take something without asking, if you can get away with it.
Q72 I think sometimes it’s okay to cheat at school.
Q63 It is all right to beat up people if they start the fight.
Q64 It is important to be honest with your parents, even if they become upset or youget punished.

New Hope-Solebury School District Report 2011 Pennsylvania Youth Survey- 83 -
Appendix B: List of Tables and Graphs
Table 1. Confidence Intervals for Sample...................................................................................6Table 2. Demographic Characteristics of Surveyed Youth ......................................................7Table 3. Percentage of Youth Reporting Bullying at School or Sexual Harassment on theInternet in the Past Year, New Hope-Solebury School District 2011 .......................................10Table 4. Percentage of Youth Reporting Bullying at School or Sexual Harassment on theInternet in the Past Year, Pennsylvania Statewide 2011 ..........................................................10Table 5. Percentage of Youth Reporting Violence or Drugs on School Property in the PastYear, New Hope-Solebury School District 2011........................................................................11Table 6. Percentage of Youth Reporting Violence or Drugs on School Property in the PastYear, Pennsylvania Statewide 2011...........................................................................................11Table 7. Percentage of Youth Who Indicated Gang Involvement, New Hope-SoleburySchool District 2011 .....................................................................................................................11Table 8. Percentage of Youth Who Indicated Gang Involvement, Pennsylvania Statewide2011 ..............................................................................................................................................12Table 9. Prevalence of Other Antisocial Behaviors, New Hope-Solebury School District2011 ..............................................................................................................................................12Table 10. Prevalence of Other Antisocial Behaviors, Pennsylvania Statewide 2011 ...........12Table 11. Past-30-Day Frequency of Bringing a Weapon to School, New Hope-SoleburySchool District 2011 .....................................................................................................................13Table 12. Past-30-Day Frequency of Bringing a Weapon to School, PennsylvaniaStatewide 2011 ............................................................................................................................13Graph 1. Overall Lifetime and Past-30-Day Prevalence of Alcohol, Tobacco and OtherDrug Use .......................................................................................................................................16Graph 2. Past-30-Day Use of Selected ATODs.........................................................................17Table 13. Lifetime Use of Alcohol, Tobacco and Other Drugs ...............................................18Table 14. Past-30-Day Use of Alcohol, Tobacco and Other Drugs........................................18
Appendix BList of Tables and Graphs

New Hope-Solebury School District Report 2011 Pennsylvania Youth Survey- 84 -
Table 15. Lifetime Use of Alcohol, Tobacco and Other Drugs, Pennsylvania Statewide 2011...................................................................................................................................................... 19Table 16. Past-30-Day Use of Alcohol, Tobacco and Other Drugs, Pennsylvania Statewide2011.............................................................................................................................................. 20Table 17. Lifetime Use of Prescription Drugs, New Hope-Solebury School District 2011 ..... 30Table 18. Past-30-Day Use of Prescription Drugs, New Hope-Solebury School District 201131Table 19. Lifetime Use of Prescription Drugs, Pennsylvania Statewide 2011 ........................ 31Table 20. Past-30-Day Use of Prescription Drugs, Pennsylvania Statewide 2011................. 31Table 21. Percentage of Youth Who Reported Perception of “Great Risk” of Harm, NewHope-Solebury School District 2011 .......................................................................................... 32Table 22. Percentage of Youth Who Reported Perception of “Great Risk” of Harm,Pennsylvania Statewide 2011 .................................................................................................... 32Table 23. Percentage of Youth Who Indicated Personal Disapproval of Drug Use, NewHope-Solebury School District 2011 .......................................................................................... 32Table 24. Percentage of Youth Who Indicated Personal Disapproval of Drug Use,Pennsylvania Statewide 2011 .................................................................................................... 33Table 25. Percentage of Youth Who Indicated Peer Approval of Drug Use, New Hope-Solebury School District 2011..................................................................................................... 33Table 26. Percentage of Youth Who Indicated Peer Approval of Drug Use, PennsylvaniaStatewide 2011............................................................................................................................ 33Table 27. Percentage of Youth Who Indicated “Other Adults” Disapprove of Drug Use,New Hope-Solebury School District 2011 ................................................................................. 34Table 28. Percentage of Youth Who Indicated “Other Adults” Disapprove of Drug Use,Pennsylvania Statewide 2011 .................................................................................................... 34Table 29. Percentage of Youth Who Indicated Parental Disapproval of Drug Use, NewHope-Solebury School District 2011.......................................................................................... 34Table 30. Percentage of Youth Who Indicated Parental Disapproval of Drug Use,Pennsylvania Statewide 2011 .................................................................................................... 34Table 31. Past-30-Day Frequency of Alcohol Use, New Hope-Solebury School District 2011...................................................................................................................................................... 35Table 32. Past-30-Day Frequency of Alcohol Use, Pennsylvania Statewide 2011............... 35Table 33. Past-30-Day Frequency of Cigarette Use, New Hope-Solebury School District2011.............................................................................................................................................. 35Table 34. Past-30-Day Frequency of Cigarette Use, Pennsylvania Statewide 2011............ 36

New Hope-Solebury School District Report 2011 Pennsylvania Youth Survey- 85 -
Table 35. Past-30-Day Frequency of Marijuana Use, New Hope-Solebury School District2011 ..............................................................................................................................................36Table 36. Past-30-Day Frequency of Marijuana Use, Pennsylvania Statewide 2011 ...........36Table 37. Past-30-Day Frequency of Inhalant Use, New Hope-Solebury School District 2011......................................................................................................................................................37Table 38. Past-30-Day Frequency of Inhalant Use, Pennsylvania Statewide 2011 ..............37Table 39. Average Age of Onset of ATOD Use and Other Antisocial Behaviors, New Hope-Solebury School District 2011 .....................................................................................................40Table 40. Average Age of Onset of ATOD Use and Other Antisocial Behaviors,Pennsylvania Statewide 2011.....................................................................................................40Table 41. Percentage of Youth Reporting Any Occasion of Driving Under the Influence,New Hope-Solebury School District 2011..................................................................................41Table 42. Percentage of Youth Reporting Any Occasion of Driving Under the Influence,Pennsylvania Statewide 2011.....................................................................................................41Table 43. Percentage of Youth Reporting Willingness to Try Selected ATODs, New Hope-Solebury School District 2011 .....................................................................................................41Table 44. Percentage of Youth Reporting Willingness to Try Selected ATODs, PennsylvaniaStatewide 2011 ............................................................................................................................41Table 45. Percentage of Youth Reporting Gambling or Gambling-Related Problems, NewHope-Solebury School District 2011...........................................................................................42Table 46. Percentage of Youth Reporting Gambling or Gambling-Related Problems,Pennsylvania Statewide 2011.....................................................................................................42Table 47. Percentage of Youth Reporting Symptoms of Depression, New Hope-SoleburySchool District 2011 .....................................................................................................................43Table 48. Percentage of Youth Reporting Symptoms of Depression, PennsylvaniaStatewide 2011 ............................................................................................................................43Graph 3. Overall Protective Factor Scale Scores, 2011...........................................................48Graph 4. Overall Risk Factor Scale Scores, 2011 .....................................................................48Table 49. Protective Factor Scale Scores, New Hope-Solebury School District 2011 ..........50Table 50. Risk Factor Scale Scores, New Hope-Solebury School District 2011 .....................50Table 51. Protective Factor Scale Scores, Pennsylvania Statewide 2011 .............................51Table 52. Risk Factor Scale Scores, Pennsylvania Statewide 2011 ........................................51


New Hope-Solebury School District Report 2011 Pennsylvania Youth Survey- 87 -
Appendix C: Other Resources
Web SitesOffice of National Drug Control Policy: www.whitehouse.gov/ondcp
National Clearinghouse for Alcohol and Drug Information: www.ncadi.samhsa.gov
Substance Abuse and Mental Health Services Administration (SAMHSA): www.samhsa.gov
Communities That Care: www.sdrg.org/ctcresource
Monitoring the Future: www.monitoringthefuture.org
National Institute on Drug Abuse (NIDA): www.nida.nih.gov and www.drugabuse.gov
National Institute on Alcohol Abuse and Alcoholism (NIAAA): www.niaaa.nih.gov
Social Development Research Group: www.uwsrd.org/sdrg
Prevention Program GuidesOffice of Juvenile Justice and Delinquency Prevention (OJJDP). Model Programs Guide: www.ojjdp.gov/mpg.
Center for the Study and Prevention of Violence, Institute of Behavioral Science. Blueprints for Violence Prevention.Available from the University of Colorado Boulder’s web site: www.colorado.edu/cspv/blueprints.
Social Development Research Group, University of Washington. Communities That Care Prevention StrategiesGuide: www.sdrg.org/ctcresource/Prevention Strategies Guide/introduction.pdf.
U.S. Department of Health and Human Services, Substance Abuse and Mental Health Services Administration(SAMHSA). Model Programs List: www.nrepp.samhsa.gov.
Prevention PlanningHawkins, J. D., Catalano, R. F., & Associates. (1992). Communities that care: Action for drug abuse prevention(1st ed.). San Francisco: Jossey-Bass.
Appendix COther Resources


New Hope-Solebury School District Report 2011 Pennsylvania Youth Survey- 89 -
ReferencesAtlas, R. & Pepler D. (1998). Observations of bullying in the classroom. Journal of Educational Research, 92, 86-99.
Arthur, M. W., Hawkins, J. D., Pollard, J. A., Catalano, R. F., & Baglioni, A. J. (2002). Measuring risk and protectivefactors for substance use, delinquency, and other adolescent problem behaviors: The communities that care youthsurvey. Evaluation Review, 26, 575-601.
Bachman, J., Johnston, L., O’Malley, P., & Humphrey, R. (1986). Changes in marijuana use linked to changes inperceived risks and disapproval (Monitoring the Future Occasional Paper 19). Ann Arbor, MI: Institute for SocialResearch.
Bachman, J., Johnston, L., O’Malley, P., & Humphrey, R. (1988). Explaining the recent decline in marijuana use:Differentiating the effects of perceived risks, disapproval, and general lifestyle factors. Journal of Health andSocial Behavior, 29, 92-112.
Banks, R. (1997). Bullying in schools. ERIC Digest [Online]. Available: www.ericdigests.org/1997-4/bullying.htm.
Blum, R. W., Beuhring, T., Shew, M. L., Bearinger, L. H., Sieving, R. E., & Resnick, M. D. (2000). The effects ofrace/ethnicity, income, and family structure on adolescent risk behaviors. American Journal of Public Health, 90,1879-1884.
Bracht, N. & Kingsbury, L. (1990). Community organization principles in health promotion: A five-state model. InN. Bracht (Ed.), Health promotion at the community level (pp. 66-88). Beverly Hills, CA: Sage.
Bry, B. H., McKeon, P., & Pandina, R. J. (1982). Extent of drug use as a function of number of risk factors. Journalof Abnormal Psychology, 91, 273-279.
Everett, S. A., Ph.D., M.P.H., Giovino, G. A., Ph.D., Warren, C. W., Ph.D., Crossett, L., R.D.H., & Kann, L., Ph.D.(1998). Other substance use among high school students who use tobacco. Journal of Adolescent Health, 23,289-296.
Garrity, C., Jens, K., Porter, W. W., Sager, N., & Short-Camilli, C. (1997). Bullyproofing your school: Creating apositive climate. Intervention in School and Clinic, 32, 235-243.
Glaser, R. R., Van Horn, M. L., Arthur, M. W., Hawkins, J. D., & Catalano, R. F. (2005). Measurement properties ofthe communities that care youth survey across demographic groups. Journal of Quantitative Criminology, 21,73-102.
Hawkins, J. D., Catalano, R. F., & Associates. (1992). Communities that care: Action for drug abuse prevention(1st ed.). San Francisco: Jossey-Bass.
Hawkins, J. D., Catalano, R. F., & Miller, J. Y. (1992). Risk and protective factors for alcohol and other drugproblems in adolescence and early adulthood: Implications for substance abuse prevention. PsychologicalBulletin, 112, 64-105.
Johnston, L. D., O’Malley, P. M., Bachman, J. G., & Schulenberg, J. E. (2011a). Monitoring the Future nationalsurvey results on drug use, 1975-2008. Volume I: Secondary school students (NIH Publication No. 07-7402).Bethesda, MD: National Institute on Drug Abuse.
References
New Hope-Solebury School District Report 2011 Pennsylvania Youth Survey- 90 -
Johnston, L. D., O'Malley, P. M., Bachman, J. G., & Schulenberg, J. E. (2009b). Teen marijuana use tilts up, whilesome drugs decline in use. University of Michigan News Service: Ann Arbor, MI. Retrieved 1/15/2010 fromhttp://www.monitoringthefuture.org.
Leff, S. S, Power, T. J., & Goldstein, A. B. (2004). Outcome measures to assess the effectiveness of bullying-prevention programs in the schools. In D. L. Espelage & S. M. Swearer (Eds.) Bullying in American schools: Asocial-ecological perspective on prevention and intervention (pp. 269-294). Mahwah, NJ: Erlbaum.
Newcomb, M. D. (1995). Identifying high-risk youth: Prevalence and patterns of adolescent drug abuse. In E. Rahdert& D. Czechowicz (Eds.), Adolescent drug abuse: Clinical assessment and therapeutic interventions (NIDAResearch Monograph, 156). Washington, DC: U.S. Department of Health and Human Services.
Newcomb, M. D. & Felix-Ortiz, M. (1992). Multiple protective and risk factors for drug use and abuse: Cross-sectional and prospective findings. Journal of Personality and Social Psychology, 51, 564-577.
Newcomb, M. D., Maddahian, E., & Skager, R. (1987). Substance abuse and psychosocial risk factors amongteenagers: Associations with sex, age, ethnicity, and type of school. American Journal of Drug and AlcoholAbuse, 13, 413-433.
Pollard, J. A., Hawkins, J. D., & Arthur, M. W. (1999). Risk and protection: Are both necessary to understand diversebehavioral outcomes in adolescence? Social Work Research, 23, 145-158.
Skiba, R. & Fontanini, A. (2000). Bullying prevention: What works in preventing school violence. Safe andResponsive Schools Project Fact Sheet Series, Indiana Education Policy Center [Online]. Available:www.indiana.edu/~safeschl/SrsBullying.pdf.
Substance Abuse and Mental Health Services Administration. (2003). Results from the 2002 National Survey on DrugUse and Health: National Findings (Office of Applied Studies, NHSDA Series H-22, DHHS Publication No.SMA 03-3836). Rockville, MD.
U. S. Department of Education. (1998). Preventing bullying: A manual for schools and communities. [Online].Available: www.eric.ed.gov/ERICDocs/data/ericdocs2sql/content_storage_01/0000019b/80/17/14/d5.pdf.
U.S. Department of Education, National Center for Education Statistics. (2004). The Common Core of Data (CCD).[Data file]. Available from National Center for Education Statistics Web site, http://nces.ed.gov/ccd.