Embed Size (px)
Citation preview
DI
SC
US
SI
ON
P
AP
ER
S
ER
IE
S
Forschungsinstitut zur Zukunft der ArbeitInstitute for the Study of Labor
Payroll Taxes, Social Insurance and Business Cycles
IZA DP No. 5150
August 2010
Michael C. BurdaMark Weder
Payroll Taxes, Social Insurance and
Business Cycles
Michael C. Burda Humboldt Universität zu Berlin
and IZA
Mark Weder University of Adelaide
Discussion Paper No. 5150 August 2010
IZA
P.O. Box 7240 53072 Bonn
Germany
Phone: +49-228-3894-0 Fax: +49-228-3894-180
E-mail: [email protected]
Any opinions expressed here are those of the author(s) and not those of IZA. Research published in this series may include views on policy, but the institute itself takes no institutional policy positions. The Institute for the Study of Labor (IZA) in Bonn is a local and virtual international research center and a place of communication between science, politics and business. IZA is an independent nonprofit organization supported by Deutsche Post Foundation. The center is associated with the University of Bonn and offers a stimulating research environment through its international network, workshops and conferences, data service, project support, research visits and doctoral program. IZA engages in (i) original and internationally competitive research in all fields of labor economics, (ii) development of policy concepts, and (iii) dissemination of research results and concepts to the interested public. IZA Discussion Papers often represent preliminary work and are circulated to encourage discussion. Citation of such a paper should account for its provisional character. A revised version may be available directly from the author.
IZA Discussion Paper No. 5150 August 2010
ABSTRACT
Payroll Taxes, Social Insurance and Business Cycles* Payroll taxes represent a major distortionary influence of governments on labor markets. This paper examines the role of payroll taxation and the social safety net for cyclical fluctuations in a nonmonetary economy with labor market frictions and unemployment insurance, when the latter is only imperfectly related to search effort. A balanced social insurance budget renders gross wages more rigid over the cycle and, as a result, strengthens the model’s endogenous propagation mechanism. For conventional calibrations, the model generates a negatively sloped Beveridge curve as well as substantial volatility and persistence of vacancies and unemployment. JEL Classification: E24, J64, E32 Keywords: business cycles, labor markets, payroll taxes, unemployment,
consumption-tightness puzzle Corresponding author: Michael C. Burda Department of Economics Humboldt Universität zu Berlin Spandauer Str. 1 D-10178 Berlin Germany E-mail: [email protected]
* We are grateful to Chris Edmond, Francisco Gonzalez, Bob Gregory, Dan Hamermesh, Tom Krebs, Nir Jaimovich, Ian McLean, Christian Merkl, Alex Meyer-Gohde, Bruce Preston, Dennis Snower, Lutz Weinke, Jake Wong and to seminar participants at ANU, Humboldt, Kiel, Mannheim, Melbourne, Utrecht, EALE/SOLE 2010 and SED 2010 for very useful comments. Patrick Bunk, Hong Lan and Susanne Schöneberg provided excellent research assistance. The authors acknowledge generous support from the Alexander von Humboldt Foundation, the Netherlands Institute of Advanced Study, and the Collaborative Research Center 649 of the German Science Foundation.
1 Introduction
Payroll taxes represent a major in uence of governments on labor markets.
In 2005, OECD member governments collected about $3 trillion from em-
ployers and employees, representing 9:2 percent of GDP and, given a wage
share of two-thirds, roughly 15 percent of the total wage bill. In some Eu-
ropean countries, the share of "contributions to social insurance" in total
compensation is as high as 40 to 45 percent.1 Payroll taxes drive a wedge
between the hiring decisions of �rm and the labor supply decisions of house-
holds, and are likely to spur the untaxed, informal economy. A less-studied
aspect is the e�ect of time-varying labor taxation on intertemporal decisions
of employers and employees. Not only do payroll taxes impact the long-run
functioning of labor markets and the macroeconomy, but they may also a�ect
the magnitude and persistence of business cycle uctuations.
This paper investigates the interaction of payroll taxes, the social insur-
ance system and the business cycle. We begin with an empirical examination
of the cyclical behavior of payroll taxation. We �nd evidence that payroll
taxation is countercyclical in a number of OECD countries: employer and em-
ployee contributions to social insurance, measured relative to the total wage
bill, tend to fall in recoveries and rise in recessions. This countercyclical labor
tax burden arises for at least two reasons. First, most OECD governments
rely on payroll taxation to fund their social welfare systems, sometimes on
a near-balanced budget basis. Second, payroll taxation is usually capped,
implying a relatively higher e�ective rate of taxation for low-productivity
workers at the extensive margin.
Next, we study the e�ects of countercyclical payroll taxation in an equi-
librium business cycle model with labor market frictions. We show that in
1Source: OECD Revenue Statistics 2007.
2
this class of models, the elasticity of search activity on both sides of the
market is in uenced by the intertemporal path of the wedge between costs
paid by �rms and income received by households. The endogeneity of the tax
burden to cyclical conditions reinforces the intertemporal response of labor
market activity and thus increases the endogenous propagation of shocks in
the model economy. By distinguishing between search and leisure, we ac-
count for the possibility that non-working time is not used for active search
and create an additional margin for time use. There are two other features
central to the model: unemployment bene�ts are �nanced by payroll taxation
on a balanced budget basis and unemployment bene�t provision is only im-
perfectly related to search e�ort.2 This latter is due to the extent of general
social welfare in the model economy, which is can be thought of as "Type II"
classi�cation error { paying unemployment bene�ts to those in fact taking
leisure. Combined with the endogeneity of labor taxation, these e�ects sig-
ni�cantly distort the labor-search-leisure decision and increase the internal
propagation of the model economy.
Although models with labor market frictions have proliferated in recent
years, Shimer (2005) and Hall (2005) showed that they generally do not
generate su�cient volatility and persistence in labor market quantities, i.e.
vacancies and unemployment. They argue that wage rigidity is the most
promising solution to the puzzle. To this end, Hagedorn and Manovskii
(2008) raise the fallback position and lower the bargaining power of workers
in wage bargaining (see also Cole and Rogerson, 1999), while Gertler and Tri-
gari (2009) employ overlapping Nash-bargained wage contracts. Hornstein,
Krusell and Violante (2005) and Costain and Reiter (2008) and show that
these approaches, however successful, can generate a number of unwanted
2Tripier (2003), Ravn (2008) and Ebell (2009) examine similar setups, but they donot examine the impact of unemployment bene�t on the search-leisure margin and do notconsider unemployment bene�ts �nanced by distortionary payroll taxation.
3
side e�ects.3 Ravn (2008) shows that with endogenous participation, the
search model predicts a counterfactual positively-sloped Beveridge relation
and procyclial unemployment.
The central �nding of this paper is that the interaction of endogenous
payroll taxation with the social insurance system can reduce the volatility
of gross labor costs in a real equilibrium business cycle model and match
key macro stylized facts, which include persistence in vacancies, high cyclical
volatility of labor market quantities, and negative correlation of vacancies
and unemployment (the Beveridge curve). Time-varying payroll taxes a�ect
the both cost of labor and the value of vacancies to the �rm, as well as the
value of time spent by workers in search. This intertemporal e�ect of taxes
on equilibrium models of unemployment is also a novel �nding.
In Section 2, we document the level and intertemporal behavior of pay-
roll taxes in the major OECD countries. For a number of Western European
economies (Finland, France, and Germany in particular), e�ective payroll
taxes are signi�cantly countercyclical; in the United States, a similar pattern
has also emerged in the last two decades. Section 3 lays out a nonmonetary
dynamic stochastic general equilibrium economy with a social insurance sys-
tem, unemployment bene�ts and endogenous search. The model is calibrated
in Section 4, while Section 5 presents our central �nding: a productivity-
driven real equilibrium economy with search frictions can account for labor
market facts and generate a pattern of countercyclical payroll tax burdens
observed in many OECD countries. Robustness checks and more detailed
interpretation of the results are laid out in Section 6. Section 7 concludes.
3Sticky wages are not easy to �nd in the data (Bils 1985), and the standard modelpredicts a counterfactually strong negative correlation between the labor share and laborproductivity. Hall and Milgrom (2008) note that high values of fallback induce unrealis-tically high elasticities of labor supply response. More recent work by Shimer (2009) andothers show how intratemporal non-separability in utility over consumption and nonworkcan induce similar e�ects.
4
2 Payroll taxes in the OECD
2.1 Magnitude of payroll taxes
Payroll taxation represents a signi�cant, yet frequently overlooked interven-
tion in labor markets in developed economies. In 2008, the total contribution
of households and enterprises to social security (i.e. payroll taxes) repre-
sented 33.7 percent of total compensation in Germany and 25.2 percent in
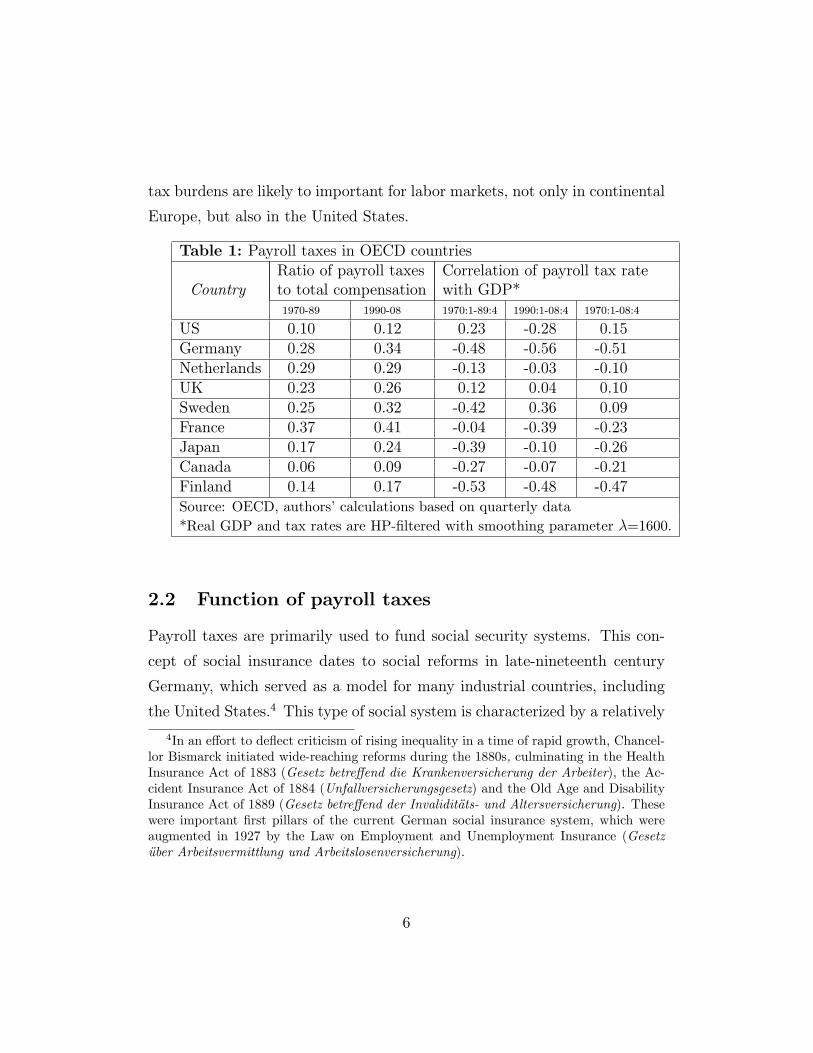
Sweden, as compared with 11.3 percent in the United States. Table 1 re-
ports a longer-term perspective on payroll taxation. The payroll tax rate (�)
is de�ned as the ratio of all "contributions to social insurance" divided by
total compensation of employees, and represents the average burden posed
by payroll taxes and other social contributions as a fraction of total labor
costs paid by �rms. Our data are taken from the OECD Economic Outlook
and Main Economic Indicators databases. Contributions to social insurance
consist of payments by �rms or employees for pension, health, unemployment
and disability insurance, and some other minor elements of social insurance.
Total compensation is de�ned as gross wages, salaries and other payments
made by employers on behalf of their employees. The �rst two columns of the
table document levels and trends of payroll taxation in countries for which
longer time series are available.
The average e�ective payroll tax rate thus varies widely in OECD coun-
tries, ranging from 5-15% of the wage bill in Canada, the US and Finland
to 30% or more in France, Germany and Sweden. As evident from Figures
1 and 2, they also vary over time. Over the four decades of data available,
average taxes have risen secularly in almost all countries. At the same time,
they uctuate around their respective trends, with standard deviations of
less than 0.2 percentage points in the US and Canada to more than 0.6% in
Sweden, France, Finland, Greece, and the Netherlands. Such uctuations of
5
tax burdens are likely to important for labor markets, not only in continental
Europe, but also in the United States.
Table 1: Payroll taxes in OECD countriesRatio of payroll taxes Correlation of payroll tax rate
Country to total compensation with GDP*1970-89 1990-08 1970:1-89:4 1990:1-08:4 1970:1-08:4
US 0.10 0.12 0.23 -0.28 0.15Germany 0.28 0.34 -0.48 -0.56 -0.51Netherlands 0.29 0.29 -0.13 -0.03 -0.10UK 0.23 0.26 0.12 0.04 0.10Sweden 0.25 0.32 -0.42 0.36 0.09France 0.37 0.41 -0.04 -0.39 -0.23Japan 0.17 0.24 -0.39 -0.10 -0.26Canada 0.06 0.09 -0.27 -0.07 -0.21Finland 0.14 0.17 -0.53 -0.48 -0.47Source: OECD, authors' calculations based on quarterly data
*Real GDP and tax rates are HP-�ltered with smoothing parameter �=1600.
2.2 Function of payroll taxes
Payroll taxes are primarily used to fund social security systems. This con-
cept of social insurance dates to social reforms in late-nineteenth century
Germany, which served as a model for many industrial countries, including
the United States.4 This type of social system is characterized by a relatively
4In an e�ort to de ect criticism of rising inequality in a time of rapid growth, Chancel-lor Bismarck initiated wide-reaching reforms during the 1880s, culminating in the HealthInsurance Act of 1883 (Gesetz betre�end die Krankenversicherung der Arbeiter), the Ac-cident Insurance Act of 1884 (Unfallversicherungsgesetz) and the Old Age and DisabilityInsurance Act of 1889 (Gesetz betre�end der Invalidit�ats- und Altersversicherung). Thesewere important �rst pillars of the current German social insurance system, which wereaugmented in 1927 by the Law on Employment and Unemployment Insurance (Gesetz�uber Arbeitsvermittlung und Arbeitslosenversicherung).
6
low level of explicit redistribution; health, pension, and unemployment in-
surance funds are established to honor entitlements based on past service or
accrued eligibility. In theory, workers and �rms contribute towards the costs
of social insurance programs, which run on a near-balanced budget basis.
Funding of such programs is thus susceptible to business cycle uctuations,
with cyclical adjustments often required to bring contributions in line with
outlays.
As a representative example, consider Germany's current system of un-
employment bene�ts, which was established in 1969 by the Employment
Promotion Act (Arbeitsf�orderungsgesetz). This law set up the Federal Em-
ployment Agency (Bundesagentur f�ur Arbeit) to provide income support for
unemployed as well as training and support in job �nding and matching.
The activities of the agency are funded primarily by payroll tax contribu-
tions. The government provides stop-gap assistance only under exceptional
circumstances in the form of interest-free liquidity loans, which are generally
repaid as soon as income exceeds spending in any given month. As a result,
contribution rates vary considerably over time and are often reduced in times
of stronger economic growth, and raised in recessions.5 Similar funding prin-
ciples apply to other pillars of the social security system (health, pension,
disability, old-age care, etc.).
The Bismarckian system stands in contrast to the concept of social in-
surance promoted by Beveridge in the late 1940s and based on the notion
of a su�cient minimum bene�t to be funded by the general public budget if
necessary. In many European countries, de�cits in social security programs
5In the period 2007-2009, for example, the statutory contribution rate for the Germanunemployment insurance scheme decreased from 6.5 percent of gross eligible wage incometo 2.8 percent. In the recession which followed, tax increases for unemployment insurancewere avoided only by a discretionary expansion of the short-time work program, whichexempts employees from social insurance contributions.
7
are regularly covered by budgetary transfers. The social security system of
old-age bene�ts in the United States combines Bismarckian and Beveridgean
elements. It is funded by payroll taxes, with employers withholding 6.2% of
employee wages and matching that amount in employer social security taxes
until total earnings reach a �xed earnings base (ceiling) for the year. above
which no further tax is levied. Romer and Romer (2009) document that US
Social Security tax increases tend to be preprogrammed and follow increases
in bene�ts, either in the form of increasing statutory rates or increases in the
payroll tax base.
2.3 Cyclical behavior of payroll taxes
For at least two reasons, the average payroll tax rate � - and thus the tax
burden for the representative worker moving from unemployment into em-
ployment - is likely to be countercyclical. In recessions, budget shortfalls
are di�cult to close, especially when social expenditures have the nature of
entitlements. As a result, tax rates may be raised in recessions and cut in
expansions. While we focus on unemployment insurance and welfare bene-
�ts, countercyclical funding issues arise in systems of health services, public
pensions and social programs in general. A second reason for countercycli-
cal payroll tax rates is the truncated nature of payroll tax systems in most
OECD countries, in which a cap on contributions limits total tax liability
of employers for a given employee.6 In expansions, when overall wages and
productivity are rising, more workers will earn gross pay exceeding the con-
tributions cap, while in recessions, new jobs tend to pay less.
6In the United States, the ceiling on social security contributions, which is adjustedannually for in ation, was $102,000 in 2008. This represents the roughly the 85th percentileof the annual gross household income distribution in the US. In Germany, the ceiling was5300 Euro per month in 2008. At the lower end of the pay spectrum, so-called Mini-Jobs(de�ned as jobs that pay less than 400 Euro per month) face a signi�cantly lower payrolltax.
8
Figures 3 and 4 and the last three columns of Table 1 document that the
average e�ective payroll tax rate (�t) is not constant. In fact, it is strongly
countercyclical in Germany, France, and the Netherlands, while less so in
Sweden, the UK and the United States. To remove low frequency move-
ments in the data, we applied the HP-�lter to the payroll tax and real GDP
series. The overall contemporaneous correlation of the payroll tax rate and
the business cycle in the period 1990-2008 was �0:56 in Germany, �0:39in France, and �0:48 in Finland. While payroll taxation is acyclical in theUnited States over the entire period, it has become more negatively correlated
with the cycle over the last two decades.7 Our �nding is consistent with the
conclusion of the business cycle accounting literature and its concept of the
"labor wedge" (see Chari, Kehoe and McGrattan, 2008), although researchers
in this area have tended to focus on distortions based on government reg-
ulation and other market imperfections. Rogerson and Shimer (2010) and
Shimer (2009) argue that the labor wedge moves countercyclically, that is,
in the same direction as our payroll tax measure.8
Figures 1, 2, 3, and 4 about here
Evidently, policy can in uence the sign of this correlation by breaking
the rigid link between payroll taxation and the business cycle which results
from a balanced budget rule. Already in the 1930s, Kaldor (1936) and Meade
(1938) proposed setting payroll taxes to covary positively with the state of
the economy, and their ideas were endorsed by Keynes (1942) and Beveridge
(1944). In smaller, open OECD countries such as the Netherlands and Swe-
den, discretionary policy seems to have reduced the anticyclicality of payroll
7This �nding is not an artifact of the detrending procedure. With �rst-di�erenced data,the correlation in the US declines over the two subperiods from 0.36 to -0.48.
8The correlation between HP-detrended versions of Shimer's (2009) wedge measure andour average payroll tax rate is 0.52 for the period 1990-2006 (for the period 1970-2006 itis only 0.10).
9
taxes or even made them procyclical. The increasing countercyclical behav-
ior of the US payroll tax rate may also be due to increasing procyclicality in
both levels and variance of wages, given the contributions cap.9
In the next section, we examine the e�ect of payroll taxation in a dynamic
stochastic general equilibrium model of the business cycle with labor mar-
ket frictions along the lines of Tripier (2003), Veracierto (2008), and Ravn
(2008), to which systems of unemployment bene�ts and social assistance
funded by distortionary labor taxation are added. To emphasize the e�ects
on dynamics, we will study the extreme case of a balanced-budget version
of the model, in which payroll taxes are set passively by the government to
fund unemployment bene�t and social assistance payments due each period.
3 An equilibrium business cycle model with
payroll taxation
3.1 Labor market search
Subscripts refer to periods of discrete time t � 0: The economy is populatedby a large number of in�nitely-lived, identical consumer-worker households of
measure one. Each household consists of a large number of individuals who
derive utility from consumption and leisure. Workers (or family members)
can spend their nonworking time in active unemployment (i.e., searching)
or in leisure. If we normalize non-sleeping time to unity, the representative
agent faces the following time budget:
ht + st + `t = 1 (1)
where ht, st, and `t are working time, search time, and leisure (which could
include home production). The threefold use of time re ects our interest in
9See Gali and van Rens (2010) for evidence on the United States.
10
the distinction between search and voluntary unemployment and its inter-
action with labor market interventions described above: payroll taxes and
social insurance.10 Governments payroll tax receipts are used to subsidize
search (unemployment bene�ts) and leisure (social welfare payments).
Workers and jobs search for each other in a decentralized labor market.11
Matching is modeled as a constant returns function of workers' search ac-
tivities, st, and �rms' posted vacancies, vt, in the form of a matching func-
tion, M(st; vt) = s�t v1��t . At the same time, �lled jobs are broken up each
period at a constant rate, �h, with 0 < �h < 1.12 In the absence of on-
the-job search, the vacancy-unemployment ratio �t � vt=st is a su�cient
statistic of market tightness. The vacancy placement rate qt, is linked to
the job-�nding rate among the searching unemployed ft, by the relation
qt =M(st;vt)
vt= M( st
vt; 1) =
M(1;��1t )
�t= ft
�t: Employment ht; is a state variable
for the household. From the perspective of the individual searcher, ft is the
probability that a match will occur. For the aggregate economy, employment
thus obeys
ht+1 = stft + (1� �h)ht: (2)
Similarly, qt is the probability that an open vacancy will be matched in a
period (the job matching rate per vacancy posted) so the following aggregate
relationship also holds:
ht+1 = vtqt + (1� �h)ht: (3)
10Without loss of generality it is possible to modify this model to re ect more standardtime use assumptions as well as costly labor market state switching.11See Merz (1995) and Andolfatto (1996) for the seminal contributions in this literature.12Shimer (2005) argues that the cyclical variability of separations is dominated by that
of out ows from unemployment.
11
3.2 Social insurance
The government collects social security contributions from gross factor pay-
ments to labor, wtht, at rate �t. Government purchases of goods and ser-
vices are suppressed, so all revenues from payroll taxes are used to �nance a
�xed unemployment bene�t b paid to st unemployed engaged in search, and
"b; paid to (1� st� ht) household members enjoying leisure. The parameter" 2 (0; 1) can be interpreted alternatively as a measure of "classi�cation er-ror", malfeasance in the unemployment system, or overall generosity of the
welfare state.13 A positive " means that household members not actively
searching still receive some social support, which is characteristic of many
OECD social security systems. The government adjusts the payroll tax rate
in each period to respect the budget constraint
bst + "b(1� st � ht) = �twtht: (4)
As " approaches 1, search time and leisure are "rewarded" equally in terms
of consumption goods. As " approaches zero, the system replicates the stan-
dard model, and leisure is not rewarded beyond its intrinsic utility value to
individual households. Writing the payroll tax rate as
�t =(1� ") bst + "b(1� ht)
wtht; (5)
we see that a su�cient condition for countercyclical �t is for wt and ht to be
procyclical and st countercyclical.
3.3 Households
Households choose their labor and capital market activities to maximize ex-
pected utility. Their labor ht is compensated at net rate (1 � �t)wt. They
13See Burda and Weder (2002) for a similar formulation.
12
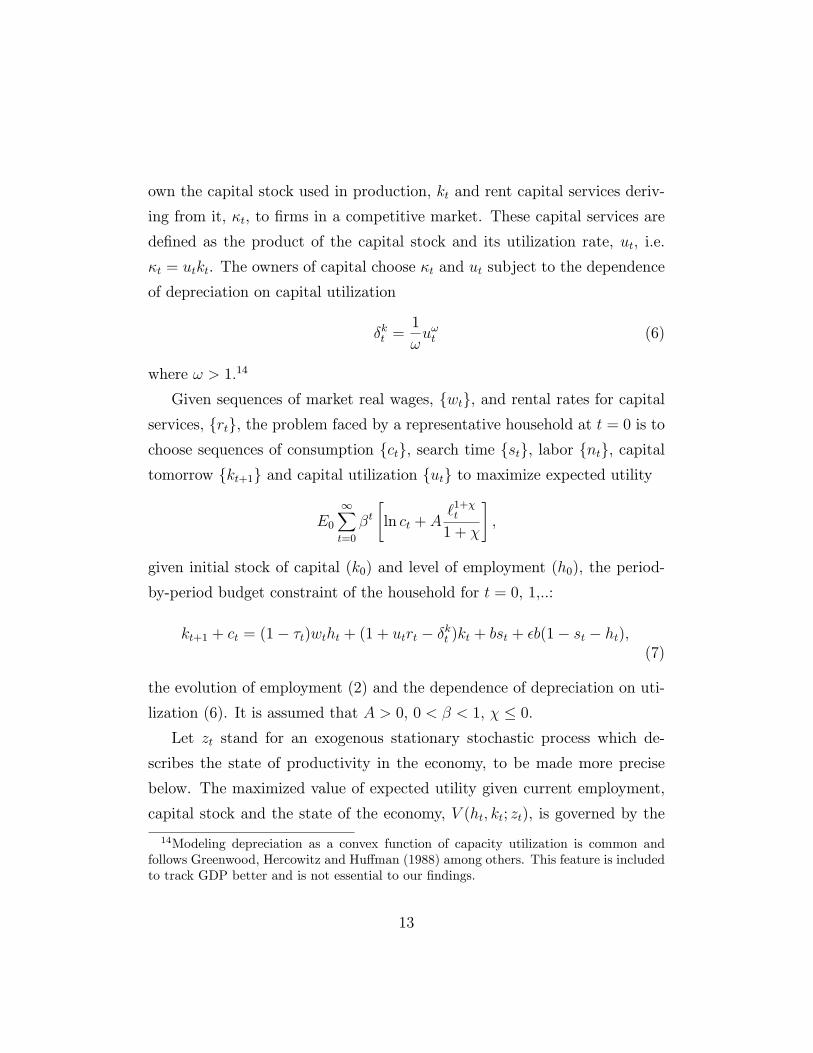
own the capital stock used in production, kt and rent capital services deriv-
ing from it, �t, to �rms in a competitive market. These capital services are
de�ned as the product of the capital stock and its utilization rate, ut, i.e.
�t = utkt. The owners of capital choose �t and ut subject to the dependence
of depreciation on capital utilization
�kt =1
!u!t (6)
where ! > 1:14
Given sequences of market real wages, fwtg, and rental rates for capitalservices, frtg, the problem faced by a representative household at t = 0 is tochoose sequences of consumption fctg, search time fstg, labor fntg, capitaltomorrow fkt+1g and capital utilization futg to maximize expected utility
E01Xt=0
�t"ln ct + A
`1+�t
1 + �
#;
given initial stock of capital (k0) and level of employment (h0), the period-
by-period budget constraint of the household for t = 0, 1,..:
kt+1 + ct = (1� �t)wtht + (1 + utrt � �kt )kt + bst + �b(1� st � ht);(7)
the evolution of employment (2) and the dependence of depreciation on uti-
lization (6). It is assumed that A > 0, 0 < � < 1, � � 0:Let zt stand for an exogenous stationary stochastic process which de-
scribes the state of productivity in the economy, to be made more precise
below. The maximized value of expected utility given current employment,
capital stock and the state of the economy, V (ht; kt; zt), is governed by the
14Modeling depreciation as a convex function of capacity utilization is common andfollows Greenwood, Hercowitz and Hu�man (1988) among others. This feature is includedto track GDP better and is not essential to our �ndings.
13
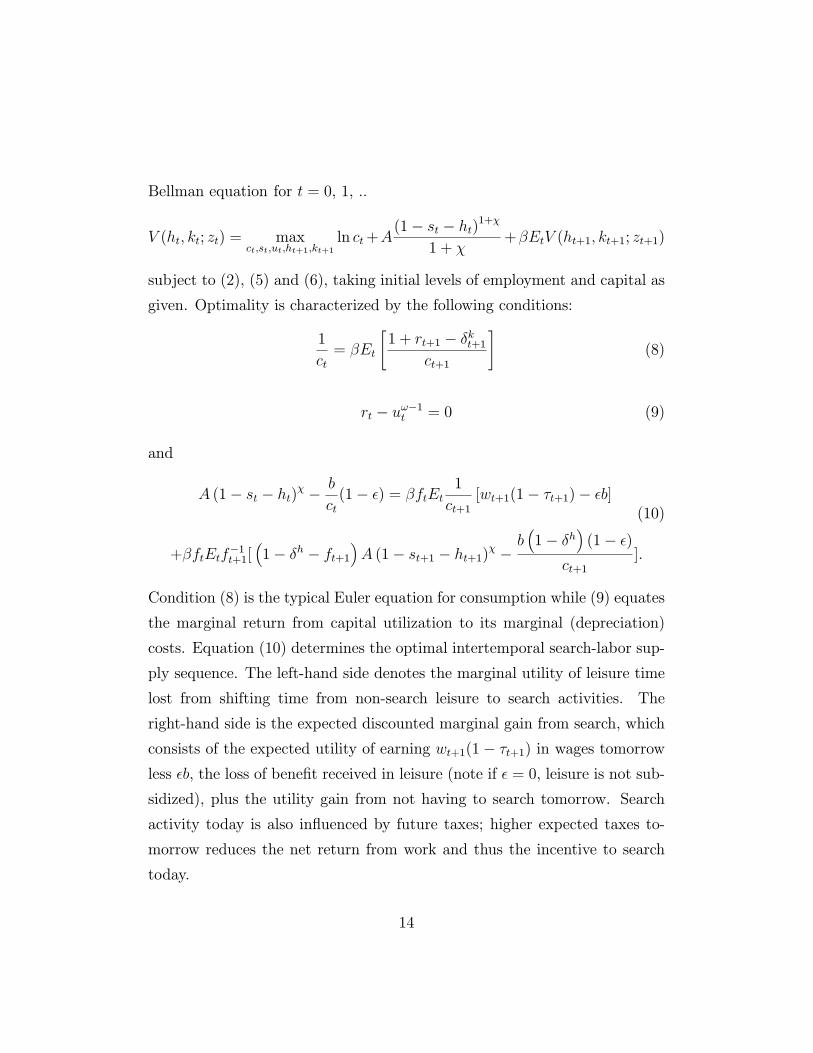
Bellman equation for t = 0, 1, ::
V (ht; kt; zt) = maxct;st;ut;ht+1;kt+1
ln ct+A(1� st � ht)
1+�
1 + �+�EtV (ht+1; kt+1; zt+1)
subject to (2), (5) and (6), taking initial levels of employment and capital as
given. Optimality is characterized by the following conditions:
1
ct= �Et
"1 + rt+1 � �kt+1
ct+1
#(8)
rt � u!�1t = 0 (9)
and
A (1� st � ht)� � b
ct(1� �) = �ftEt
1
ct+1[wt+1(1� �t+1)� �b]
(10)
+�ftEtf�1t+1[
�1� �h � ft+1
�A (1� st+1 � ht+1)
� �b�1� �h
�(1� �)
ct+1]:
Condition (8) is the typical Euler equation for consumption while (9) equates
the marginal return from capital utilization to its marginal (depreciation)
costs. Equation (10) determines the optimal intertemporal search-labor sup-
ply sequence. The left-hand side denotes the marginal utility of leisure time
lost from shifting time from non-search leisure to search activities. The
right-hand side is the expected discounted marginal gain from search, which
consists of the expected utility of earning wt+1(1� �t+1) in wages tomorrow
less �b, the loss of bene�t received in leisure (note if � = 0, leisure is not sub-
sidized), plus the utility gain from not having to search tomorrow. Search
activity today is also in uenced by future taxes; higher expected taxes to-
morrow reduces the net return from work and thus the incentive to search
today.
14
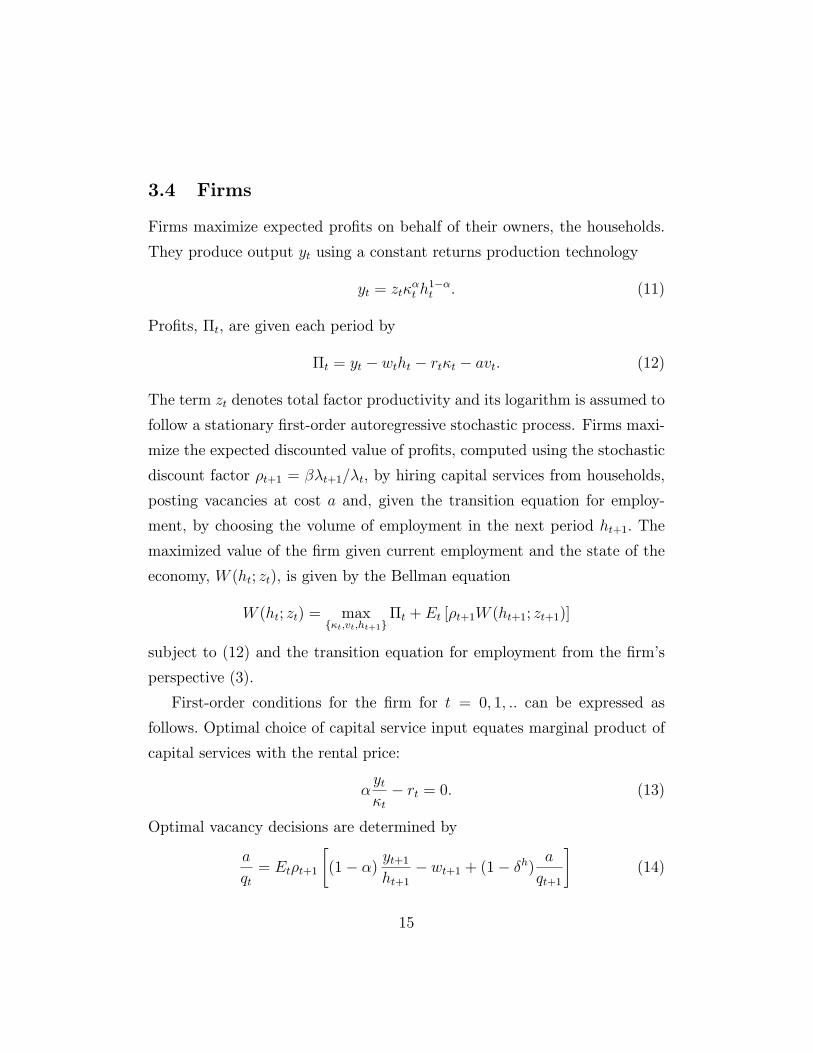
3.4 Firms
Firms maximize expected pro�ts on behalf of their owners, the households.
They produce output yt using a constant returns production technology
yt = zt��t h
1��t : (11)
Pro�ts, �t, are given each period by
�t = yt � wtht � rt�t � avt: (12)
The term zt denotes total factor productivity and its logarithm is assumed to
follow a stationary �rst-order autoregressive stochastic process. Firms maxi-
mize the expected discounted value of pro�ts, computed using the stochastic
discount factor �t+1 = ��t+1=�t, by hiring capital services from households,
posting vacancies at cost a and, given the transition equation for employ-
ment, by choosing the volume of employment in the next period ht+1: The
maximized value of the �rm given current employment and the state of the
economy, W (ht; zt); is given by the Bellman equation
W (ht; zt) = maxf�t;vt;ht+1g
�t + Et [�t+1W (ht+1; zt+1)]
subject to (12) and the transition equation for employment from the �rm's
perspective (3).
First-order conditions for the �rm for t = 0; 1; :: can be expressed as
follows. Optimal choice of capital service input equates marginal product of
capital services with the rental price:
�yt�t� rt = 0: (13)
Optimal vacancy decisions are determined by
a
qt= Et�t+1
"(1� �)
yt+1ht+1
� wt+1 + (1� �h)a
qt+1
#(14)
15
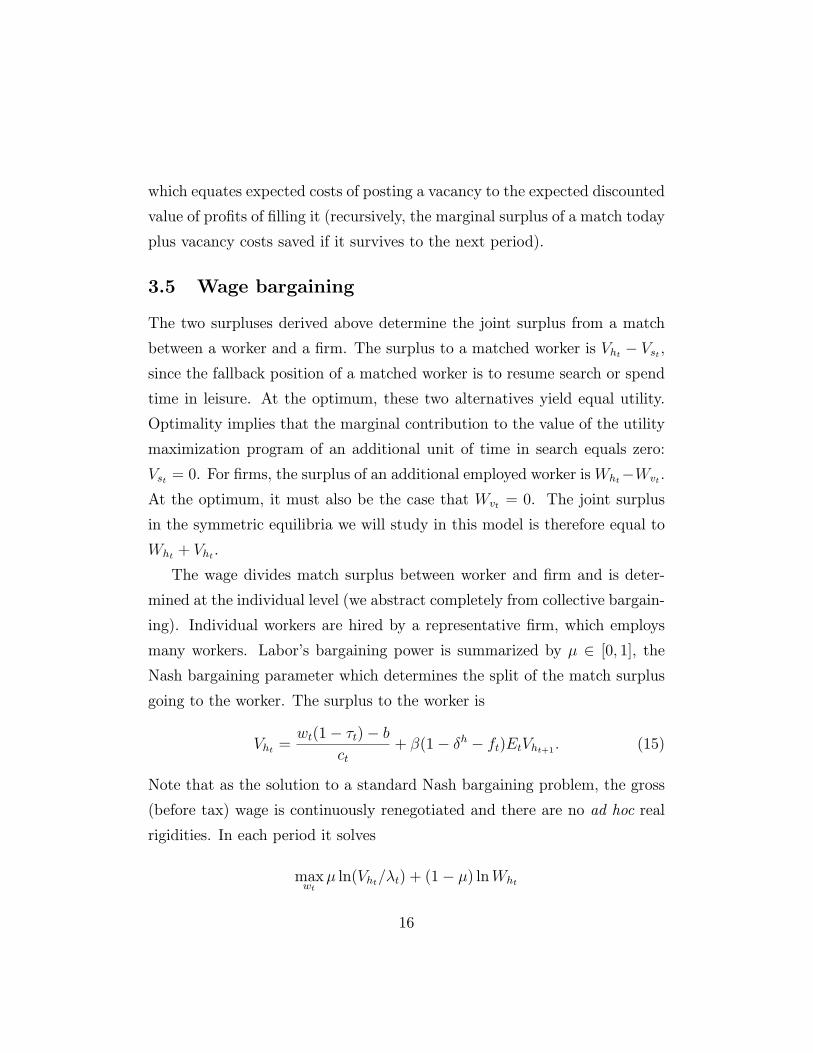
which equates expected costs of posting a vacancy to the expected discounted
value of pro�ts of �lling it (recursively, the marginal surplus of a match today
plus vacancy costs saved if it survives to the next period).
3.5 Wage bargaining
The two surpluses derived above determine the joint surplus from a match
between a worker and a �rm. The surplus to a matched worker is Vht � Vst ,
since the fallback position of a matched worker is to resume search or spend
time in leisure. At the optimum, these two alternatives yield equal utility.
Optimality implies that the marginal contribution to the value of the utility
maximization program of an additional unit of time in search equals zero:
Vst = 0. For �rms, the surplus of an additional employed worker isWht�Wvt .
At the optimum, it must also be the case that Wvt = 0. The joint surplus
in the symmetric equilibria we will study in this model is therefore equal to
Wht + Vht .
The wage divides match surplus between worker and �rm and is deter-
mined at the individual level (we abstract completely from collective bargain-
ing). Individual workers are hired by a representative �rm, which employs
many workers. Labor's bargaining power is summarized by � 2 [0; 1], theNash bargaining parameter which determines the split of the match surplus
going to the worker. The surplus to the worker is
Vht =wt(1� �t)� b
ct+ �(1� �h � ft)EtVht+1 : (15)
Note that as the solution to a standard Nash bargaining problem, the gross
(before tax) wage is continuously renegotiated and there are no ad hoc real
rigidities. In each period it solves
maxwt
� ln(Vht=�t) + (1� �) lnWht
16
subject to the de�nitions of Vht and Wht and taking �t as given. In the
Appendix, we show that the wage which solves this problem is given by:
wt =(1� �) b
1� �t+ � (1� �)
ytht+ �(1� �n)
a
qt
Et (�t+1 � �t)
1� �t+ ��ta
Et (1� �t+1)
1� �t:
(16)
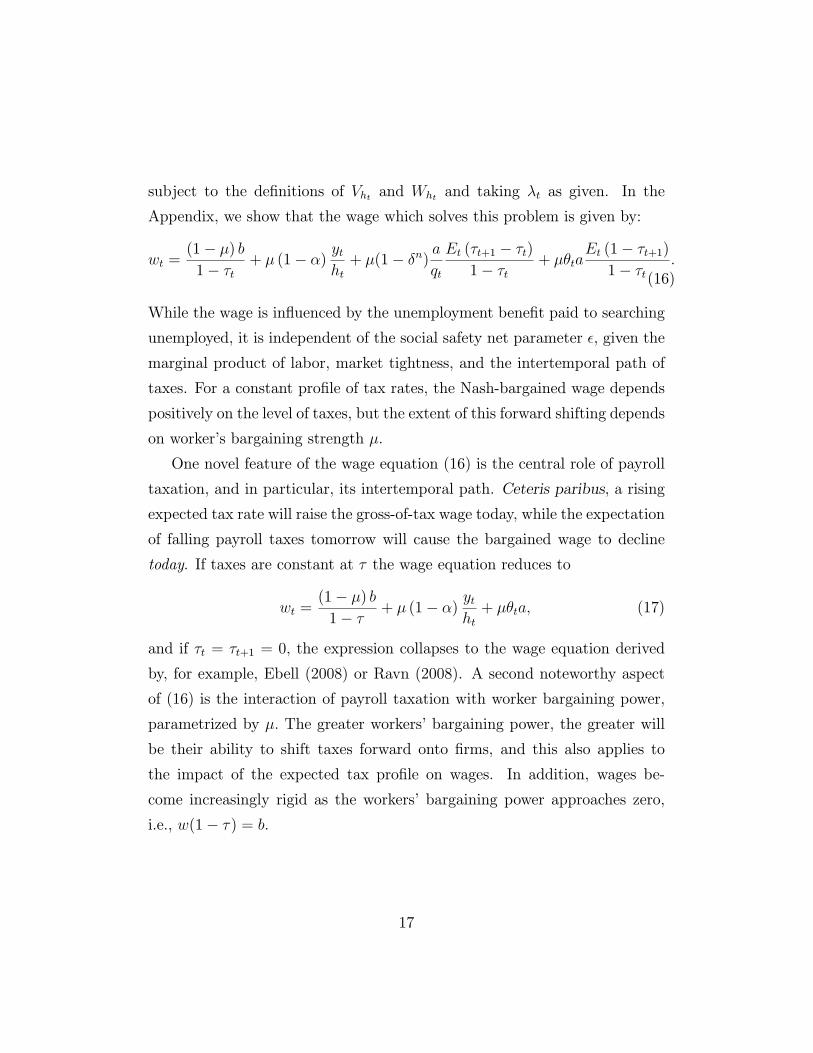
While the wage is in uenced by the unemployment bene�t paid to searching
unemployed, it is independent of the social safety net parameter �, given the
marginal product of labor, market tightness, and the intertemporal path of
taxes. For a constant pro�le of tax rates, the Nash-bargained wage depends
positively on the level of taxes, but the extent of this forward shifting depends
on worker's bargaining strength �.
One novel feature of the wage equation (16) is the central role of payroll
taxation, and in particular, its intertemporal path. Ceteris paribus, a rising
expected tax rate will raise the gross-of-tax wage today, while the expectation
of falling payroll taxes tomorrow will cause the bargained wage to decline
today. If taxes are constant at � the wage equation reduces to
wt =(1� �) b
1� �+ � (1� �)
ytht+ ��ta; (17)
and if �t = �t+1 = 0; the expression collapses to the wage equation derived
by, for example, Ebell (2008) or Ravn (2008). A second noteworthy aspect
of (16) is the interaction of payroll taxation with worker bargaining power,
parametrized by �: The greater workers' bargaining power, the greater will
be their ability to shift taxes forward onto �rms, and this also applies to
the impact of the expected tax pro�le on wages. In addition, wages be-
come increasingly rigid as the workers' bargaining power approaches zero,
i.e., w(1� �) = b.
17
4 Equilibrium and calibration
An equilibrium in this decentralized economy is de�ned as a set of sequences
of wages wt; capital rental rates rt, capital input �t, capital stock kt, capital
utilization rate ut, employment ht, search st, vacancies vt, output yt; con-
sumption ct, investment it, and payroll tax rates �t which satisfy optimality
conditions of households and �rms, resource and budget constraints as well
as a transversality condition for the capital stock, given the current values
of the state variables employment, technology, and capital.
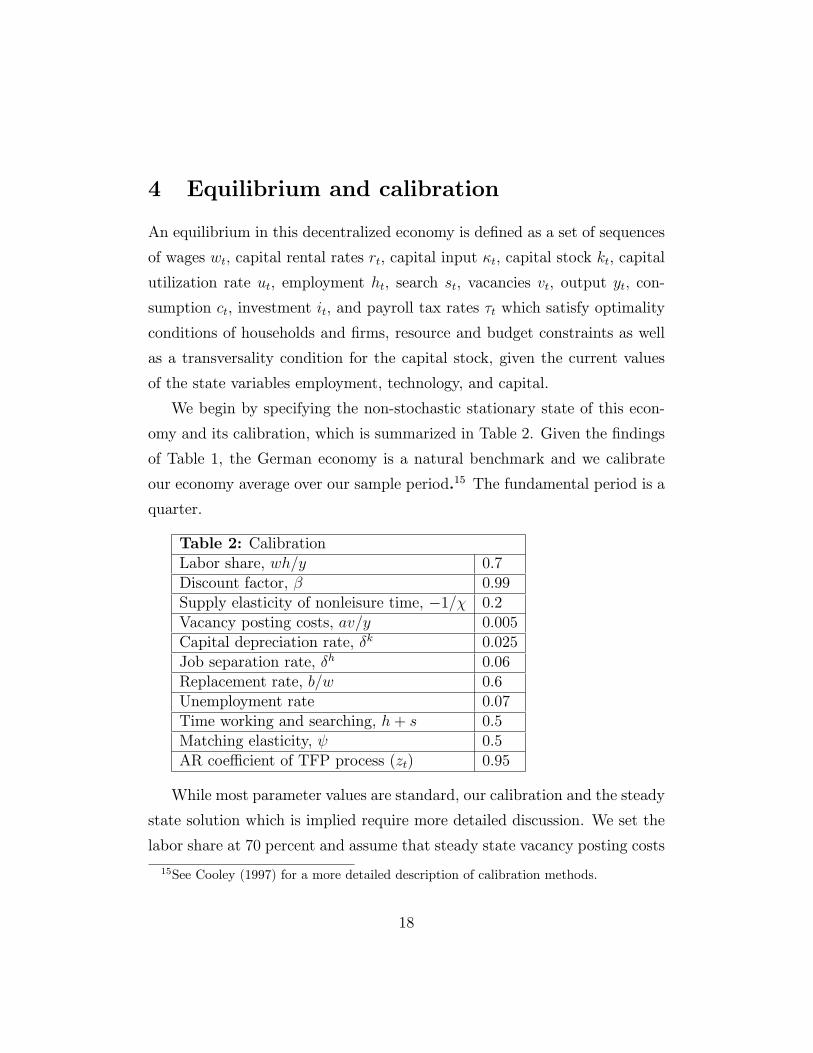
We begin by specifying the non-stochastic stationary state of this econ-
omy and its calibration, which is summarized in Table 2. Given the �ndings
of Table 1, the German economy is a natural benchmark and we calibrate
our economy average over our sample period.15 The fundamental period is a
quarter.
Table 2: CalibrationLabor share, wh=y 0.7Discount factor, � 0.99Supply elasticity of nonleisure time, �1=� 0.2Vacancy posting costs, av=y 0.005Capital depreciation rate, �k 0.025Job separation rate, �h 0.06Replacement rate, b=w 0.6Unemployment rate 0.07Time working and searching, h+ s 0.5Matching elasticity, 0.5AR coe�cient of TFP process (zt) 0.95
While most parameter values are standard, our calibration and the steady
state solution which is implied require more detailed discussion. We set the
labor share at 70 percent and assume that steady state vacancy posting costs
15See Cooley (1997) for a more detailed description of calibration methods.
18
are half a percent of output. Our choice of � implies an annual risk free rate
of four percent; physical capital depreciates at 2.5 percent per quarter. By
setting � = �5, we make labor supply less elastic than usually assumedin real business cycle models (� = �1 is associated with the log utilitycase).16 The model is calibrated to match the replacement rate, b=w, at 60
percent. This value is signi�cantly lower than that assumed by Hagedorn and
Manovskii (2008); furthermore it corresponds to values found in Germany
and other Western European countries. The steady state nonsleeping leisure
time 1 � h � s is set to 1=2 (Burda, Hamermesh, and Weil, 2008). The
average unemployment rate is seven percent and � is equated to the average
of observed rate for Germany (30 percent). The government's steady state
�nancing constraint
�wh
b= s+ "(1� s� h)
is used to �x " = 0:41. The �rm's vacancies equation and the wage equation
determineA and the relative bargaining power at � = 0:5455.17 The elasticity
parameter ! relating depreciation to capacity utilization is pinned down by
the �rst order conditions for the household (7) and (8):
! =1=� � 1 + �k
�k= 1:4040:
16This value is in line with micro studies of labor supply and de ects the usual criticismof the labor market in real business cycle models. We will show below that a high laborsupply elasticity is not needed to induce high employment volatility.17Note that the last parameter does not coincide with the elasticity of the matching
function, hence, the Hosios (1990) condition is not satis�ed in this economy. Given thesevere tax and other distortions already present, it seems inappropriate to assume thee�cient outcome of the search process.
19
5 Cyclical properties of the arti�cial econ-
omy
In this section, we examine the central predictions of the model with re-
spect to macroeconomic and labor market variables. In particular, we are
interested in arti�cial economies that display signi�cant cyclical behavior of
payroll taxes (see Table 1). To do this, we simulate the arti�cial economy
and compare the outcome to a representative Western European economy,
Germany, for which the Hall-Shimer-Ravn labor market puzzles are even
more pronounced than in the US (see Gartner, Merkl and Rothe (2009)).
We begin by presenting key facts regarding the correlations of vacancies, un-
employment, labor market tightness and labor productivity for the German
economy in Table 3. All data are quarterly, Hodrick-Prescott detrended and
cover the period 1970:I to 2008:IV.
We focus attention on three important empirical regularities in Table 3.
The most well-known is the Beveridge curve, the empirical negative corre-
lation between vacancies and unemployment. Secondly, the table features
the inverse relationship of unemployment and labor market tightness, which
is measured as the ratio of vacancies to unemployment. This measure of
tightness rises in booms and declines in recessions. Third, unemployment
and labor productivity, p, are slightly negatively correlated; booms tend to
be periods of higher labor productivity.
We begin the analysis by characterizing the dynamics of our arti�cial
economy without payroll taxes. This model is close in spirit to those studied
by Tripier (2003), Ravn (2008), and Veracierto (2008), who model distinct
activities in unemployment, i.e. search versus leisure. All these authors were
unable to replicate the negatively-sloped Beveridge curve, with unemploy-
ment instead uctuating procyclically; since unemployment is equated with
20
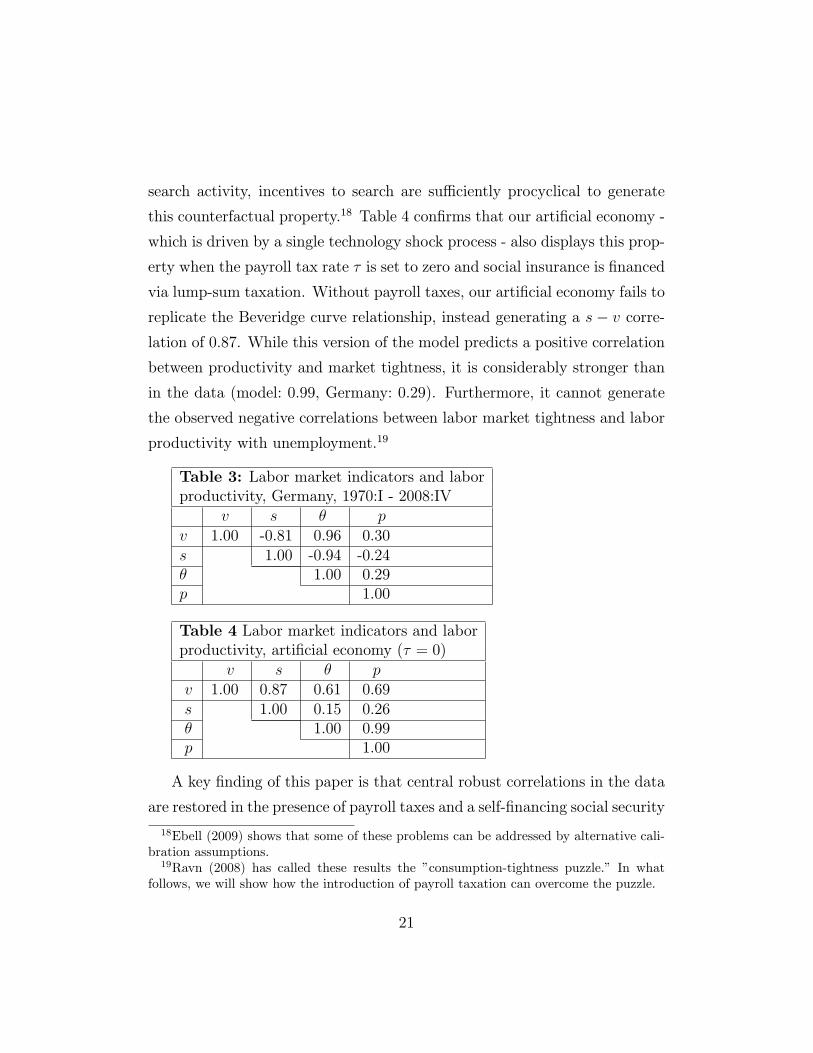
search activity, incentives to search are su�ciently procyclical to generate
this counterfactual property.18 Table 4 con�rms that our arti�cial economy -
which is driven by a single technology shock process - also displays this prop-
erty when the payroll tax rate � is set to zero and social insurance is �nanced
via lump-sum taxation. Without payroll taxes, our arti�cial economy fails to
replicate the Beveridge curve relationship, instead generating a s � v corre-
lation of 0:87. While this version of the model predicts a positive correlation
between productivity and market tightness, it is considerably stronger than
in the data (model: 0:99, Germany: 0:29). Furthermore, it cannot generate
the observed negative correlations between labor market tightness and labor
productivity with unemployment.19
Table 3: Labor market indicators and laborproductivity, Germany, 1970:I - 2008:IV
v s � pv 1.00 -0.81 0.96 0.30s 1.00 -0.94 -0.24� 1.00 0.29p 1.00
Table 4 Labor market indicators and laborproductivity, arti�cial economy (� = 0)
v s � pv 1.00 0.87 0.61 0.69s 1.00 0.15 0.26� 1.00 0.99p 1.00
A key �nding of this paper is that central robust correlations in the data
are restored in the presence of payroll taxes and a self-�nancing social security
18Ebell (2009) shows that some of these problems can be addressed by alternative cali-bration assumptions.19Ravn (2008) has called these results the "consumption-tightness puzzle." In what
follows, we will show how the introduction of payroll taxation can overcome the puzzle.
21
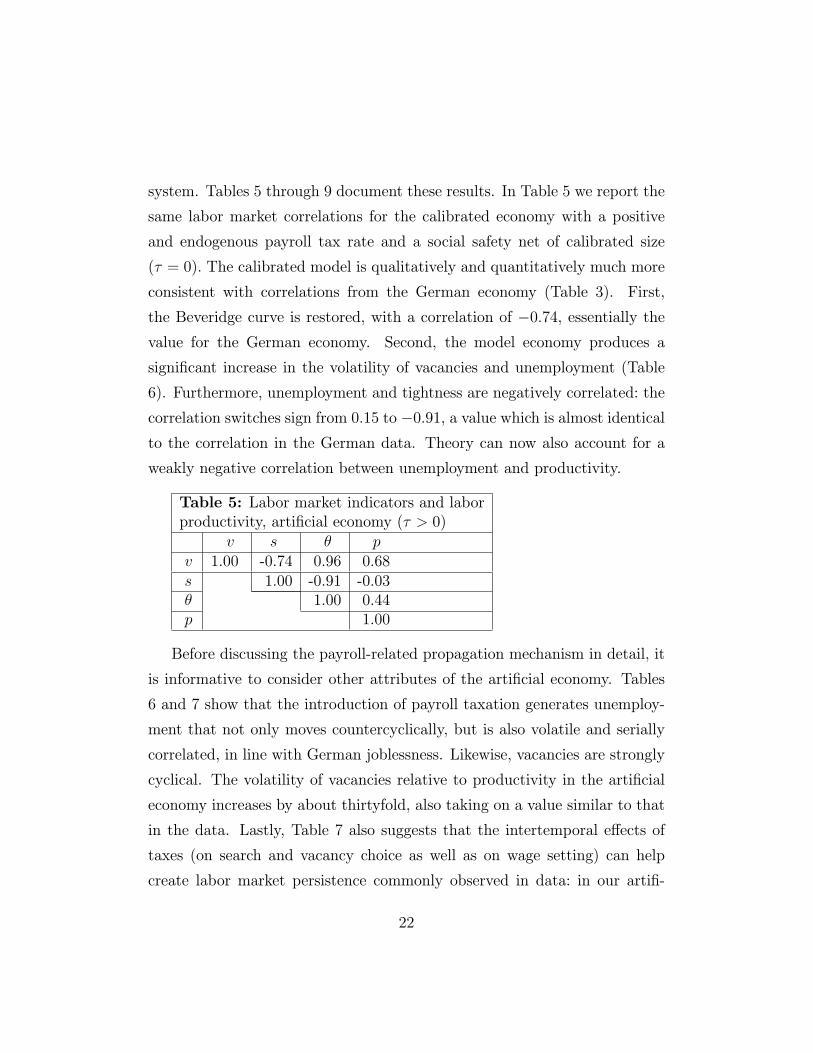
system. Tables 5 through 9 document these results. In Table 5 we report the
same labor market correlations for the calibrated economy with a positive
and endogenous payroll tax rate and a social safety net of calibrated size
(� = 0): The calibrated model is qualitatively and quantitatively much more
consistent with correlations from the German economy (Table 3). First,
the Beveridge curve is restored, with a correlation of �0:74, essentially thevalue for the German economy. Second, the model economy produces a
signi�cant increase in the volatility of vacancies and unemployment (Table
6). Furthermore, unemployment and tightness are negatively correlated: the
correlation switches sign from 0:15 to �0:91, a value which is almost identicalto the correlation in the German data. Theory can now also account for a
weakly negative correlation between unemployment and productivity.
Table 5: Labor market indicators and laborproductivity, arti�cial economy (� > 0)
v s � pv 1.00 -0.74 0.96 0.68s 1.00 -0.91 -0.03� 1.00 0.44p 1.00
Before discussing the payroll-related propagation mechanism in detail, it
is informative to consider other attributes of the arti�cial economy. Tables
6 and 7 show that the introduction of payroll taxation generates unemploy-
ment that not only moves countercyclically, but is also volatile and serially
correlated, in line with German joblessness. Likewise, vacancies are strongly
cyclical. The volatility of vacancies relative to productivity in the arti�cial
economy increases by about thirtyfold, also taking on a value similar to that
in the data. Lastly, Table 7 also suggests that the intertemporal e�ects of
taxes (on search and vacancy choice as well as on wage setting) can help
create labor market persistence commonly observed in data: in our arti�-
22
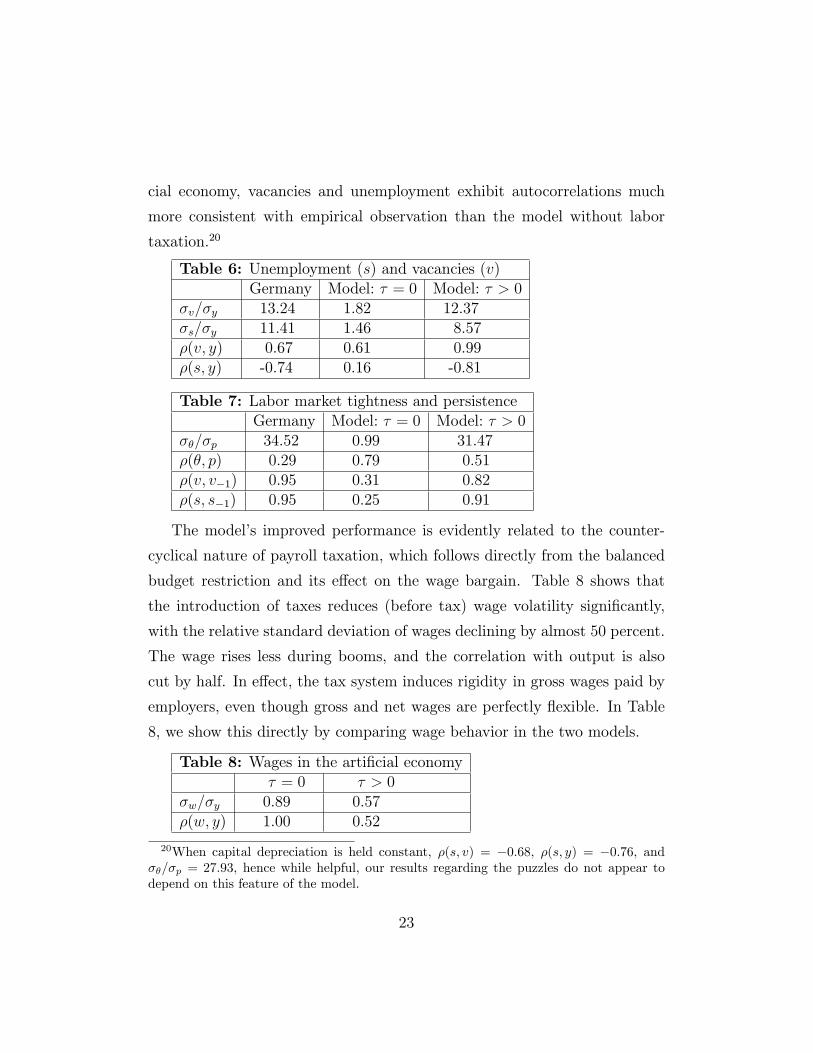
cial economy, vacancies and unemployment exhibit autocorrelations much
more consistent with empirical observation than the model without labor
taxation.20
Table 6: Unemployment (s) and vacancies (v)Germany Model: � = 0 Model: � > 0
�v=�y 13.24 1.82 12.37�s=�y 11.41 1.46 8.57�(v; y) 0.67 0.61 0.99�(s; y) -0.74 0.16 -0.81
Table 7: Labor market tightness and persistenceGermany Model: � = 0 Model: � > 0
��=�p 34.52 0.99 31.47�(�; p) 0.29 0.79 0.51�(v; v�1) 0.95 0.31 0.82�(s; s�1) 0.95 0.25 0.91
The model's improved performance is evidently related to the counter-
cyclical nature of payroll taxation, which follows directly from the balanced
budget restriction and its e�ect on the wage bargain. Table 8 shows that
the introduction of taxes reduces (before tax) wage volatility signi�cantly,
with the relative standard deviation of wages declining by almost 50 percent.
The wage rises less during booms, and the correlation with output is also
cut by half. In e�ect, the tax system induces rigidity in gross wages paid by
employers, even though gross and net wages are perfectly exible. In Table
8, we show this directly by comparing wage behavior in the two models.
Table 8: Wages in the arti�cial economy� = 0 � > 0
�w=�y 0.89 0.57�(w; y) 1.00 0.52
20When capital depreciation is held constant, �(s; v) = �0:68, �(s; y) = �0:76, and��=�p = 27:93, hence while helpful, our results regarding the puzzles do not appear todepend on this feature of the model.
23
In Figures 5 to 8 we plot impulse responses of the model economy to a
single productivity shocks with and without a payroll tax cum social security
net. In the presence of taxes, the model becomes substantially more persis-
tent, with output following a humped-shaped pattern. In particular, Figure
7 demonstrates the countercyclical pattern of taxes that arises endogenously
in response to a the positive technology shock. Figure 8 displays the rela-
tively rigid response of the wage, which is less volatile than output and dies
out rapidly.
Figures 5, 6, 7, and 8 about here
6 Dissecting and interpreting the mechanism
Our main �ndings thus far can be summarized as follows: a calibrated RBC
model with labor market frictions combined with an endogenous payroll tax
and a distortion of the search-leisure decision can signi�cantly increase en-
dogenous propagation and restore the Beveridge curve without ad hoc as-
sumptions regarding sticky wages, extreme fallback positions or low worker
bargaining power.
6.1 The central role of distortionary payroll taxation
We claim that the key factor accounting for our results is the dynamic path
of payroll taxes as described in Section 2. This being said, it is useful to
verify that our arti�cial economy generates payroll tax sequences similar to
those observed in the data. Table 9 shows that the payroll tax in the model
economy exhibits relative volatility and countercyclical behavior consistent
with the overall intertemporal pattern of payroll tax rates in the data noted in
Section 2. While the model's negative correlation of �t with output is stronger
than in the data, it is important to keep in mind that the model is driven by
24
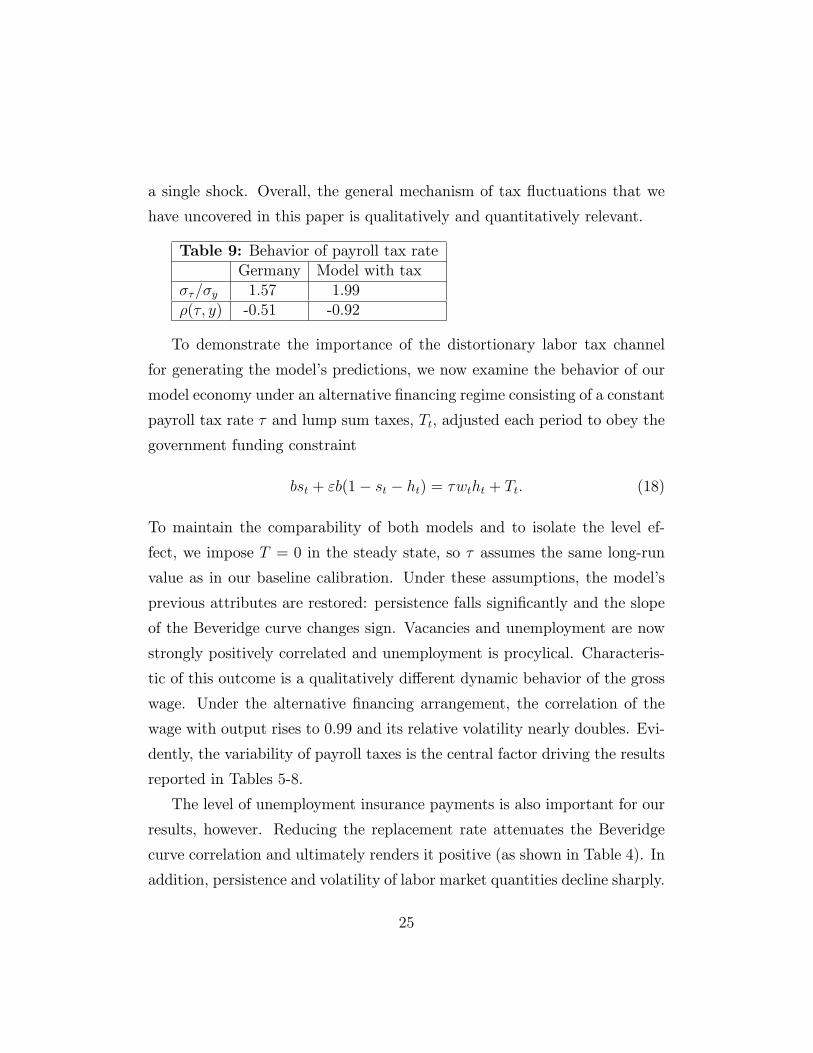
a single shock. Overall, the general mechanism of tax uctuations that we
have uncovered in this paper is qualitatively and quantitatively relevant.
Table 9: Behavior of payroll tax rateGermany Model with tax
��=�y 1.57 1.99�(�; y) -0.51 -0.92
To demonstrate the importance of the distortionary labor tax channel
for generating the model's predictions, we now examine the behavior of our
model economy under an alternative �nancing regime consisting of a constant
payroll tax rate � and lump sum taxes, Tt, adjusted each period to obey the
government funding constraint
bst + "b(1� st � ht) = �wtht + Tt: (18)
To maintain the comparability of both models and to isolate the level ef-
fect, we impose T = 0 in the steady state, so � assumes the same long-run
value as in our baseline calibration. Under these assumptions, the model's
previous attributes are restored: persistence falls signi�cantly and the slope
of the Beveridge curve changes sign. Vacancies and unemployment are now
strongly positively correlated and unemployment is procylical. Characteris-
tic of this outcome is a qualitatively di�erent dynamic behavior of the gross
wage. Under the alternative �nancing arrangement, the correlation of the
wage with output rises to 0:99 and its relative volatility nearly doubles. Evi-
dently, the variability of payroll taxes is the central factor driving the results
reported in Tables 5-8.
The level of unemployment insurance payments is also important for our
results, however. Reducing the replacement rate attenuates the Beveridge
curve correlation and ultimately renders it positive (as shown in Table 4). In
addition, persistence and volatility of labor market quantities decline sharply.
25
The generosity of the social welfare system, parametrized by ", plays a similar
role; reducing " lowers the volatility of vacancies and unemployment, while
preserving the Beveridge relation. Lower values of " reduce the size of the
payroll tax burden at any level of employment and the gross wage, thereby
reducing the amplitude of �t necessary to maintain budget balance at any
value of the wage bill. The margin between leisure and search is crucial for
generating volatility of labor market quantities; while the e�ect of lower "
is ambiguous in theory, the size of the welfare state in the calibrations we
study is important for generating our �ndings.21
6.2 Interpretation
The model with variable labor taxation o�er a better description of the labor
market because it induces a relative rigidity of gross wages, i.e. employers'
costs, and supports Hall's (2005) claim that �xed wages can align search
models and data.22 Yet gross and net wages in our arti�cial economy are
endogenous and only appear rigid. Although net wages and the return to
work rise in upturns when labor markets are tightening, the negative e�ects
on labor demand and vacancies are dampened by falling payroll taxes. Be-
cause gross wages react less strongly, higher employment does not translate
as rapidly into higher costs for �rms.
Consider a �rm which faces a higher realization of total factor productiv-
ity, zt. Because the posting of vacancies is a dynamic problem, present and
future wage labor costs determine the optimal policy via (14). If the gross
wage paid by �rms remains relatively at over time, the expected surplus of
21Note �t =b[st+"(1�st�ht)]
wtht, so for �xed b; s, h, and w, @�t@" =
b(1�st�ht)wtht
> 0: However,lower values of " will a�ect st, ht and wt, so the general equilibrium e�ect is theoreticallyambiguous.22In the extreme case of a zero workers' bargaining power, i.e. � ! 0, the wage (15)
does not respond to changes to productivity and it is �xed, given a constant tax rate.
26
creating jobs will be higher, and �rms post more vacancies, which raises their
volatility as well. At the same time, countercyclical payroll taxes renders net
after-tax wages much less procyclical. Hence, even with sticky wages, work-
ers will see expected bene�ts from search rise in booms (see Equation 9), but
because vacancies respond so strongly, optimal strategy according to (10)
involves less search in recessions, not more.
The dampened volatility of gross wages induced by payroll taxes is es-
sential for bringing our model correlations in line with the data (i.e. the
consumption-tightness puzzle). As Table 6 shows, the standard model can-
not generate countercyclical unemployment. Households respond to a posi-
tive productivity shock by moving out of leisure and into search activities,
which raises the level of unemployment sharply. In our model, a atter la-
bor cost pro�le induces the creation of many more vacancies than in the
standard formulation, so while a positive technological shock makes search
more attractive, searching workers are moved more rapidly out of leisure
and into employment. The result is that any stage of an expansion, fewer
agents are unemployed, which is also consistent with empirical evidence that
unemployment durations are strongly countercyclical. This is linked to the
fact that vacancies become relatively more volatile than search (Table 6) so
under the payroll tax regime search unemployment will be countercyclical {
the combined e�ect is a correctly sloped Beveridge curve.
7 Conclusions
It is well-known that payroll taxes represent a major long-run distortionary
in uence of governments on labor markets. We have established that they
also a�ect business cycle dynamics. For a number of Western European
economies as well as the United States for last two decades, the average pay-
27
roll tax burden has been countercyclical.23 Although we consider a speci�c
type of labor tax here, its behavior is consistent with Rogerson and Shimer's
(2010) description of a countercyclical labor wedge. Our study takes up the
role of payroll taxation and the social safety net { modeled as a generous sys-
tem of unemployment insurance { for cyclical uctuations in an nonmonetary
economy with labor market frictions and unemployment insurance, when the
latter is only imperfectly related to search e�ort. A balanced social insur-
ance budget renders gross wages more rigid over the cycle and, as a result,
strengthens the model's endogenous propagation mechanism. The existence
of social insurance strengthens this e�ect, as does worker bargaining power.
For conventional calibrations, the model can generate a negatively sloped
Beveridge curve and match the high volatility of vacancies and unemploy-
ment relative to labor productivity. While it is beyond the scope of this
study, it would be useful to examine micro data and uncover the quantita-
tive sources of countercyclical payroll taxation and to account for its behavior
over time.
It was not the purpose of this paper to produce a general account of the
high volatility of vacancies and unemployment in modern economies, but we
have identi�ed a new mechanism which can help us better understand the
labor market and its interaction with the business cycle. Countercyclical
taxation of labor can contribute towards resolving the Hall-Shimer puzzle
and realign theory with many labor market facts, but need not be the only
mechanism which does so, and evidence presented in Table 1 suggests that
a large number of forces may be at work in creating observed outcomes.
Our results for arti�cial economies imply that payroll taxes combined with a
23If we set " so the model matches average � in the US and steady state unemploymentequals �ve percent, our arti�cial economy's Beveridge correlation is �(u; v) = �0:45 (versus0:83 without variable payroll tax) and ��=�p = 6:23 (versus 1:76 without variable payrolltax).
28
high subsidy of leisure can signi�cantly a�ect the qualitative properties of an
important class of equilibrium business cycle models, and it would be easy to
identify other tax and transfer mechanisms that work in a similar fashion, in
particular, more general systems of labor taxation in which a balanced budget
constraint is operative in each period. The novel aspects of our model mimic
a particular facet of many OECD labor markets, and for the US in the latter
half of our sample. Without payroll taxes, our model would still exhibit the
anomaly identi�ed by Ravn (2008). The payroll tax mechanism, combined
with a su�ciently large social insurance system, represents a simple means
of accounting for central relative variances in the data while incorporating
an important feature of modern labor markets.
29
References
[1] Beveridge, William H. (1944): "The Government's Employment Policy,"
Economic Journal 54, 161-176.
[2] Bils, Mark (1985) \Real Wages over the Business Cycle: Evidence from
Panel Data" Journal of Political Economy 93: 666{89.
[3] Burda, Michael C. and Mark Weder (2002): "Complementarity of Labor
Market Institutions, Equilibrium Unemployment and the Persistence of
Business Cycles", German Economic Review 3, 1-24.
[4] Burda, Michael C., Dan S. Hamermesh and Philippe Weil (2008): "The
Distribution of Total Work in the EU and the US," in Tito Boeri, et
al. eds., Working Hour and Job Sharing in the EU and the USA: Are
Europeans Lazy or Americans Crazy?, Oxford: Oxford University Press.
[5] Chari, V. V., Patrick J. Kehoe and Ellen R. McGrattan (2008): "Busi-
ness Cycle Accounting", Econometrica 75, 781-836.
[6] Cole, Harold L. and Richard Rogerson (1999): "Can the Mortensen-
Pissarides Matching Model Match the Business-Cycle Facts?," Interna-
tional Economic Review 40, 933-59.
[7] Cooley, Thomas F. (1997): "Calibrated Models", Oxford Review of Eco-
nomic Policy 13, 55-69.
[8] Costain, Jim and Michael Reiter (2008): "Business Cycles, Unemploy-
ment Insurance, and the Calibration of Matching Models," Journal of
Economic Dynamics and Control 32:1120{1155.
[9] Ebell, Monique (2009): "Resurrecting the Participation Margin",
mimeo.
30
[10] Gal��, Jordi and Thijs van Rens (2010): "The Vanishing Procyclicality of
Labor Productivity," mimeo, July 2010.
[11] Gartner, Hermann, Christian Merkl and Thomas Rothe (2009): "They
are Even Larger! More (on) Puzzling Labor Market Volatilities", IZA
Discussion Paper 4403.
[12] Gertler, Mark and Antonella Trigari (2009): "Unemployment Fluctua-
tions with Staggered Nash Wage Bargaining", Journal of Political Econ-
omy 117, 38-86.
[13] Greenwood, Jeremy, Zvi Hercowitz and Gregory Hu�man (1988): "In-
vestment, Capacity Utilization, and the Real Business Cycle", American
Economic Review 78, 402-417.
[14] Hagedorn, Marcus and Iourii Manovskii (2008): "The Cyclical Behav-
ior of Equilibrium Unemployment and Vacancies Revisited", American
Economic Review 98, 1692-1706.
[15] Hall, Robert (2005): "Employment Fluctuations with EquilibriumWage
Stickiness", American Economic Review 95, 50-65.
[16] Hall, Robert and Paul R. Milgrom (2008): "The Limited In uence of
Unemployment on the Wage Bargain", American Economic Review 98,
1653-1674.
[17] Hornstein, Andreas, Per Krusell and Giovanni L. Violante (2005): "Un-
employment and Vacancy Fluctuations in the Matching Model: In-
specting the Mechanism", Federal Reserve Bank of Richmond Economic
Quarterly 91, 19-51.
[18] Hosios, A. (1990): "On the E�ciency of Matching and Related Models of
Search and Unemployment," Review of Economic Studies 57, 279-298.
31
[19] Kaldor, Nicholas (1936): \Wage Subsidies as a Remedy for Unemploy-
ment," Journal of Political Economy 44, 721-742.
[20] Keynes, John M. (1942): letter to James Meade in: Kenyes, John
Maynard (1980). The Collected Writings of John Maynard Keynes Vol-
ume 27. Edited by Donald Moggridge. Macmillan, Cambridge University
Press, 217-8.
[21] Meade, James (1938): Consumers' Credits and Unemployment, Oxford:
Oxford University Press.
[22] Merz, Monika (1995): "Search in the labor market and the real business
cycle," Journal of Monetary Economics 36, 269-300.
[23] Ravn, Morten (2008): "The Consumption-Tightness Puzzle", in: Reich-
lin, Lucrecia and West, Kenneth (eds.) NBER International Seminars
in Macroeconomics, Chicago: University of Chicago Press.
[24] Rogerson, Richard and Robert Shimer (2010): "Labor Search", in Hand-
book of Labor Economics, forthcoming.
[25] Romer, David and Christina Romer (2009): "A Narrative Analysis of
Postwar Tax Changes", (Appendix to "The Macroeconomic E�ects of
Tax Changes: Estimates Based on a New Measure of Fiscal Shocks.")
[26] Shimer, Robert (2005): \The Cyclical Behavior of Equilibrium Unem-
ployment and Vacancies," American Economic Review 95, 25{49.
[27] Shimer, Robert (2009): Labor Markets and Business Cycles, manuscript,
University of Chicago.
[28] Tripier, Fabien (2003): "Can the Labor Market Search Model Explain
Fluctuations of Allocations of Time?", Economic Modeling 21, 131-46.
32
[29] Veracierto, Marcelo (2008): "On the Cyclical Behavior of Employment,
Unemployment and Labor Force Participation", Journal of Monetary
Economics 55, 1143-57.
33
8 Appendix: Wage equation
The �rst order condition from the Nash bargaining problem is
� (1� �t)
ctVht=(1� �)
Wht
or, given that the value of an additional employed worker to the �rm is given
by
ctVht =� (1� �t)
1� �
"(1� �)
ytht� wt + (1� �n)
a
qt
#(A1)
Lead this expression by one period and premultiply by the pricing kernel
�t+1:
�t+1ct+1Vht+1 =� (1� �t+1)
1� ��t+1
"(1� �)
yt+1ht+1
� wt+1 + (1� �n)a
qt+1
#:
Take expectation of both sides conditional on t; and the fact that �t+1ct+1 =
�ct to rewrite the last expression as
Et�t+1ct+1Vht+1 = �ctEtVht+1 =�Et (1� �t+1)
1� �
a
qt
Premultiply both sides of the household surplus from employment by ct,
substitute the last expression and use �t+1 = �ct=ct+1 to obtain
ctVht = (1� �t)wt � b+ �t+1(1� �n � ft)ct+1EtVht+1
and
ctVht = (1� �t)wt � b+ (1� �n � ft)�Et (1� �t+1)
1� �
actqt
Now insert this and (A1) into the Nash bargaining �rst-order condition:
�(1� �t)
"(1� �)
ytht� wt + (1� �n)
a
qt
#
= (1� �)
"(1� �t)wt � b+ (1� �n � ft)
�Et (1� �t+1)
1� �
a
qt
#
34
which can be solved to obtain
wt =(1� �) b
1� �t+ � (1� �)
ytht+ �(1� �n)
a
qt� �(1� �n � ft)
a
qt
Et (1� �t+1)
1� �t
or
wt =(1� �) b
1� �t+� (1� �)
ytht+�(1� �n) a
qt
Et (�t+1 � �t)
1� �t+��ta
Et (1� �t+1)
1� �t:
35
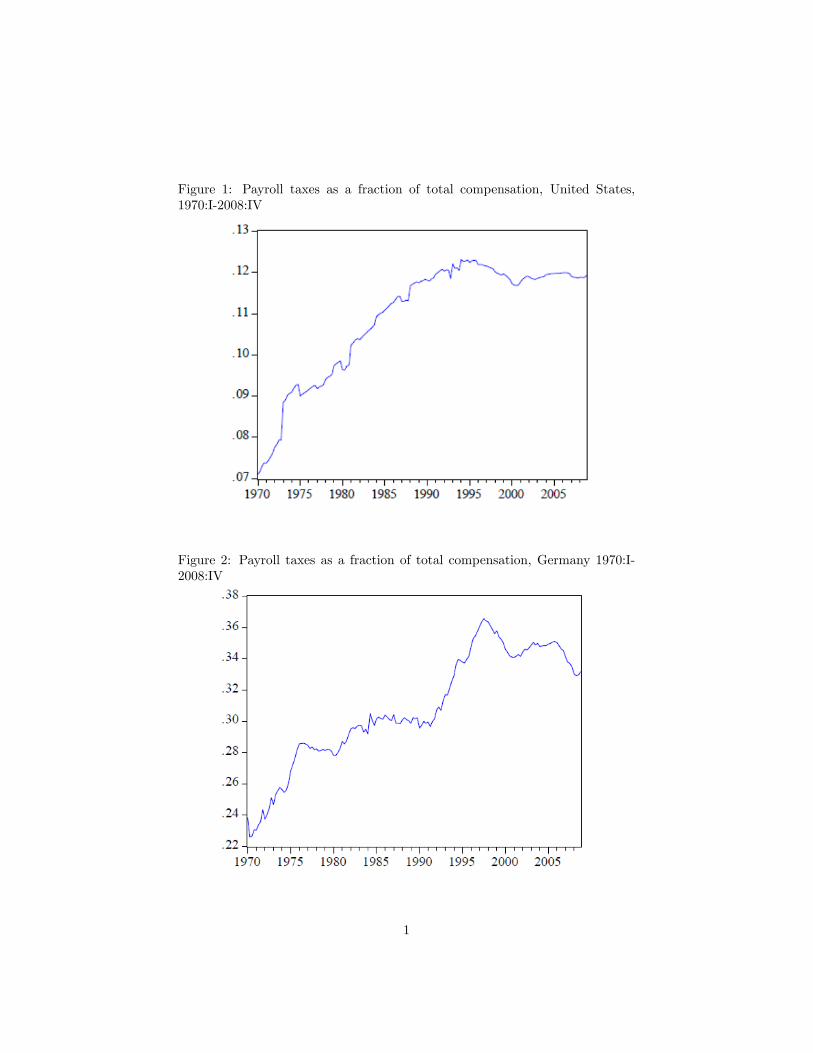
Figure 1: Payroll taxes as a fraction of total compensation, United States,1970:I-2008:IV
Figure 2: Payroll taxes as a fraction of total compensation, Germany 1970:I-2008:IV
1
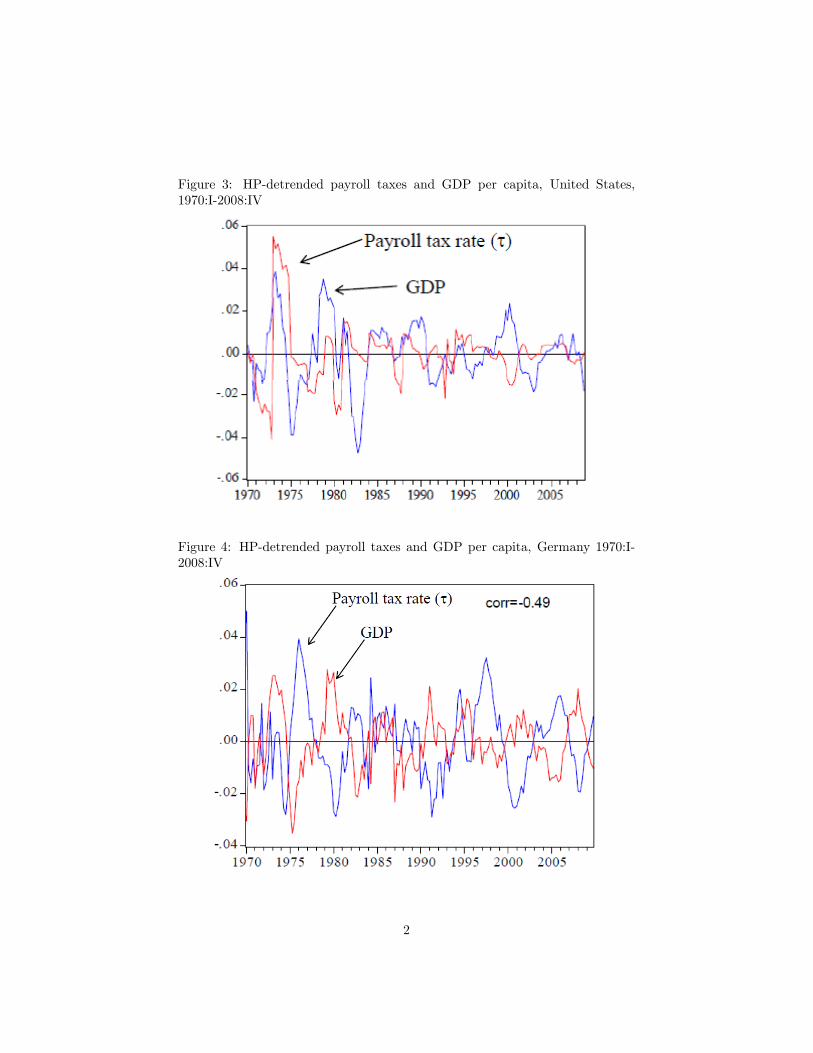
Figure 3: HP-detrended payroll taxes and GDP per capita, United States,1970:I-2008:IV
Figure 4: HP-detrended payroll taxes and GDP per capita, Germany 1970:I-2008:IV
2
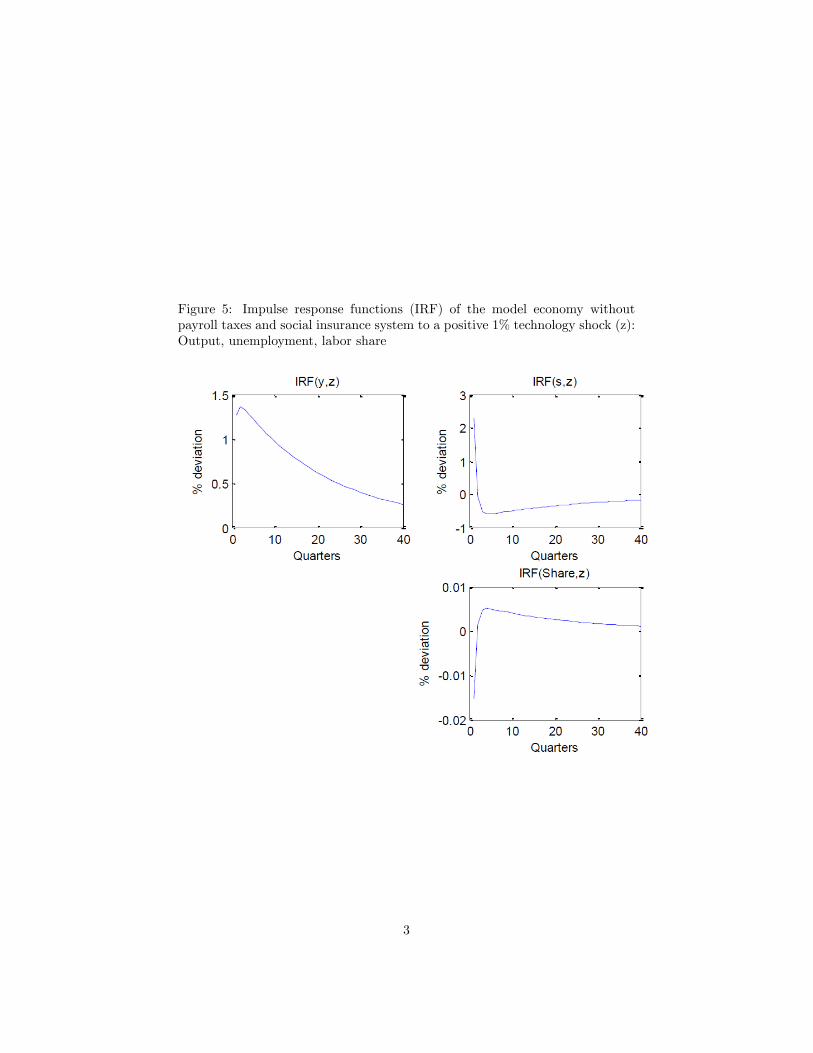
Figure 5: Impulse response functions (IRF) of the model economy withoutpayroll taxes and social insurance system to a positive 1% technology shock (z):Output, unemployment, labor share
3
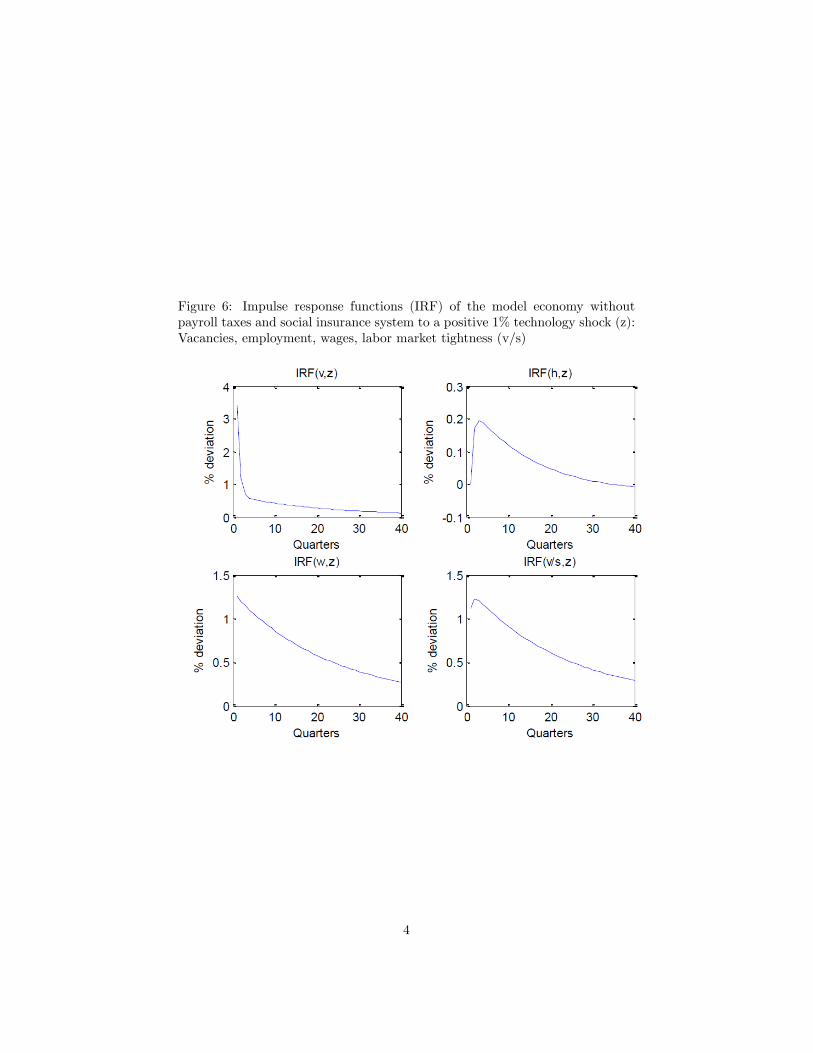
Figure 6: Impulse response functions (IRF) of the model economy withoutpayroll taxes and social insurance system to a positive 1% technology shock (z):Vacancies, employment, wages, labor market tightness (v/s)
4
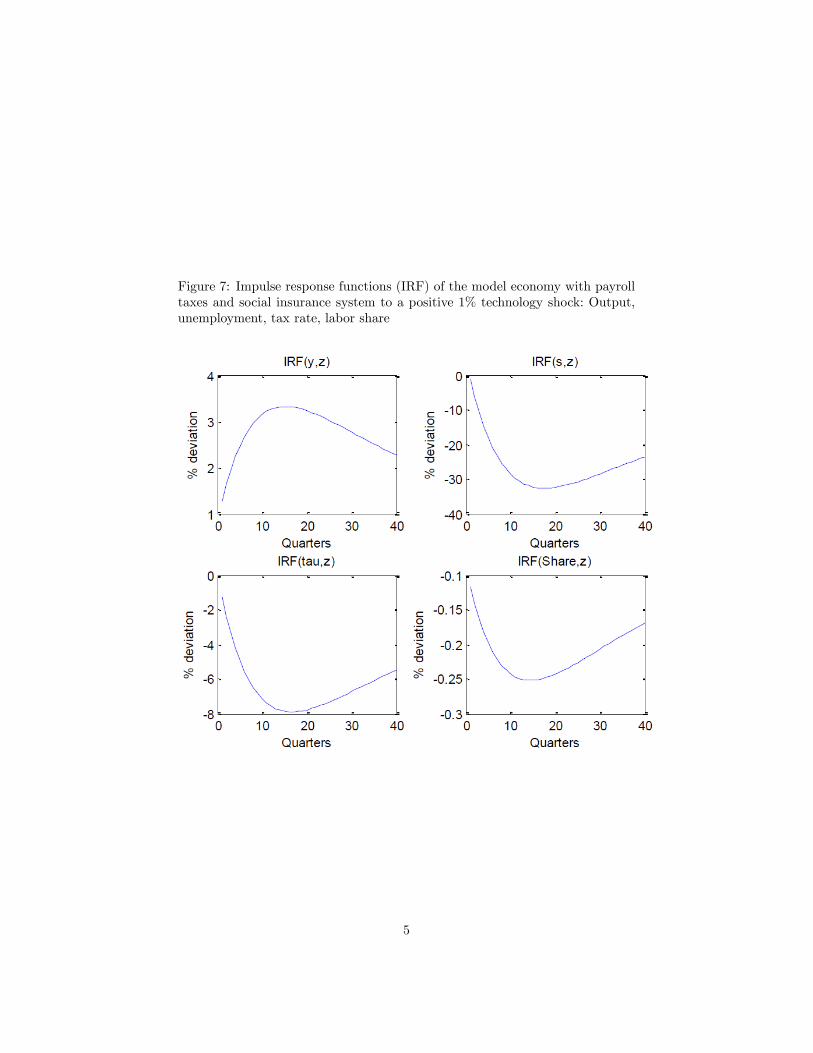
Figure 7: Impulse response functions (IRF) of the model economy with payrolltaxes and social insurance system to a positive 1% technology shock: Output,unemployment, tax rate, labor share
5
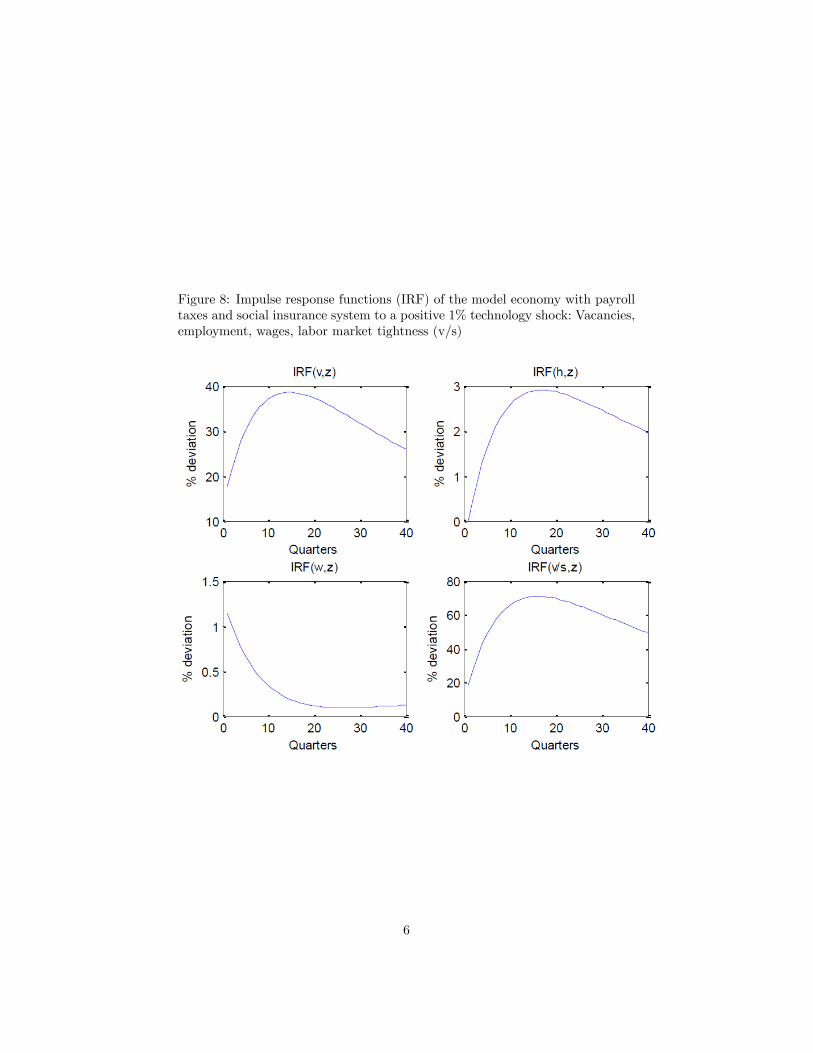
Figure 8: Impulse response functions (IRF) of the model economy with payrolltaxes and social insurance system to a positive 1% technology shock: Vacancies,employment, wages, labor market tightness (v/s)
6