Embed Size (px)
Citation preview

PAYMENT REFORM: HOW IS IT WORKING SO FAR?
Len M. Nichols, Ph.D. George Mason University
Altarum Annual Symposium on Sustainable Health Spending
Washington, DC July 21, 2015

OUTLINE
What IS Payment Reform? What Do We HOPE Payment Reform Will Accomplish Evidence So Far Macro Impact Federal initiatives Private Sector Initiatives
What to Watch For

WHAT IS PAYMENT REFORM?
Anything that is NOT traditional FFS, IF it IS linked to quality, value Models: P4P, PCMH, Bundled payment, partial capitation, global capitation, ACOs
Note: Not all PCMHs nor ACOs are the same… Medicare Programs: Value based Payment (hospitals, physicians) MA quality bonus
payment, Medicare Shared Savings ACO, APMs, especially those included in SGR fix, and the array of CMMI pilots (I will focus on CPCI and MAPCP, plus some HCIA)
Questions: Must there be downside risk? How do private and public incentive programs align?
CPR says 38% of H, 10% of spec, and 24% of PCP $ are “value” oriented What percentage of APM is “tipping point” for FFS?
Extra Credit: Does Market Basket Update Reduction Count? Readmit Penalties? HAC
penalties?


5

WHAT DO WE HOPE PAYMENT REFORM WILL ACCOMPLISH?
Bend the Cost Curve Reduce cost growth below trend Equate health care cost growth with GDP growth Reduce level of health spend to OECD average
Align Interests of “enough” participating providers with cost growth reduction to make it permanent and close to GDP growth
Improve quality, outcomes, and health Makes pursuit of these more profitable than volume per se

MACRO IMPACT SO FAR

HEALTH SPENDING AS SHARE OF GDP
5 7
8.9
12.1 13.4
16.4 17.4 17.4 17.4 17.4 17.4
0
2
4
6
8
10
12
14
16
18
20
1960 1970 1980 1990 2000 2008 2009 2010 2011 2012 2013
Source: CMS National Health Spending Accounts
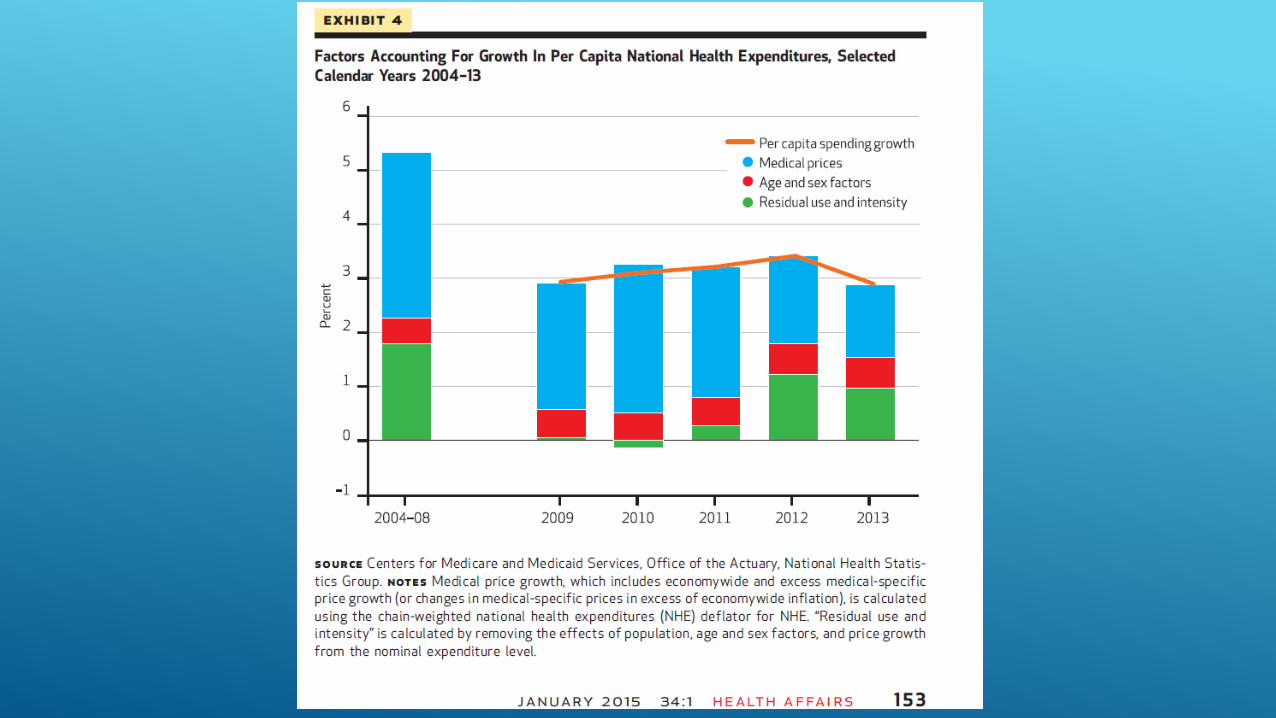

HEALTH CARE SPENDING GROWTH RATES
0
1
2
3
4
5
6
7
8
9
2008 2009 2010 2011 2012 2013
Annual rate of spending growth
Medicare Private
Hartman et al, Health Affairs January 2015 (CMS Actuaries’ annual article)


OTHER EARLY EVALUATION RESULTS
MAPCP: 1st year, 2 of 8 initiatives reduced cost growth, limited evidence of utilization reductions (quality, experience of care data not yet available)
HCIA: Hospital based: 7 of 10 have N too small, no stat significant impact in rest in first year
HCIA: Complex/High Risk Patient Targeting: 23 awardees, data agreements not in place to permit analysis for first report
PCPCC 2015: of peer reviewed, 6/10 reduced cost; 12/13 reduced utilization, 2/3 improved quality, 4/4 improved patient satisfaction


WHAT TO WATCH FOR
Evaluation Results are largely early in implementation, impact of CQI is cumulative Still, glass seems a little more than half full to me
Incentive programs largely 1.0, not 2.0 or 3.0
Shifting from claims based to claims+clinical metrics coming, slower than hoped
Implementations largely trying to follow “road to Emmaus” (meet providers where they are), this is bound to produce mixed results
May need new institutions for next and lasting phase
Reinsurance for downside risk
Coaching infrastructure “on call” for transition to optimally coordinated care
More subtle antitrust policy:
Consolidation pressures may turn efficiencies into higher margins