Embed Size (px)
Citation preview
1
Barbara Bruns,
Lead Education Economist,
Latin America and The Caribbean
Region
Claudio Ferraz
Professor of Economics
Pontifical Catholic University (PUC)
Rio de Janeiro,
Brasil
Jessica Rodriguez,World Bank
Tassia Cruz, Vitor Pereira (consultants)
Paying Teachers to
Perform:
The Effects of Bonus Pay
in Pernambuco, Brazil
Washington, DC
December 7, 2011
Global evidence on bonus pay: what do we know? What do we need to know?
Brazilian education context
Education context in Pernambuco and the bonus pay program
PE Evaluation design:
Impact of first year (discontinuous) targets on school performance - RD
Impact of first round bonus attainment/not on school performance – RD
Impact of introducing bonus pay on system-wide performance – Dif-in-dif
Bonus pay and teachers’ classroom practice - panel of classroom
observations
Bonus pay and schools’ “social capital” - survey of school directors
Results to date
Next Steps
Overview
2
Pay for performance: global experience
Increasingly common in OECD and MICs
Annual bonus pay:Rewards for individual teachersRewards for schools
Performance incentives strongest if individual teachers are rewarded for their students’ learning progress, but hard to doRequires testing all grades and subjects twice a year
Relatively expensive (20% of wage bill) compared to information and SBM (but not compared to across-the-board wage increases)
Most systems adopt school-based (group) bonuses
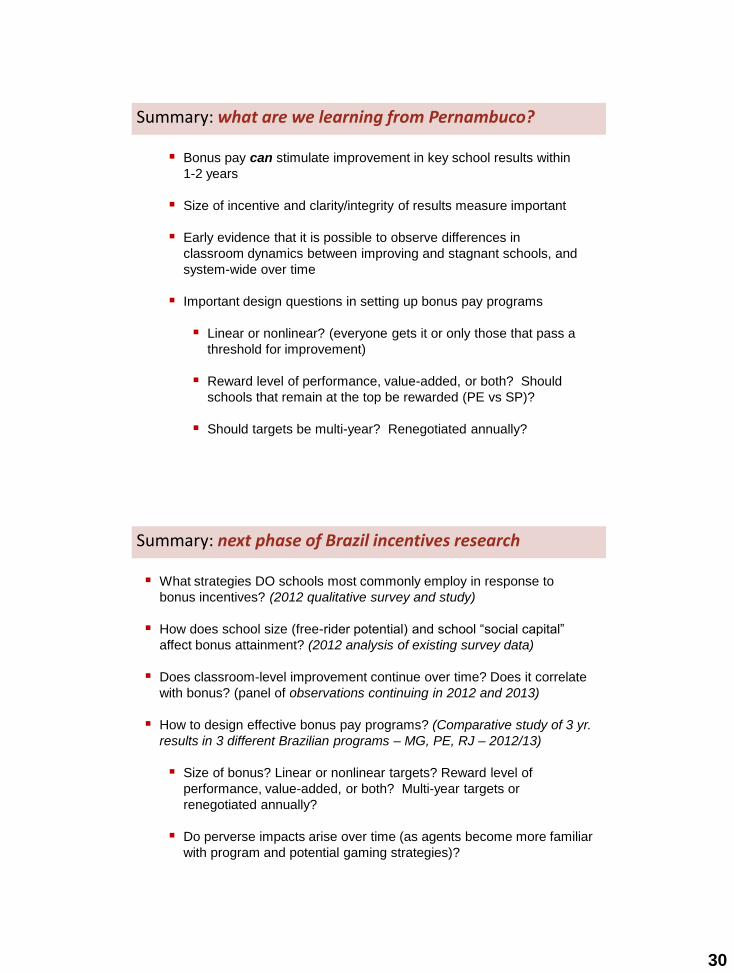
What is the evidence on Pay for Performance?
Country Approach
India:Andhra Pradesh:
Annual bonus based on student test scores – both school-level and individual (RCT)
Rajasthan: Individual bonus for teacher attendance (RCT)
Israel: Individual bonus based on student test results (RD)
School bonus based on multiple student performance measures (tests, graduation rates, credits taken) (RD)
Kenya: School bonus based on student test results (RCT)
(preschools): individual bonus for teacher attendance (RCT)
Brazil:Pernambuco, Rio, SP, MG
School bonus based on student test results and grade progression (RD, DD)
Chile (SNED): School bonus based on multiple measures (tests and other school factors) (DD)
3
What is the evidence on Pay for Performance?
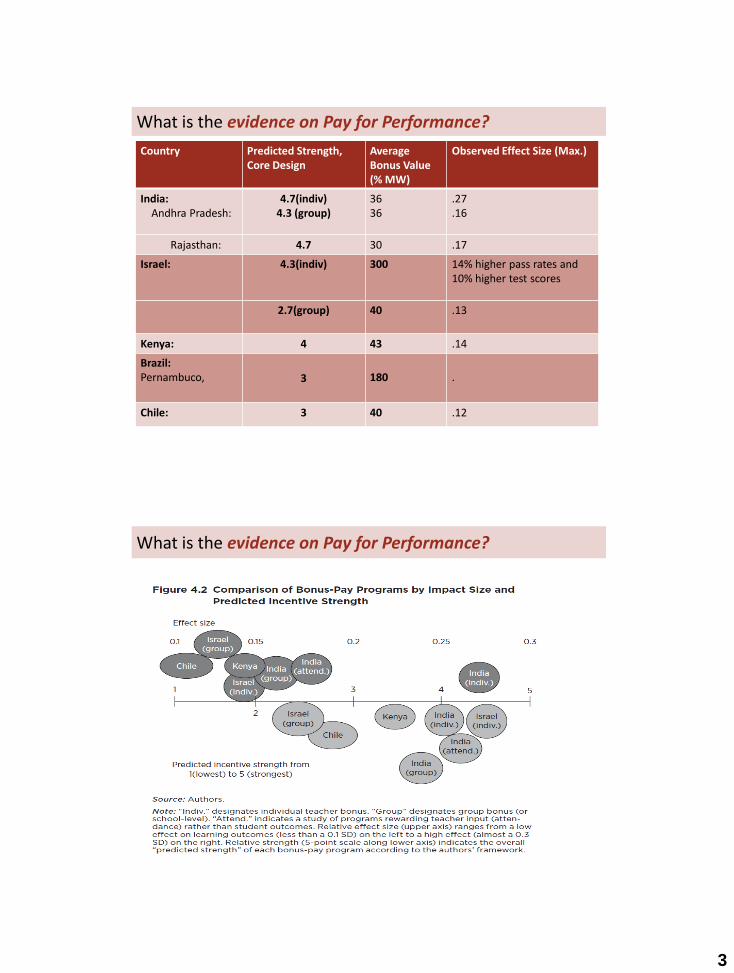
Country Predicted Strength, Core Design
Average Bonus Value (% MW)
Observed Effect Size (Max.)
India:Andhra Pradesh:
4.7(indiv)4.3 (group)
3636
.27
.16
Rajasthan: 4.7 30 .17
Israel: 4.3(indiv) 300 14% higher pass rates and 10% higher test scores
2.7(group) 40 .13
Kenya: 4 43 .14
Brazil:Pernambuco, 3 180 .
Chile: 3 40 .12
What is the evidence on Pay for Performance?
4
What is the evidence on Pay for Performance?
• Bonus pay raised student learning outcomes 0.13-0.27 SD (highest for individual teacher incentives in India)
• Latest US evidence is different: even large bonuses have no impact on student results (Nashville, NYC)
• In some cases, bonus lowered teacher absence, but not always (puzzling)
• Most consistent “pathway” was extra teacher effort out of school
• Research frontier now is to explain these results: Design features
Controllability (noise in performance measure + locality) Size of bonus Coverage/predictability of bonus
• Deepen understanding of how incentives change teacher behavior • inside the classroom:•
Positive: stimulate teacher effort Negative: perverse behaviors
Brazilian
Educational
Context
5
Decentralized system with high coverage and low quality – 27 state systems and 5,500 municipal school systems- 40 million students, 1.9 million teachers, 200,000 schools
National concern about education quality for 15 years and consistent reform efforts with some success (PISA improvement 2000-2009)
Teacher quality widely viewed as key issuenon-selective entry into teacher trainingaverage salaries relatively low ((1 time GDP/cap)teacher vacancies in secondary education, esp. math and science
Highly regarded national “results measurement” system – IDEB (Index of Basic Education Quality)
Prova Brasil/SAEB - census-based test of math and portuguese at 3rd, 5th and 9th grade levels every two years and sample based 12th grade test
National school census data on student flows Politically visible, understandable composite IDEB score for all 27 state
and 5,500 municipal school systems
Ready-made framework for states to build on for annual school results measurement (SAEPE, SARESP, SAERJ)
Brazilian Educational Context
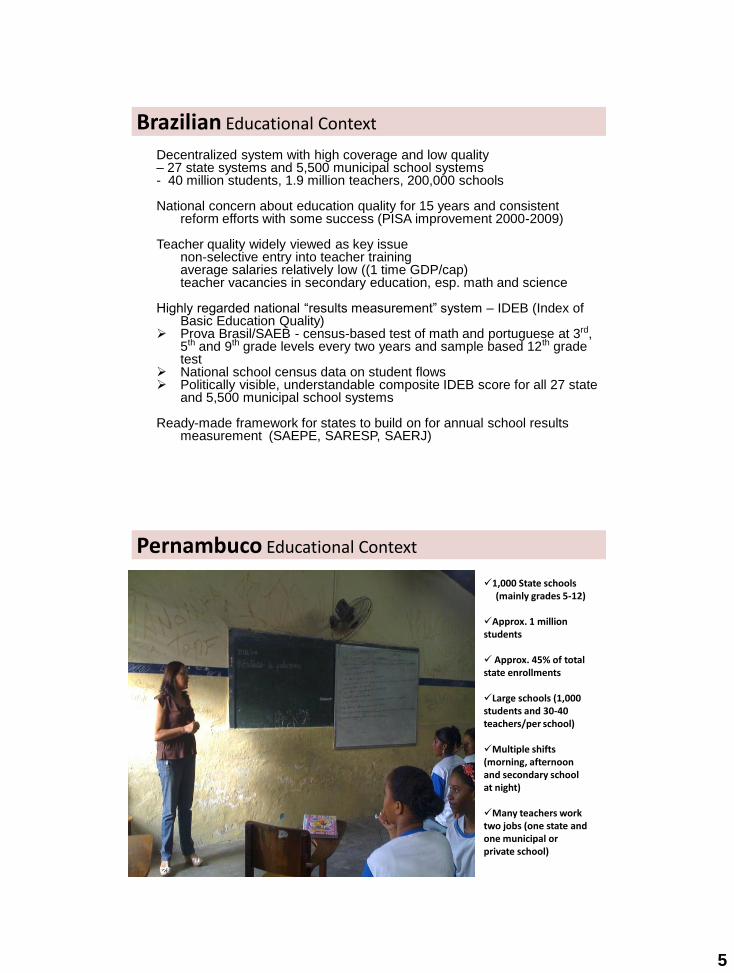
Pernambuco Educational Context
1,000 State schools(mainly grades 5-12)
Approx. 1 million students
Approx. 45% of total state enrollments
Large schools (1,000 students and 30-40 teachers/per school)
Multiple shifts (morning, afternoon and secondary school at night)
Many teachers work two jobs (one state and one municipal or private school)
6
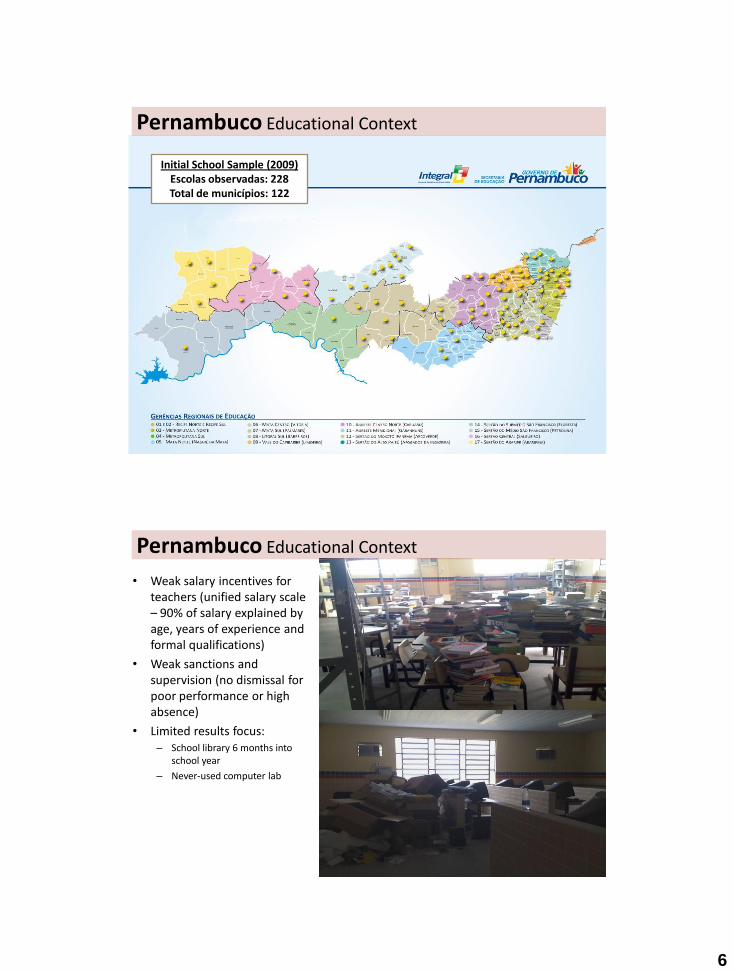
Initial School Sample (2009) Escolas observadas: 228Total de municípios: 122
Pernambuco Educational Context
• Weak salary incentives for teachers (unified salary scale – 90% of salary explained by age, years of experience and formal qualifications)
• Weak sanctions and supervision (no dismissal for poor performance or high absence)
• Limited results focus:– School library 6 months into
school year
– Never-used computer lab
Pernambuco Educational Context
7
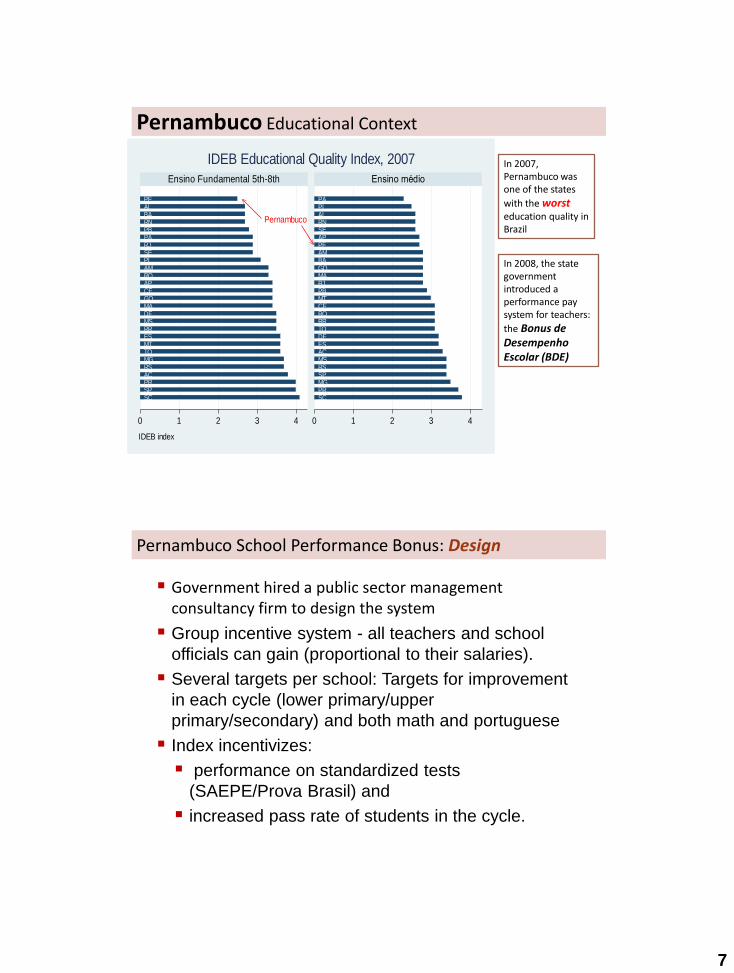
SCSPPRACRSMGTOMTESRRMSDFMAGOCEAPROAMPISERJPAPBRNBAALPE
SCPRMGSPRSMSACESDFTORRROCEMTPBRJMAGOBAAMPEAPSERNALPIPA
0 1 2 3 4 0 1 2 3 4
Ensino Fundamental 5th-8th Ensino médio
Pernambuco
IDEB index
IDEB Educational Quality Index, 2007
Pernambuco Educational Context
In 2007, Pernambuco was one of the states
with the worst education quality in Brazil
In 2008, the state government introduced a performance pay system for teachers:
the Bonus de DesempenhoEscolar (BDE)
Government hired a public sector management consultancy firm to design the system
Group incentive system - all teachers and school
officials can gain (proportional to their salaries).
Several targets per school: Targets for improvement
in each cycle (lower primary/upper
primary/secondary) and both math and portuguese
Index incentivizes:
performance on standardized tests
(SAEPE/Prova Brasil) and
increased pass rate of students in the cycle.
Pernambuco School Performance Bonus: Design
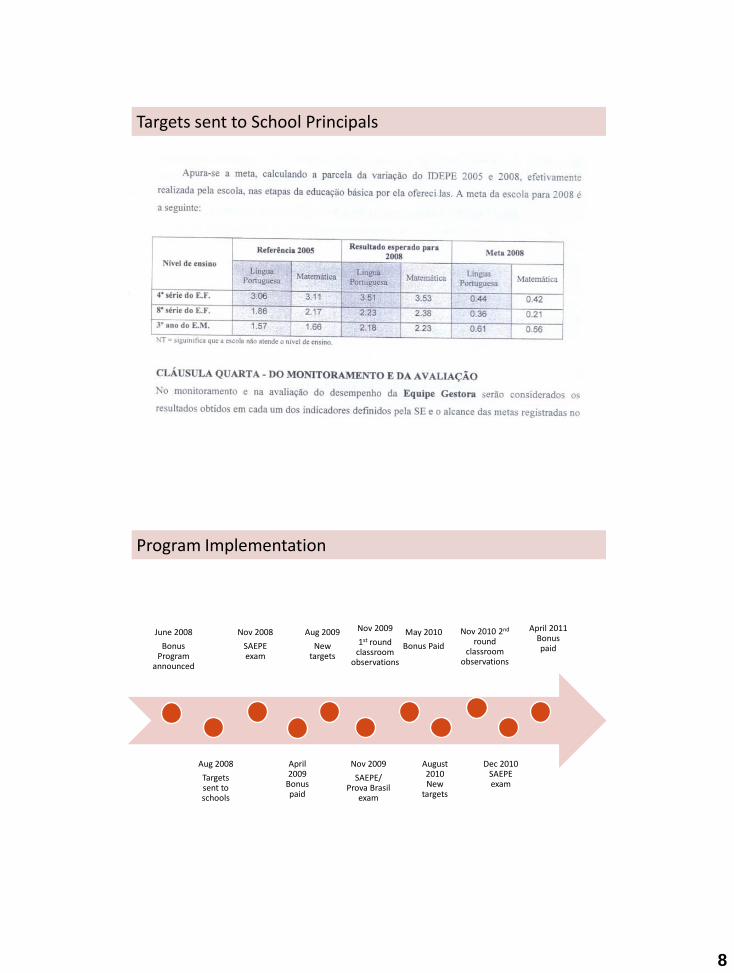
8
Targets sent to School Principals
June 2008
Bonus Program
announced
Aug 2008
Targets sent to schools
Nov 2008
SAEPE exam
April 2009
Bonus paid
Aug 2009
New targets
Nov 2009
SAEPE/ Prova Brasil
exam
May 2010
Bonus Paid
August 2010 New
targets
Nov 2010 2nd
round classroom
observations
Dec 2010 SAEPE exam
April 2011 Bonus paid
Program Implementation
Nov 2009
1st round classroom
observations
9
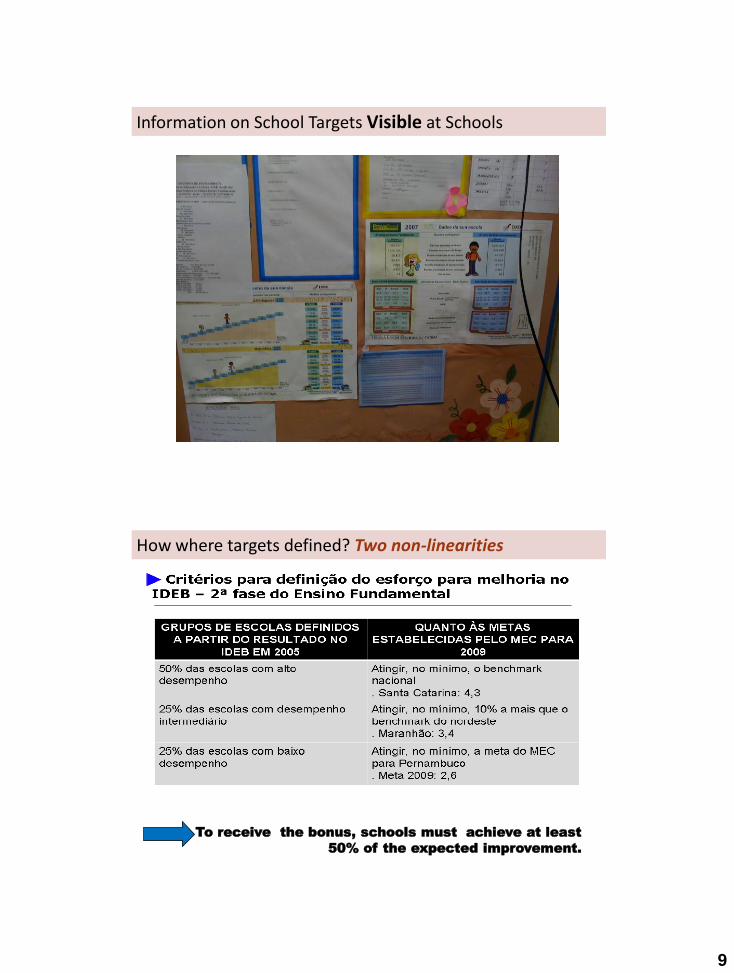
Information on School Targets Visible at Schools
To receive the bonus, schools must achieve at least
50% of the expected improvement.
How where targets defined? Two non-linearities
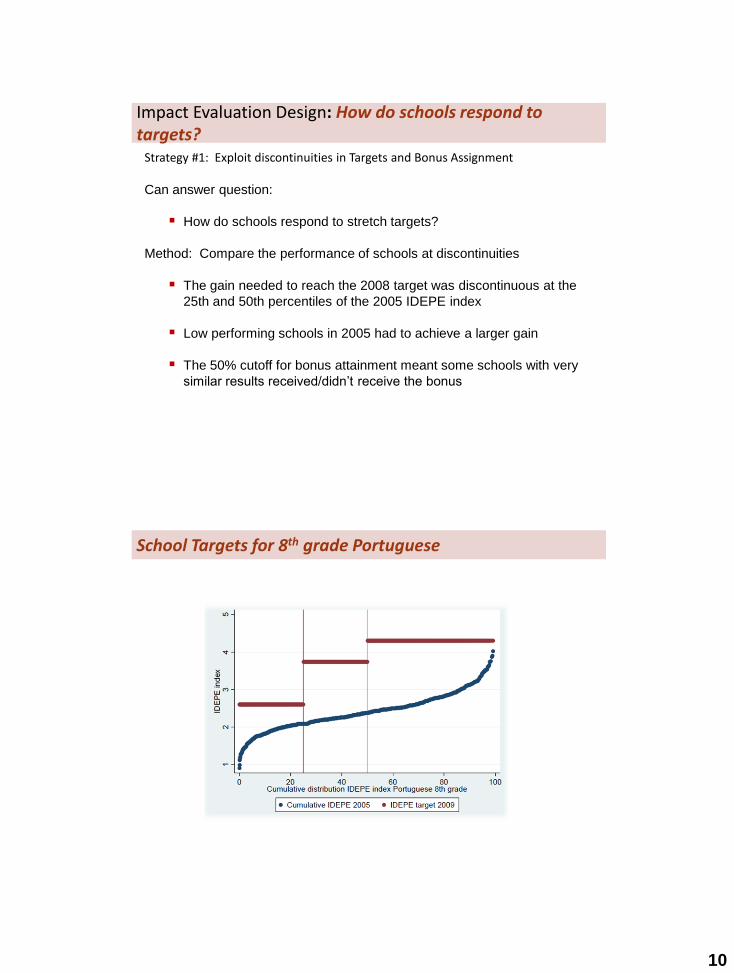
10
Strategy #1: Exploit discontinuities in Targets and Bonus Assignment
Can answer question:
How do schools respond to stretch targets?
Method: Compare the performance of schools at discontinuities
The gain needed to reach the 2008 target was discontinuous at the
25th and 50th percentiles of the 2005 IDEPE index
Low performing schools in 2005 had to achieve a larger gain
The 50% cutoff for bonus attainment meant some schools with very
similar results received/didn’t receive the bonus
Impact Evaluation Design: How do schools respond to targets?
School Targets for 8th grade Portuguese
11
0
500
1000
1500
2000
2500
Bônus m
édio
por
escola
(R
$)
0 50 100 150 200 250% meta atingida
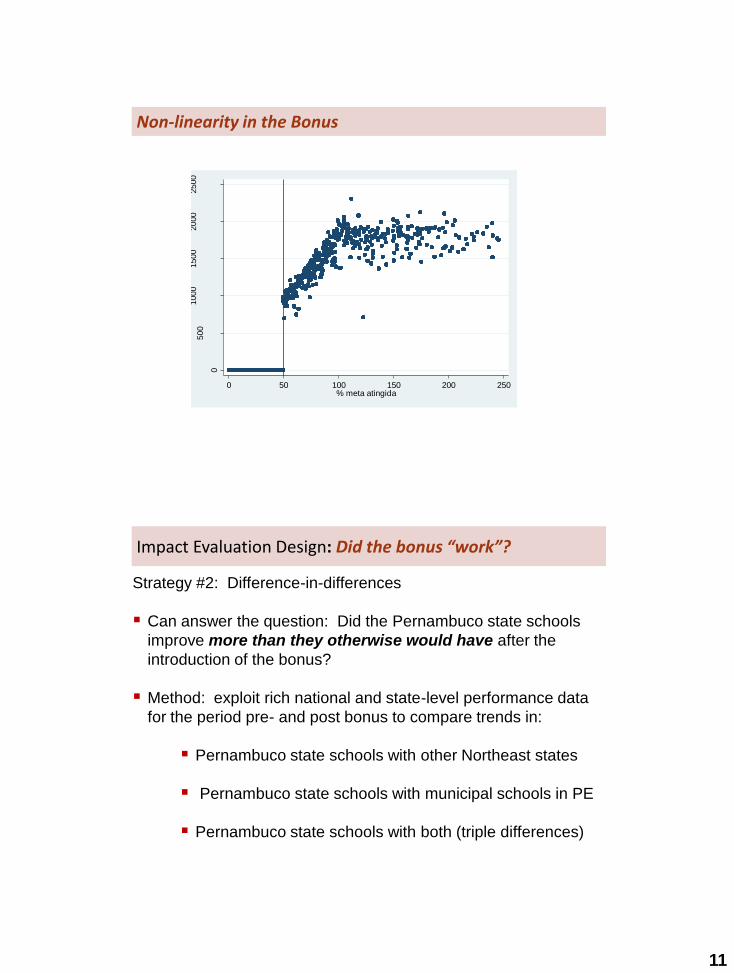
Non-linearity in the Bonus
Strategy #2: Difference-in-differences
Can answer the question: Did the Pernambuco state schools
improve more than they otherwise would have after the
introduction of the bonus?
Method: exploit rich national and state-level performance data
for the period pre- and post bonus to compare trends in:
Pernambuco state schools with other Northeast states
Pernambuco state schools with municipal schools in PE
Pernambuco state schools with both (triple differences)
Impact Evaluation Design: Did the bonus “work”?
12
Strategy #3: Classroom observations in a panel of 1800 classrooms in 300
schools
Can answer questions:
Do teachers behave differently in schools that achieve/don’t achieve
the bonus?
Does teacher behavior change over time in Pernambuco state
schools?
Strategy #4: Surveys/interviews with school directors, teachers and regional
supervisors
Can answer questions:
What explicit strategies did schools use to try to improve?
How do these strategies correlate with bonus results?
Impact Evaluation Design: HOW did the bonus “work”?
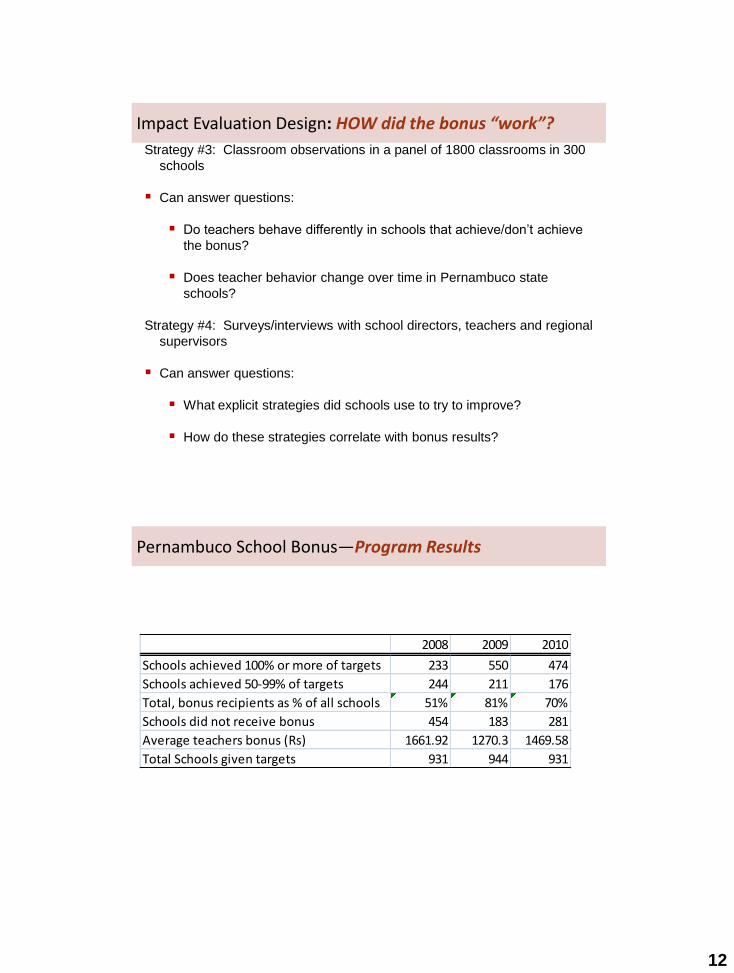
Pernambuco School Bonus—Program Results
2008 2009 2010
Schools achieved 100% or more of targets 233 550 474
Schools achieved 50-99% of targets 244 211 176
Total, bonus recipients as % of all schools 51% 81% 70%
Schools did not receive bonus 454 183 281
Average teachers bonus (Rs) 1661.92 1270.3 1469.58
Total Schools given targets 931 944 931
13
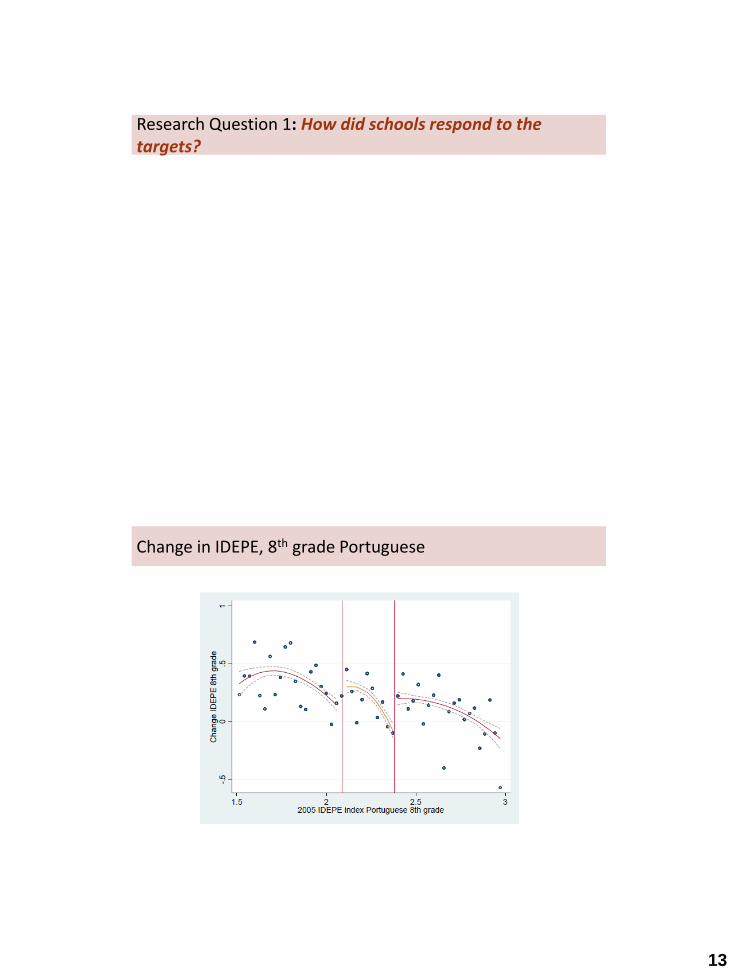
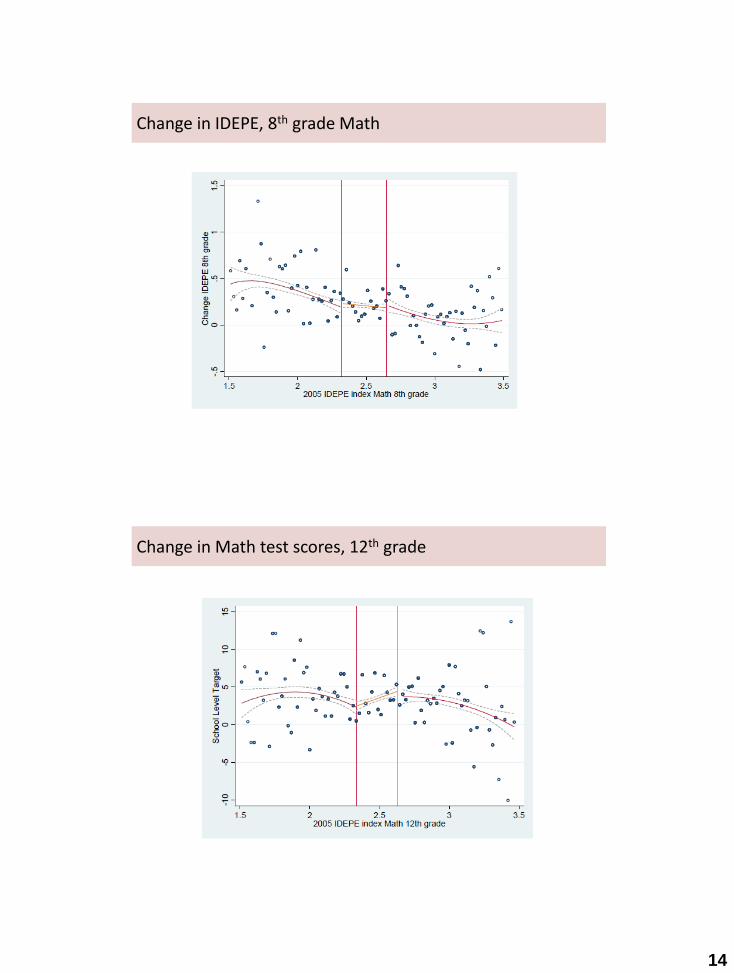
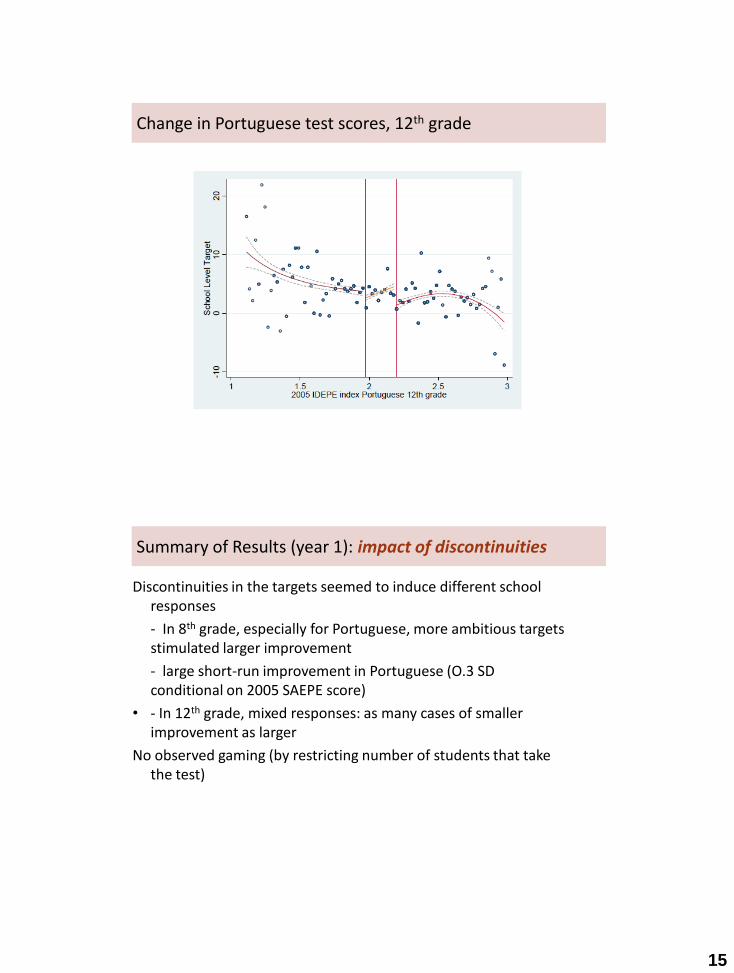
Research Question 1: How did schools respond to the targets?
Change in IDEPE, 8th grade Portuguese
14
Change in IDEPE, 8th grade Math
Change in Math test scores, 12th grade
15
Change in Portuguese test scores, 12th grade
Discontinuities in the targets seemed to induce different school responses
- In 8th grade, especially for Portuguese, more ambitious targets stimulated larger improvement
- large short-run improvement in Portuguese (O.3 SD conditional on 2005 SAEPE score)
• - In 12th grade, mixed responses: as many cases of smaller improvement as larger
No observed gaming (by restricting number of students that take the test)
Summary of Results (year 1): impact of discontinuities
16
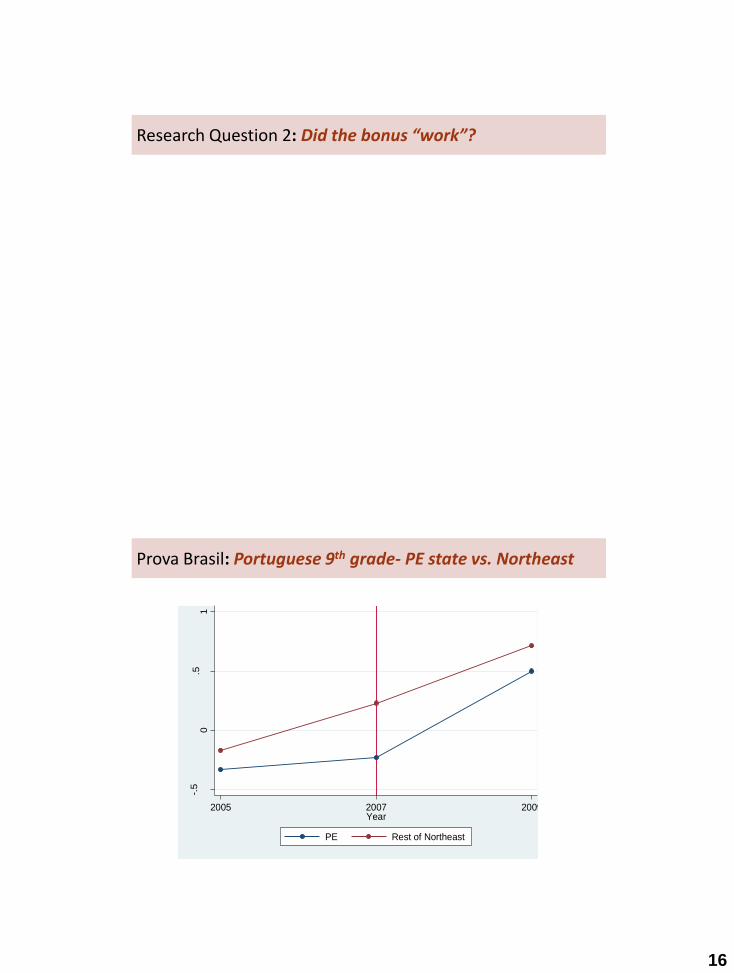
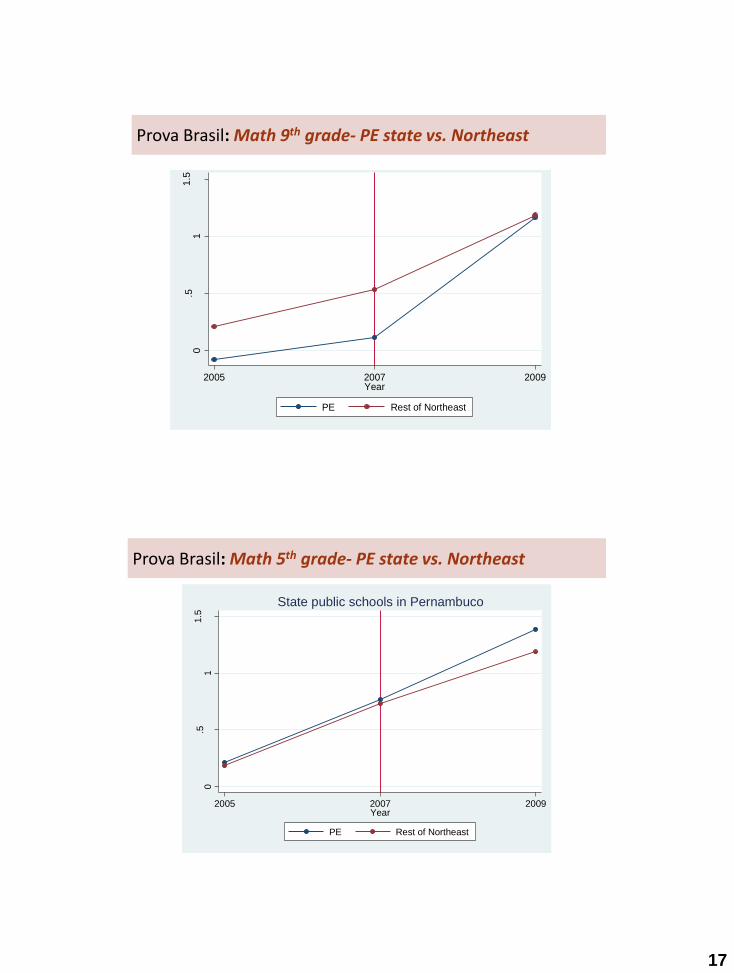
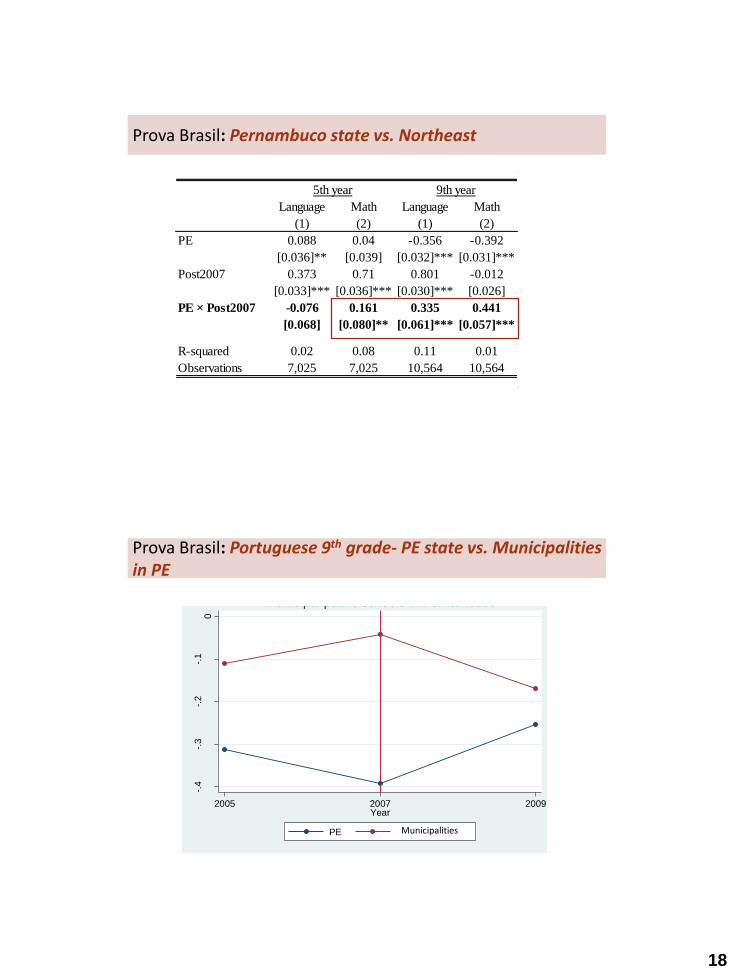
Research Question 2: Did the bonus “work”?
-.5
0.5
1
Sta
nda
rdiz
ed P
rova
Bra
sil
lang
ua
ge
9th
gra
de
2005 2007 2009Year
PE Rest of Northeast
Municipal public schools in Pernambuco
Prova Brasil: Portuguese 9th grade- PE state vs. Northeast
17
0.5
11.5
Sta
nda
rdiz
ed P
rova
Bra
sil
Ma
th 9
th g
rade
2005 2007 2009Year
PE Rest of Northeast
Public schools in Pernambuco
Prova Brasil: Math 9th grade- PE state vs. Northeast
0.5
11.5
Sta
nda
rdiz
ed P
rova
Bra
sil
Ma
th 5
th g
rade
2005 2007 2009Year
PE Rest of Northeast
State public schools in Pernambuco
Prova Brasil: Math 5th grade- PE state vs. Northeast
18
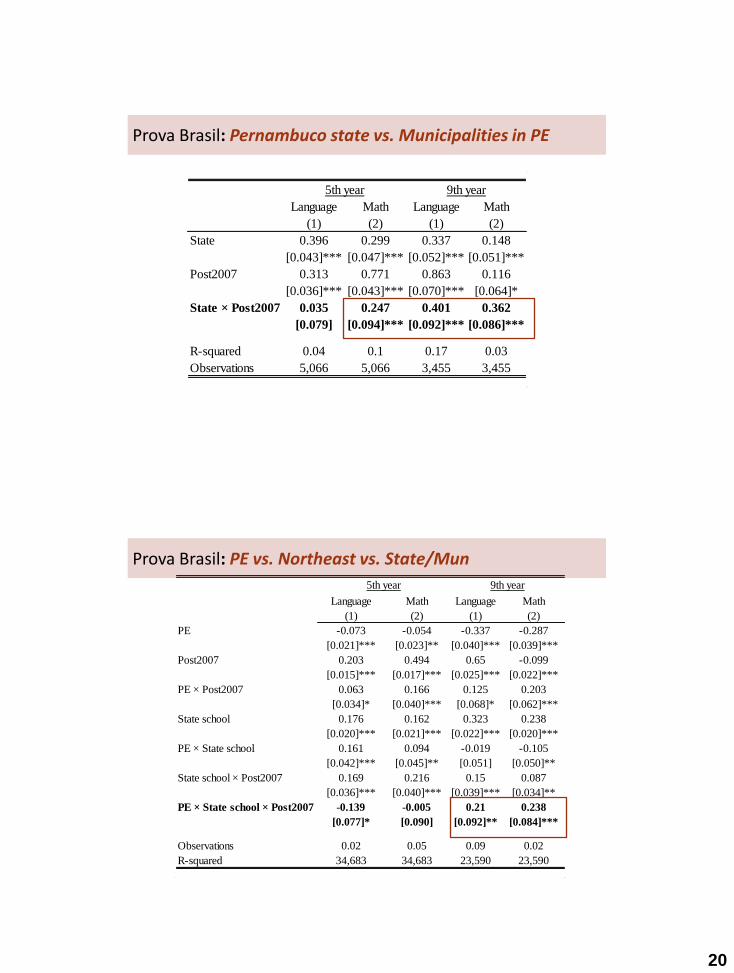
Language Math Language Math
(1) (2) (1) (2)
PE 0.088 0.04 -0.356 -0.392
[0.036]** [0.039] [0.032]*** [0.031]***
Post2007 0.373 0.71 0.801 -0.012
[0.033]*** [0.036]*** [0.030]*** [0.026]
PE × Post2007 -0.076 0.161 0.335 0.441
[0.068] [0.080]** [0.061]*** [0.057]***
R-squared 0.02 0.08 0.11 0.01
Observations 7,025 7,025 10,564 10,564
5th year 9th year
Prova Brasil: Pernambuco state vs. Northeast
-.4
-.3
-.2
-.1
0
Sta
nda
rdiz
ed P
rova
Bra
sil
Ma
th 9
th g
rade
2005 2007 2009Year
PE Rest of Northeast
Municipal public schools in Pernambuco
Prova Brasil: Portuguese 9th grade- PE state vs. Municipalities in PE
Municipalities
19
-.3
-.2
-.1
0.1
.2
Sta
nda
rdiz
ed P
rova
Bra
sil
Ma
th 9
th g
rade
2005 2007 2009Year
PE Rest of Northeast
Public schools in Pernambuco
Prova Brasil: Math 9th grade- PE state vs. Municipalities in PE
Municipalities
0.2
.4.6
.81
Sta
nda
rdiz
ed P
rova
Bra
sil
Ma
th 5
th g
rade
2005 2007 2009Year
PE Rest of Northeast
Municipal public schools in Pernambuco
Prova Brasil: Math 5th grade- PE state vs. PE municipalities
20
Language Math Language Math
(1) (2) (1) (2)
State 0.396 0.299 0.337 0.148
[0.043]*** [0.047]*** [0.052]*** [0.051]***
Post2007 0.313 0.771 0.863 0.116
[0.036]*** [0.043]*** [0.070]*** [0.064]*
State × Post2007 0.035 0.247 0.401 0.362
[0.079] [0.094]*** [0.092]*** [0.086]***
R-squared 0.04 0.1 0.17 0.03
Observations 5,066 5,066 3,455 3,455
5th year 9th year
Prova Brasil: Pernambuco state vs. Municipalities in PE
Language Math Language Math
(1) (2) (1) (2)
PE -0.073 -0.054 -0.337 -0.287
[0.021]*** [0.023]** [0.040]*** [0.039]***
Post2007 0.203 0.494 0.65 -0.099
[0.015]*** [0.017]*** [0.025]*** [0.022]***
PE × Post2007 0.063 0.166 0.125 0.203
[0.034]* [0.040]*** [0.068]* [0.062]***
State school 0.176 0.162 0.323 0.238
[0.020]*** [0.021]*** [0.022]*** [0.020]***
PE × State school 0.161 0.094 -0.019 -0.105
[0.042]*** [0.045]** [0.051] [0.050]**
State school × Post2007 0.169 0.216 0.15 0.087
[0.036]*** [0.040]*** [0.039]*** [0.034]**
PE × State school × Post2007 -0.139 -0.005 0.21 0.238
[0.077]* [0.090] [0.092]** [0.084]***
Observations 0.02 0.05 0.09 0.02
R-squared 34,683 34,683 23,590 23,590
5th year 9th year
Prova Brasil: PE vs. Northeast vs. State/Mun
21
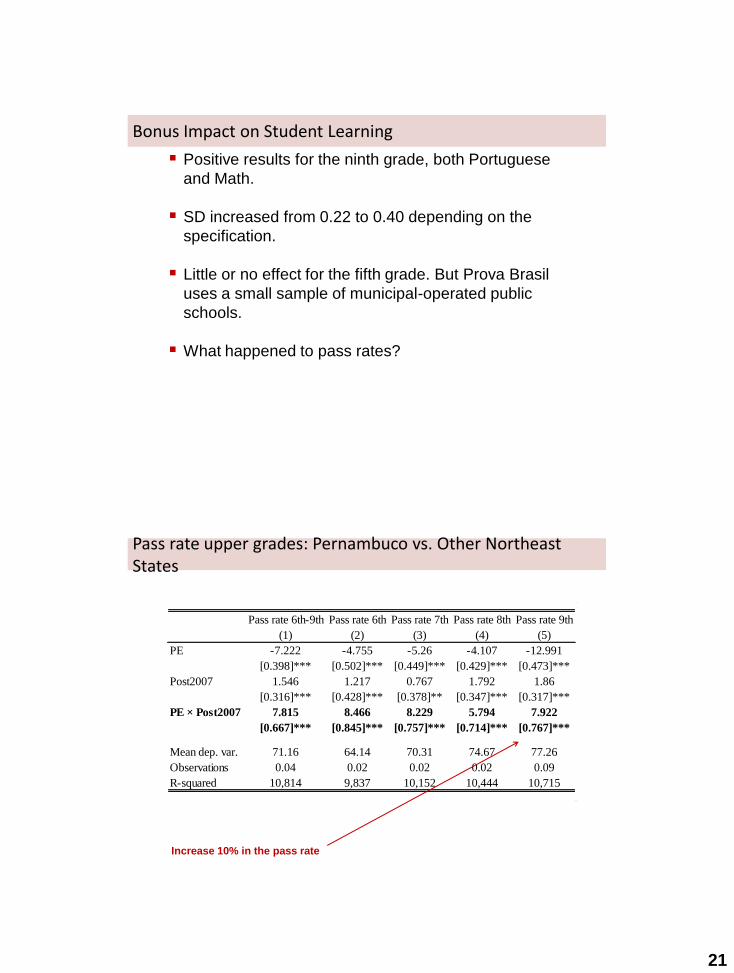
Positive results for the ninth grade, both Portuguese
and Math.
SD increased from 0.22 to 0.40 depending on the
specification.
Little or no effect for the fifth grade. But Prova Brasil
uses a small sample of municipal-operated public
schools.
What happened to pass rates?
Bonus Impact on Student Learning
Increase 10% in the pass rate
Pass rate 6th-9th Pass rate 6th Pass rate 7th Pass rate 8th Pass rate 9th
(1) (2) (3) (4) (5)
PE -7.222 -4.755 -5.26 -4.107 -12.991
[0.398]*** [0.502]*** [0.449]*** [0.429]*** [0.473]***
Post2007 1.546 1.217 0.767 1.792 1.86
[0.316]*** [0.428]*** [0.378]** [0.347]*** [0.317]***
PE × Post2007 7.815 8.466 8.229 5.794 7.922
[0.667]*** [0.845]*** [0.757]*** [0.714]*** [0.767]***
Mean dep. var. 71.16 64.14 70.31 74.67 77.26
Observations 0.04 0.02 0.02 0.02 0.09
R-squared 10,814 9,837 10,152 10,444 10,715
Pass rate upper grades: Pernambuco vs. Other Northeast States
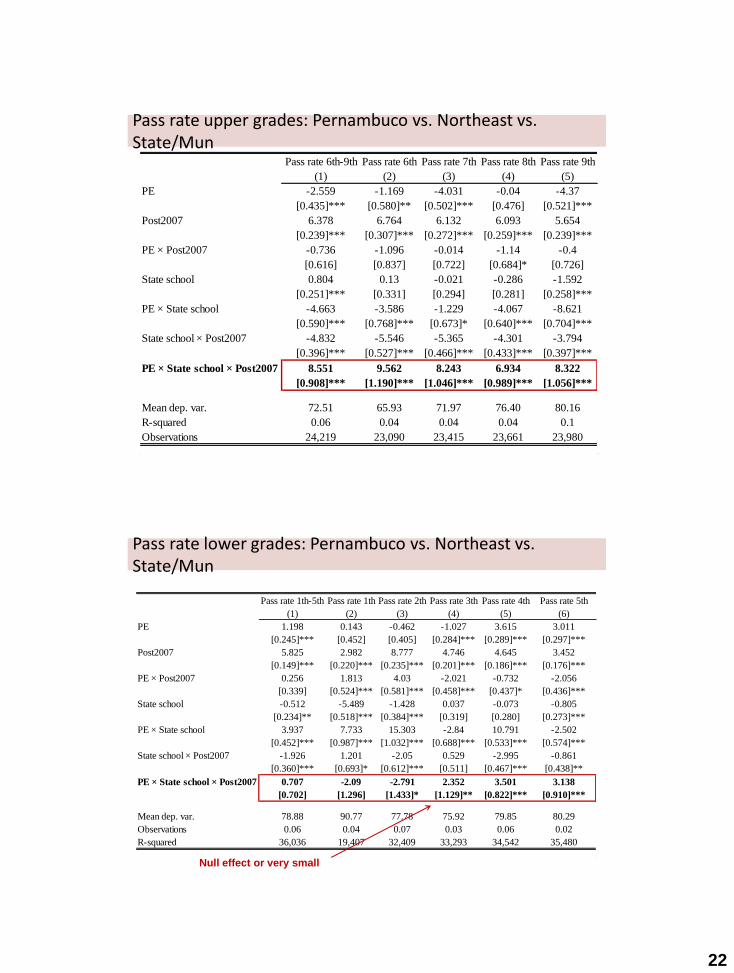
22
Pass rate 6th-9th Pass rate 6th Pass rate 7th Pass rate 8th Pass rate 9th
(1) (2) (3) (4) (5)
PE -2.559 -1.169 -4.031 -0.04 -4.37
[0.435]*** [0.580]** [0.502]*** [0.476] [0.521]***
Post2007 6.378 6.764 6.132 6.093 5.654
[0.239]*** [0.307]*** [0.272]*** [0.259]*** [0.239]***
PE × Post2007 -0.736 -1.096 -0.014 -1.14 -0.4
[0.616] [0.837] [0.722] [0.684]* [0.726]
State school 0.804 0.13 -0.021 -0.286 -1.592
[0.251]*** [0.331] [0.294] [0.281] [0.258]***
PE × State school -4.663 -3.586 -1.229 -4.067 -8.621
[0.590]*** [0.768]*** [0.673]* [0.640]*** [0.704]***
State school × Post2007 -4.832 -5.546 -5.365 -4.301 -3.794
[0.396]*** [0.527]*** [0.466]*** [0.433]*** [0.397]***
PE × State school × Post2007 8.551 9.562 8.243 6.934 8.322
[0.908]*** [1.190]*** [1.046]*** [0.989]*** [1.056]***
Mean dep. var. 72.51 65.93 71.97 76.40 80.16
R-squared 0.06 0.04 0.04 0.04 0.1
Observations 24,219 23,090 23,415 23,661 23,980
Pass rate upper grades: Pernambuco vs. Northeast vs. State/Mun
Pass rate 1th-5th Pass rate 1th Pass rate 2th Pass rate 3th Pass rate 4th Pass rate 5th
(1) (2) (3) (4) (5) (6)
PE 1.198 0.143 -0.462 -1.027 3.615 3.011
[0.245]*** [0.452] [0.405] [0.284]*** [0.289]*** [0.297]***
Post2007 5.825 2.982 8.777 4.746 4.645 3.452
[0.149]*** [0.220]*** [0.235]*** [0.201]*** [0.186]*** [0.176]***
PE × Post2007 0.256 1.813 4.03 -2.021 -0.732 -2.056
[0.339] [0.524]*** [0.581]*** [0.458]*** [0.437]* [0.436]***
State school -0.512 -5.489 -1.428 0.037 -0.073 -0.805
[0.234]** [0.518]*** [0.384]*** [0.319] [0.280] [0.273]***
PE × State school 3.937 7.733 15.303 -2.84 10.791 -2.502
[0.452]*** [0.987]*** [1.032]*** [0.688]*** [0.533]*** [0.574]***
State school × Post2007 -1.926 1.201 -2.05 0.529 -2.995 -0.861
[0.360]*** [0.693]* [0.612]*** [0.511] [0.467]*** [0.438]**
PE × State school × Post2007 0.707 -2.09 -2.791 2.352 3.501 3.138
[0.702] [1.296] [1.433]* [1.129]** [0.822]*** [0.910]***
Mean dep. var. 78.88 90.77 77.78 75.92 79.85 80.29
Observations 0.06 0.04 0.07 0.03 0.06 0.02
R-squared 36,036 19,407 32,409 33,293 34,542 35,480
Null effect or very small
Pass rate lower grades: Pernambuco vs. Northeast vs. State/Mun
23
Both Portuguese and Math test scores and pass rates
improved significantly in the 9th grade
Smaller effects in the 5th grade, in both test performance
and pass rate
Why? Secretariat believes reason is less state school
influence on 5th grade student performance
5th grade is year most students transfer from
municipal (lower primary) to state (upper primary)
schools
State policies such as bonus likely to have
cumulative results
Overall Bonus Impact
Research Question 3: HOW did the bonus “work”?
24
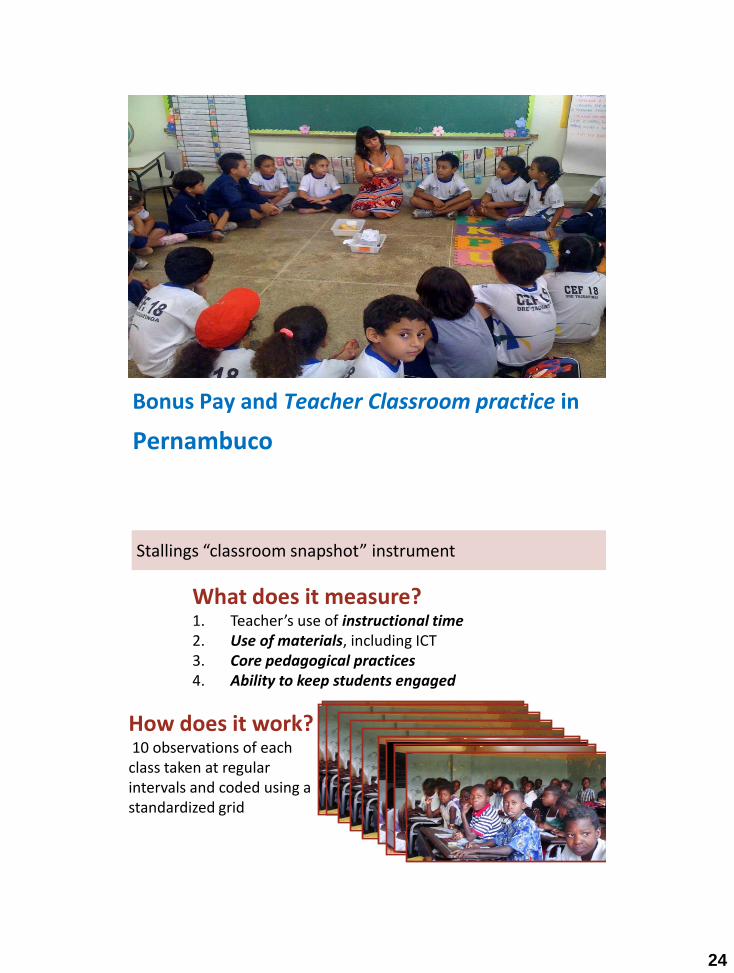
Bonus Pay and Teacher Classroom practice in
Pernambuco
What does it measure?1. Teacher’s use of instructional time2. Use of materials, including ICT3. Core pedagogical practices4. Ability to keep students engaged
Stallings “classroom snapshot” instrument
How does it work?10 observations of each class taken at regular intervals and coded using a standardized grid
25
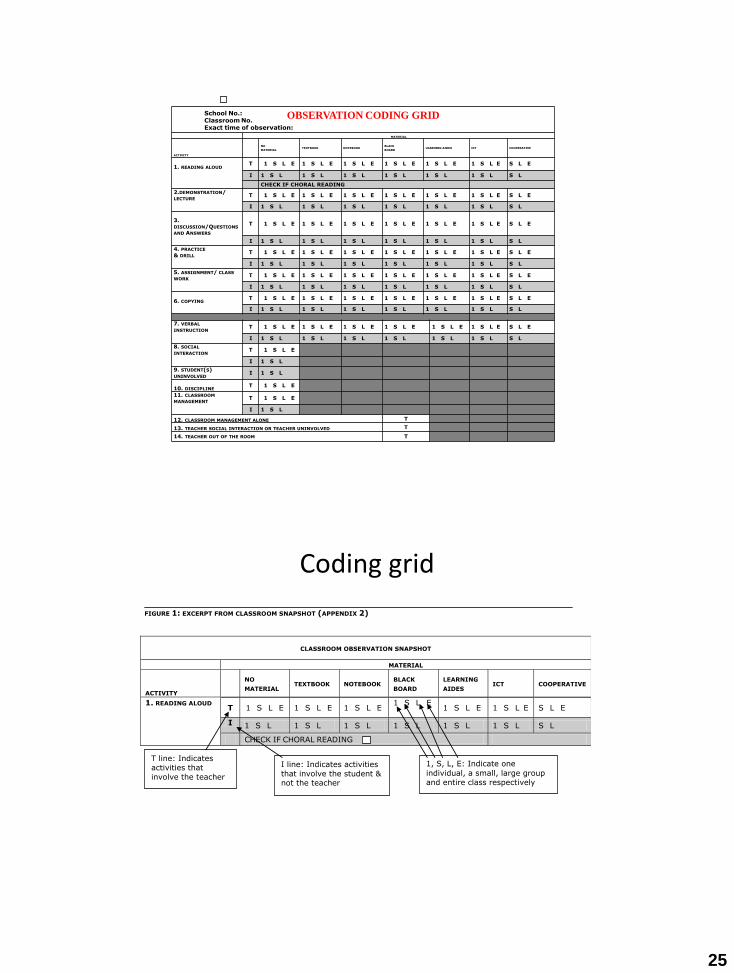
OBSERVATION CODING GRID
MATERIAL
ACTIVITY
NO
MATERIALTEXTBOOK NOTEBOOK
BLACK
BOARDLEARNING AIDES ICT COOPERATIVE
1. READING ALOUDT 1 S L E 1 S L E 1 S L E 1 S L E 1 S L E 1 S L E S L E
I 1 S L 1 S L 1 S L 1 S L 1 S L 1 S L S L
CHECK IF CHORAL READING
2.DEMONSTRATION/ LECTURE
T 1 S L E 1 S L E 1 S L E 1 S L E 1 S L E 1 S L E S L E
I 1 S L 1 S L 1 S L 1 S L 1 S L 1 S L S L
3. DISCUSSION/QUESTIONS
AND ANSWERS
T 1 S L E 1 S L E 1 S L E 1 S L E 1 S L E 1 S L E S L E
I 1 S L 1 S L 1 S L 1 S L 1 S L 1 S L S L
4. PRACTICE
& DRILLT 1 S L E 1 S L E 1 S L E 1 S L E 1 S L E 1 S L E S L E
I 1 S L 1 S L 1 S L 1 S L 1 S L 1 S L S L
5. ASSIGNMENT/ CLASS
WORKT 1 S L E 1 S L E 1 S L E 1 S L E 1 S L E 1 S L E S L E
I 1 S L 1 S L 1 S L 1 S L 1 S L 1 S L S L
6. COPYINGT 1 S L E 1 S L E 1 S L E 1 S L E 1 S L E 1 S L E S L E
I 1 S L 1 S L 1 S L 1 S L 1 S L 1 S L S L
7. VERBAL
INSTRUCTIONT 1 S L E 1 S L E 1 S L E 1 S L E 1 S L E 1 S L E S L E
I 1 S L 1 S L 1 S L 1 S L 1 S L 1 S L S L
8. SOCIAL
INTERACTIONT 1 S L E
I 1 S L
9. STUDENT(S)UNINVOLVED
I 1 S L
10. DISCIPLINET 1 S L E
11. CLASSROOM
MANAGEMENTT 1 S L E
I 1 S L
12. CLASSROOM MANAGEMENT ALONE T
13. TEACHER SOCIAL INTERACTION OR TEACHER UNINVOLVED T
14. TEACHER OUT OF THE ROOM T
School No.:Classroom No. Exact time of observation:
Coding grid
FIGURE 1: EXCERPT FROM CLASSROOM SNAPSHOT (APPENDIX 2)
CLASSROOM OBSERVATION SNAPSHOT
MATERIAL
ACTIVITY
NO MATERIAL
TEXTBOOK NOTEBOOK BLACK BOARD
LEARNING
AIDES ICT COOPERATIVE
1. READING ALOUD T 1 S L E 1 S L E 1 S L E
1 S L E 1 S L E 1 S L E S L E
I 1 S L 1 S L 1 S L 1 S L 1 S L 1 S L S L
CHECK IF CHORAL READING
T line: Indicates activities that
involve the teacher
I line: Indicates activities
that involve the student & not the teacher
1, S, L, E: Indicate one
individual, a small, large group and entire class respectively
26
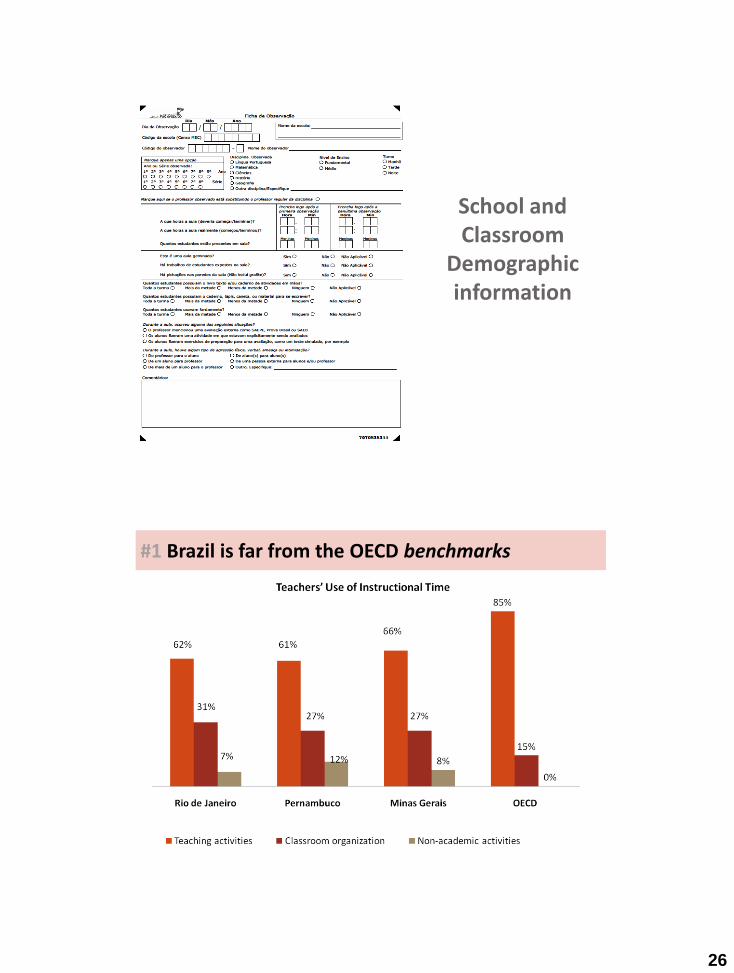
School and Classroom
Demographic information
#1 Brazil is far from the OECD benchmarks
27
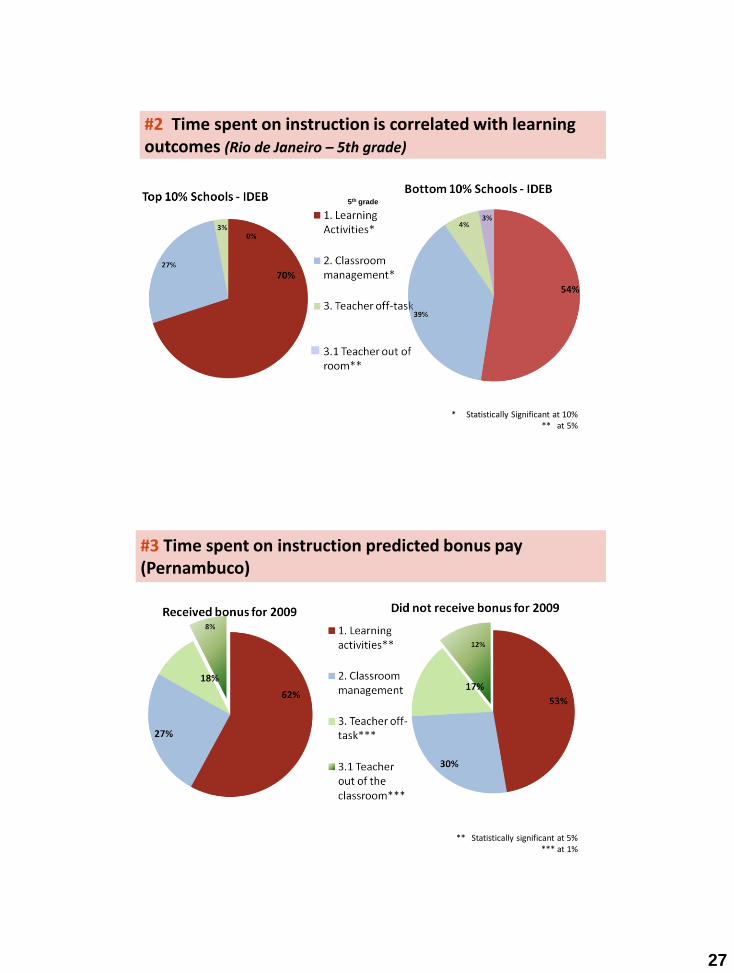
#2 Time spent on instruction is correlated with learning outcomes (Rio de Janeiro – 5th grade)
* Statistically Significant at 10%** at 5%
5th grade
#3 Time spent on instruction predicted bonus pay (Pernambuco)
** Statistically significant at 5%*** at 1%
28
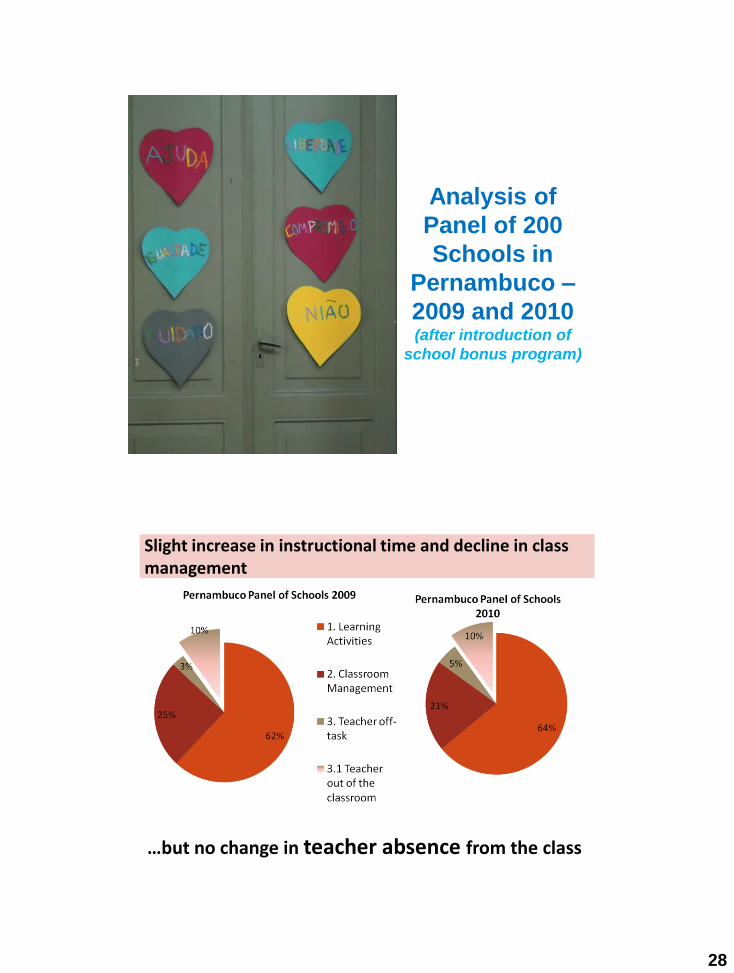
Analysis of
Panel of 200
Schools in
Pernambuco –
2009 and 2010 (after introduction of
school bonus program)
Slight increase in instructional time and decline in class management
…but no change in teacher absence from the class
29
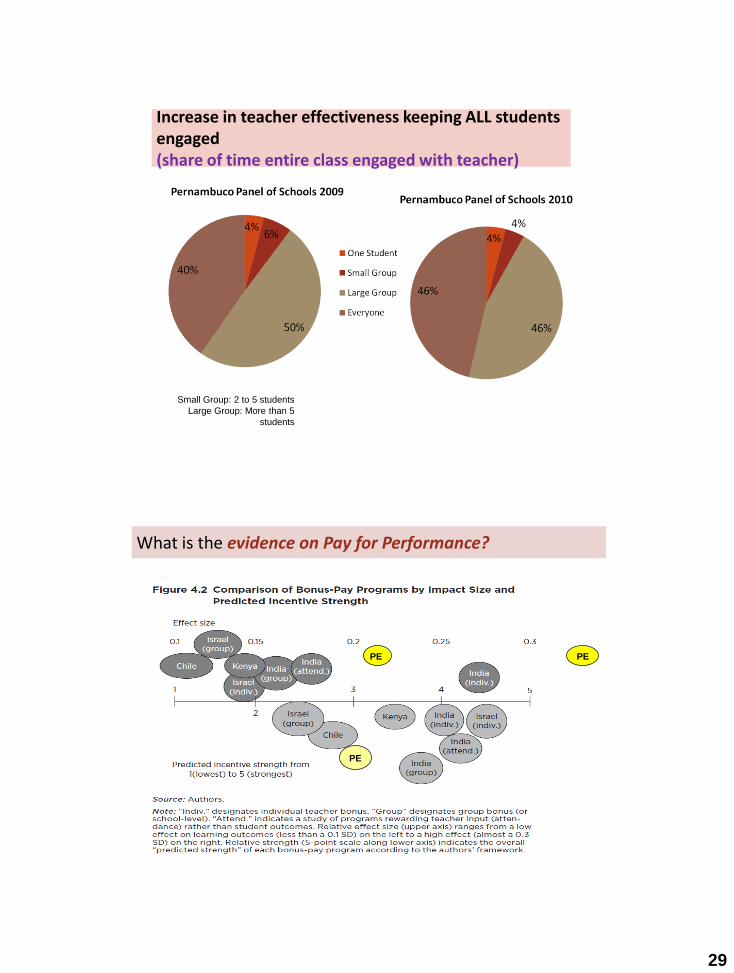
Increase in teacher effectiveness keeping ALL students engaged(share of time entire class engaged with teacher)
Small Group: 2 to 5 students
Large Group: More than 5
students
What is the evidence on Pay for Performance?
PE PE
PE
30
Bonus pay can stimulate improvement in key school results within
1-2 years
Size of incentive and clarity/integrity of results measure important
Early evidence that it is possible to observe differences in
classroom dynamics between improving and stagnant schools, and
system-wide over time
Important design questions in setting up bonus pay programs
Linear or nonlinear? (everyone gets it or only those that pass a
threshold for improvement)
Reward level of performance, value-added, or both? Should
schools that remain at the top be rewarded (PE vs SP)?
Should targets be multi-year? Renegotiated annually?
Summary: what are we learning from Pernambuco?
What strategies DO schools most commonly employ in response to
bonus incentives? (2012 qualitative survey and study)
How does school size (free-rider potential) and school “social capital”
affect bonus attainment? (2012 analysis of existing survey data)
Does classroom-level improvement continue over time? Does it correlate
with bonus? (panel of observations continuing in 2012 and 2013)
How to design effective bonus pay programs? (Comparative study of 3 yr.
results in 3 different Brazilian programs – MG, PE, RJ – 2012/13)
Size of bonus? Linear or nonlinear targets? Reward level of
performance, value-added, or both? Multi-year targets or
renegotiated annually?
Do perverse impacts arise over time (as agents become more familiar
with program and potential gaming strategies)?
Summary: next phase of Brazil incentives research