Embed Size (px)
Citation preview
Fourteen years of data and analysis of tax systems in 190 economies: how is technology affecting tax administration and policy?
November 2018
Paying Taxes 2019
www.pwc.com/payingtaxes
Contacts
PwC
Stef van Weeghel Leader, Global Tax Policy and Administration Network PwC Netherlands +31 88 792 [email protected]
Andrew Packman Leader, Tax Transparency and Total Tax Contribution PwC UK +44 771 266 [email protected]
Tom Dane Senior Manager, Tax PwC UK +44 7715 211 [email protected]
Neville Howlett Director, External Relations, Tax PwC UK +44 7725 069 [email protected]
World Bank Group
Rita Ramalho Senior Manager Global Indicators Group +1 202 458 [email protected]
Santiago Croci Program Manager Doing Business Unit +1 202 473 [email protected]
Joanna Nasr Private Sector Development Specialist Doing Business Unit +1 202 458 [email protected]
2 | Paying Taxes 2019
Paying Taxes 2019 | 3
Contents
Foreword 04
Key findings 06
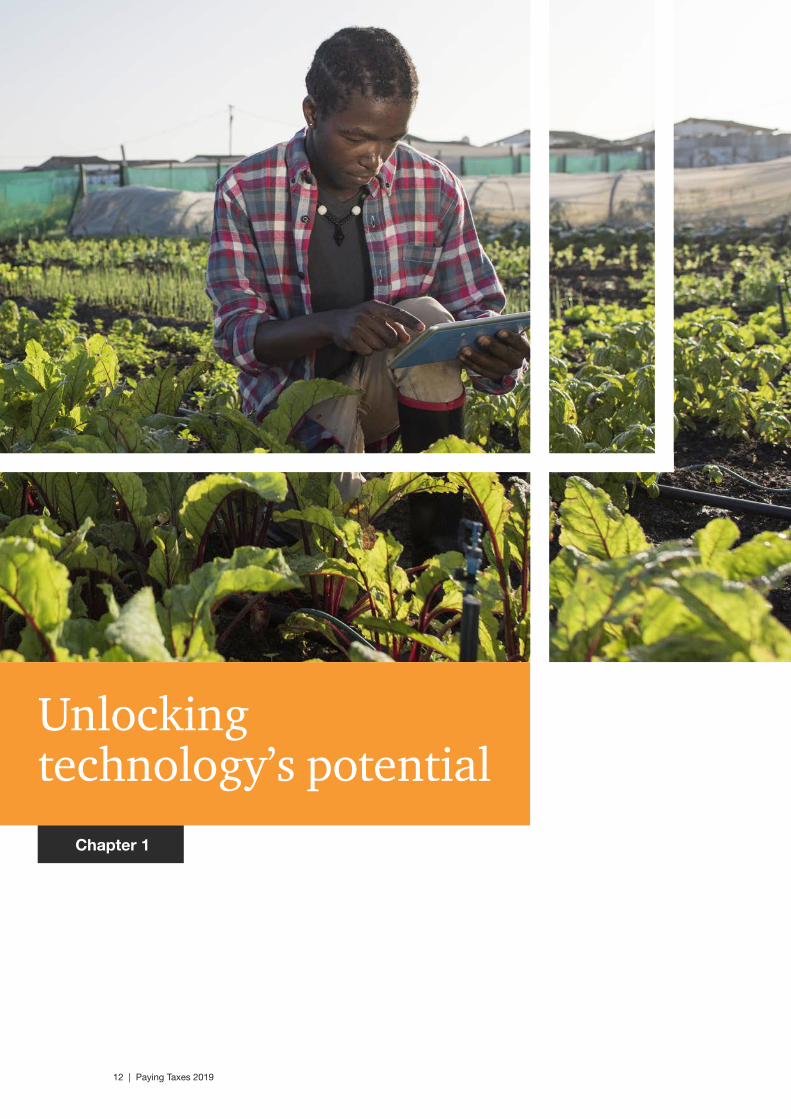
Chapter 1 - Unlocking technology’s potential 12
Chapter 2 - The uneven global impact
of the changing tax burden for business 20
Chapter 3 - Post-filing processes and domestic disputes 30
Chapter 4 - World Bank commentary: lessons learned 37
Appendix 46
The world is changing with unprecedented speed, driven by megatrends, including demographic change, the shift of economic power to emerging countries, climate change and urbanisation. But it is the developments in technology that are changing lives beyond recognition, day by day. Technology is transforming the nature of jobs that are available and the skills needed to do them. This, in turn, is likely to require greater investment in human capital, especially in learning and development. Some economies are already beginning to grapple with these challenges, but for developing economies in particular, there is a mountain to climb.
The World Bank’s World Development Report 2019, The Changing Nature of Work, and PwC’s Workforce of the Future report show just how fundamental technological developments will be to the way in which societies and economies operate. They are also fundamental to the evolution of tax systems – both in how economies raise revenues and what they levy taxes on. For more than a decade, Paying Taxes, as part of the World Bank’s Doing Business project, has compared tax systems across 190 economies, highlighting how technology is changing the way taxes are administered and collected, using a medium-sized case study company as the basis for the comparison. Year by year, more and more businesses are able to file and pay their taxes online, resulting in substantial savings in time and cost.
In this report, we look at how new tax software, real-time reporting systems and data analytics are changing the way companies meet their tax compliance obligations and how tax authorities monitor and enforce those obligations. We examine the balance between labour and income taxes as economies consider the effect of the changes on the nature of work and the impact this has on revenue streams. We also look at some of the different approaches taken by tax authorities to tax audits and to the provision of training for both tax officers and taxpayers.
Although in many respects, the world is changing faster than ever, at a global level, our case study company has this year seen very little change in the average ease of paying taxes. This seeming stability masks considerable developments taking place in individual economies which cancel out at a global level. Some economies, which were already using advanced technology for tax administration, have continued
to improve their systems to the benefit of both taxpayers and tax authorities, recording significant decreases in the time it takes to prepare, file and pay taxes. Others, though, are lagging behind and have introduced new taxes without the advantages of modern technology, thereby increasing the compliance burdens on taxpayers.
The impact of technology goes far beyond tax administration; it will also affect the income streams that are available to be taxed. We are already seeing technology driving changes in the employment skills which are needed, in business and employment models and in the ways in which businesses operate across geographic boundaries. All of these changes may mean governments need to reassess how they raise taxes from the available sources of income and wealth.
In recent years, Paying Taxes has shown that, globally, labour taxes and profit taxes account for similar proportions of the taxes borne by our case study company, as measured by the Total Tax and Contribution Rate (TTCR), but this might change in the future if governments adjust their tax strategy in response to the changing nature of the tax base. For example, we have seen this year that some governments have implemented changes to corporate income tax (CIT) that are intended to encourage domestic and foreign investment.1 Others have sought to lower the costs of employment by reducing the rates of social security contributions (SSC).
Foreword
4 | Paying Taxes 2019 1 The US tax reforms introduced in 2018 were not in effect when the data for this report was collected.
Paying Taxes 2019 | 5
Some governments, on the other hand, are increasing tax rates. If governments are to invest in the human capital of their populations, then, as discussed in the World Bank’s World Development Report 2019, many may wish to consider increasing the amount of tax they raise as a proportion of gross domestic product (GDP), particularly in lower-income countries where tax-to-GDP ratios are below the global average.2
Changing tax rates or adjusting the balance between direct and indirect taxes are two possible ways to increase tax revenues. Another way is to make tax systems as simple as possible to comply with and then enforce the rules in a way that is fair, transparent and proportionate. Simple, coherent, well-understood and properly administered tax systems can help to lower the barriers for businesses to move from the informal to the formal sector. This, in turn, broadens the tax base and has the potential to raise tax revenues without increasing tax rates.
Within Paying Taxes, the enforcement of the tax system is considered through the lens of the post-filing index. The index considers two events that could trigger additional reviews (which may include a formal tax audit): claiming a value-added tax (VAT) refund in the case of a capital purchase and correcting a CIT return. The duration and extent of those reviews, however, will be affected by the underlying tax system and the working practices of the tax authority. In this report, we consider some specific examples of issues that may prolong or complicate tax audits in some economies but which would be considered uncontroversial in others. We also look at the training and education that tax authorities provide to their own staffs and to taxpayers to help both sides understand and comply with tax obligations.
By providing a robust comparison of the taxation of business in 190 economies, Paying Taxes helps governments and businesses understand if their tax systems are keeping pace with global change and learn from what others are doing. It can increase trust and understanding between taxpayers and tax authorities by improving the understanding of where systems are working well and where there is room for improvement.
We hope that this report will be of value to all those interested in improving tax systems whether they work in government, business, academia or civil society. Your comments and feedback on the study and its future direction are always very welcome, and we would be delighted to hear from you.
Senior Manager, Global Indicators Group, World Bank Group
Rita RamalhoLeader, Tax Transparency and Total Tax Contribution, PwC UK
Andrew Packman
2 World Development Report 2019, The Changing Nature of Work, The World Bank Group.
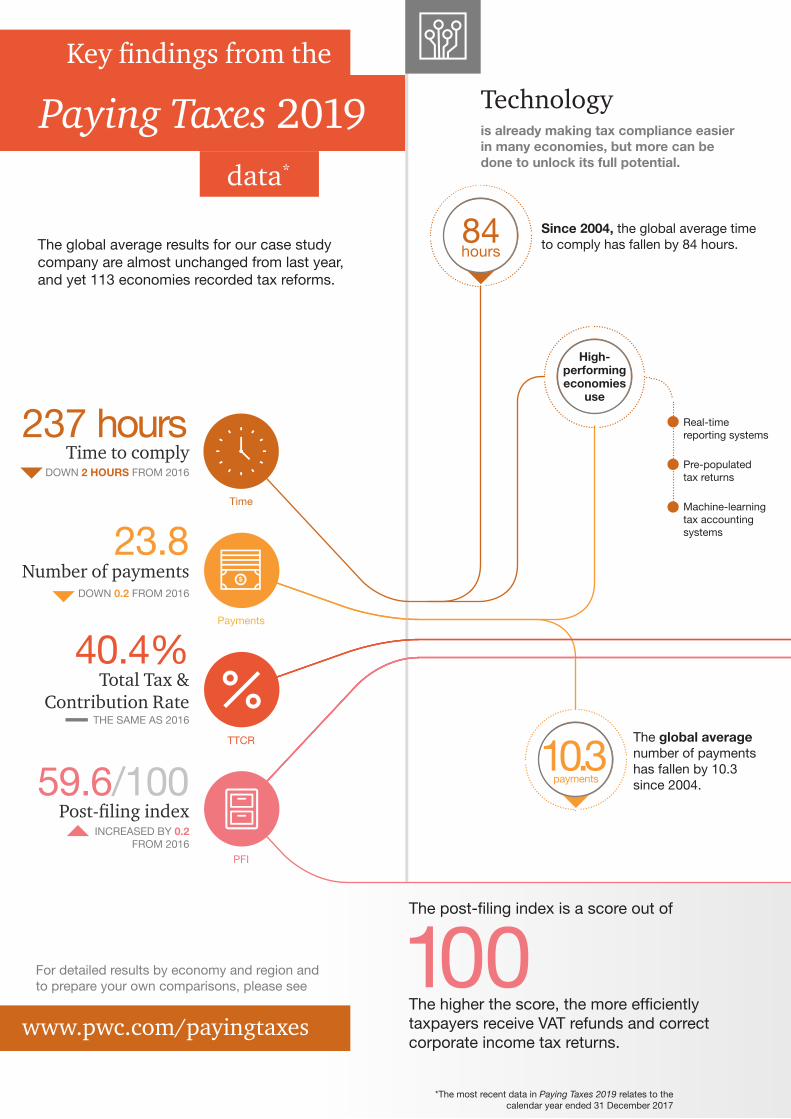
The global average results for our case study company are almost unchanged from last year, and yet 113 economies recorded tax reforms.
For detailed results by economy and region and to prepare your own comparisons, please see
Paying Taxes 2019
Key findings from the
www.pwc.com/payingtaxes
data*
Technologyis already making tax compliance easier in many economies, but more can be done to unlock its full potential.
Since 2004, the global average time to comply has fallen by 84 hours.
The global average number of payments has fallen by 10.3 since 2004.
Time to comply
Number of payments
Total Tax & Contribution Rate
Post-filing index
DOWN 2 HOURS FROM 2016
DOWN 0.2 FROM 2016
INCREASED BY 0.2 FROM 2016
THE SAME AS 2016
*The most recent data in Paying Taxes 2019 relates to the calendar year ended 31 December 2017
Pre-populated tax returns
Machine-learning tax accounting systems
Real-time reporting systems
High- performing economies
use
237 hours
40.4%
59.6/100
23.8
The post-filing index is a score out of
The higher the score, the more efficiently taxpayers receive VAT refunds and correct corporate income tax returns.
100
10.3payments
hours84
Time
Payments
TTCR
PFI
Labour and profit taxes Audits and disputes
In 2017, the profit tax component of the Total Tax and Contribution Rate fell in 58 economies, and rose in 37.
to comply with a VAT refund.
Only
The labour tax component of the Total Tax and
Contribution Rate rose in 39 economies, and fell in 17.
have each accounted for around 40% of the Total Tax and Contribution rate since 2008 – will this continue?
can be some of the most difficult interactions between taxpayers and tax officers.
The average Total Tax and Contribution Rate is around 13
percentage points higher for low-income economies than
high- and middle-income ones.
to obtain the refund.
Pre-filing performance is a simple average of the scores of the time to comply and number of payments indicators.
35%
13 points
High-income economies are most likely to perform well in both pre-filing and post-filing processes – but there areexceptions.
39
37
17
58economies
economies
economies
economies
97% of economies provide training to tax officers.
35% of economies offer regular, periodic training
to tax officers.
97%
to comply with the correction of a corporate income tax return.
to complete a corporate income tax correction.
Improving tax officers’ skills is vital for a well-functioning tax system.
26.1 weeks
15.1 hours
29.0 weeks
19.6 hours
The following four components are each given a score out of 100 and averaged to give the post-filing index score.
• High income • Middle income • Low income
Pre
-filin
g p
erfo
rman
ce
Post-filing performance
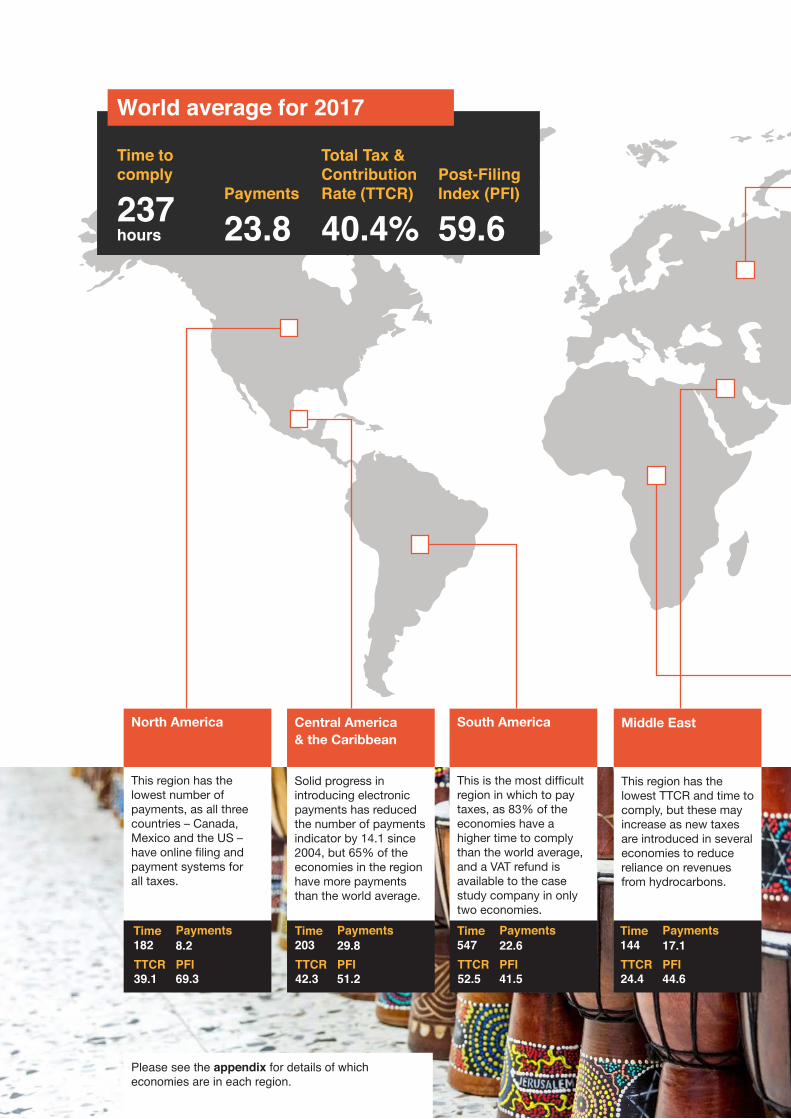
Central America & the Caribbean
Solid progress in introducing electronic payments has reduced the number of payments indicator by 14.1 since 2004, but 65% of the economies in the region have more payments than the world average.
Middle East
This region has the lowest TTCR and time to comply, but these may increase as new taxes are introduced in several economies to reduce reliance on revenues from hydrocarbons.
North America
This region has the lowest number of payments, as all three countries – Canada, Mexico and the US – have online filing and payment systems for all taxes.
TTCR 39.1
TTCR 42.3
TTCR 24.4
Time 182
Time 203
Time 144
PFI 69.3
Please see the appendix for details of which economies are in each region.
PFI 51.2
PFI 44.6
Payments 8.2
Payments 29.8
Payments 17.1
South America
This is the most difficult region in which to pay taxes, as 83% of the economies have a higher time to comply than the world average, and a VAT refund is available to the case study company in only two economies.
Payments
23.8
Total Tax & Contribution Rate (TTCR)
40.4%
Time to comply
237 hours
Post-Filing Index (PFI)
59.6
World average for 2017
Payments 22.6
Time 547TTCR 52.5
PFI 41.5
Paying Taxes 2019 | 9 Paying Taxes 2019 | 9 Paying Taxes 2019 | 9
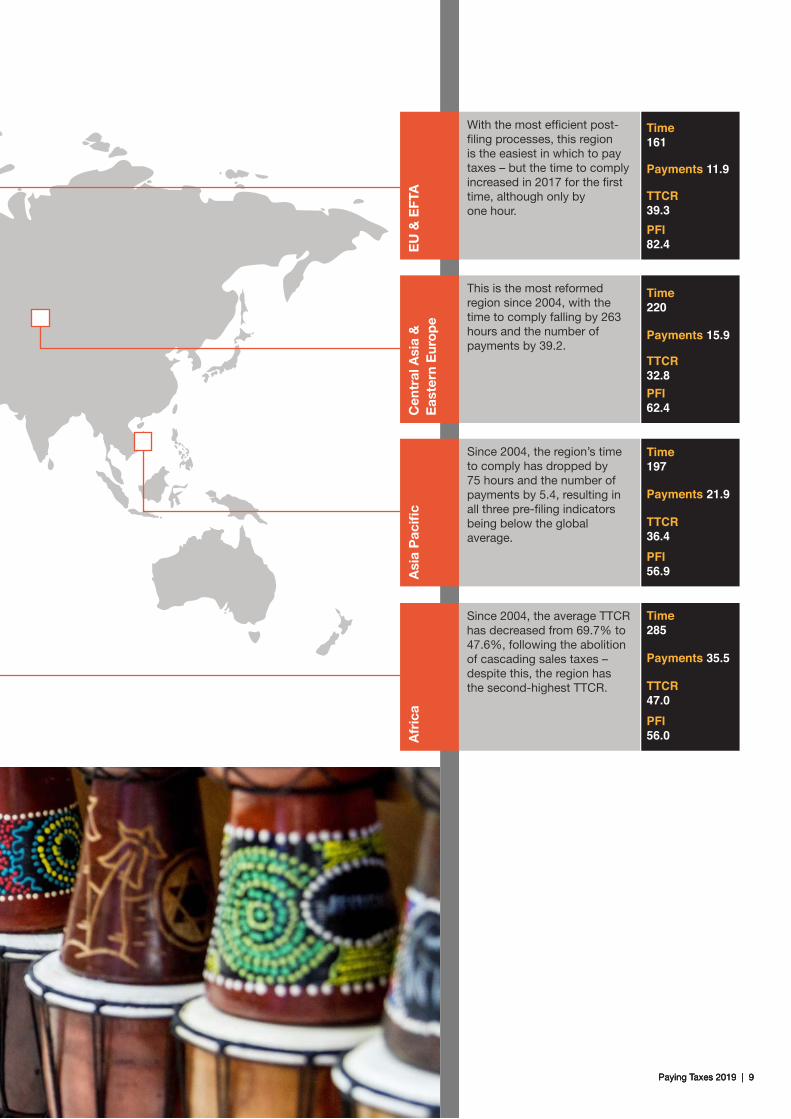
Afr
ica
Since 2004, the average TTCR has decreased from 69.7% to 47.6%, following the abolition of cascading sales taxes – despite this, the region has the second-highest TTCR.
Since 2004, the region’s time to comply has dropped by 75 hours and the number of payments by 5.4, resulting in all three pre-filing indicators being below the global average.
This is the most reformed region since 2004, with the time to comply falling by 263 hours and the number of payments by 39.2.
With the most efficient post-filing processes, this region is the easiest in which to pay taxes – but the time to comply increased in 2017 for the first time, although only by one hour.
TTCR 47.0
Time 285
PFI 56.0
Payments 35.5
TTCR 36.4
Time 197
PFI 56.9
Payments 21.9
TTCR 32.8
Time 220
PFI 62.4
Payments 15.9
TTCR 39.3
Time 161
PFI 82.4
Payments 11.9
Asi
a P
acifi
cC
entr
al A
sia
&
Eas
tern
Eur
op
eE
U &
EFT
A
23.8 World average
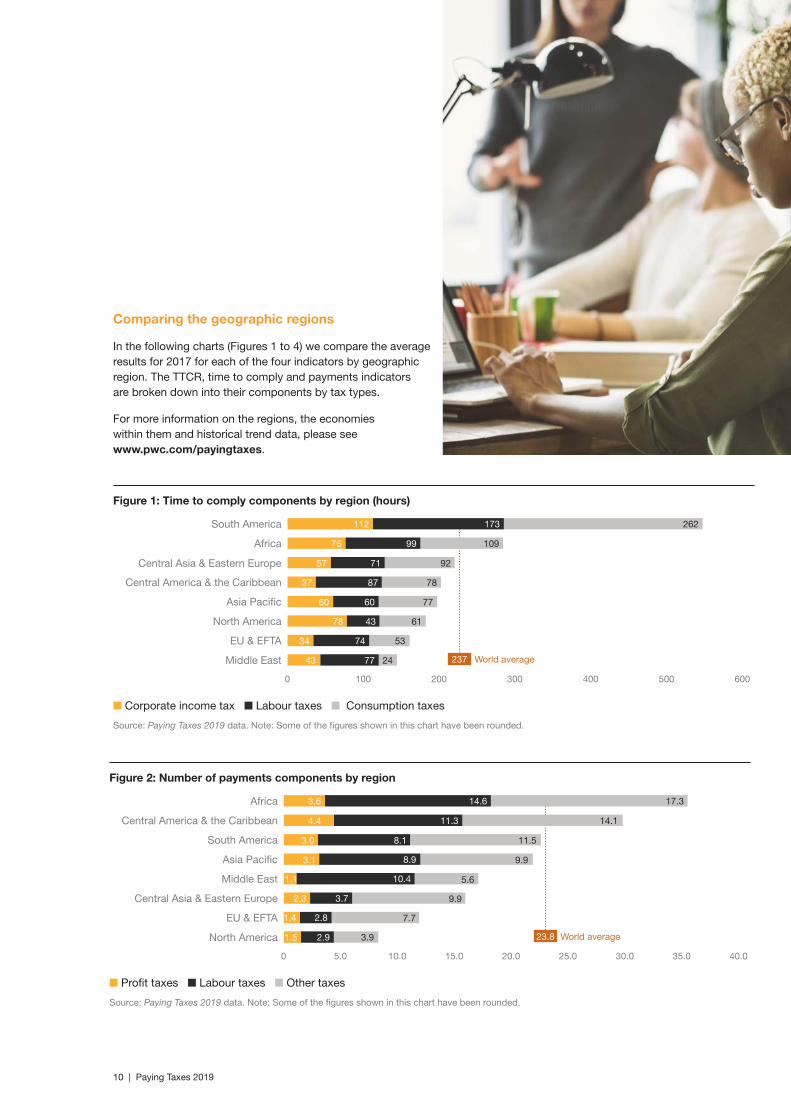
Figure 2: Number of payments components by region
Source: Paying Taxes 2019 data. Note: Some of the figures shown in this chart have been rounded.
Central Asia & Eastern Europe
North America
EU & EFTA
Central America & the Caribbean
Africa
Middle East
South America
Asia Pacific
0 5.0 10.0 15.0 20.0 30.025.0 40.035.0
n Profit taxes n Labour taxes n Other taxes
3.6
4.4
3.0
3.1
1.1
2.3
1.4
1.5
14.6
11.3
8.1
8.9
10.4
3.7
2.8
2.9
17.3
14.1
11.5
9.9
5.6
9.9
7.7
3.9
237 World average
Comparing the geographic regions
In the following charts (Figures 1 to 4) we compare the average results for 2017 for each of the four indicators by geographic region. The TTCR, time to comply and payments indicators are broken down into their components by tax types.
For more information on the regions, the economies within them and historical trend data, please see www.pwc.com/payingtaxes.
Figure 1: Time to comply components by region (hours)
Source: Paying Taxes 2019 data. Note: Some of the figures shown in this chart have been rounded.
Central Asia & Eastern Europe
Asia Pacific
Central America & the Caribbean
Middle East
North America
EU & EFTA
Africa
South America
0 100 200 300 400 500 600
n Corporate income tax n Labour taxes n Consumption taxes
43
34
78
60
37
57
76
112
77
74
43
60
87
71
99
173
24
53
61
77
78
92
109
262
10 | Paying Taxes 2019
40.4 World average
Paying Taxes 2019 | 11
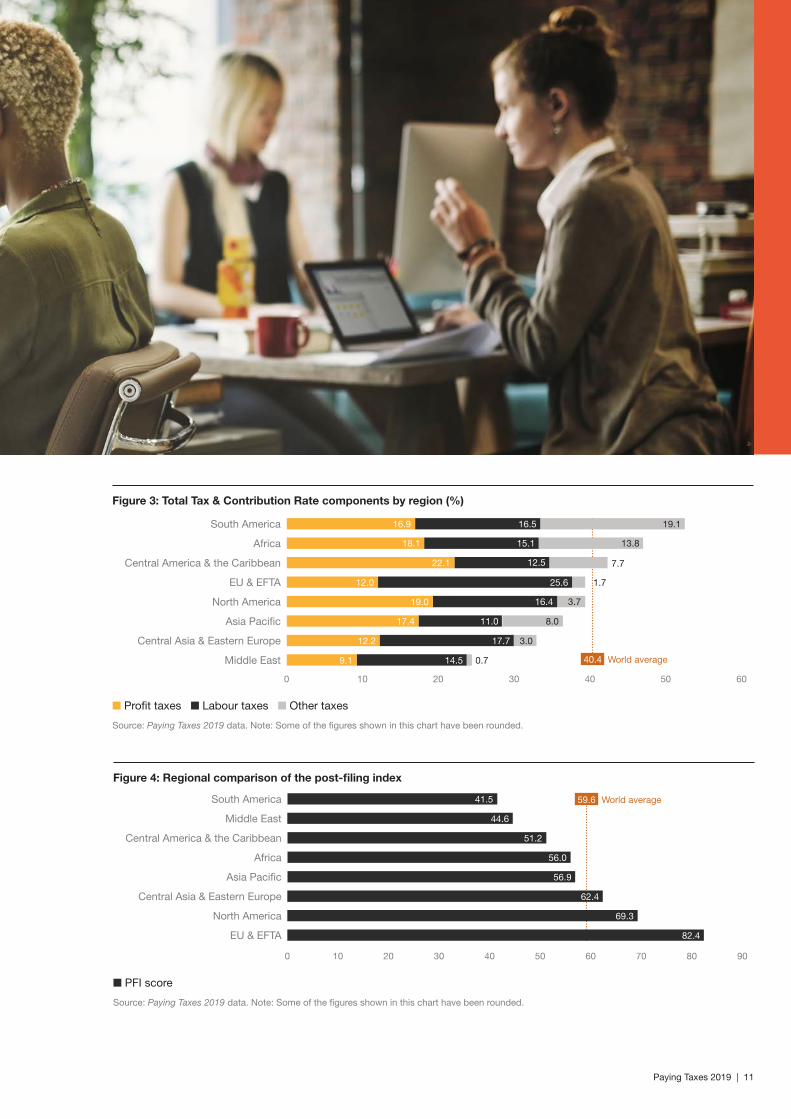
Figure 3: Total Tax & Contribution Rate components by region (%)
Source: Paying Taxes 2019 data. Note: Some of the figures shown in this chart have been rounded.
Middle East
Central Asia & Eastern Europe
Asia Pacific
North America
EU & EFTA
Central America & the Caribbean
Africa
South America
0 10 20 30 40 50 60
n Profit taxes n Labour taxes n Other taxes
9.1
12.2
17.4
19.0
12.0
22.1
18.1
16.9
14.5
17.7
11.0
16.4
25.6
12.5
15.1
16.5
0.7
3.0
8.0
3.7
1.7
7.7
13.8
19.1
Figure 4: Regional comparison of the post-filing index
Source: Paying Taxes 2019 data. Note: Some of the figures shown in this chart have been rounded.
South America
Middle East
Central America & the Caribbean
Africa
Asia Pacific
Central Asia & Eastern Europe
North America
EU & EFTA
0 10 20 4030 6050 8070 90
n PFI score
41.5
44.6
51.2
56.0
56.9
69.3
82.4
59.6 World average
62.4
DRAFTUnlocking technology’s potential
Chapter 1
12 | Paying Taxes 2019
DRAFTTechnology alone is not sufficient to improve performance. It is a tool, and its effectiveness is determined by how it is used. The simpler a tax system is, the more amenable it is to digitalisation. An economy’s IT infrastructure, such as the availability of broadband Internet or 4G mobile networks and the level of computer literacy of the population will affect the implementation of online tax systems. There may also be political and cultural barriers that prevent technology from being used to its full potential, especially in economies with manual systems and significant informal activity. As technology becomes more sophisticated, however, it can also cope with greater levels of complexity, and we already see examples of that.
Although the overall rate of change has slowed in recent years (see Figure 5), behind this steady progress, there are significant differences in how technology is used and implemented. Some advanced economies continue to push
the boundaries, but integrating new electronic systems has also increased filing times as both the tax authorities and businesses come to grips with change. This has meant that the significant improvements in some economies are offset by the lack of progress in others.
The overall results give us insight into both the power of technology and its challenges. More economies report decreases in time to comply and number of payments than report increases in these indicators, but when we look at the economies where there have been changes in the indicators, we see that this is only the third year since the start of the study when the average increase in time and payments exceeds the average decrease4.
The steady reduction in both the number of hours it takes to file taxes and the number of payments companies have to make reflects the increasing use of technology across the world both by companies and tax authorities. Since 2004, which is the first year for which we have Paying Taxes data, the global average for the time to file has decreased by 84 hours3, and the number of tax payments has reduced by 10.3. As the costs of technology fall, more companies are using tax software, and more tax authorities are creating easier-to-use online portals to simplify compliance.
Paying Taxes 2019 | 13
3 The trend includes data only for the 174 economies that have been part of Paying Taxes since 2004.
4 The other years were 2005 and 2012.
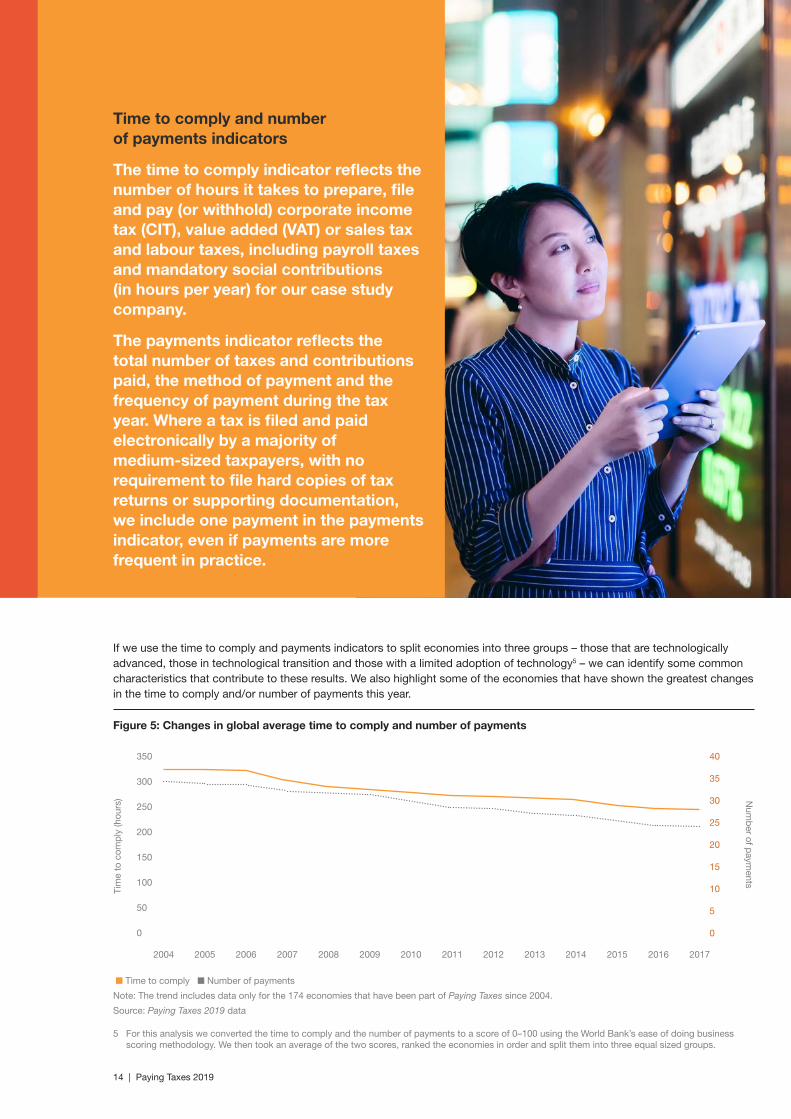
If we use the time to comply and payments indicators to split economies into three groups – those that are technologically advanced, those in technological transition and those with a limited adoption of technology5 – we can identify some common characteristics that contribute to these results. We also highlight some of the economies that have shown the greatest changes in the time to comply and/or number of payments this year.
Time to comply and number of payments indicators
The time to comply indicator reflects the number of hours it takes to prepare, file and pay (or withhold) corporate income tax (CIT), value added (VAT) or sales tax and labour taxes, including payroll taxes and mandatory social contributions (in hours per year) for our case study company.
The payments indicator reflects the total number of taxes and contributions paid, the method of payment and the frequency of payment during the tax year. Where a tax is filed and paid electronically by a majority of medium-sized taxpayers, with no requirement to file hard copies of tax returns or supporting documentation, we include one payment in the payments indicator, even if payments are more frequent in practice.
14 | Paying Taxes 2019
Figure 5: Changes in global average time to comply and number of payments
n Time to comply n Number of payments
Note: The trend includes data only for the 174 economies that have been part of Paying Taxes since 2004.
Source: Paying Taxes 2019 data
2004 2005 2006 2007 2008 2009 2010 2011 2012 2013 2014 2015 2016 2017
350 40
150
200
250
300
100
15
20
25
30
35
50
10
5
00
5 For this analysis we converted the time to comply and the number of payments to a score of 0–100 using the World Bank’s ease of doing business scoring methodology. We then took an average of the two scores, ranked the economies in order and split them into three equal sized groups.
Num
ber of p
ayments
Tim
e to
com
ply
(hou
rs)
Technologically advanced economies
Some of the most technologically advanced economies have had electronic filing and payment in place for more than a decade. Some economies are now using cutting-edge techniques, such as big data, analytics, artificial intelligence and machine learning. In other economies, large reductions in the time to file and the number of payments are the result of past investments in both technology and planning.
Top-performing economies often demonstrate some or all of these characteristics:
• Tax returns are pre-populated by automatically exportingdata from accounting software.
• Machine learning and artificial intelligence are used toidentify tax-sensitive transactions.
• (Near) real-time tax systems compare information fromdifferent counterparties to enable rapid verification oftransactions, minimise errors and protect against fraud.
• Well-planned reforms allow taxpayers time to plan,prepare and consult with tax authorities.
• Taxpayers benefit from simplified regulations and easyaccess to clear, timely information through email or phonecontact, websites, e-learning and virtual assistants.
• IT infrastructure is high speed and widespread, such asfibre optic broadband networks and 4G coverage.
Paying Taxes 2019 | 15
China China has experienced a very substantial reduction both in time to comply and payments from 832 hours and 37 payments in 2004 to 142 hours and 7 payments today. This trend has accelerated in recent years with the introduction of the Golden Tax III Project and a significant overhaul of the tax system, including the removal of the business tax and the digitalisation of VAT compliance, and was accompanied by major education programmes for taxpayers and the transition of the tax authorities to a more customer-focussed model.
Although technology has greatly eased the tax compliance burden in China, the tax system still retains elements of inherent complexity due, in part, to the high rates of social security contributions (SSCs) and the number of different taxes, especially on property transfers.
2016 207 hours 9 payments
2017 142 hours 7 payments
Hong Kong SAR, China
Hong Kong’s time to comply has always been significantly lower than the world average, due, in part, to the absence of VAT or goods and services tax (GST). Even so, technological innovations reduced the time to comply by a further 10 hours in 2017 as more companies adopted intelligent digital systems for accounting and tax functions. The relative simplicity and stability of tax regulations and digitalisation of the entire tax work stream also contribute to Hong Kong’s high performance in Paying Taxes.
2016 45 hours 3 payments
2017 35 hours 3 payments
Norway As an early adopter of electronic filing and payment, Norway had only four tax payments until 2017, when it added a new property tax. Although all municipalities in Norway had an option to levy a property tax, this power had not been exercised in Oslo for many years. Following a change in the political allegiance of Oslo City Council, the tax was introduced to fund the city’s public services. Property taxes are often used to raise revenues to fund the local government but, as in Oslo, are often also based on property valuations which can be difficult and time-consuming to determine and give rise to disagreements between taxpayers and tax authorities. Once a value has been agreed upon, however, a property tax can be relatively easy to administer; although, the amounts raised are often low.
2016 83 hours 4 payments
2017 79 hours 5 payments
Well-planned reforms allow taxpayers time to plan, prepare and consult with tax authorities.
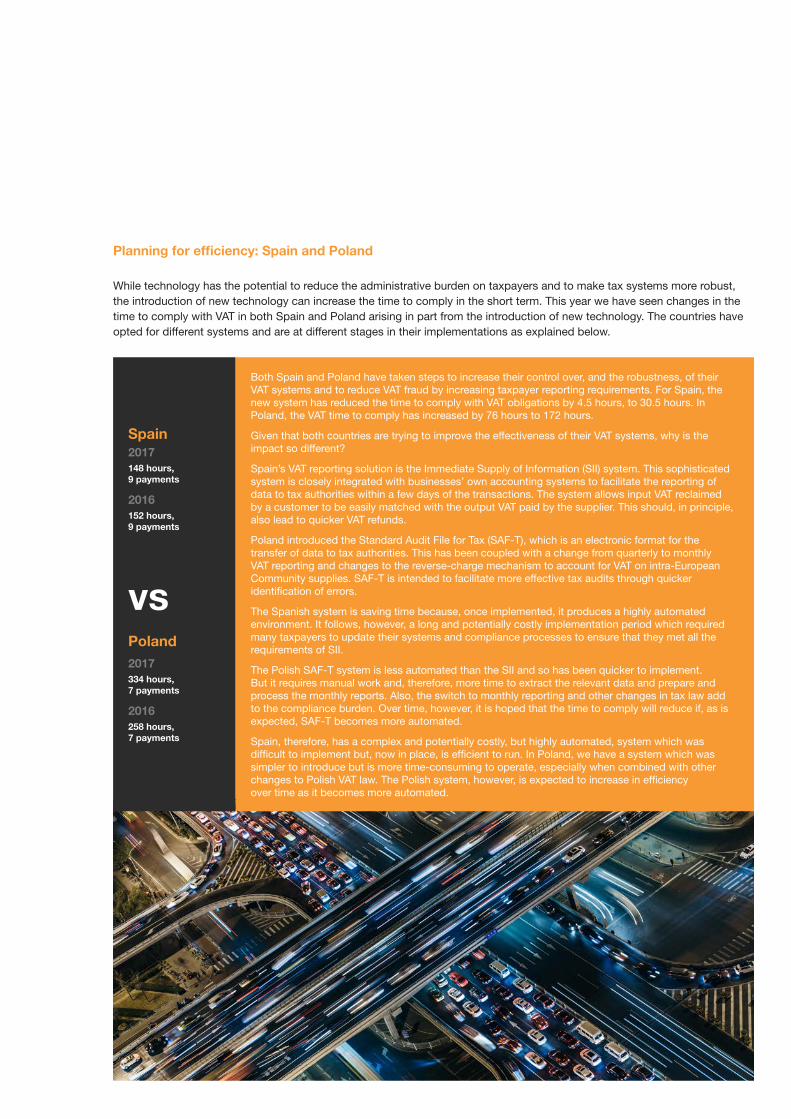
Planning for efficiency: Spain and Poland
Spain 2017 148 hours, 9 payments
2016 152 hours, 9 payments
vsPoland 2017 334 hours, 7 payments
2016 258 hours, 7 payments
Both Spain and Poland have taken steps to increase their control over, and the robustness, of their VAT systems and to reduce VAT fraud by increasing taxpayer reporting requirements. For Spain, the new system has reduced the time to comply with VAT obligations by 4.5 hours, to 30.5 hours. In Poland, the VAT time to comply has increased by 76 hours to 172 hours.
Given that both countries are trying to improve the effectiveness of their VAT systems, why is the impact so different?
Spain’s VAT reporting solution is the Immediate Supply of Information (SII) system. This sophisticated system is closely integrated with businesses’ own accounting systems to facilitate the reporting of data to tax authorities within a few days of the transactions. The system allows input VAT reclaimed by a customer to be easily matched with the output VAT paid by the supplier. This should, in principle, also lead to quicker VAT refunds.
Poland introduced the Standard Audit File for Tax (SAF-T), which is an electronic format for the transfer of data to tax authorities. This has been coupled with a change from quarterly to monthly VAT reporting and changes to the reverse-charge mechanism to account for VAT on intra-European Community supplies. SAF-T is intended to facilitate more effective tax audits through quicker identification of errors.
The Spanish system is saving time because, once implemented, it produces a highly automated environment. It follows, however, a long and potentially costly implementation period which required many taxpayers to update their systems and compliance processes to ensure that they met all the requirements of SII.
The Polish SAF-T system is less automated than the SII and so has been quicker to implement. But it requires manual work and, therefore, more time to extract the relevant data and prepare and process the monthly reports. Also, the switch to monthly reporting and other changes in tax law add to the compliance burden. Over time, however, it is hoped that the time to comply will reduce if, as is expected, SAF-T becomes more automated.
Spain, therefore, has a complex and potentially costly, but highly automated, system which was difficult to implement but, now in place, is efficient to run. In Poland, we have a system which was simpler to introduce but is more time-consuming to operate, especially when combined with other changes to Polish VAT law. The Polish system, however, is expected to increase in efficiency over time as it becomes more automated.
While technology has the potential to reduce the administrative burden on taxpayers and to make tax systems more robust, the introduction of new technology can increase the time to comply in the short term. This year we have seen changes in the time to comply with VAT in both Spain and Poland arising in part from the introduction of new technology. The countries have opted for different systems and are at different stages in their implementations as explained below.
Paying Taxes 2019 | 17 Paying Taxes 2019 | 17
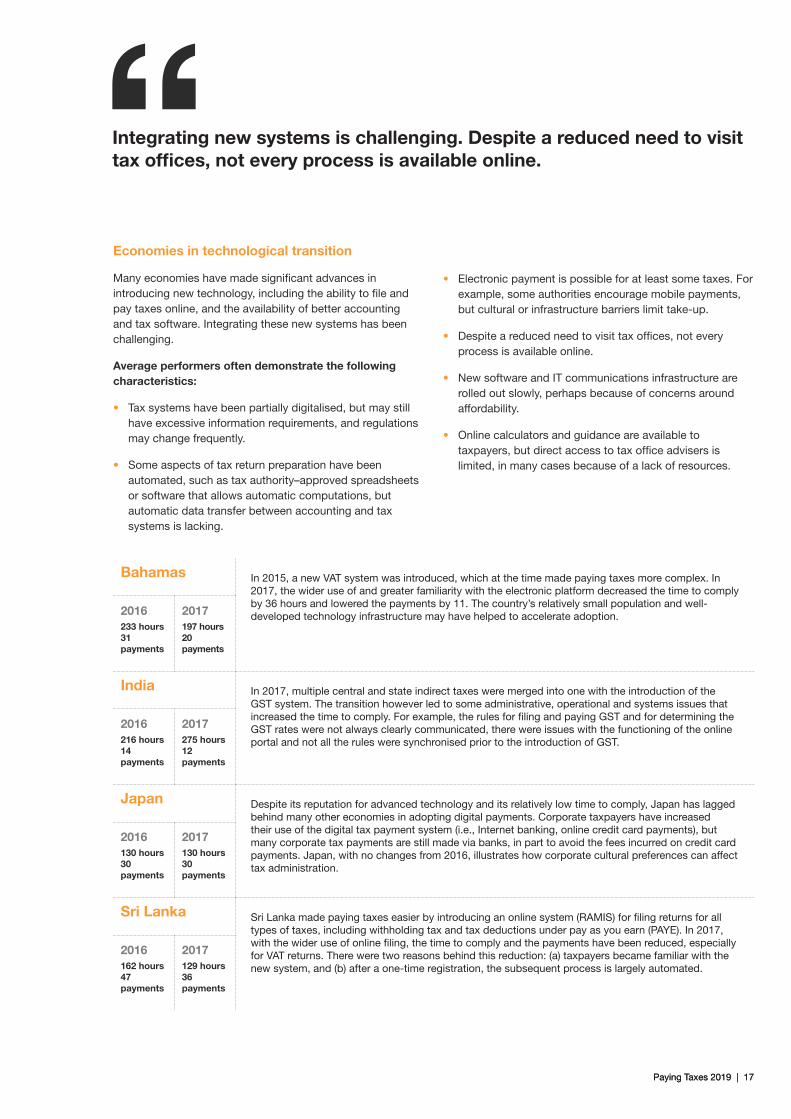
Economies in technological transition
Many economies have made significant advances in introducing new technology, including the ability to file and pay taxes online, and the availability of better accounting and tax software. Integrating these new systems has been challenging.
Average performers often demonstrate the following characteristics:
• Tax systems have been partially digitalised, but may stillhave excessive information requirements, and regulationsmay change frequently.
• Some aspects of tax return preparation have beenautomated, such as tax authority–approved spreadsheetsor software that allows automatic computations, butautomatic data transfer between accounting and taxsystems is lacking.
• Electronic payment is possible for at least some taxes. Forexample, some authorities encourage mobile payments,but cultural or infrastructure barriers limit take-up.
• Despite a reduced need to visit tax offices, not everyprocess is available online.
• New software and IT communications infrastructure arerolled out slowly, perhaps because of concerns aroundaffordability.
• Online calculators and guidance are available totaxpayers, but direct access to tax office advisers islimited, in many cases because of a lack of resources.
Bahamas In 2015, a new VAT system was introduced, which at the time made paying taxes more complex. In 2017, the wider use of and greater familiarity with the electronic platform decreased the time to comply by 36 hours and lowered the payments by 11. The country’s relatively small population and well-developed technology infrastructure may have helped to accelerate adoption. 2016
233 hours 31 payments
2017 197 hours 20 payments
India In 2017, multiple central and state indirect taxes were merged into one with the introduction of the GST system. The transition however led to some administrative, operational and systems issues that increased the time to comply. For example, the rules for filing and paying GST and for determining the GST rates were not always clearly communicated, there were issues with the functioning of the online portal and not all the rules were synchronised prior to the introduction of GST.
2016 216 hours 14 payments
2017 275 hours 12 payments
Japan Despite its reputation for advanced technology and its relatively low time to comply, Japan has lagged behind many other economies in adopting digital payments. Corporate taxpayers have increased their use of the digital tax payment system (i.e., Internet banking, online credit card payments), but many corporate tax payments are still made via banks, in part to avoid the fees incurred on credit card payments. Japan, with no changes from 2016, illustrates how corporate cultural preferences can affect tax administration.
2016 130 hours 30 payments
2017 130 hours 30 payments
Sri Lanka Sri Lanka made paying taxes easier by introducing an online system (RAMIS) for filing returns for all types of taxes, including withholding tax and tax deductions under pay as you earn (PAYE). In 2017, with the wider use of online filing, the time to comply and the payments have been reduced, especially for VAT returns. There were two reasons behind this reduction: (a) taxpayers became familiar with the new system, and (b) after a one-time registration, the subsequent process is largely automated.
2016 162 hours 47 payments
2017 129 hours 36 payments
Integrating new systems is challenging. Despite a reduced need to visit tax offices, not every process is available online.
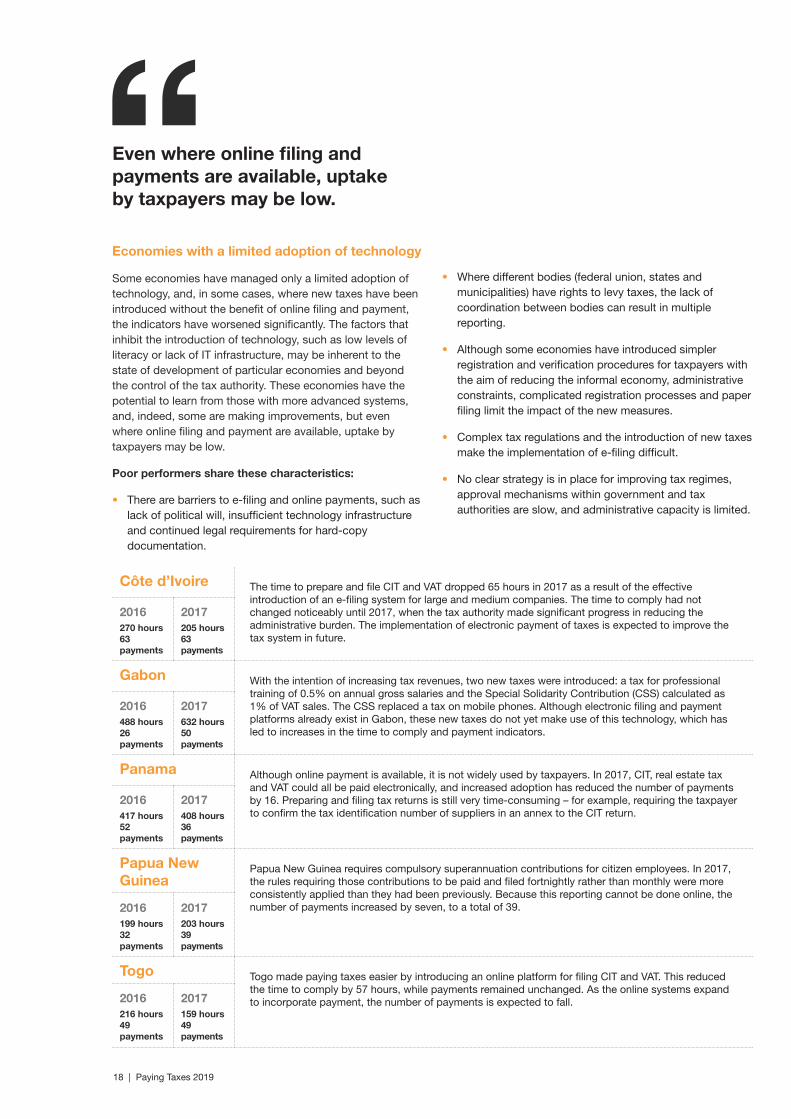
Côte d’Ivoire The time to prepare and file CIT and VAT dropped 65 hours in 2017 as a result of the effective introduction of an e-filing system for large and medium companies. The time to comply had not changed noticeably until 2017, when the tax authority made significant progress in reducing the administrative burden. The implementation of electronic payment of taxes is expected to improve the tax system in future.
2016 270 hours 63 payments
2017 205 hours 63 payments
Gabon With the intention of increasing tax revenues, two new taxes were introduced: a tax for professional training of 0.5% on annual gross salaries and the Special Solidarity Contribution (CSS) calculated as 1% of VAT sales. The CSS replaced a tax on mobile phones. Although electronic filing and payment platforms already exist in Gabon, these new taxes do not yet make use of this technology, which has led to increases in the time to comply and payment indicators.
2016 488 hours 26 payments
2017 632 hours 50 payments
Panama Although online payment is available, it is not widely used by taxpayers. In 2017, CIT, real estate tax and VAT could all be paid electronically, and increased adoption has reduced the number of payments by 16. Preparing and filing tax returns is still very time-consuming – for example, requiring the taxpayer to confirm the tax identification number of suppliers in an annex to the CIT return.
2016 417 hours 52 payments
2017 408 hours 36 payments
Papua New Guinea
Papua New Guinea requires compulsory superannuation contributions for citizen employees. In 2017, the rules requiring those contributions to be paid and filed fortnightly rather than monthly were more consistently applied than they had been previously. Because this reporting cannot be done online, the number of payments increased by seven, to a total of 39. 2016
199 hours 32 payments
2017 203 hours 39 payments
Togo Togo made paying taxes easier by introducing an online platform for filing CIT and VAT. This reduced the time to comply by 57 hours, while payments remained unchanged. As the online systems expand to incorporate payment, the number of payments is expected to fall.2016
216 hours 49 payments
2017 159 hours 49 payments
Economies with a limited adoption of technology
Some economies have managed only a limited adoption of technology, and, in some cases, where new taxes have been introduced without the benefit of online filing and payment, the indicators have worsened significantly. The factors that inhibit the introduction of technology, such as low levels of literacy or lack of IT infrastructure, may be inherent to the state of development of particular economies and beyond the control of the tax authority. These economies have the potential to learn from those with more advanced systems, and, indeed, some are making improvements, but even where online filing and payment are available, uptake by taxpayers may be low.
Poor performers share these characteristics:
• There are barriers to e-filing and online payments, such aslack of political will, insufficient technology infrastructureand continued legal requirements for hard-copydocumentation.
• Where different bodies (federal union, states andmunicipalities) have rights to levy taxes, the lack ofcoordination between bodies can result in multiplereporting.
• Although some economies have introduced simplerregistration and verification procedures for taxpayers withthe aim of reducing the informal economy, administrativeconstraints, complicated registration processes and paperfiling limit the impact of the new measures.
• Complex tax regulations and the introduction of new taxesmake the implementation of e-filing difficult.
• No clear strategy is in place for improving tax regimes,approval mechanisms within government and taxauthorities are slow, and administrative capacity is limited.
Even where online filing and payments are available, uptake by taxpayers may be low.
18 | Paying Taxes 2019

Technology is transforming the way businesses and governments approach tax
The Paying Taxes results this year underline the benefits that technology can bring to taxpayers and tax authorities alike. They also show that new systems can be time-consuming to implement and, once they’re in place, taxpayers need a period of adjustment to become familiar with them. Some of these barriers, however, can be reduced through proper planning, consultation with taxpayers, thorough testing and a phased approach to implementation.
The use of technology in tax compliance is a hot topic for governments and businesses. Regardless of size and sector, all businesses are having to come to grips with technology. For the smallest businesses, this may be a transition from keeping receipts in a ‘shoebox’ to recording transactions on spreadsheets. For the largest businesses, spreadsheets are yesterday’s technology, and sophisticated data mining and analysis tools are being used to extract data from central accounting systems, to analyse it and to present it in different ways to meet a range of business requirements. As governments increasingly push the burden of compliance to taxpayers, all businesses need to leverage technology to meet as efficiently as possible the demands placed upon them.
Tax departments in large businesses are having to increase the data and digital capabilities of their tax departments, while for smaller companies, user-friendly tax software or computer desktop automation tools may allow tax compliance to be automated and embedded in the day-to-day business administration. Technology can also reduce the time needed for repetitive compliance tasks, which can free up time to understand and address the complexities of changing legislation, and manage the challenges that modern businesses face in many areas of tax.
Similarly, tax authorities need to ensure that they have the appropriate skills and resources, not only to develop online systems but also to analyse the data that comes from them. As highlighted in this report, we are already seeing real-time and near-real-time systems that match VAT collected by suppliers with VAT refunds claimed by businesses. As such systems evolve, tax authorities will be able to more easily identify unusual transactions as they happen and to notify taxpayers immediately – similar to the way your credit card provider notifies you when its algorithms identify potentially fraudulent charges on your account.
All of these changes mean that more and more data is being transmitted digitally between taxpayers and tax authorities and, in the case of multinational companies, between tax authorities. All parties, therefore, need to ensure that the data is correct and properly protected, and that all parties understand its use. Transparency around how data is to be used is critical to building trust between taxpayers and tax authorities.
The use of technology affords many possibilities to improve tax compliance by making processes more efficient and more robust. To derive the maximum benefits from it, however, governments need to work with one another, and with taxpayers, to ensure that best practices are shared, that the rules for the collection and use of data are transparent and that, as far as possible, there is a degree of coherence between systems in different countries to facilitate compliance for businesses operating in more than one country.
PwC Global Leader, Tax Reporting and Strategy, PwC Canada
Christopher Kong
Paying Taxes 2019 | 19
The uneven global impact of the changing tax burden for business
Chapter 2
20 | Paying Taxes 2019
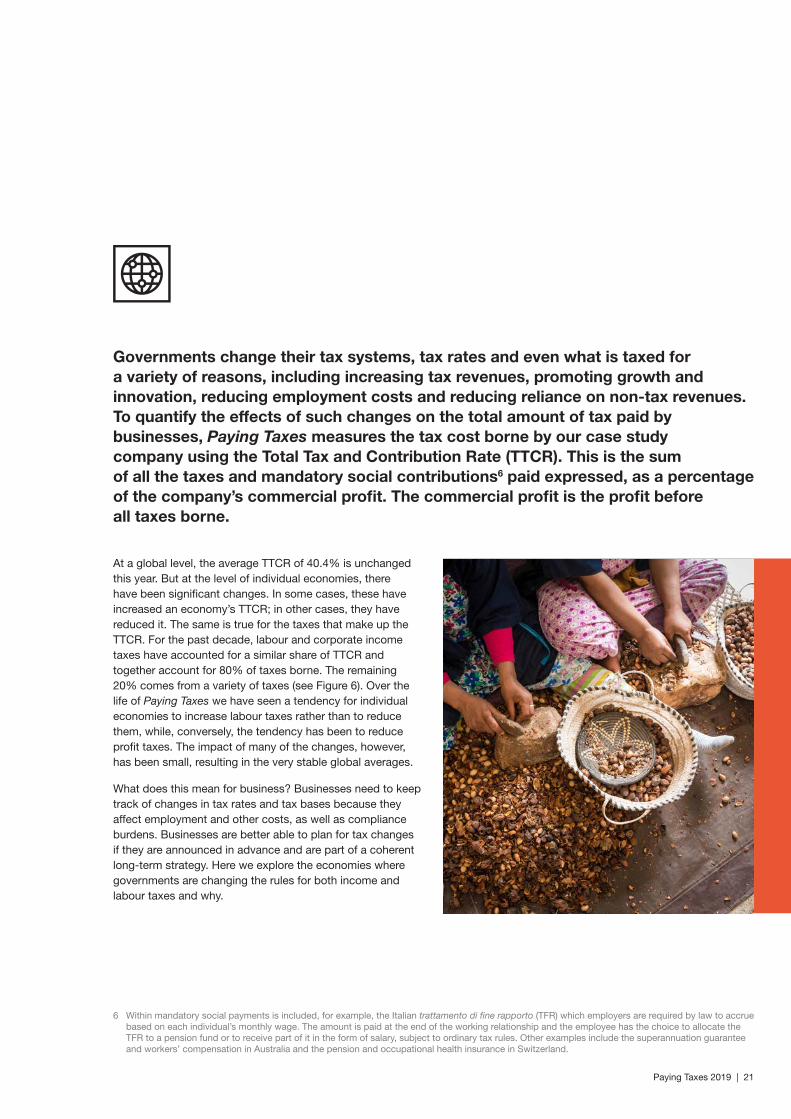
At a global level, the average TTCR of 40.4% is unchanged this year. But at the level of individual economies, there have been significant changes. In some cases, these have increased an economy’s TTCR; in other cases, they have reduced it. The same is true for the taxes that make up the TTCR. For the past decade, labour and corporate income taxes have accounted for a similar share of TTCR and together account for 80% of taxes borne. The remaining 20% comes from a variety of taxes (see Figure 6). Over the life of Paying Taxes we have seen a tendency for individual economies to increase labour taxes rather than to reduce them, while, conversely, the tendency has been to reduce profit taxes. The impact of many of the changes, however, has been small, resulting in the very stable global averages.
What does this mean for business? Businesses need to keep track of changes in tax rates and tax bases because they affect employment and other costs, as well as compliance burdens. Businesses are better able to plan for tax changes if they are announced in advance and are part of a coherent long-term strategy. Here we explore the economies where governments are changing the rules for both income and labour taxes and why.
Governments change their tax systems, tax rates and even what is taxed for a variety of reasons, including increasing tax revenues, promoting growth and innovation, reducing employment costs and reducing reliance on non-tax revenues. To quantify the effects of such changes on the total amount of tax paid by businesses, Paying Taxes measures the tax cost borne by our case study company using the Total Tax and Contribution Rate (TTCR). This is the sum of all the taxes and mandatory social contributions6 paid expressed, as a percentage of the company’s commercial profit. The commercial profit is the profit before all taxes borne.
Paying Taxes 2019 | 21
6 Within mandatory social payments is included, for example, the Italian trattamento di fine rapporto (TFR) which employers are required by law to accrue based on each individual’s monthly wage. The amount is paid at the end of the working relationship and the employee has the choice to allocate the TFR to a pension fund or to receive part of it in the form of salary, subject to ordinary tax rules. Other examples include the superannuation guarantee and workers’ compensation in Australia and the pension and occupational health insurance in Switzerland.
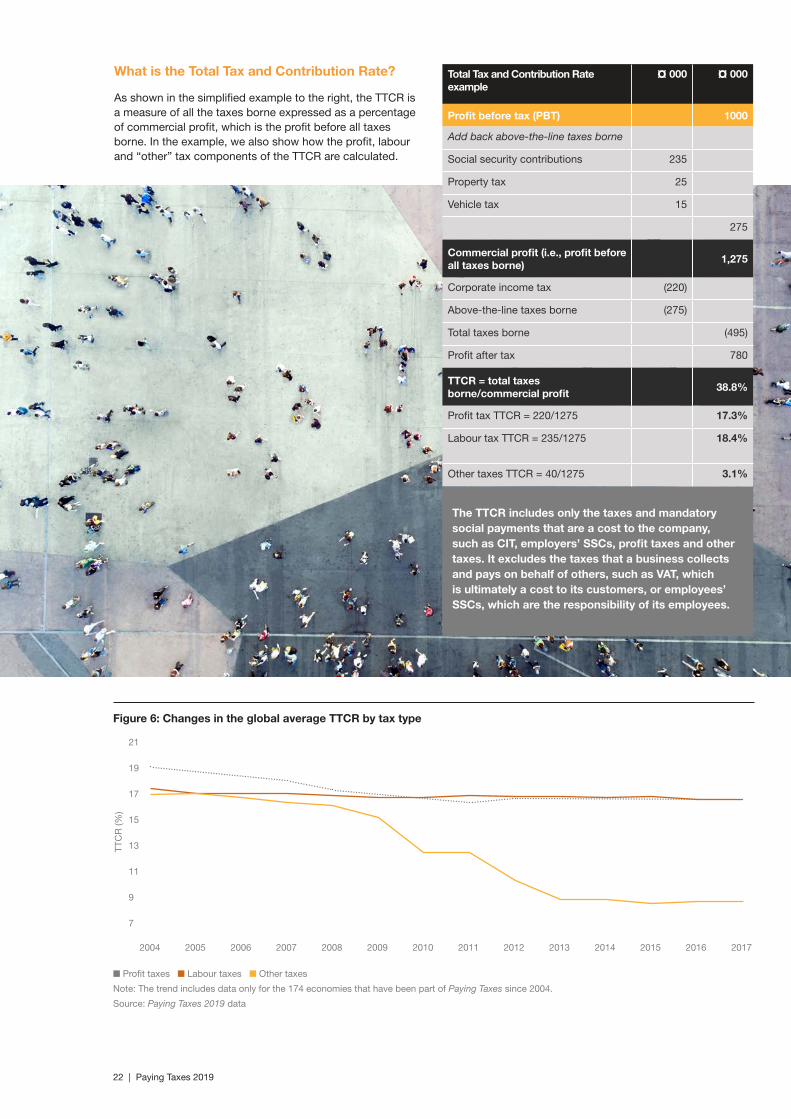
Total Tax and Contribution Rate example
¤ 000 ¤ 000
Profit before tax (PBT) 1000
Add back above-the-line taxes borne
Social security contributions 235
Property tax 25
Vehicle tax 15
275
Commercial profit (i.e., profit before all taxes borne)
1,275
Corporate income tax (220)
Above-the-line taxes borne (275)
Total taxes borne (495)
Profit after tax 780
TTCR = total taxes borne/commercial profit
38.8%
Profit tax TTCR = 220/1275 17.3%
Labour tax TTCR = 235/1275 18.4%
Other taxes TTCR = 40/1275 3.1%
Figure 6: Changes in the global average TTCR by tax type
n Profit taxes n Labour taxes n Other taxes
Note: The trend includes data only for the 174 economies that have been part of Paying Taxes since 2004.
Source: Paying Taxes 2019 data
2004 2005 2006 2007 2008 2009 2010 2011 2012 2013 2014 2015 2016 2017
21
13
15
17
19
11
9
7
The TTCR includes only the taxes and mandatory social payments that are a cost to the company, such as CIT, employers’ SSCs, profit taxes and other taxes. It excludes the taxes that a business collects and pays on behalf of others, such as VAT, which is ultimately a cost to its customers, or employees’ SSCs, which are the responsibility of its employees.
What is the Total Tax and Contribution Rate?
As shown in the simplified example to the right, the TTCR is a measure of all the taxes borne expressed as a percentage of commercial profit, which is the profit before all taxes borne. In the example, we also show how the profit, labour and “other” tax components of the TTCR are calculated.
TTC
R (%
)
22 | Paying Taxes 2019
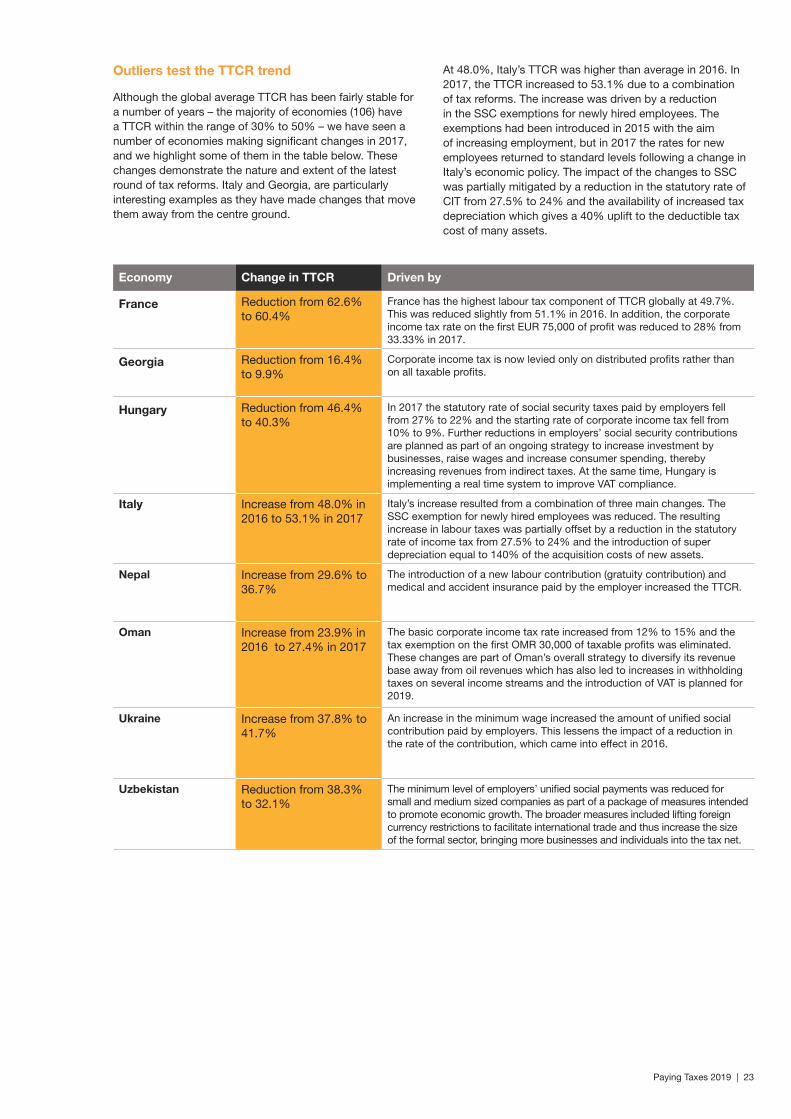
Outliers test the TTCR trend
Although the global average TTCR has been fairly stable for a number of years – the majority of economies (106) have a TTCR within the range of 30% to 50% – we have seen a number of economies making significant changes in 2017, and we highlight some of them in the table below. These changes demonstrate the nature and extent of the latest round of tax reforms. Italy and Georgia, are particularly interesting examples as they have made changes that move them away from the centre ground.
At 48.0%, Italy’s TTCR was higher than average in 2016. In 2017, the TTCR increased to 53.1% due to a combination of tax reforms. The increase was driven by a reduction in the SSC exemptions for newly hired employees. The exemptions had been introduced in 2015 with the aim of increasing employment, but in 2017 the rates for new employees returned to standard levels following a change in Italy’s economic policy. The impact of the changes to SSC was partially mitigated by a reduction in the statutory rate of CIT from 27.5% to 24% and the availability of increased tax depreciation which gives a 40% uplift to the deductible tax cost of many assets.
Paying Taxes 2019 | 23
Economy Change in TTCR Driven by
France Reduction from 62.6% to 60.4%
France has the highest labour tax component of TTCR globally at 49.7%. This was reduced slightly from 51.1% in 2016. In addition, the corporate income tax rate on the first EUR 75,000 of profit was reduced to 28% from 33.33% in 2017.
Georgia Reduction from 16.4% to 9.9%
Corporate income tax is now levied only on distributed profits rather than on all taxable profits.
Hungary Reduction from 46.4% to 40.3%
In 2017 the statutory rate of social security taxes paid by employers fell from 27% to 22% and the starting rate of corporate income tax fell from 10% to 9%. Further reductions in employers’ social security contributions are planned as part of an ongoing strategy to increase investment by businesses, raise wages and increase consumer spending, thereby increasing revenues from indirect taxes. At the same time, Hungary is implementing a real time system to improve VAT compliance.
Italy Increase from 48.0% in 2016 to 53.1% in 2017
Italy’s increase resulted from a combination of three main changes. The SSC exemption for newly hired employees was reduced. The resulting increase in labour taxes was partially offset by a reduction in the statutory rate of income tax from 27.5% to 24% and the introduction of super depreciation equal to 140% of the acquisition costs of new assets.
Nepal Increase from 29.6% to 36.7%
The introduction of a new labour contribution (gratuity contribution) and medical and accident insurance paid by the employer increased the TTCR.
Oman Increase from 23.9% in 2016 to 27.4% in 2017
The basic corporate income tax rate increased from 12% to 15% and the tax exemption on the first OMR 30,000 of taxable profits was eliminated. These changes are part of Oman’s overall strategy to diversify its revenue base away from oil revenues which has also led to increases in withholding taxes on several income streams and the introduction of VAT is planned for 2019.
Ukraine Increase from 37.8% to 41.7%
An increase in the minimum wage increased the amount of unified social contribution paid by employers. This lessens the impact of a reduction in the rate of the contribution, which came into effect in 2016.
Uzbekistan Reduction from 38.3% to 32.1%
The minimum level of employers’ unified social payments was reduced for small and medium sized companies as part of a package of measures intended to promote economic growth. The broader measures included lifting foreign currency restrictions to facilitate international trade and thus increase the size of the formal sector, bringing more businesses and individuals into the tax net.
On the other end of the spectrum, Georgia, despite having a low TTCR of 16.4% in 2016, significantly reduced the profit tax component of its TTCR by levying CIT only on distributed profits rather than on all taxable profits. The Georgian government hopes this approach will encourage foreign direct investment and promote entrepreneurship and growth through increased reinvestment of profits. An impact assessment carried out prior to the reform suggested that tax revenues would decrease initially, but would then increase over time7. The new Georgian CIT model replicates the Estonian model; however, Estonia has a labour tax TTCR of 38.8%, whereas Georgia currently levies no SSCs. Reforms are planned to introduce SSCs in Georgia in 2019. It will be interesting to see whether Georgia’s radical reform programme produces an increase in tax revenues as expected.
US tax reform: One of the most significant tax reforms in 2017 occurred in the United States, but as these did not take effect until 2018, they do not affect the Paying Taxes data for the tax year measured in this report. We will assess the impact next year.
Profit taxes versus labour taxes – globally stable, locally shifting
As highlighted in the earlier examples, some economies have increased the profit tax component of the TTCR, while others have reduced it. Most of these shifts have resulted in only minor changes in the TTCR. In 2017, the greatest reduction in profit tax rates came from Georgia and the greatest increase from Oman. In both cases, the changes are part of broader government tax strategies: for Georgia, the intention is to increase investment and economic growth, and Oman aims to increase tax revenues and thereby reduce reliance on oil revenues.
Overall, in 2017, the profit tax component of the TTCR decreased in 58 economies and increased in 37. Indeed, for all but one year since 2004, we have seen more economies decreasing the profit tax component of the TTCR than increasing it. Despite these many changes, the profit tax component of the average global TTCR has been remarkably stable and fell by only 0.1 percentage points in the last year.
Although changing the statutory CIT rate is the most obvious way to change the profit tax component of the TTCR, we have seen many other reforms over the years. These include the following:
• amending loss carryforward provisions
• taxing distributed profits rather than all taxable profits
• changing capital allowance rates and regimes
• reducing or increasing thresholds for tax-exempt income
• amending capital gains tax rates and allowable deductions
• changing the deductibility of expenses and provisions.
In contrast to profit taxes, in all but one year since 2007, more economies have increased the labour tax component of TTCR than have reduced it. In 2017, the labour tax component of the TTCR fell in 17 economies, but increased in 39. The biggest reduction was in Uzbekistan and the biggest increase in Italy. The overall global increase in the labour tax component of the TTCR in 2017, however, was only 0.1 percentage points.
As with profit taxes, changing the headline rates of tax is just one way to affect the labour tax component of the TTCR. Some other changes we have seen include the following:
• changes to statutory employer social securitycontributions SSC rates
• revising minimum wage levels, which has a knock-oneffect on tax take
• changes to the floors/ceilings for SSCs
• imposition of employer pension and other fundcontributions
• introduction of new employer insurance contributions(e.g., medical, unemployment insurance) and other taxesand contributions
• use of solidarity contributions to respond to specificevents
• shifting the burden of SSCs between employers andemployees
7 USAID 2016, Governing for Growth (G4G) in Georgia, Regulatory Impact Assessment on Estonian CIT Model Implementation in Georgia
24 | Paying Taxes 2019
Balancing the labour tax burden
Taxes on labour usually include three elements: personal income tax, employer social security contributions and employee social security contributions. The balance between these varies substantially between economies.
For example, as shown in Figure 7, in Belgium, Italy and France, the burden of SSCs falls much more heavily on employers rather than on employees, whereas in Slovenia, Poland, Germany, Israel and the Netherlands, the opposite is true. In Chile, employees bear the full burden of social security, while in Australia and New Zealand, employees’ share of SSCs is zero, because the labour taxes rely heavily on personal income tax.
As Paying Taxes focusses on taxes from a company perspective, the TTCR includes only the labour taxes and mandatory social contributions borne by the company. This includes social contributions required by law but paid to private institutions, such as insurance providers, rather than to the state. The TTCR does not include the taxes and contributions borne by the employees.
One way of changing the labour tax component of the TTCR is to reduce employer social security contributions, but this may not change the overall labour tax burden if the employee contribution is increased to compensate.
Romania, for example, has been restructuring its SSCs for a number of years. In October 2014, the rate of employers’ social security contributions was reduced, lowering the total employer contribution rate from 28.45% to 23.45%. On 1 January 20188, employers’ SSCs were reduced to 2.25% while the employees’ SSCs were increased from 16.5% to 35% and the personal income tax rate was reduced from 16% to 10%. In the absence of any adjustments to salaries, these changes would result in a reduction of around 20% in employers’ total labour cost and a reduction of around 20% in employees' net salaries. It was however left to employers to decide whether or not to increase gross salaries thereby maintaining their labour costs and the net salaries of employees.
Paying Taxes 2019 | 25
Figure 7: Average tax wedge as a percentage of labour costs for workers earning the average wage in 2017
Note: Single individual without children at the income level of the average worker. Source: OECD Taxing Wages Database.
CH
L
NZ
L
ME
X
CH
E
ISR
KO
R
IRL
AU
S
CA
N
GB
R
US
A
JPN
ISL
OE
CD
DN
K
NLD ES
T
PO
L
NO
R
LUX
TUR
ES
P
GR
C
PR
T
SV
K
LVA
SW
E
FIN
SV
N
CZ
E
HU
N
AU
T
FRA
ITA
DE
U
BE
L60%
50%
40%
30%
20%
10%
0%
n Employer SSC n Employee SSC n Income tax
8 https://www.pwc.ro/en/tax-legal/alerts/fiscal-code-amendments3.html
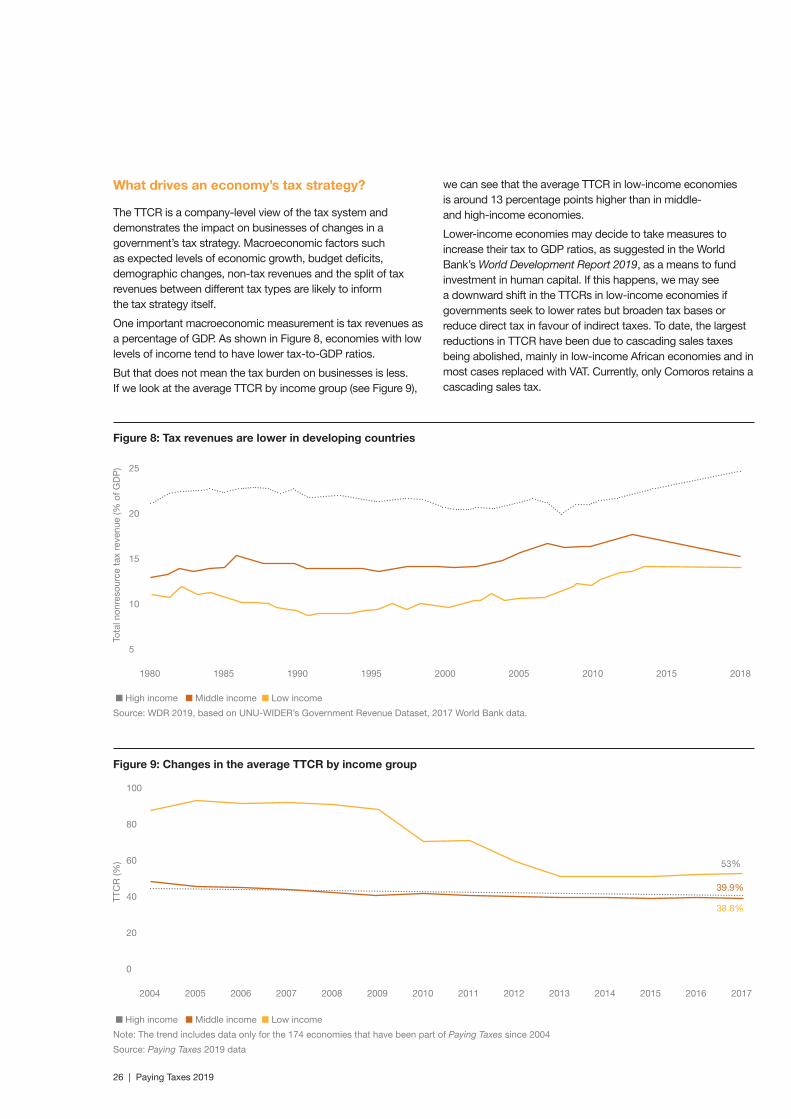
What drives an economy’s tax strategy?
The TTCR is a company-level view of the tax system and demonstrates the impact on businesses of changes in a government’s tax strategy. Macroeconomic factors such as expected levels of economic growth, budget deficits, demographic changes, non-tax revenues and the split of tax revenues between different tax types are likely to inform the tax strategy itself.
One important macroeconomic measurement is tax revenues as a percentage of GDP. As shown in Figure 8, economies with low levels of income tend to have lower tax-to-GDP ratios.
But that does not mean the tax burden on businesses is less. If we look at the average TTCR by income group (see Figure 9),
we can see that the average TTCR in low-income economies is around 13 percentage points higher than in middle- and high-income economies.
Lower-income economies may decide to take measures to increase their tax to GDP ratios, as suggested in the World Bank’s World Development Report 2019, as a means to fund investment in human capital. If this happens, we may see a downward shift in the TTCRs in low-income economies if governments seek to lower rates but broaden tax bases or reduce direct tax in favour of indirect taxes. To date, the largest reductions in TTCR have been due to cascading sales taxes being abolished, mainly in low-income African economies and in most cases replaced with VAT. Currently, only Comoros retains a cascading sales tax.
Figure 8: Tax revenues are lower in developing countries
n High income n Middle income n Low income
Source: WDR 2019, based on UNU-WIDER’s Government Revenue Dataset, 2017 World Bank data.
1980 1985 1990 20001995 2005 2010 2015 2018
25
10
15
Tota
l non
reso
urce
tax
rev
enue
(% o
f GD
P)
TTC
R (%
)
20
5
Figure 9: Changes in the average TTCR by income group
n High income n Middle income n Low income
Note: The trend includes data only for the 174 economies that have been part of Paying Taxes since 2004
Source: Paying Taxes 2019 data
2004 2005 2006 2007 2008 2009 2010 2011 2012
53%
39.9%
38.8%
2013 2014 2015 2016 2017
100
20
40
60
80
0
26 | Paying Taxes 2019
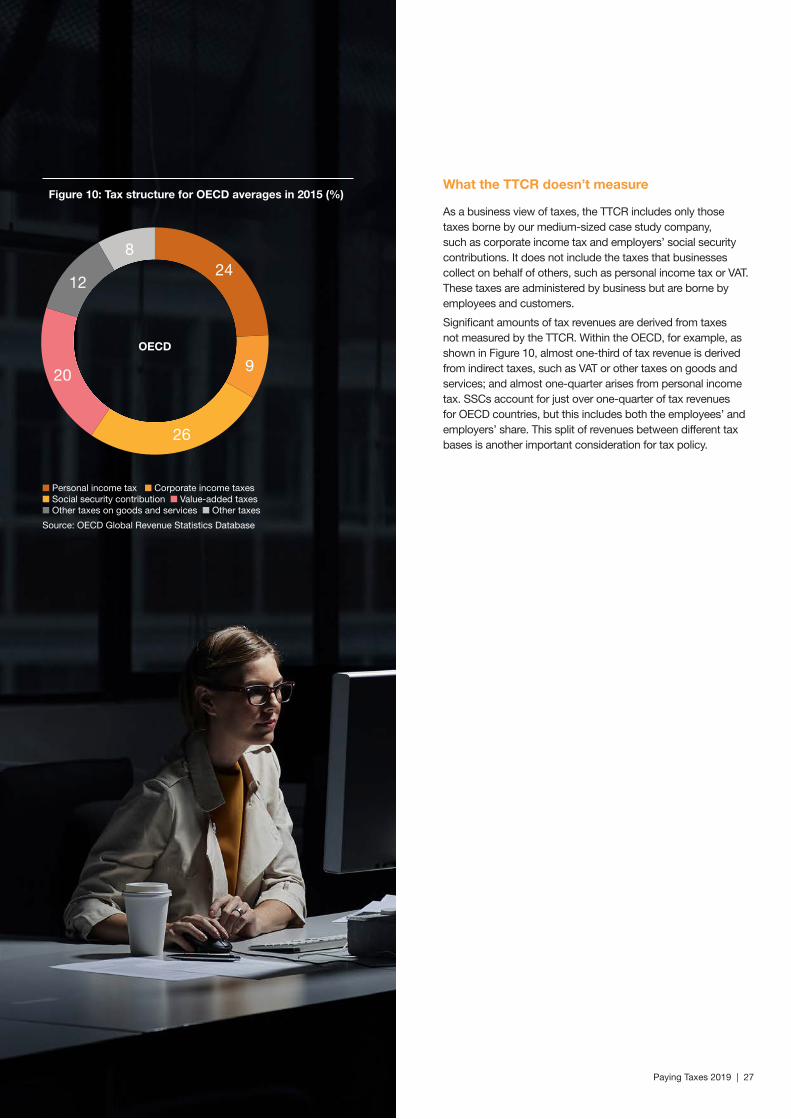
What the TTCR doesn’t measure
As a business view of taxes, the TTCR includes only those taxes borne by our medium-sized case study company, such as corporate income tax and employers’ social security contributions. It does not include the taxes that businesses collect on behalf of others, such as personal income tax or VAT. These taxes are administered by business but are borne by employees and customers.
Significant amounts of tax revenues are derived from taxes not measured by the TTCR. Within the OECD, for example, as shown in Figure 10, almost one-third of tax revenue is derived from indirect taxes, such as VAT or other taxes on goods and services; and almost one-quarter arises from personal income tax. SSCs account for just over one-quarter of tax revenues for OECD countries, but this includes both the employees’ and employers’ share. This split of revenues between different tax bases is another important consideration for tax policy.
Paying Taxes 2019 | 27
Figure 10: Tax structure for OECD averages in 2015 (%)
n Personal income tax n Corporate income taxes n Social security contribution n Value-added taxes n Other taxes on goods and services n Other taxes
Source: OECD Global Revenue Statistics Database
OECD
24
9
26
20
12
8

These shifts will have far-reaching implications for tax revenues, especially in economies with a focus on labour taxes. We have also identified a group of countries with high vulnerability to job displacement from AI10; typical features of these territories include high levels of industry and a lack of flexibility in the labour market. Governments in these economies should already be thinking of how to retrain workers at high risk of displacement by automation. Economies with high levels of technology already embedded and strong education systems are well equipped to thrive.
The outlook for TTCR, therefore, depends on the balance between profit taxes and labour taxes, and the economy’s exposure to technology-related disruption. The intersection between technology and other major trends also needs to be considered. Income tax revenue will come under pressure from an ageing population, as more and more pensioners need to be supported by fewer and fewer workers. Finally, there may be some scope for a rise in ‘other’ taxation. Governments around the world are likely to explore new taxes on environmental degradation, property and wealth in the coming years as they grapple with challenges posed by inequality and the scarcity of resources.
Director, Economics, PwC UK
Dr Jonathan Gillham
Global trends: a PwC perspective
A number of global trends, including demographic change, a shift of economic power to emerging countries, climate change, urbanisation and, above all, changes in technology, could affect how governments seek to raise taxes in the future. With this in mind, we have asked two experts to give their views on how the TTCR picture might change in future.
Global trends will require governments to re-examine their tax policy.
The best tax regimes are nimble and responsive to changes in the structure of their economies. The next few years are likely to provide a test of these attributes, as significant disruptive forces are likely to take hold. At PwC, we think the biggest disruption will come from artificial intelligence (AI) and its effects on the labour market. The narrative about robots stealing our jobs is already so familiar as to feel cliched, but it is not without foundation. Our research has suggested that up to 60% of roles in manufacturing in the OECD held by those with low educational attainment could be automated in the next 20 years9. That said, AI is also likely to spur the creation of entirely new occupations in a variety of sectors, including healthcare, education and professional services.
9 https://www.pwc.co.uk/services/economics-policy/insights/the-impact-of-automation-on-jobs.html
10 https://www.pwc.co.uk/economic-services/assets/international-impact-of-automation-feb-2018.pdf
28 | Paying Taxes 2019

Look before you leap: How should tax policy respond to the rise of technology?
Although the balance of taxation could shift away from labour over the long term because of the impact of global megatrends, such as AI, policymakers should think carefully before adjusting the tax system to prepare for such a transition.
Policymakers should be mindful of the increasing tax burdens on capital. Although research from the World Bank’s Global Investment Competitiveness Report has shown that fundamentals such as market size, political stability and regulatory quality matter more to investors than tax competitiveness; poorly communicated or incoherent tax policy changes could nevertheless discourage investment. Indeed, the OECD’s recent work on tax certainty highlighted that, when making investment and location decisions, businesses care more about the certainty of rates than about the tax rate itself.
Analysis also suggests that job losses caused by rising automation are likely to be partly offset by job creation in areas related to, and benefitting from, the new technologies. This could partially mitigate erosion of the labour tax base. Moreover, job losses at the lower end of the income distribution are unlikely to create significant threats to the labour tax base because of the progressivity of many income tax and social security systems.
Thinking more broadly, there may be better ways to temper any impact on government revenue without introducing fundamental changes to the tax system. For instance, many governments fail to undertake systematic and transparent assessments of the value for money generated by tax incentives. Reforming unproductive and inefficient tax reliefs could offset any government revenue losses from rising levels of automation while also reducing complexity and improving the efficiency of the tax system.
Alternatively, reducing levels of informal economic activity could broaden the tax base, generating additional government revenue. Even small measures to promote formalisation, such as simplification or improvement of taxpayer guides to reduce tax compliance costs, can provide a vital boost to government revenues.
Paying Taxes 2019 | 29
Head, Global Fiscal Policy, PwC UK
Amal Larhlid
Post-filing processes and domestic disputes
Chapter 3
30 | Paying Taxes 2019

Lengthy or cumbersome processes can severely affect a company’s operations, from disrupting cash flow to diverting resources to respond to questions from the tax authority. Although there has been little change in the average global post-filing index score, the adoption of new technology is beginning to improve the efficiency of post-filing processes in some economies, while at the other end of the scale – mostly in lower-income economies – scores remain low, with long, drawn-out processes. In the coming years, however, as more economies use online systems to match VAT claimed by customers on their purchases with VAT collected by suppliers and use data analytics to target their tax audits and reviews, we may see improvements in post-filing processes.
In this chapter, we look at the different components of the post-filing process and at some audit issues in economies where the pre-filing indicators of time to comply and the number of payments have improved significantly since 2004.
The post-filing index is a score out of 100 where 100 represents the most efficient process and zero the least efficient process. The index is made up of four components which are defined in the following section and each of which also has a score from zero to 100. The final score is the average of these four component scores.
If an economy does not have VAT or corporate income tax, then the relevant components are omitted.11 If an economy charges VAT, but a refund is not available to our case study company, the economy will score zero for the VAT components of the index.
Now in its third year, the Paying Taxes post-filing index provides insight into the tax compliance burden that a business may face once it has filed its tax returns. Specifically, it looks at the process of obtaining a VAT refund and of correcting a corporate income tax return. It also considers any additional reviews, including tax audits, that are likely to arise as a result of these processes.
Paying Taxes 2019 | 31
11 In the study, 27 out of 190 economies have no VAT regimes, and in a further four economies, VAT does not apply to capital purchases. There are nine with no CIT regimes.
The components of the post-filing index
In 2017, the global average post-filing index score increased very slightly, from 59.4 to 59.6.
The index is made up of the following four equally weighted components; two relate to the process of obtaining a VAT refund and two to the correction of an inadvertent error in a corporate income tax return.
Looking at the components of the post-filing index on average around the world it takes our case study company 19.6 hours to comply with a VAT refund claim and 29.0 weeks to obtain the refund. The average time to comply with the CIT correction is 15.1 hours, and for those 79 economies where there would be a review in more than 25% of cases, the review lasts on average 27.6 weeks. The global average time to complete a CIT correction is 26.1 weeks, as this includes five economies that would not have a review but would have to wait a short time before making the additional tax payment.
VAT refund scenario: Our case study company buys new machinery. The cost is so large that the input VAT paid on the purchase greatly exceeds the company’s output VAT on sales in the period. The company, therefore, claims a cash refund of the excess input VAT. We measure the associated impact in two ways:
Time to comply with VAT refund (hours), includes:
• time spent preparing and submitting the refund claim
• time spent preparing information for the tax officers, if,in 50% or more of cases, a company that requests aVAT cash refund arising from a capital purchase wouldbe selected for additional review
Time to obtain VAT refund (weeks), includes:
• time from purchase of the machine to the date ofsubmission of the refund claim (this is equal to half thefiling period)
• length of any mandatory period that the excess outputVAT must be carried forward before a claim can bemade
• time from the submission of the VAT refund claim to thedate the refund is received. If a company that requestsa VAT cash refund arising from a capital purchase wouldbe selected for additional review in 50% or more ofcases, the duration of the review is included in the time
CIT correction scenario: Our case study company makes a simple and inadvertent error in its tax return, resulting in an underpayment of 5% of the overall CIT liability. It voluntarily notifies the tax authority of the error after the deadline for filing the return and pays the additional tax due. We measure the associated impact in two ways:
Time to comply with a CIT correction (hours), includes:
• time spent preparing and submitting the correction
• time spent preparing information for the tax officers, if,in 25% or more of cases, a company that voluntarilyreports an error in its CIT return and an underpaymentof the tax due would be selected for additional review
Time to complete a CIT correction (weeks), includes:
• the length of time between submitting the correctionand the receipt of the final outcome of the review, if,in 25% or more of cases, a company that voluntarilyreports an error in its CIT return and an underpaymentof the tax due would be selected for additional review
• the time the company has to wait before making theadditional tax payment if it cannot be paid at the timethe correction is submitted
32 | Paying Taxes 2019
Paying Taxes 2019 | 33
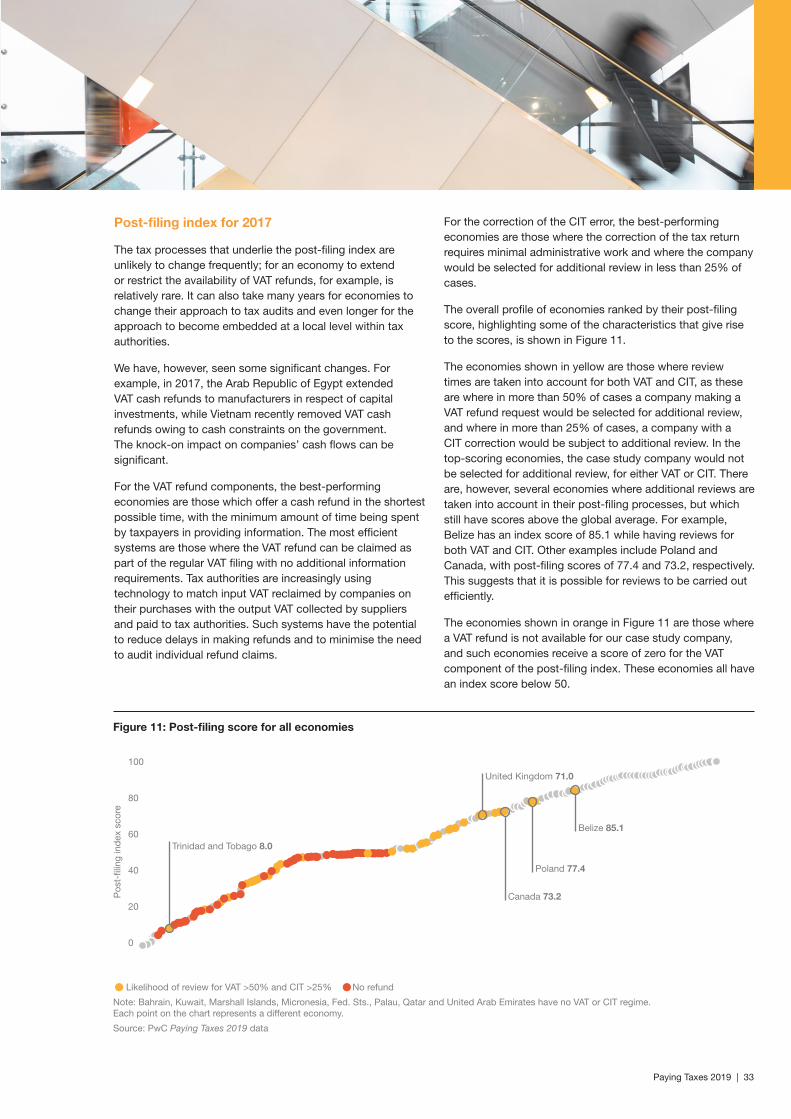
Post-filing index for 2017
The tax processes that underlie the post-filing index are unlikely to change frequently; for an economy to extend or restrict the availability of VAT refunds, for example, is relatively rare. It can also take many years for economies to change their approach to tax audits and even longer for the approach to become embedded at a local level within tax authorities.
We have, however, seen some significant changes. For example, in 2017, the Arab Republic of Egypt extended VAT cash refunds to manufacturers in respect of capital investments, while Vietnam recently removed VAT cash refunds owing to cash constraints on the government. The knock-on impact on companies’ cash flows can be significant.
For the VAT refund components, the best-performing economies are those which offer a cash refund in the shortest possible time, with the minimum amount of time being spent by taxpayers in providing information. The most efficient systems are those where the VAT refund can be claimed as part of the regular VAT filing with no additional information requirements. Tax authorities are increasingly using technology to match input VAT reclaimed by companies on their purchases with the output VAT collected by suppliers and paid to tax authorities. Such systems have the potential to reduce delays in making refunds and to minimise the need to audit individual refund claims.
For the correction of the CIT error, the best-performing economies are those where the correction of the tax return requires minimal administrative work and where the company would be selected for additional review in less than 25% of cases.
The overall profile of economies ranked by their post-filing score, highlighting some of the characteristics that give rise to the scores, is shown in Figure 11.
The economies shown in yellow are those where review times are taken into account for both VAT and CIT, as these are where in more than 50% of cases a company making a VAT refund request would be selected for additional review, and where in more than 25% of cases, a company with a CIT correction would be subject to additional review. In the top-scoring economies, the case study company would not be selected for additional review, for either VAT or CIT. There are, however, several economies where additional reviews are taken into account in their post-filing processes, but which still have scores above the global average. For example, Belize has an index score of 85.1 while having reviews for both VAT and CIT. Other examples include Poland and Canada, with post-filing scores of 77.4 and 73.2, respectively. This suggests that it is possible for reviews to be carried out efficiently.
The economies shown in orange in Figure 11 are those where a VAT refund is not available for our case study company, and such economies receive a score of zero for the VAT component of the post-filing index. These economies all have an index score below 50.
Figure 11: Post-filing score for all economies
Likelihood of review for VAT >50% and CIT >25% No refund
Note: Bahrain, Kuwait, Marshall Islands, Micronesia, Fed. Sts., Palau, Qatar and United Arab Emirates have no VAT or CIT regime. Each point on the chart represents a different economy.
Source: PwC Paying Taxes 2019 data
100
20
40
Pos
t-fil
ing
ind
ex s
core
60
80
0
Trinidad and Tobago 8.0
United Kingdom 71.0
Canada 73.2
Poland 77.4
Belize 85.1
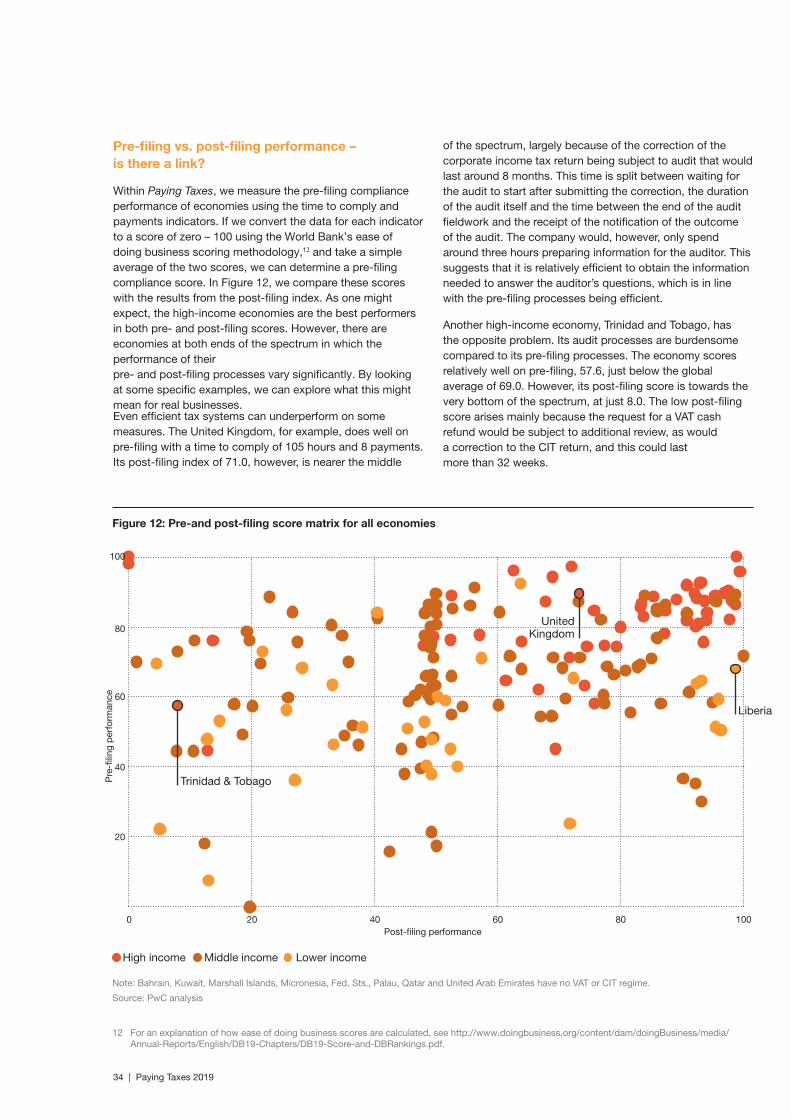
Pre-filing vs. post-filing performance – is there a link?
Within Paying Taxes, we measure the pre-filing compliance performance of economies using the time to comply and payments indicators. If we convert the data for each indicator to a score of zero – 100 using the World Bank’s ease of doing business scoring methodology,12 and take a simple average of the two scores, we can determine a pre-filing compliance score. In Figure 12, we compare these scores with the results from the post-filing index. As one might expect, the high-income economies are the best performers in both pre- and post-filing scores. However, there are economies at both ends of the spectrum in which the performance of their pre- and post-filing processes vary significantly. By looking at some specific examples, we can explore what this might mean for real businesses.Even efficient tax systems can underperform on some measures. The United Kingdom, for example, does well on pre-filing with a time to comply of 105 hours and 8 payments. Its post-filing index of 71.0, however, is nearer the middle
of the spectrum, largely because of the correction of the corporate income tax return being subject to audit that would last around 8 months. This time is split between waiting for the audit to start after submitting the correction, the duration of the audit itself and the time between the end of the audit fieldwork and the receipt of the notification of the outcome of the audit. The company would, however, only spend around three hours preparing information for the auditor. This suggests that it is relatively efficient to obtain the information needed to answer the auditor’s questions, which is in line with the pre-filing processes being efficient.
Another high-income economy, Trinidad and Tobago, has the opposite problem. Its audit processes are burdensome compared to its pre-filing processes. The economy scores relatively well on pre-filing, 57.6, just below the global average of 69.0. However, its post-filing score is towards the very bottom of the spectrum, at just 8.0. The low post-filing score arises mainly because the request for a VAT cash refund would be subject to additional review, as would a correction to the CIT return, and this could last more than 32 weeks.
Annual-Reports/English/DB19-Chapters/DB19-Score-and-DBRankings.pdf.
34 | Paying Taxes 2019
Figure 12: Pre-and post-filing score matrix for all economies
Note: Bahrain, Kuwait, Marshall Islands, Micronesia, Fed. Sts., Palau, Qatar and United Arab Emirates have no VAT or CIT regime.
Source: PwC analysis
12 For an explanation of how ease of doing business scores are calculated, see http://www.doingbusiness.org/content/dam/doingBusiness/media/
• High income Middle income • Lower income
Pre
-filin
g p
erfo
rman
ce
Post-filing performance0
20
40
60
80
100
20 40 60 80 100
Liberia
United Kingdom
Trinidad & Tobago
Paying Taxes 2019 | 35
How do audit issues vary around the world?
Given the relatively straightforward profile of our case study company, it is remarkable how much variation we see in the time required to provide information to tax auditors following a CIT correction. Some of this will be due to differences in the use of technology. It should be quicker to locate and analyse data from an electronic system than from a largely manual system that relies heavily on hard-copy records. There are, however, other factors that can complicate post-filing reviews, including formal audits, such as the clarity of the underlying tax law, the extent to which the tax authority provides guidance on specific issues, the application of materiality thresholds and the approach of individual tax officers.
Although enforcing compliance with tax obligations is a central function of tax administrations, there is much that can be done to reduce the associated burden for both taxpayers and tax officers. Audit and other review processes that are complex, time-consuming and take months or years to conclude can result in significant costs on both sides. Drawing on experiences from PwC offices around the world, we have identified the following factors which can lead to lengthy and burdensome tax audits, and many of these can also increase pre-filing compliance times as taxpayers spend more time on compliance to prevent an audit:
• frequent and/or unexpected law and policy changes
• introduction of retrospective or retroactive legislation bytax authorities
• lack of transparency, impact assessments andconsultation with the stakeholders on policy changes
• enforcement of rules by authorities in ways that exceedlegislative powers
• lack of consistent interpretation of tax rules amongdifferent tax offices or tax officers
• poorly targeted incentives for tax authorities and theirstaffs that lead to costly audits, resulting in little additionalrevenue
• lack of a risk-based approach to selecting companies fortax audit, resulting in an inefficient allocation of taxauthority resources
• inefficient or non-existent domestic dispute resolutionmechanisms, such as appeal courts, special taxchambers/tribunals or tax ombudsmen
• issues of legal interpretation where local variations,potentially arising from translation issues, differ frominternational guidelines
• highly formalistic documentation requirements that requiredata to be provided in specific formats out of proportionwith the underlying transaction.
From the low-income economies, Liberia is among the 10 highest-performing economies in the post-filing index and does well on pre-filing with a score of 68.0. Liberia has no VAT regime, so the post-filing index only measures the CIT components of the economy. In Liberia, it would take our study company only three hours to correct its CIT return, and such a correction is unlikely to be subject to additional review. Liberia is planning to introduce VAT in 2019. This is likely to impact the VAT component of the post-filing index in future editions of Paying Taxes.
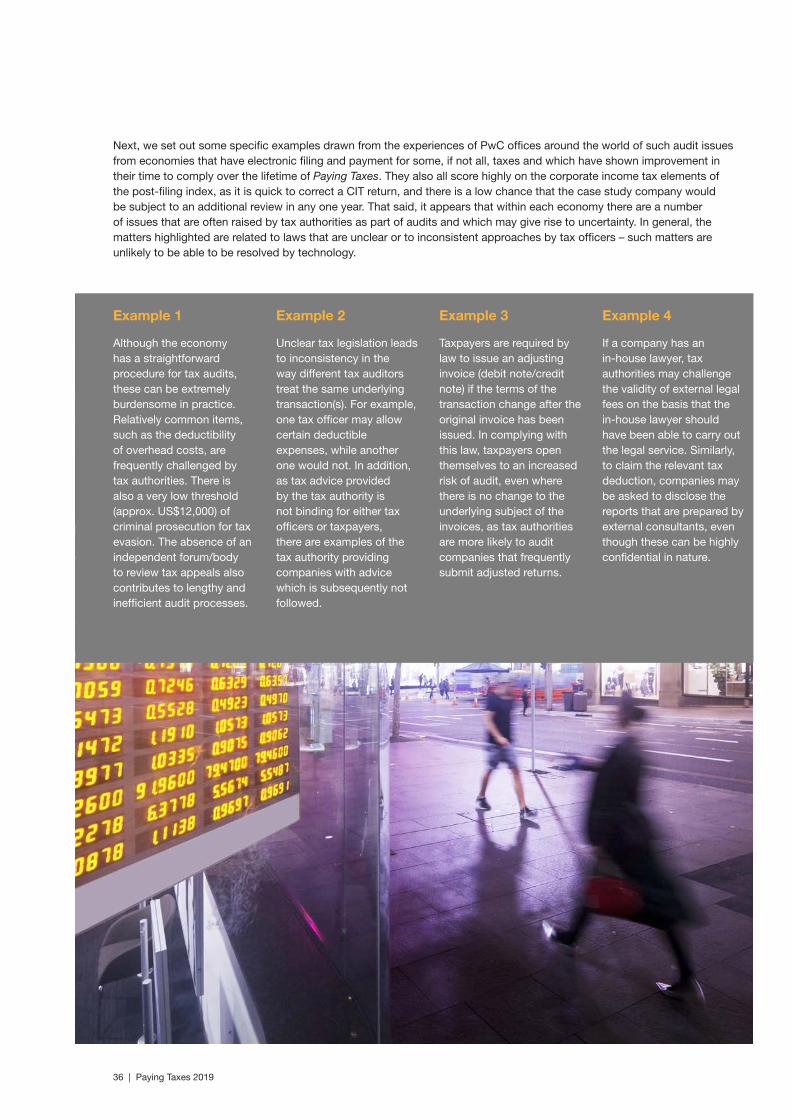
Next, we set out some specific examples drawn from the experiences of PwC offices around the world of such audit issues from economies that have electronic filing and payment for some, if not all, taxes and which have shown improvement in their time to comply over the lifetime of Paying Taxes. They also all score highly on the corporate income tax elements of the post-filing index, as it is quick to correct a CIT return, and there is a low chance that the case study company would be subject to an additional review in any one year. That said, it appears that within each economy there are a number of issues that are often raised by tax authorities as part of audits and which may give rise to uncertainty. In general, the matters highlighted are related to laws that are unclear or to inconsistent approaches by tax officers – such matters are unlikely to be able to be resolved by technology.
Example 1
Although the economy has a straightforward procedure for tax audits, these can be extremely burdensome in practice. Relatively common items, such as the deductibility of overhead costs, are frequently challenged by tax authorities. There is also a very low threshold (approx. US$12,000) of criminal prosecution for tax evasion. The absence of an independent forum/body to review tax appeals also contributes to lengthy and inefficient audit processes.
Example 2
Unclear tax legislation leads to inconsistency in the way different tax auditors treat the same underlying transaction(s). For example, one tax officer may allow certain deductible expenses, while another one would not. In addition, as tax advice provided by the tax authority is not binding for either tax officers or taxpayers, there are examples of the tax authority providing companies with advice which is subsequently not followed.
Example 3
Taxpayers are required by law to issue an adjusting invoice (debit note/credit note) if the terms of the transaction change after the original invoice has been issued. In complying with this law, taxpayers open themselves to an increased risk of audit, even where there is no change to the underlying subject of the invoices, as tax authorities are more likely to audit companies that frequently submit adjusted returns.
Example 4
If a company has an in-house lawyer, tax authorities may challenge the validity of external legal fees on the basis that the in-house lawyer should have been able to carry out the legal service. Similarly, to claim the relevant tax deduction, companies may be asked to disclose the reports that are prepared by external consultants, even though these can be highly confidential in nature.
36 | Paying Taxes 2019

Chapter 4
Paying Taxes 2019 | 37
World Bank Group commentary: lessons learned
Data collected this year as part of Paying Taxes suggests that training initiatives are beneficial to both the tax authorities and the taxpayers. Training for tax officers15 and taxpayer education16 can be provided through a variety of channels: seminars, online learning programmes, call centres and pilot tests can improve voluntary compliance and create a well-informed public.
Training, however, is not systematic for either tax officers or taxpayers. Only 35% of tax authorities in the 157 economies where Doing Business collected data provided regular training to their tax officers. The most common way for taxpayers to receive information from tax authorities is via tax rulings. The second-most popular means is via call centres.
The research covered the frequency and type of training to tax officers and how changes in the tax administration are communicated to tax officers. Data was also collected on taxpayer education, including the ways legal and administrative changes are communicated to the public and the means used by taxpayers to obtain information from tax authorities.
The main role of tax authorities is to ensure compliance with tax laws. How a tax authority interacts with taxpayers and tax officers affects the degree of voluntary compliance and the public perception of the tax authority’s efficiency. Taxpayers who know their rights and receive the necessary information and support to help them meet their tax obligations are more willing to comply voluntarily.13 Skilled, trained and committed tax officers are more likely to act professionally in their interactions with taxpayers.14
13 Kira Reuben, Alex. 2017. “An Evaluation of Governments’ Initiatives in Enhancing Small Taxpayers’ Voluntary Tax Compliance in Developing Countries.” International Journal of Academic Research in Accounting, Finance and Management Sciences 7(1): 253-267.
14 Bird, Richard M. 2004. “Administrative Dimensions of Tax Reform.” Asia–Pacific Tax Bulletin 10 No.3:134–50.
15 Training for tax officials means providing tax officers with the right skills and competencies to perform their jobs properly.
16 Taxpayer education includes training on how to pay taxes and how to understand tax laws through different government programmes to encourage tax-compliant behavior.
38 | Paying Taxes 2019

Note: The sample is 152 economies. In Bahrain, Hong Kong SAR (China), Madagascar, Malta, Romania, Slovenia and Zambia, the research was not able to identify the frequency of training programmes.
Source: Doing Business database
Figure 13: Most economies provide training for tax officers when a legal or administrative change is introduced
n Training provided only when a change is introduced n Only periodic training n Combination of periodic training and training when there is a change n Training provided, but no data on frequency n Training on an ad-hoc basis as necessary
26
8
58%
15%
20%
4% 3%
Paying Taxes 2019 | 39
Why is it relevant to train tax officers?
Tax officers play a key role in facilitating the adoption of a service-oriented attitude towards taxpayers. The systematic training of tax officers is, therefore, vital for a well-functioning tax system and the effective implementation of tax policies.17 Well-trained staff are more efficient and less prone to making errors when assessing tax dealings or assisting taxpayers. Tax officers typically undertake a series of training programmes and examinations to gain the qualifications required to perform their duties. Of the 157 economies included in this research, all but five economies18 offer training to tax officers. Globally, the norm is for tax authorities to offer training to tax officers when a legal or administrative change is introduced. Tax authorities have regular training in only a few cases (see Figure 13).
17 OECD (Organisation for Economic Co-operation and Development). 2017. OECD Tax Administration 2017: Comparative Information on OECD and Other Advanced and Emerging Economies.
18 The economies that do not offer training to tax officials are Guinea-Bissau, Libya, St. Kitts and Nevis, Trinidad and Tobago, and United Arab Emirates.
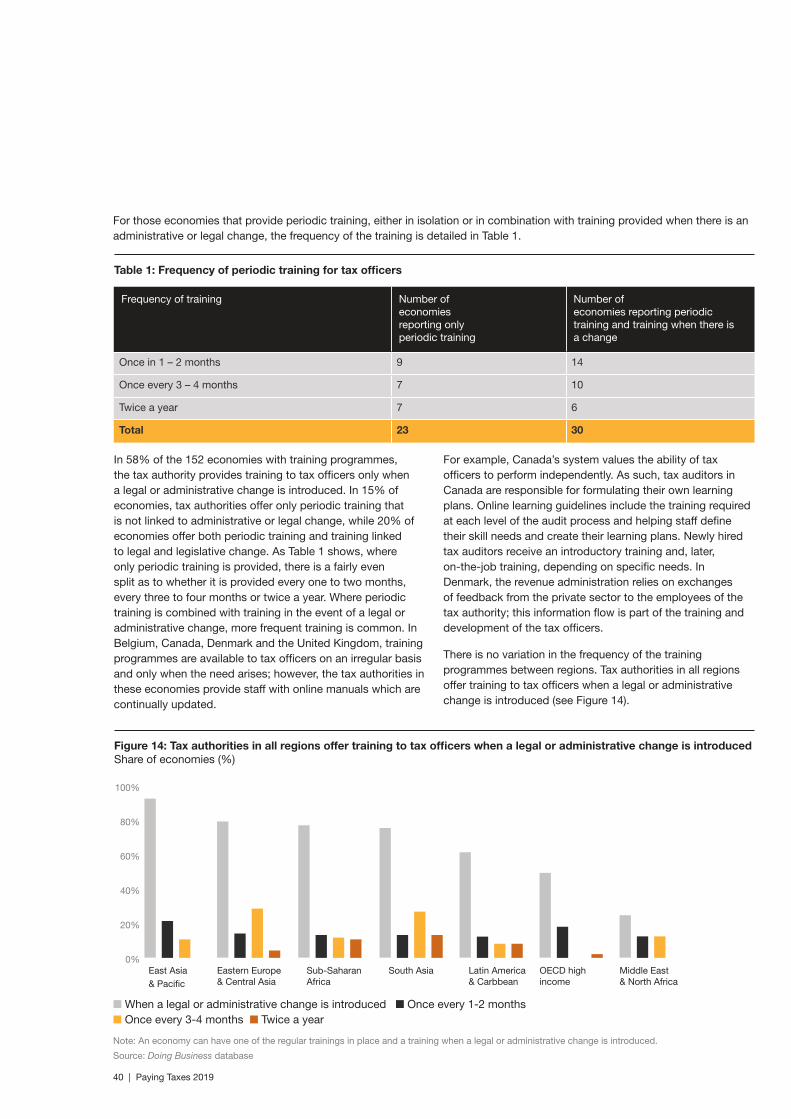
For those economies that provide periodic training, either in isolation or in combination with training provided when there is an administrative or legal change, the frequency of the training is detailed in Table 1.
In 58% of the 152 economies with training programmes, the tax authority provides training to tax officers only when a legal or administrative change is introduced. In 15% of economies, tax authorities offer only periodic training that is not linked to administrative or legal change, while 20% of economies offer both periodic training and training linked to legal and legislative change. As Table 1 shows, where only periodic training is provided, there is a fairly even split as to whether it is provided every one to two months, every three to four months or twice a year. Where periodic training is combined with training in the event of a legal or administrative change, more frequent training is common. In Belgium, Canada, Denmark and the United Kingdom, training programmes are available to tax officers on an irregular basis and only when the need arises; however, the tax authorities in these economies provide staff with online manuals which are continually updated.
For example, Canada’s system values the ability of tax officers to perform independently. As such, tax auditors in Canada are responsible for formulating their own learning plans. Online learning guidelines include the training required at each level of the audit process and helping staff define their skill needs and create their learning plans. Newly hired tax auditors receive an introductory training and, later, on-the-job training, depending on specific needs. In Denmark, the revenue administration relies on exchanges of feedback from the private sector to the employees of the tax authority; this information flow is part of the training and development of the tax officers.
There is no variation in the frequency of the training programmes between regions. Tax authorities in all regions offer training to tax officers when a legal or administrative change is introduced (see Figure 14).
Frequency of training Number of economies reporting only periodic training
Number of economies reporting periodic training and training when there is a change
Once in 1 – 2 months 9 14
Once every 3 – 4 months 7 10
Twice a year 7 6
Total 23 30
Figure 14: Tax authorities in all regions offer training to tax officers when a legal or administrative change is introduced Share of economies (%)
Table 1: Frequency of periodic training for tax officers
Note: An economy can have one of the regular trainings in place and a training when a legal or administrative change is introduced.
Source: Doing Business database
100%
80%
60%
40%
20%
0%
n When a legal or administrative change is introduced n Once every 1-2 months n Once every 3-4 months n Twice a year
East Asia & Pacific
Eastern Europe & Central Asia
Sub-Saharan Africa
South Asia Latin America & Carbbean
OECD high income
Middle East & North Africa
40 | Paying Taxes 2019
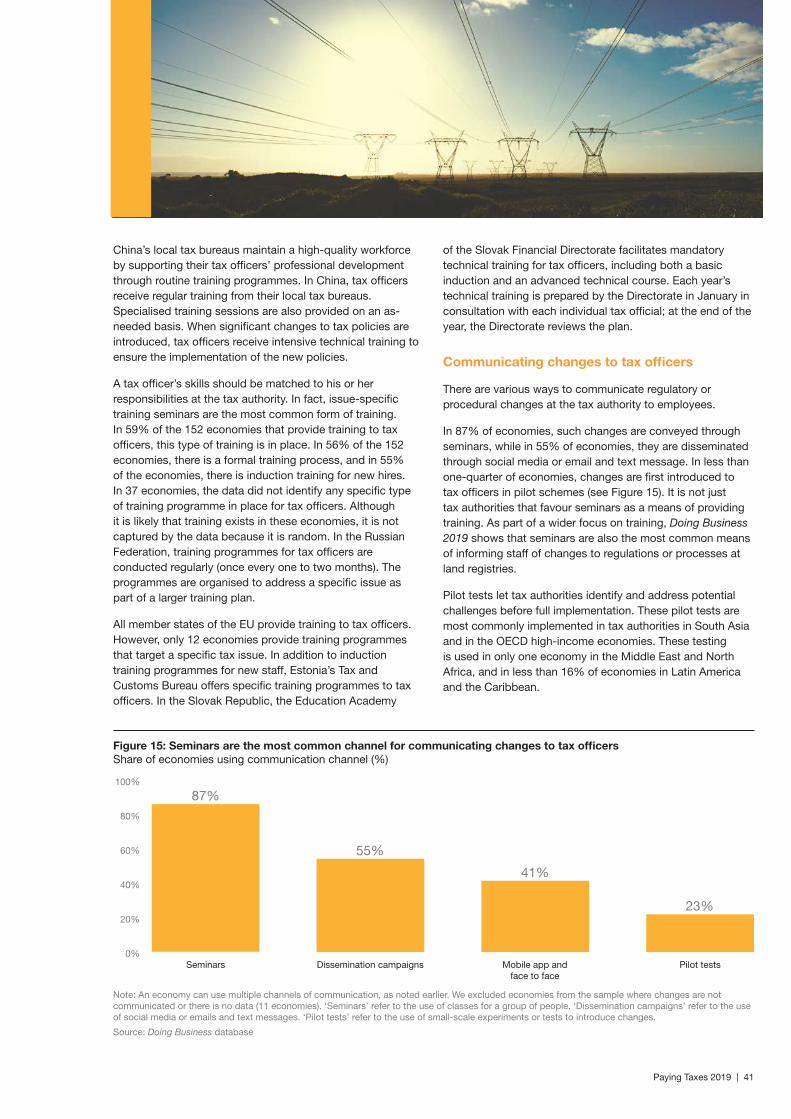
Paying Taxes 2019 | 41
China’s local tax bureaus maintain a high-quality workforce by supporting their tax officers’ professional development through routine training programmes. In China, tax officers receive regular training from their local tax bureaus. Specialised training sessions are also provided on an as-needed basis. When significant changes to tax policies are introduced, tax officers receive intensive technical training to ensure the implementation of the new policies.
A tax officer’s skills should be matched to his or her responsibilities at the tax authority. In fact, issue-specific training seminars are the most common form of training. In 59% of the 152 economies that provide training to tax officers, this type of training is in place. In 56% of the 152 economies, there is a formal training process, and in 55% of the economies, there is induction training for new hires. In 37 economies, the data did not identify any specific type of training programme in place for tax officers. Although it is likely that training exists in these economies, it is not captured by the data because it is random. In the Russian Federation, training programmes for tax officers are conducted regularly (once every one to two months). The programmes are organised to address a specific issue as part of a larger training plan.
All member states of the EU provide training to tax officers. However, only 12 economies provide training programmes that target a specific tax issue. In addition to induction training programmes for new staff, Estonia’s Tax and Customs Bureau offers specific training programmes to tax officers. In the Slovak Republic, the Education Academy
of the Slovak Financial Directorate facilitates mandatory technical training for tax officers, including both a basic induction and an advanced technical course. Each year’s technical training is prepared by the Directorate in January in consultation with each individual tax official; at the end of the year, the Directorate reviews the plan.
Communicating changes to tax officers
There are various ways to communicate regulatory or procedural changes at the tax authority to employees.
In 87% of economies, such changes are conveyed through seminars, while in 55% of economies, they are disseminated through social media or email and text message. In less than one-quarter of economies, changes are first introduced to tax officers in pilot schemes (see Figure 15). It is not just tax authorities that favour seminars as a means of providing training. As part of a wider focus on training, Doing Business 2019 shows that seminars are also the most common means of informing staff of changes to regulations or processes at land registries.
Pilot tests let tax authorities identify and address potential challenges before full implementation. These pilot tests are most commonly implemented in tax authorities in South Asia and in the OECD high-income economies. These testing is used in only one economy in the Middle East and North Africa, and in less than 16% of economies in Latin America and the Caribbean.
Figure 15: Seminars are the most common channel for communicating changes to tax officers Share of economies using communication channel (%)
Note: An economy can use multiple channels of communication, as noted earlier. We excluded economies from the sample where changes are not communicated or there is no data (11 economies). ‘Seminars’ refer to the use of classes for a group of people. ‘Dissemination campaigns’ refer to the use of social media or emails and text messages. ‘Pilot tests’ refer to the use of small-scale experiments or tests to introduce changes.
Source: Doing Business database
100%
87%
55%
41%
23%
80%
60%
40%
20%
0%Seminars Dissemination campaigns Mobile app and
face to facePilot tests
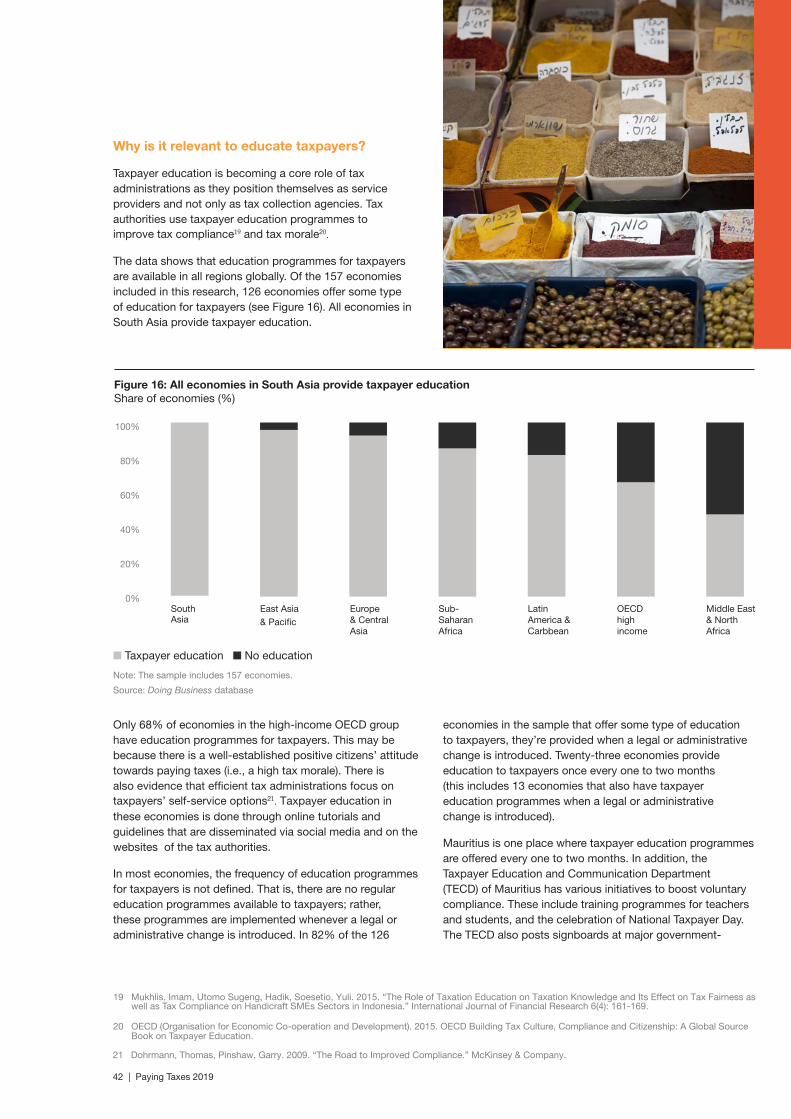
Why is it relevant to educate taxpayers?
Taxpayer education is becoming a core role of tax administrations as they position themselves as service providers and not only as tax collection agencies. Tax authorities use taxpayer education programmes to improve tax compliance19 and tax morale20.
The data shows that education programmes for taxpayers are available in all regions globally. Of the 157 economies included in this research, 126 economies offer some type of education for taxpayers (see Figure 16). All economies in South Asia provide taxpayer education.
Only 68% of economies in the high-income OECD group have education programmes for taxpayers. This may be because there is a well-established positive citizens’ attitude towards paying taxes (i.e., a high tax morale). There is also evidence that efficient tax administrations focus on taxpayers’ self-service options21. Taxpayer education in these economies is done through online tutorials and guidelines that are disseminated via social media and on the websites of the tax authorities.
In most economies, the frequency of education programmes for taxpayers is not defined. That is, there are no regular education programmes available to taxpayers; rather, these programmes are implemented whenever a legal or administrative change is introduced. In 82% of the 126
economies in the sample that offer some type of education to taxpayers, they’re provided when a legal or administrative change is introduced. Twenty-three economies provide education to taxpayers once every one to two months (this includes 13 economies that also have taxpayer education programmes when a legal or administrative change is introduced).
Mauritius is one place where taxpayer education programmes are offered every one to two months. In addition, the Taxpayer Education and Communication Department (TECD) of Mauritius has various initiatives to boost voluntary compliance. These include training programmes for teachers and students, and the celebration of National Taxpayer Day. The TECD also posts signboards at major government-
Figure 16: All economies in South Asia provide taxpayer education Share of economies (%)
Note: The sample includes 157 economies.
Source: Doing Business database
100%
80%
60%
40%
20%
0%
n Taxpayer education n No education
South Asia
East Asia & Pacific
Europe & Central Asia
Sub- Saharan Africa
Latin America & Carbbean
OECD high income
Middle East & North Africa
19 Mukhlis, Imam, Utomo Sugeng, Hadik, Soesetio, Yuli. 2015. “The Role of Taxation Education on Taxation Knowledge and Its Effect on Tax Fairness as well as Tax Compliance on Handicraft SMEs Sectors in Indonesia.” International Journal of Financial Research 6(4): 161-169.
20 OECD (Organisation for Economic Co-operation and Development). 2015. OECD Building Tax Culture, Compliance and Citizenship: A Global Source Book on Taxpayer Education.
21 Dohrmann, Thomas, Pinshaw, Garry. 2009. “The Road to Improved Compliance.” McKinsey & Company.
42 | Paying Taxes 2019
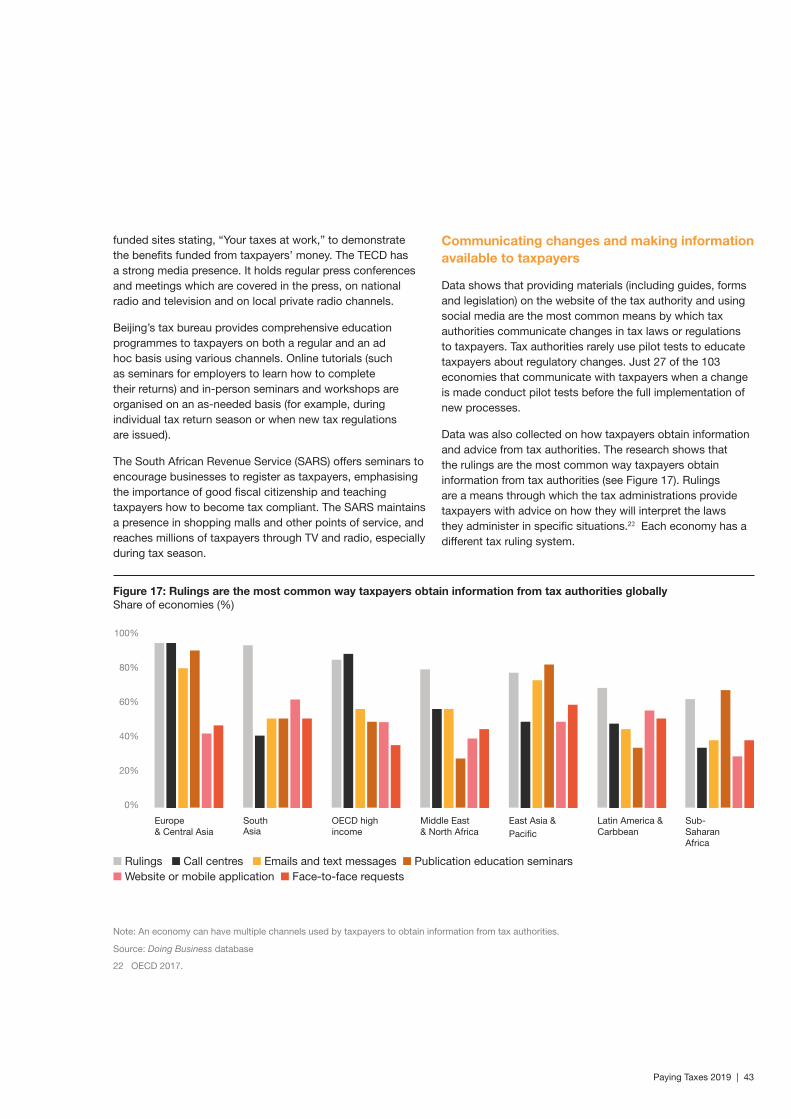
Paying Taxes 2019 | 43
funded sites stating, “Your taxes at work,” to demonstrate the benefits funded from taxpayers’ money. The TECD has a strong media presence. It holds regular press conferences and meetings which are covered in the press, on national radio and television and on local private radio channels.
Beijing’s tax bureau provides comprehensive education programmes to taxpayers on both a regular and an ad hoc basis using various channels. Online tutorials (such as seminars for employers to learn how to complete their returns) and in-person seminars and workshops are organised on an as-needed basis (for example, during individual tax return season or when new tax regulations are issued).
The South African Revenue Service (SARS) offers seminars to encourage businesses to register as taxpayers, emphasising the importance of good fiscal citizenship and teaching taxpayers how to become tax compliant. The SARS maintains a presence in shopping malls and other points of service, and reaches millions of taxpayers through TV and radio, especially during tax season.
Communicating changes and making information available to taxpayers
Data shows that providing materials (including guides, forms and legislation) on the website of the tax authority and using social media are the most common means by which tax authorities communicate changes in tax laws or regulations to taxpayers. Tax authorities rarely use pilot tests to educate taxpayers about regulatory changes. Just 27 of the 103 economies that communicate with taxpayers when a change is made conduct pilot tests before the full implementation of new processes.
Data was also collected on how taxpayers obtain information and advice from tax authorities. The research shows that the rulings are the most common way taxpayers obtain information from tax authorities (see Figure 17). Rulings are a means through which the tax administrations provide taxpayers with advice on how they will interpret the laws they administer in specific situations.22 Each economy has a different tax ruling system.
Figure 17: Rulings are the most common way taxpayers obtain information from tax authorities globally Share of economies (%)
100%
80%
60%
40%
20%
0%
Europe & Central Asia
South Asia
OECD high income
Middle East & North Africa
East Asia & Pacific
Latin America & Carbbean
Sub- Saharan Africa
n Rulings n Call centres n Emails and text messages n Publication education seminars n Website or mobile application n Face-to-face requests
Note: An economy can have multiple channels used by taxpayers to obtain information from tax authorities.
Source: Doing Business database
22 OECD 2017.
23 McKinsey 2009.
24 OECD 2017.
44 | Paying Taxes 2019
Call centres are another popular means of obtaining information from the tax authority. About 80% of economies in Europe and Central Asia and the OECD high-income group use call centres to disseminate tax information. In the United States, nearly every tax issue can now be resolved online or by phone. Taxpayers have a telephone conversation with an agent first; in most cases, the taxpayer can then resolve his or her own issue using a self-service option. This has helped the US tax administration to reduce substantially its service costs, waiting times and time to resolve issues, and has resulted in a significant improvement in taxpayer satisfaction23.
Mobile applications are a relatively new system used by tax authorities to offer some services. The applications allow taxpayers to file, pay and enquire ‘on-the-go’24. The Peruvian Tax Administration, for example, launched its mobile application in 2015. Taxpayers can access a virtual tax guide 24/7, as well as other services, such as invoice issuing and database queries.
Brazil’s tax authority uses mainly in-person communication with taxpayers with the goal of strengthening the relationship between the tax administration and the taxpayer. The idea behind it is to strengthen the relationship between the tax administration and the taxpayer, and to disseminate knowledge on tax regulations to increase voluntary compliance and social acceptance of taxes. Brazil’s long-term taxpayer education plan is supported by university-based centres for accounting and tax support. Brazil also offers a long list of services, guides, forms and information on the revenue administration’s website, as well as through mobile applications.
Training is essential to ensure public trust in the tax authority. Data collected for Doing Business 2019 suggests that training and taxpayer education initiatives benefit both tax authorities and taxpayers. Access to such training and education can be provided through a variety of channels. Seminars, online learning programmes, call centres and pilot tests can improve voluntary compliance and create a well-informed public.

Paying Taxes 2019 | 45
For the purposes of geographic comparisons, the economies are split into regions as follows:
Africa
Algeria; Angola; Benin; Botswana; Burkina Faso; Burundi; Cabo Verde; Cameroon; Central African Republic; Chad; Comoros; Congo, Dem. Rep.; Congo, Rep.; Côte d’Ivoire; Djibouti; Egypt, Arab Rep.; Equatorial Guinea; Eritrea; Eswatini; Ethiopia; Gabon; Gambia, The; Ghana; Guinea; Guinea-Bissau; Kenya; Lesotho; Liberia; Libya; Madagascar; Malawi; Mali; Mauritania; Mauritius; Morocco; Mozambique; Namibia; Niger; Nigeria; Rwanda; São Tomé and Príncipe; Senegal; Seychelles; Sierra Leone; South Africa; South Sudan; Sudan; Tanzania; Togo; Tunisia; Uganda; Zambia; Zimbabwe.
Asia Pacific
Afghanistan; Australia; Bangladesh; Bhutan; Brunei Darussalam; Cambodia; China; Fiji; Hong Kong SAR, China; India; Indonesia; Japan; Kiribati; Korea, Rep.; Lao PDR; Malaysia; Maldives; Marshall Islands; Micronesia, Fed. Sts.; Mongolia; Myanmar; Nepal; New Zealand; Pakistan; Palau; Papua New Guinea; Philippines; Samoa; Singapore; Solomon Islands; Sri Lanka; Taiwan, China; Thailand; Timor-Leste; Tonga; Vanuatu; Vietnam.
Central America & the Caribbean
Antigua and Barbuda; Bahamas, The; Barbados; Belize; Costa Rica; Dominica; Dominican Republic; El Salvador; Grenada; Guatemala; Haiti; Honduras; Jamaica; Nicaragua; Panama; Puerto Rico; St. Kitts and Nevis; St. Lucia; St. Vincent and the Grenadines; Trinidad and Tobago.
Central Asia & Eastern Europe
Albania; Armenia; Azerbaijan; Belarus; Bosnia and Herzegovina; Georgia; Israel; Kazakhstan; Kosovo; Kyrgyz Republic; Macedonia, FYR; Moldova; Montenegro; Russian Federation; Serbia; Tajikistan; Turkey; Ukraine; Uzbekistan.
EU & EFTA
Austria; Belgium; Bulgaria; Croatia; Cyprus; Czech Republic; Denmark; Estonia; Finland; France; Germany; Greece; Hungary; Iceland; Ireland; Italy; Latvia; Lithuania; Luxembourg; Malta; Netherlands; Norway; Poland; Portugal; Romania; San Marino; Slovak Republic; Slovenia; Spain; Sweden; Switzerland; United Kingdom.
Middle East
Bahrain; Iran, Islamic Rep.; Iraq; Jordan; Kuwait; Lebanon; Oman; Qatar; Saudi Arabia; Syrian Arab Republic; United Arab Emirates; West Bank and Gaza; Yemen, Rep.
North America
Canada; Mexico; United States.
South America
Argentina; Bolivia; Brazil; Chile; Colombia; Ecuador; Guyana; Paraguay; Peru; Suriname; Uruguay; Venezuela, R.B.
Appendix
46 | Paying Taxes 2019
The Total Tax & Contribution Rate included in the survey by the World Bank Group has been calculated using the broad principles of the PwC methodology. The application of these principles by the World Bank Group has not been verified, validated or audited by PwC and, therefore, PwC cannot make any representations or warranties with regard to the accuracy of the information generated by the World Bank Group’s models. In addition, the World Bank Group has not verified, validated or audited any information collected by PwC beyond the scope of Doing Business Paying Taxes data and, therefore, the World Bank Group cannot make any representations or warranties with regard to the accuracy of the information generated by PwC’s own research.
The World Bank Group’s Doing Business Paying Taxes ranking indicator includes three components in addition to the Total Tax & Contribution Rate. These estimate compliance costs by looking at hours spent each year on tax work, the number of tax payments made in a tax year, and evaluate and score certain post-filing compliance processes. These calculations do not follow any PwC methodology but do attempt to provide data which is consistent with the tax compliance cost aspect of the PwC Total Tax Contribution framework.
At PwC, our purpose is to build trust in society and solve important problems. We’re a network of firms in 158 countries with over 250,000 people who are committed to delivering quality in assurance, advisory and tax services. Find out more and tell us what matters to you by visiting us at www.pwc.com.
This content is for general information purposes only, and should not be used as a substitute for consultation with professional advisors. No representation or warranty (express or implied) is given as to the accuracy or completeness of the information contained in this publication, and, to the extent permitted by law, neither PwC nor the World Bank Group accept or assume any liability, responsibility or duty of care for any consequences of anyone acting, or refraining to act, in reliance on the information contained in this publication or for any decision based on it. The World Bank Group does not guarantee the accuracy of the data included in this work. The boundaries, colours, denominations, and other information shown on any map in this work do not imply any judgment on the part of the World Bank Group concerning the legal status of any territory or the endorsement or acceptance of such boundaries. The findings, interpretations, and conclusions expressed herein are those of the author(s) and do not necessarily reflect the views of the World Bank Group and its Boards of Executive Directors or the governments they represent.
This publication may be copied and disseminated in its entirety, retaining all featured logos, names, copyright notice and disclaimers. Extracts from this publication may be copied and disseminated, including publication in other documentation, provided always that the said extracts are duly referenced, that the extract is clearly identified as such and that a source notice is used as follows: for extracts from any section of this publication except Chapter 4 – World Bank Group commentary, use the source notice:
“© 2018 PwC. All rights reserved. PwC refers to the PwC network and/or one or more of its member firms, each of which is a separate legal entity. Please see www.pwc.com/structure for further details. Extract from ‘Paying Taxes 2019’ publication, available on www.pwc.com/payingtaxes”. For extracts from Chapter 4 – World Bank Group commentary, use the source notice: “© 2018 The World Bank and International Finance Corporation. All rights reserved.
All other queries on rights and licenses should be addressed to World Bank Publications, The World Bank, 1818 H Street NW, Washington, DC 20433, USA; fax: +1 202-522-2625; e-mail: [email protected].
© 2018 PwC, the World Bank and International Finance Corporation. All rights reserved.
PwC refers to the PwC network and/or one or more of its member firms, each of which is a separate legal entity. Please see www.pwc.com/structure for further details. The World Bank refers to the legally separate but affiliated international organizations: International Bankfor Reconstruction and Development and International Development Association.
Paying Taxes 2019 | 47
World Bank Group Paying Taxes team:
Rita Ramalho, Santiago Croci, Joanna Nasr, Parvina Rakhimova, Margherita Mellone, Muqiao Zhang and Tamar Matiashvili
PwC Paying Taxes team:
Tom Dane, Neville Howlett, Duygu Turkoglu, Shendrit Sadiku