Embed Size (px)
DESCRIPTION
Pay-For-performance's
Citation preview

UNIVERSITY OF CALIFORNIA
Los Angeles
Pay-for-Performance’s Impact
on Overall Quality o f Care
for Acute Myocardial Infarction Patients
A dissertation submitted in partial satisfaction of the
requirements for the degree Doctor o f Philosophy
in Health Services
by
Mikele Mariah Bunce
2007
Reproduced with permission of the copyright owner. Further reproduction prohibited without permission.

UMI Number: 3272270
INFORMATION TO USERS
The quality of this reproduction is dependent upon the quality of the copy
submitted. Broken or indistinct print, colored or poor quality illustrations and
photographs, print bleed-through, substandard margins, and improper
alignment can adversely affect reproduction.
In the unlikely event that the author did not send a complete manuscript
and there are missing pages, these will be noted. Also, if unauthorized
copyright material had to be removed, a note will indicate the deletion.
®
UMIUMI Microform 3272270
Copyright 2007 by ProQuest Information and Learning Company.
All rights reserved. This microform edition is protected against
unauthorized copying under Title 17, United States Code.
ProQuest Information and Learning Company 300 North Zeeb Road
P.O. Box 1346 Ann Arbor, Ml 48106-1346
Reproduced with permission of the copyright owner. Further reproduction prohibited without permission.

The dissertation of Mikele Mariah Bunce is approved.
Charles Corbett
Paul Torrens• ' ...
Robert Kaplan, Committee Chair
University o f California, Los Angeles
2007
ii
Reproduced with permission of the copyright owner. Further reproduction prohibited without permission.

DEDICATION
To Donald Randy Bunce and Diana Carter Bunce
for inspiring me to go after my dreams and for believing that I could achieve them
and to Cameron Carter Bunce for his love and support.
iii
Reproduced with permission of the copyright owner. Further reproduction prohibited without permission.
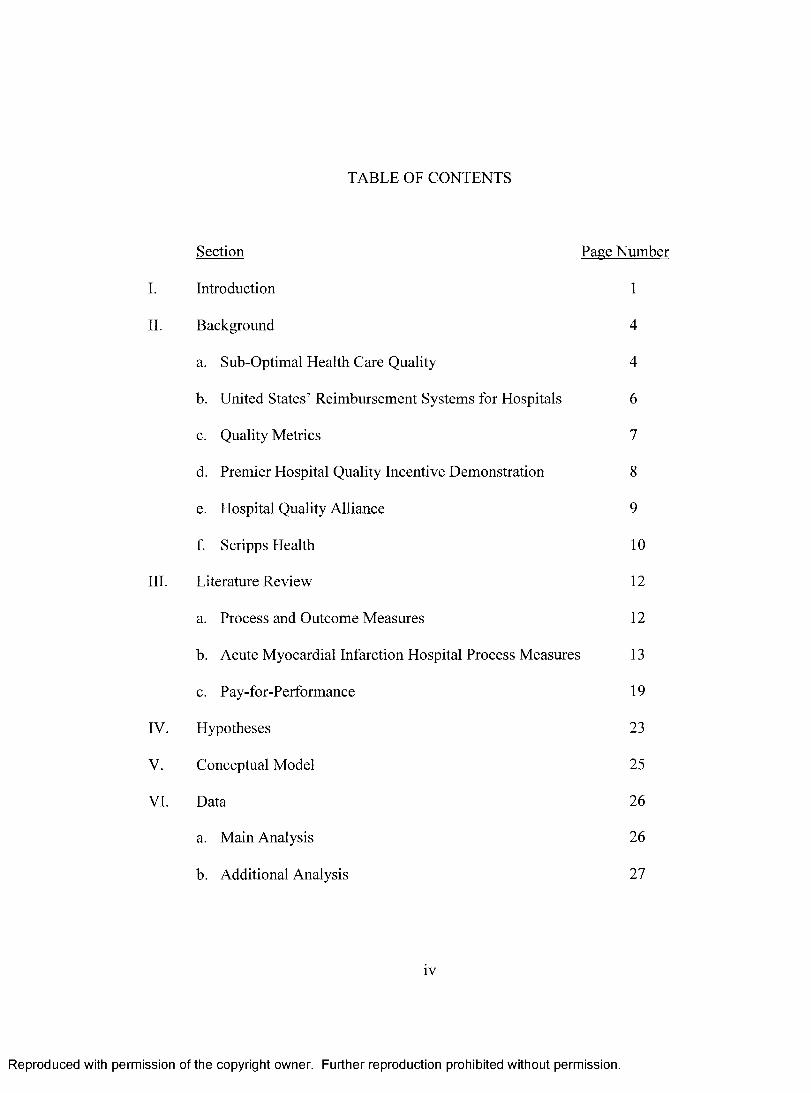
TABLE OF CONTENTS
Section Page Number
I. Introduction 1
II. Background 4
a. Sub-Optimal Elealth Care Quality 4
b. United States’ Reimbursement Systems for Hospitals 6
c. Quality Metrics 7
d. Premier Hospital Quality Incentive Demonstration 8
e. Hospital Quality Alliance 9
f. Scripps Health 10
III. Literature Review 12
a. Process and Outcome Measures 12
b. Acute Myocardial Infarction Hospital Process Measures 13
c. Pay-for-Performance 19
IV. Hypotheses 23
V. Conceptual Model 25
VI. Data 26
a. Main Analysis 26
b. Additional Analysis 27
iv
Reproduced with permission of the copyright owner. Further reproduction prohibited without permission.

VII. Data Sources 29
VIII. Data Elements 31
a. Dependent Variables 36
b. Predictor Variables 36
i. Pay-for-Performance Scores 37
ii. Patient Demographics 39
iii. Hospital Characteristics 39
iv. Patient’s Medical Condition 40
v. Treatment 40
vi. Patient’s Behavior 41
IX. Study Design 42
X. Statistical Methods 45
a. Study Aim 1 45
b. Study Aim 2 47
XI. Results 50
a. Patient Characteristics 50
b. Pay-for-Performance Process Measure Analysis 59
i. Scripps Performance Results 59
ii. Premier, Inc. and Scripps Health Performance 66
c. Process Outcomes Link Analysis 70
i. Survival Analysis Mortality Results 70
ii. Survival Analysis Times Series Mortality 72Results
v
Reproduced with permission of the copyright owner. Further reproduction prohibited without permission.

iii. Logistic Regression Mortality Results 75
iv. Logistic Regression Times Series Mortality 75Results
v. Logistic Regression Morbidity Results 77
vi. Logistic Regression Times Series Morbidity 77Results
d. Covariates’ Impact on Outcomes Analysis 78
i. Test for Proportional Hazards 78
ii. Covariate Survival Analysis Results 79
e. Pay-for-Performance Outcomes Analysis 82
i. Mortality Pre and Post Intervention Results 82
ii. Morbidity Pre and Post Intervention Results 85
XII. Discussion 86
a. Pay-for-Performance’s Impact on Process Measures 86
b. Process-Outcomes Link 94
c. Covariates’ Impact on Outcomes 97
d. Pay-for-Performance’s Impact on Outcomes 102
e. Summary 104
XIII. Limitations 106
XIV. Attachments 114
a. Premier Hospital Quality Incentive Demonstration 114
b. Hospital Quality Initiative 116
c. Conceptual Model 121
vi
Reproduced with permission of the copyright owner. Further reproduction prohibited without permission.
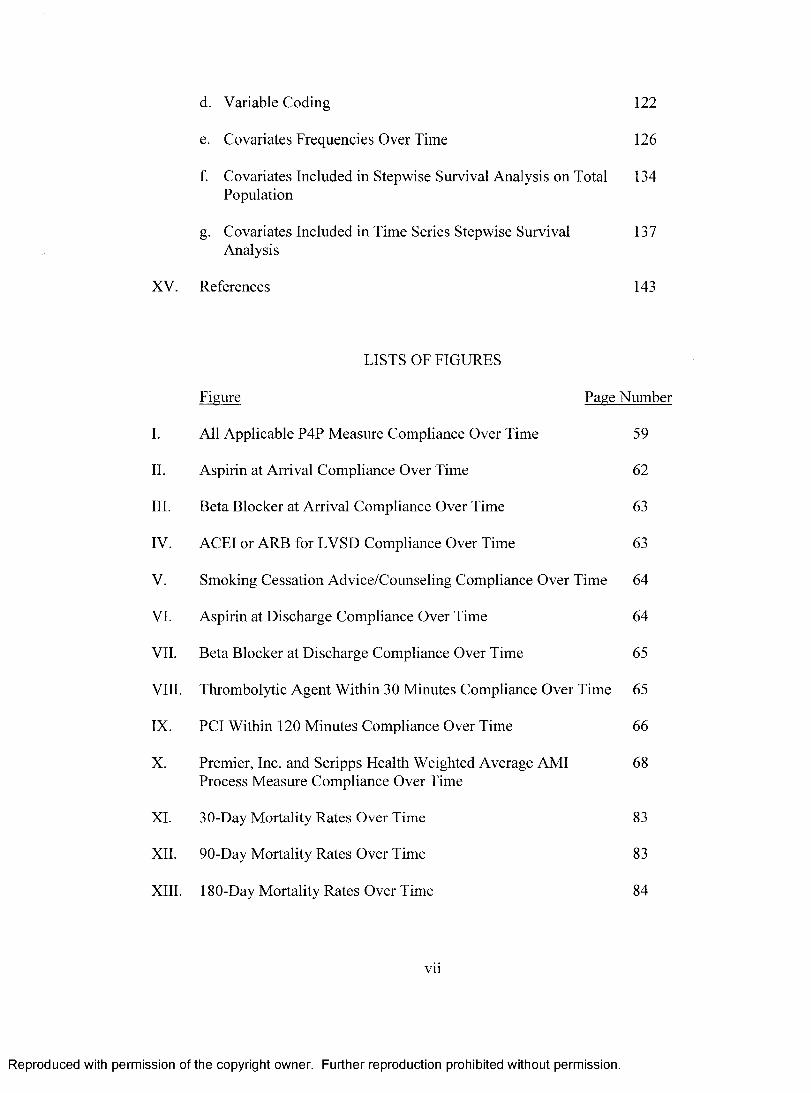
d. Variable Coding 122
e. Covariates Frequencies Over Time 126
f. Covariates Included in Stepwise Survival Analysis on Total 134 Population
g. Covariates Included in Time Series Stepwise Survival 137 Analysis
XV. References 143
LISTS OF FIGURES
Figure Page Number
I. All Applicable P4P Measure Compliance Over Time 59
II. Aspirin at Arrival Compliance Over Time 62
III. Beta Blocker at Arrival Compliance Over Time 63
IV. ACEI or ARB for LVSD Compliance Over Time 63
V. Smoking Cessation Advice/Counseling Compliance Over Time 64
VI. Aspirin at Discharge Compliance Over Time 64
VII. Beta Blocker at Discharge Compliance Over Time 65
VIII. Thrombolytic Agent Within 30 Minutes Compliance Over Time 65
IX. PCI Within 120 Minutes Compliance Over Time 66
X. Premier, Inc. and Scripps Health Weighted Average AMI 68Process Measure Compliance Over Time
XI. 30-Day Mortality Rates Over Time 83
XII. 90-Day Mortality Rates Over Time 83
XIII. 180-Day Mortality Rates Over Time 84
vii
Reproduced with permission of the copyright owner. Further reproduction prohibited without permission.

XIV. 30-Day Readmission Rates Over Time 86
LISTS OF TABLES
Table Page Number
I. Variable Sources 29
II. Conceptual Domains, Theoretical Variables, Empirical 31Variables, and Prediction on Outcomes
III. Variable Frequencies for Non-Continuous Variables for 52Total Patient Population
IV. Variable Means for Continuous Variables for Total Patient 56Population
V. Means of Age and Hospital Characteristics at Each 58Observation Time Period
VI. Logistic Regression Results of Scripps Process Measure Scores 60Before and After HQA
VII. Premier, Inc., Scripps Health, and Other National HQA 68Participants’ Process Measure Scores
VIII. Differences in Performance Measure Scores Between Scripps 69Health, Premier, Inc., and Other National HQA ParticipantsBefore and After P4P and P4R
IX. Scripps Health and Premier, Inc. Performance Before and After 69P4P
X. Scripps Health and Premier, Inc. Performance Before and After 70P4R
XI. Survival Analysis Results for Regressors o f Interest in Total 70Population
XII. All Applicable and Recommended P4P Variable Survival 71Analysis Results
viii
Reproduced with permission of the copyright owner. Further reproduction prohibited without permission.

XIII. Time Series Survival Analysis Results for Regressors o f Interest 73
XIV. Alive/Dead at 30 Days Outcome Results for Regressors of 75Interest in Total Population
XV. Alive/Dead at 30 Days Time Series Outcome Results for 76Statistically Significant Regressors o f Interest in Total Population
XVI. Readmission in 30 Days Outcome Results for Regressors o f 77Interest in Total Population
XVII. Readmission in 30 Days Outcome Results for Statistically 78Significant Regressors o f Interest in Total Population
XVIII. Test for Proportional Hazards Results 79
XIX. Covariate Hazard Functions 81
XX. Logistic Regression Results o f 30-Day Mortality Before and 84After HQA
XXI. Logistic Regression Results of 90-Day Mortality Before and 84After HQA
XXII. Logistic Regression Results of 180-Day Mortality Before and 85After HQA
ix
Reproduced with permission of the copyright owner. Further reproduction prohibited without permission.

ACKNOWLEDGEMENTS
I would like to take this opportunity to thank and acknowledge a number o f people who
helped make this research come to fruition. First and foremost, I would like to thank
my dissertation committee: Dr. Robert Kaplan, Dr. Jack Needleman, Dr. Paul Torrens,
and Dr. Charles Corbett for their guidance, patience, and motivation. I would also like
to extend thanks to Dr. Ninez Ponce and Dr. Tom Rice at the UCLA School o f Public
Health.
Scripps Health has been extremely supportive o f my research endeavors. I could not
have completed this dissertation without the encouragement and aide o f Dr. Brent
Eastman, Barbara Price, Chris Van Gorder, and Mindi Matson. The cardiologists in the
Scripps Health system were invaluable in helping create the conceptual model for this
research and in providing clinical expertise, in particular, Dr. Paul Teirstein, Dr. Eric
Topol and Dr. Paul Phillips.
My friends and family have been by my side throughout the whole process. I want to
express my thanks to them for making this journey easier along the way.
x
Reproduced with permission of the copyright owner. Further reproduction prohibited without permission.

VITA
August 9, 1977
1999
1999
1999- 2001
2002 - 2005
2003
2005 - present
Bom, Stanford, California
B.A., Human Biology Stanford University Stanford, California
Quality Data Coordinator Palo Alto Medical Foundation Palo Alto, California
Cancer Center Consultant; JCAHO/PI Analyst UCSF Medical Center San Francisco, California
Consultant; Senior Consultant Sinaiko Healthcare Consulting Los Angeles, California
M.P.H., Health Services University o f California, Los Angeles Los Angeles, California
Director, Quality Scripps Health San Diego, California
PUBLICATIONS AND PRESENTATIONS
Bunce, Mikele. “Clinical Guidelines: Increased Quality of Care at the Expense of Clinical Autonomy?” Journal o f Health Care Compliance. 2005; 7(3):50-52.
Bunce, Mikele M. “Innovative Approaches Help Improve the Managed Care Trifecta.” Managed Healthcare Executive. 2005; 15(6):42-44.
Bunce, Mikele and Richard Sinaiko. “HIPAA: The Next Phase. Myths and Realities of the Electronic Transaction and Code Set Standards.” Physicians Practice. 2003; 13(8):67-70.
xi
Reproduced with permission of the copyright owner. Further reproduction prohibited without permission.

Sinaiko, Richard E, Mikele M Bunce, Neal Eigler, Saibal Kar, Sepideh S Farivar, Emma C Wollschlager. “Drug-Eluting Stent Use May Negatively Impact the Economic Helath of a Hospital: A Single-Center Case Study.” Supplement to Journal o f American College o f Cardiology - Abstracts o f Original Contributions. 2004; 43(5):402A-403A.
Toloui, Omid B and Mikele M Bunce. “Are Individual or Group Incentives Best?” Cardiology Practice Options. Oct 2005; 6-7.
xii
Reproduced with permission of the copyright owner. Further reproduction prohibited without permission.

ABSTRACT OF THE DISSERTATION
Pay-for-Performance’s Impact
on Overall Quality of Care
for Acute Myocardial Infarction Patients
by
Mikele Mariah Bunce
Doctor of Philosophy in Health Services
University o f California, Los Angeles, 2007
Professor Robert Kaplan, Chair
Background: Pay-for-performance (P4P) is a methodology where financial incentives
are given to healthcare providers for the provision of high quality patient care.
However, there is limited research on whether P4P programs improve patient
outcomes. Methods: Compliance with eight acute myocardial infarction (AMI) metrics
used in the Hospital Quality Alliance (HQA) precursor to the Centers for Medicare &
Medicaid Services (CMS) Values Based Purchasing (i.e., P4P) plan as well as patient
mortality were analyzed using patient level data for 3,954 patients discharged from
Scripps Health hospitals from 2003 to 2005. Three observational time periods of six
months of data before participation in the HQA were compared to three observational
xiii
Reproduced with permission of the copyright owner. Further reproduction prohibited without permission.

time periods of six months of data after participation in the HQA within a time series
study design. Multivariate survival analyses and logistic regressions were performed to
determine whether an improvement in process measure compliance and/or patient
mortality could be attributed to participation in the HQA. Results: Compliance with
providing all applicable P4P measures improved from 60-72% before HQA to 75-86%
after HQA. Similarly, 30-day mortality improved from 11-13% before HQA to 8-9%
after HQA. Regression discontinuity analyses with time series process measure and
outcome data identified that neither the slope nor the intercept of performance after
participation in the HQA was statistically significantly different than before
participation in the HQA using a p-value o f 0.05. Conclusion: For a hospital system
already improving compliance with AMI process measures and patient outcomes,
participation in the HQA did not change that pattern of improvement. One cannot
conclude that the HQA was the catalyst for improvement. However, mortality did
improve after participation in the HQA, indicating that any potential unintended
consequences o f participation in the HQA did not have a significant negative impact on
outcomes. Further research is required to determine whether other changes (e.g.,
increased staffing ratios, treatment modality used) could be attributed to the change in
performance metric compliance and the change in outcomes. Further research is also
recommended to determine whether the HQA had early or lagged effects on process
measures and outcomes not identified in this study.
xiv
Reproduced with permission of the copyright owner. Further reproduction prohibited without permission.

In t r o d u c t io n
According to the Institute of Medicine’s report Crossing the Quality Chasm: A
New Health System for the 21st Century, “health care today harms too frequently and
fails to deliver its potential benefits” therefore “the American health care delivery
system is in need o f fundamental change.”1 Although healthcare professionals aim to
provide high quality patient care, recent reports on the staggering number o f medical
errors and the failure to deliver the best available care confirm that not only is high
quality care not always received, but poor quality care has resulted in unnecessary
deaths.2,3
The healthcare industry is no different than other industries in that it is driven
by money. In order to survive, provider organizations must be mindful of
reimbursement. However, the dominant healthcare payment systems in the United
States (US) do not reward quality care and can often provide incentives against
providing high quality care.4
Pay-for-performance (P4P) systems were developed as a mechanism to align
financial incentives for providing high quality care. The American Medical
Association (AMA) defines pay for performance as “a method of linking pay to a
measure o f individual, group, or organizational performance, based on an appraisal
system. These types of bonus incentive schemes are based on the idea that work
output, determined by some kind of measuring system, varies according to effort and
that the prospect of increased pay will motivate improved performance.”5
1
Reproduced with permission of the copyright owner. Further reproduction prohibited without permission.

There are three methodologies for P4P programs: competitive bonus payment;
payment at risk; and quality tiered networks. Competitive bonus payments are
awarded to top performers in a group of providers and bottom performers may or may
not receive less compensation. In payment at risk models, a percentage o f revenue is
withheld by the payor until a review of quality scores is conducted. Providers who do
not meet quality targets lose the percentage at risk. In quality-tiered networks,
consumers are incented to select high quality providers by offering discounted co
payments. Consumers who prefer lower scoring hospitals on quality measures must
pay higher co-payments.6 Reimbursement is allocated based upon providers’ scores on
specific quality metrics as identified by the particular P4P program.
There are a few dominant P4P programs in the US for hospitals. The Premier
Hospital Quality Incentive Demonstration is a true P4P program, where top tiered
providers are paid higher reimbursement rates and bottom tiered providers are paid
lower reimbursement rates. However, the Premier Hospital Quality Incentive
Demonstration is limited to Premier, Inc. hospitals.
Another program geared towards hospitals is the Centers for Medicare &
Medicaid Services (CMS) Hospital Quality Alliance program. Section 501(b) of the
Medicare Prescription Drug, Improvement, and Modernization Act of 2003 (MMA)
established a financial incentive for hospitals to report on the quality of inpatient care
they provide to patients.7 Hospitals began voluntarily reporting this data to CMS by
July 1, 2004. Every hospital in the US has the ability to participate. The Hospital
Quality Alliance pays hospitals that do not report quality data to CMS lower
2
Reproduced with permission of the copyright owner. Further reproduction prohibited without permission.

reimbursement rates than hospitals that do provide performance data. This program is
currently a pay-for-reporting reimbursement system, but is amalgamating into a pay-
for-performance reimbursement system over time.8
The literature suggests that if you measure something, it will improve.9,10 This
notion has also been substantiated through some of the P4P literature. A literature
review showed that more often than not, P4P programs had their intended effect of
* • 11 12 13improving scores on the measures that dictate payment. ’ ‘ However, literature is
sparse on whether outcomes were actually improved through these P4P programs.
“Despite the proliferation of pay-for-performance programs, they are largely
untested.”14
This research’s first aim is to determine whether P4P leads to improved
process measure scores. The second aim of the research is to determine whether
increased process measure scores lead to improved outcomes within the context of a
P4P program. In other words, the second study aim tries to answer the question of
whether overall quality o f care (as evidenced through outcomes) is improved while
process measure scores are improved or whether the effect o f P4P is a zero sum
game.15 In a zero sum game situation, the process measures that are rewarded through
P4P may improve but the overall quality of care (outcomes) remains the same because
other measures affecting outcomes that are not tied to reimbursement have decreased.
It is possible for limited resources to be reallocated to the performance measures that
impact reimbursement at the potential detriment to the overall quality o f care
provided.
3
Reproduced with permission of the copyright owner. Further reproduction prohibited without permission.
This study will analyze the change in eight P4P indicators for acute myocardial
infarction (AMI) patients before and after the Hospital Quality Alliance was
implemented and will analyze correlations between these measures and AMI patient
outcomes (mortality). Data from five hospital campuses within the Scripps Health
system in San Diego, California from January 1, 2003 to December 31, 2005 was used
to conduct this research.
B a c k g r o u n d
Sub-Optimal Health Care Quality
The US performs more poorly than most countries in many measures o f health
care quality.16 The reports o f substandard healthcare are numerous. Haley et al
estimated that two million patients suffer hospital-acquired infections each year.17
While patients may believe that they are coming to a hospital to have their sickness
cured or managed, some patients’ conditions become worse in the hospital.
An article by Robert Langreth reported that three percent or more o f hospital
patients are hurt by medical errors and that one in 300 patients die from such mistakes.
Comparing this figure to the fact that in US aviation only one in five million flights
ends in a deadly accident is disturbing. Langreth further notes that 24% of people say
they or a family member have been harmed by a medical error. The same article
reports that 90,000 people die o f hospital-acquired infections annually and that more
than half of these deaths may be preventable. In addition, 180,000 elderly outpatients
die or are seriously injured by drug toxicity, where half of these incidents may be
4
Reproduced with permission of the copyright owner. Further reproduction prohibited without permission.
preventable.18
According to the Institute of Medicine’s report To Err is Human: Building a
Safer Health System, “when extrapolated to the over 33.6 million admissions to US
hospitals in 1997, the results of [a] study in Colorado and Utah imply that at least
44,000 Americans die each year as a result of medical errors. The results of the New
York Study suggest the number may be as high as 98,000. Even when using the lower
estimate, deaths due to medical errors exceed the number attributable to the 8th-
leading cause o f death. More people die in a given year as a result of medical errors
than from motor vehicle accidents (43,458), breast cancer (42,297), or AIDS
(16,516).”2 The 2003 National Committee for Quality Assurance (NCQA) report titled
“The State o f Health Care Quality” estimates that there are more than 57,000 deaths
per year attributable to failure to deliver recommended care.19 Regardless o f the exact
number of avoidable deaths, the projected numbers are astounding and provide
impetus for healthcare delivery reform.
Even if hospitals/physicians are not contributors to further illness, healthcare
professionals may not be treating patients as well as they could. McGlynn et al
determined that patients only receive 54.9% of recommended care overall and that
quality can range from receiving 78.7% of recommended care for patients with senile
cataracts to 10.5% of recommended care for patients with alcohol dependence.
Specifically for heart attack patients, W oolf determined that 39% to 55% of patients
did not receive needed medications which resulted in 37,000 avoidable deaths.21 There
are numerous studies like these that aim to quantify not only unnecessary morbidity
5
Reproduced with permission of the copyright owner. Further reproduction prohibited without permission.

and mortality but a lack o f ideal healthcare being currently provided in the US. While
researchers may not be in agreement about how wide the gap or chasm is between
current healthcare and ideal healthcare, there is little debate over the fact that a gap
does exist.
United States’ Reimbursement Systems for Hospitals
The past and current healthcare payment systems have created incentives to
overutilize services (e.g. FFS) and underutilize service (e.g. capitation). Current
reimbursement systems expect high quality care rather than pay for it.
Medicare reimburses hospitals on a prospective basis. Each patient case is
categorized into a diagnosis related group (DRG). One of the important components
that determines Medicare’s payment rate is cost of care as determined by hospital cost
reports. Medicare uses a cost-based reimbursement system, where theoretically higher
cost services should receive higher payment in future years. In some instances,
Medicare’s reimbursement system actually rewards poor care, for example, if a patient
acquires an infection during admission, reimbursement may be higher than if the
patient had not acquired a nosocomial infection.4
Another example o f Medicare’s reimbursement system acting as a disincentive
to provide better care is in the case o f a patient needing multiple vessel percutaneous
coronary intervention. Flospital reimbursement is higher if a patient receives one drug-
eluting stent at one time and then receives a second drug-eluting stent during a second
procedure at least a few days later. If the patient has both stents deployed during the
6
Reproduced with permission of the copyright owner. Further reproduction prohibited without permission.

same procedure the quality of care for the patient is better due to a reduced risk of
complications and less recovery time, however, the staging o f stent deployment has
been determined to be one of the negative consequences of the low reimbursement rate
for angioplasty using drug-eluting stents.22
Fee-for-service payment methodologies reimburse higher rates for services
with higher charges. Fee-for-service reimbursement may therefore incent providers to
furnish more services than necessary to reap greater financial reward.
Capitation and case rate payments put a hospital at risk. A lump sum is
prospectively paid to a hospital for coverage of a patient’s care for a certain period of
time. If the cost of providing care to that patient is less than the payment received,
then the hospital makes a profit. If the cost o f care is greater than the payment
received, then the hospital loses money. Hence, capitation and case rate payments
result in increased profit to providers if fewer services are rendered. These
reimbursement methods can create an incentive towards underutilization o f diagnostic
and treatment services.
Quality Metrics
Organizations such as the Agency for Healthcare Research and Quality
(AHRQ) and the National Quality Forum (NQF) develop quality metrics by reviewing
evidence-based literature for clinical conditions. When there is a very high degree of
consensus regarding metrics that positively correlate with improved clinical outcomes,
the organization develops a proposal metric. Various constituents and the general
7
Reproduced with permission of the copyright owner. Further reproduction prohibited without permission.

public (through posting on the organizations’ websites) are asked to give feedback
upon proposed metrics until the organization decides that the metric is ready for
“finalized” form or whether the metric is too controversial to use. AHRQ’s National
Quality Measures Clearinghouse then tracks the use of the measure, the extent of
measure testing that has been conducted, and the evidence for reliability/validity
testing.23
There are a variety o f categories of quality metrics: structural measures;
process measures; outcome measures; access to care measures; and experience
measures. Most quality metrics for clinical conditions are related to process rather than
clinical outcomes. The reason that process measures are often chosen is because o f the
feasibility o f collecting process measures and because these process measures have
been deemed through evidence-based medicine to be positively correlated with
improved outcomes.
Premier Hospital Quality Incentive Demonstration
The Premier Hospital Quality Incentive Demonstration is a P4P program
between CMS and Premier, Inc. Premier, Inc. is a collaborative o f not-for-profit
hospitals across the nation, of which, a total of 274 hospital members have chosen to
participate in the Demonstration project.
Each hospital reports inpatient performance data on 34 quality measures in the
clinical areas of heart attack, heart failure, pneumonia, coronary artery bypass graft
(CABG), and hip and knee replacements. Top performers in each clinical condition
8
Reproduced with permission of the copyright owner. Further reproduction prohibited without permission.

(top 50%) are recognized as such at the website www.cms.hhs.gov. Additionally, the
top two deciles o f performers are given a financial bonus by CMS. By the third year of
the Demonstration, hospitals that were in the bottom two deciles of performance in
year one receive lower reimbursement rates from CMS if their performance has not
increased from the baseline level. For more information, see Attachment I.
Hospital Quality Alliance
The Hospital Quality Alliance is a collaboration of the CMS, the American
Hospital Association, the Federation of American Hospitals, and the Association of
American Medical Colleges and is a component o f the larger CMS Hospital Quality
Initiative (see Attachment II). The goal o f the Hospital Quality Alliance is “to improve
the quality of care provided by the nation’s hospitals by measuring and publicly
reporting on that care.”
The Hospital Quality Alliance is a voluntary initiative. However, hospitals that
currently choose not to participate receive a market basket minus 2.0% reimbursement
from CMS. Hospitals that do participate submit data on various process measures
which then get reported on a public website www.hospitalcompare.hhs.gov. The
public posting of scores is expected “to improve the quality of care and the ability of
consumers to make informed healthcare choices.” 24 The Hospital Compare website
currently reports 21 measures across the following clinical conditions: heart attack;
heart failure; pneumonia; and surgical infection prevention. Hospitals participating in
the Hospital Quality Alliance submitted their first data by July 1, 2004 on a “starter
9
Reproduced with permission of the copyright owner. Further reproduction prohibited without permission.

set” of 10 measures. The 21 measures currently posted on Hospital Compare include
the “starter set” and are scheduled to continue to grow over time.
Scripps Health
Scripps Health is a private, not-for-profit, community-based health care
delivery network that includes four licensed acute-care hospitals located on five
campuses in San Diego County. There is a distance of three to 41 miles between each
campus.
Scripps was founded in 1924 by Ellen Browning Scripps. The flagship
hospital, Scripps Memorial Hospital La Jolla, has 372 licensed beds and is one of the
county’s six designated trauma centers and the only Magnet Hospital in San Diego
County. Scripps Memorial Hospital La Jolla’s payor mix is approximately 28%
Medicare, 3% MediCal, 60% commercial, 6% other governmental payors and self pay
(including no pay), and 3% other (including workers compensation).
Scripps Memorial Hospital Encinitas joined the Scripps Health system in 1978.
This hospital provides services to patients located in San Diego’s North County and
has 140 acute-care licensed beds. Scripps Memorial Hospital Encinitas’s payor mix is
approximately 38% Medicare, 17% MediCal, 38% commercial, 6% other
governmental payors and self pay, and 1 % other.
Scripps Green Hospital joined the Scripps Health system in 1991. Scripps
Green Hospital has 173 acute-care licensed beds. Scripps Green Hospital is unique
because it shares its campus with Scripps Clinic, which houses a large medical group,
10
Reproduced with permission of the copyright owner. Further reproduction prohibited without permission.

so all physicians who admit patients at Scripps Green Hospital are part o f the Scripps
Clinic Medical Group. Scripps Green Hospital’s payor mix is approximately 54%
Medicare, 0% MediCal, 41% commercial, 3% other governmental payors and self pay,
and 2% other.
Scripps Mercy Hospital has two campuses, one in the Hillcrest area and one in
Chula Vista. The Scripps Mercy Hospital San Diego (Hillcrest) location of Scripps
Mercy Hospital was founded in 1890 and is San Diego’s oldest hospital as well as its
only Catholic medical center. It joined the Scripps system in 1995. Scripps Mercy
Hospital San Diego has 700 licensed beds. In October, 2004 Scripps Mercy Hospital
expanded to include Scripps Mercy Hospital Chula Vista which has another 183 acute-
care licensed beds. Because of its locations and charitable mission, Scripps Mercy
Hospital renders a lot of uncompensated care as evidenced by the high percentage of
other governmental and self pay patients which includes no-pay patients. Scripps
Mercy Hospital San Diego’s payor mix is approximately 31% Medicare, 22%
MediCal, 32% commercial, 12% other governmental payors and self pay, and 3%
other. Scripps Mercy Hospital Chula Vista’s payor mix is approximately 39%
Medicare, 28% MediCal, 17% commercial, 16% other governmental payors and self
pay, and 0% other.
The Scripps Health system employs over 10,000 individuals, is affiliated with
over 2,600 physicians and operates 11 clinics, an ambulatory surgery center, a home
health center, and various other support services.
11
Reproduced with permission of the copyright owner. Further reproduction prohibited without permission.
L it e r a t u r e R e v ie w
Process and Outcomes Measures
Hospital performance measures began being collecting in the 1850’s by
Florence Nightingale. Nightingale collected data on the number of deaths per 1,000
sick patients before and after commencement of sanitary improvements were
conducted. The resulting data suggest that sanitary improvements may have been the
cause o f the drastic reduction in the number o f observed deaths during that time.25
Collecting performance data gives individuals the knowledge with which to make
improvements and then monitor the success o f the improvement activities.
Some performance metrics measure outcomes, such as those used by Florence
Nightingale, and others measure process. While the goal of performance improvement
activities is often to improve patient outcomes, if outcomes alone are measured, it may
be difficult to determine which activities should be implemented to affect a change in
outcomes. When certain processes are determined to be causal factors of improved
outcomes, the tracking of these process measures can more easily guide providers to
the activities on which they should focus. For example, Tu and Cameron conducted a
survey of physicians at Ontario hospitals about whether acute myocardial infarction
‘report cards’ were useful for assessing and improving the quality of care. Survey
respondents noted that process of care measures such as post-infarction beta-blocker
and angiotensin-converting enzyme inhibitor use, and cardiac procedure waiting times
were the most useful data, and outcomes data (e.g. 30-day and one-year risk adjusted
AMI mortality rates) the least useful of the many performance measures published in
12
Reproduced with permission of the copyright owner. Further reproduction prohibited without permission.

the report card.26 If process measures are indeed correlated with outcomes, then
knowing ones scores on these measures can guide improvement activities which
should result in improved outcomes.
Unfortunately, not all process measures are good predictors of outcomes. A
study by Griffith, Knutzen, and Alexander compared structure and process measures
used by the Joint Commission on Accreditation of Healthcare Organizations (JCAHO)
to hospital performance measures derived from Medicare. The results of the study
indicated that JCAHO’s measures were generally not correlated with outcome
measures.27
Other studies have tried to determine whether collecting hospital performance
measures improve quality of care, however, these studies do not address outcomes.
For instance, a Williams et al article notes that after JCAHO implemented
standardized performance measures, consistent improvements in process o f care
measures for AMI, heart failure, and pneumonia were observed over a two-year
period. Hospitals were successful in improving process measures, however, the
authors o f this study did not determine whether improved process measures scores
were correlated with improved outcomes. Improving outcomes is the intended goal of
these metrics but is often assumed rather than verified.
Acute Myocardial Infarction Hospital Process Measures
Evidence-based medicine suggests that the eight process measures for acute
myocardial infarction (AMI) used in the Hospital Quality Alliance are correlated with
13
Reproduced with permission of the copyright owner. Further reproduction prohibited without permission.

improved outcomes. According to the AHRQ’s National Quality Measures
Clearinghouse, each of the eight AMI process measures may lead to reduced mortality
and morbidity, yet is underperformed or underutilized with AMI patients . 2 9
1. Percent o f patients without aspirin contraindications who received aspirin within 24
hours before or after hospital arrival and
2. Percent o f patients without aspirin contraindications who are prescribed aspirin at
hospital discharge
A number o f meta-analyses have been conducted that show that patients who
have had an AMI or who had had acute or prior vascular disease have reduced
mortality and incidence of stroke and recurrent MI when the patient is treated with
• • 30 ,31 ,32,33aspirin. ’ ’ ’
The American College of Chest Physicians recommend in their guideline for
thrombolysis and adjunctive therapy in AMI treatment, that patients with AMI/ST-
elevated myocardial infarction (STEMI) be given aspirin at the initial healthcare
evaluation and then indefinitely thereafter. 3 4 This recommendation received a Grade
1 A which means that the magnitude of benefits, risk, burdens, and costs is certain and
that randomized controlled trails on the subject generate consistent results.
The American College o f Cardiology/American Heart Association
(ACC/AHA) recommends that patients with STEMI receive aspirin for initial
T Streatment, for ongoing treatment, and for secondary prevention. All three of these
14
Reproduced with permission of the copyright owner. Further reproduction prohibited without permission.

recommendations are rated as Class I which denotes situations in which interventions
are effective or useful based on evidence and/or consensus.
The European Society o f Cardiology also agrees that patients with AMI should
receive aspirin as noted in their recommendations regarding platelet inhibitor therapy
in patients with AMI . 3 6 They gave this recommendation a rating o f Grade 1 indicating
that it is a situation in which the benefits of the intervention clearly outweigh the
burden, costs, and risks.
3. Percent of patients without beta blocker contraindications who received a beta
blocker within 24 hours after hospital arrival and
4. Percent of patients without beta blocker contraindications who are prescribed a beta
blocker at hospital discharge
There have been many meta-analyses that have concluded that patients with an
37 33 38 39AMI who receive beta blockers have a reduced risk o f mortality. ’ ‘ 7 Meta
analyses have also determined that beta-blockers are effective for the secondary
prevention of coronary events . 3 9 ,4 0
The ACC/AHA recommends with a Class I rating that patients with STEMI
receive prompt administration of oral beta-blockers unless contraindicated. The
ACC/AHA also recommends with a Class I rating that beta-blockers should be
continued indefinitely unless contraindicated for secondary prevention management of
patients with STEMI. 3 5
15
Reproduced with permission of the copyright owner. Further reproduction prohibited without permission.

The European Society of Cardiology agrees that patients with STEMI receive
beta-blockers for acute treatment, to prevent reinfarction, to improve survival, and for
primary prevention of sudden cardiac death . 4 1 Both recommendations for initial
treatment and secondary prevention received a Class I rating.
5. Percent o f patients with left ventricular systolic dysfunction (LVSD) and without
both angiotensin converting enzyme inhibitor (ACEI) and angiotensin receptor blocker
(ARB) contraindications who are prescribed an ACEI or ARB at hospital discharge
Meta-analyses by Latini et al and the ACE Inhibitor Myocardial Infarction
Collaborative Group both determined that early ACEI therapy reduced 30-day
mortality compared to those who received a placebo 4 2 ,4 3 A meta-analysis by
Domanski et al also showed that ACEIs given in patients with AMI reduced mortality,
cardiovascular death, and sudden cardiac death as compared with patients who
received a placebo . 4 4
Lee et al conducted a meta-analysis which showed that for patients with high-
risk AMI, the use of ARBs compared with the use o f ACEIs made no difference in
mortality rates 4 5
The ACC/AHA recommends that patients with STEMI should be prescribed an
ACEI at the time o f hospital discharge for long-term management unless
contraindicated. The ACC/AHA also recommends that patients with STEMI with left
ventricular ejection fraction (LVEF) of less than 40% or patients who have clinical or
radiological signs o f heart failure and who are intolerant of ACEIs should be
16
Reproduced with permission of the copyright owner. Further reproduction prohibited without permission.

prescribed an ARB at the time of hospital discharge for long-term management. 3 5 Both
o f these recommendations received a Class I rating.
Similarly, the European Society o f Cardiology made the Class I
recommendation that patients with AMI beyond the first 24 hours who have left
ventricular dysfunction (defined as LVEF less than 45%) or overt heart failure should
receive an ACEI . 4 6
6 . Percent of patients with history o f smoking cigarettes who are given smoking
cessation advice or counseling during the hospital stay
A meta-analysis by Wilson et al determined that smoking cessation reduces
mortality in patients who have had a myocardial infarction (MI) . 4 7 Similarly, a meta
analysis by Critchley and Capewell determined that patients with coronary artery
disease (CAD) who quit smoking have a lower risk of death as compared to patients
with CAD who continue to smoke . 4 8
A Houston et al retrospective analysis showed that compared with those who
did not receive smoking cessation counseling, smokers who did receive inpatient
counseling had lower rates of 30-day, 60-day, and two-year mortality . 4 9 A
retrospective analysis conducted by Rea et al determined that for patients who have
had an MI, smoking was associated with an elevated risk for recurrent coronary
events . 5 0 Further, a guideline developed by the European Society o f Cardiology notes
that the most effective o f all secondary prevention measures for patients who have had
a STEMI is smoking cessation 4 1
17
Reproduced with permission of the copyright owner. Further reproduction prohibited without permission.

7. Percent of patients receiving percutaneous coronary intervention (PCI) during the
hospital stay with time from hospital arrival to PCI of 120 minutes or less
Multiple meta-analyses have showed that in patients with an AMI, primary
PCI reduces short-term mortality, reinfarction, recurrent ischemia, and stroke
compared to patients who receive thrombolysis . 5 1 ,5 2 ,5 3
Zeymer et al determined that in patients with AMI undergoing primary PCI
who have cardiogenic shock, a longer symptom onset to PCI time is associated with
increased mortality . 5 4 A nonrandomized prospective study by Cannon et al showed
that for patients with AMI undergoing primary percutaneous transluminal coronary
angioplasty (PTCA) (a form of PCI), a door-to-balloon inflation time o f greater than
two hours is associated with increased in-hospital mortality . 5 5
Until 2007, the Hospital Quality Alliance measured compliance with PCI
within 1 2 0 minutes from hospital arrival, however, the standard has since changed to
measuring PCI within 90 minutes of hospital arrival. Guidelines such as those
developed by the ACC/AHA recommend that patients with STEMI undergoing
primary PCI should have the procedure performed as quickly as possible, aiming for a
door-to-balloon time of 90 minutes or less . 3 5
8 . Percent of patients receiving thrombolytic therapy during the hospital stay and
having a time from hospital arrival to thrombolysis of 30 minutes or less.
Meta-analyses conducted by Lau et al and Antman et al both show that the use
of thrombolytic therapy is associated with a reduction in mortality for patients with
18
Reproduced with permission of the copyright owner. Further reproduction prohibited without permission.

33 39 • •AMI. ’ The Fibrinolytic Therapy Trialists’ Collaborative Group also found a large
mortality reduction between days two to 35 for patients receiving thrombolysis . 5 6
The ACC/AHA and the European Society of Cardiology both give Class I
recommendations for the use o f thrombolytics unless contraindicated for STEMI
patients . 3 5 ,4 1
The American College of Chest Physicians recommends that for patients who
receive fibrinolytic therapy, the goal should be 30 minutes from hospital arrival or first
contact with the patient until administration . 3 4
Pay-for-Performance
P4P programs are relatively new in the healthcare industry, although they are
rising in number. While there is growing interest in this area, there is little published
research on P4P in health care and there are only a few studies which demonstrate that
P4P leads to improved quality of care . 5 7 Most articles on P4P are explanatory. There
are not many research studies that show the rates o f compliance with quality indicators
before and after P4P programs. In fact, Dudely et al conducted a literature search on
performance-based payment in the healthcare industry and only identified eight
randomized controlled trials published on this topic. “The eight trials o f performance-
based payment were neither consistent in their design of the independent variable (the
financial incentive offered) nor comparable in terms of their dependent variable (the
performance indicator measured ) . ” 11 Dudley et al found that all of these randomized
controlled trials were aimed to incent individual physicians, a group of providers, or
19
Reproduced with permission of the copyright owner. Further reproduction prohibited without permission.
pharmacists. In these eight studies with a total o f ten dependent variables, six
dependent variables were “positive” which means that there was an effect in the
desired direction, and four were negative . 11 These studies show that there is no clear
consensus as to whether P4P is successful in achieving its desired outcomes.
A more recently published review of empirical studies on financial incentives
designed to improve healthcare by Petersen et al affirmed the Dudley et al findings
that P4P generates positive yet inconsistent desired effects. In the Petersen et al
analysis of 17 eligible studies addressing financial incentives’ effect on quality of care,
none of the studies were based on hospital performance. Five o f the six studies of
physician-level financial incentives, seven of the nine studies of provider group-level
financial incentives, and one of the two studies o f the payment system-level financial
incentives found partial or positive effects on process or access measures. Four studies
58suggested unintended effects o f incentives.
Other non-randomized controlled studies about P4P programs geared towards
physicians have shown to have some benefits. One study noted that P4P helped the
health plan Wellpoint improve immunization rates from 21% to 58% and pap smear
rates from 79% to 85%.59 A New York P4P program showed that financial incentives
for physicians coupled with other care management tools led to improved scores on
five out of six process measures and two out o f three outcome measures . 6 0 The
Integrated Healthcare Association’s P4P program for California physicians rates
physicians on three domains: clinical measures; patient experience; and information
technology (IT) adoption. Results from year two compared to year one show that 87%
20
Reproduced with permission of the copyright owner. Further reproduction prohibited without permission.

of physician groups improved their clinical measure scores by an average of 5.3%, that
65% of physician groups improved their patient experience average performance, and
that 34% of physician groups who reported no IT capability in 2003 received partial or
10full credit for IT adoption in 2004. Year three results also showed increases in the
number of patients receiving cervical cancer screenings, diabetes tests, and childhood
immunizations compared to year two . 61
There are not as many articles about how well P4P works in the hospital
setting. One such study, the Premier Hospital Quality Incentive demonstration,
showed that this P4P program accomplished its intended results. “Quality of care
improved in all of the five clinical areas for which quality was measured. Composite
quality scores improved between the first and last quarter o f the first year o f the
demonstration: from 87% to 91% for patients with acute myocardial infarction (heart
attack); from 65 to 74% for patients with heart failure; from 69% to 79% for patients
with pneumonia; from 85% to 90% for patients with coronary artery bypass graft; and
13from 85% to 90% for patients with hip and knee replacement.”
A study in China, while structured differently than the P4P programs aimed
towards improving quality, found that P4P contributed significantly to the increase in
hospital service revenue and hospital cost recovery, which were the aims of the
project. However, this program also showed that when the bonus system switched
from a weaker incentive to a stronger one, there was an increase in unnecessary care . 6 2
Not all reviews of P4P programs conclude that the program has produced its
intended benefit. A study by Rosenthal, Frank, Li, and Epstein concluded that “paying
21
Reproduced with permission of the copyright owner. Further reproduction prohibited without permission.

clinicians to reach a common, fixed performance target may produce little gain in
quality for the money spent and will largely reward those with higher performance at
baseline . ” 5 7 In an article by Sipkoff, American Medical Association Secretary John H.
Armstrong, MD took a harder stance, although it was not supported by any data,
stating that “some so-called pay-for-performance initiatives are a lose-lose proposition
for patients and their doctors. The only benefit is to health plans. Done right, these
programs can improve medical care; done wrong, they can harm patients.”
Furthermore, a review of empirical literature conducted by Rosenthal and Frank
concluded that there is little evidence to support the effectiveness o f paying for quality
in healthcare . 6 4
The research that has been conducted thus far on pay-for-performance
programs for healthcare providers does address whether scores on P4P measures have
improved. However, studies that look at whether the improved scores on the P4P
process measures do indeed result in improved outcomes have been scarce. The
assumption is that based upon evidence-based literature, outcomes should improve,
but research on P4P programs has not conclusively proved that assumption to be
correct.
Fonarow et al used the ACC/AHA performance measures to test the
relationship between heart failure P4P metrics and outcomes. They found that none of
the five performance measures was significantly associated with reduced early
mortality risk and only one measure was associated with 60 to 90 day post-discharge
mortality or rehospitalization. The authors concluded that additional measures and
22
Reproduced with permission of the copyright owner. Further reproduction prohibited without permission.

better methods for identifying and validating heart failure performance measures may
be needed to improve care of heart failure patients . 6 5
The evidence shows that improvements on the eight AMI process measures
used by the Hospital Quality Alliance should result in improved outcomes. However,
the evidence for this assumption was not gathered from P4P programs. If everything
else is held constant and process measures improve, outcomes improve according to
the literature. However, what if other factors are not held constant? Pay-for-
performance models financially reward scores on certain measures. By rewarding
some quality indicators and not others, one can assume that the measures that are
rewarded may increase, but one cannot assume that the measures that are not rewarded
will remain constant. If some quality measures that are not rewarded decrease because
of the increased emphasis and allocation o f resources on the measures that are
financially rewarded, then what effect does that decrease have on overall quality? The
question remains unanswered as to whether the net effect of P4P programs is positive
(i.e. decreased mortality/increased outcomes) or whether the net affect o f P4P
programs is constant or is correlated with worse outcomes.
H y p o t h e s e s
Specific Aim 1 - To determine the relationship between participation in a pay-for-
performance program and scores on process measures.
23
Reproduced with permission of the copyright owner. Further reproduction prohibited without permission.

While a literature review suggests that P4P programs generally result in their
intended outcomes, it is not consistently the case. My research aims to determine
whether AMI process measure scores improved due to participation in P4P programs.
Hypothesis 1 a): Process measure scores will not improve due to
participation in pay-for-performance.
Hypothesis 1 b): Process measure scores will improve due to
participation in pay-for-performance.
Specific Aim 2 - To determine whether pay-for-performance programs succeed in
improving the overall quality o f patient care as evidenced through the outcome
measure o f mortality.
While evidence-based medicine shows that improved scores on process
measures can improve patient outcomes, the data collected thus far on pay-for-
performance programs only suggests that pay-for-performance programs improve
scores on process measures. My research aims to extend the analysis to whether
improved scores on process measures indeed improve clinical outcomes within the
context of hospitals participating in pay-for-performance programs.
Pay-for-performance programs present incentives to providers to focus on the
measures that lead to increased reimbursement. There has been little research
conducted on whether unintended consequences o f P4P negatively impact patient
outcomes. My research on patient outcomes also aims to shed light on whether
focusing resources on the P4P measures results in decreased quality of care in non-
24
Reproduced with permission of the copyright owner. Further reproduction prohibited without permission.

measured indicators which outweigh the positive benefits o f P4P programs or whether
P4P programs improve the overall quality of care through increased attention on
performance measures. If patient mortality increases through P4P, one should
investigate the former conclusion and if patient mortality decreases through P4P, one
should investigate the latter conclusion.
Hypothesis 2 a): Pay-for-performance programs will not improve
clinical outcomes.
Hypothesis 2 b): Pay-for-performance programs will improve clinical
outcomes.
C o n c e p t u a l M o d e l
Both aims of this study can be addressed through the same conceptual model.
The conceptual model is depicted in Attachment III. The conceptual model shows that
there are a number of factors that may affect outcomes for patients with acute
myocardial infarction. There are six main factors that may contribute to mortality rates
after an AMI: increased P4P scores on process measures; patient demographics;
hospital characteristics; patient’s medical condition; treatment; and patient behavior.
The belief is that all six factors can have a direct effect on patient outcomes.
There are many potential interactions between the six factors contributing to
outcomes. Patient demographics can affect patient behavior, treatment, and patient’s
medical condition. Hospital characteristics can affect treatment and pay-for-
performance process measures. A patient’s medical condition can affect treatment and
25
Reproduced with permission of the copyright owner. Further reproduction prohibited without permission.

patient behavior. Patient behavior can affect treatment and a patient’s medical
condition.
The conceptual model elucidates the fact that there are many interrelated
components affecting outcomes, which is why it is essential to hold as many of these
factors possible constant in order to determine how increases/changes in P4P scores
alone affect patient outcomes.
D a t a
Main Analysis
Patients with acute myocardial infarctions seen at Scripps Memorial Hospital
Encinitas, Scripps Memorial Hospital La Jolla, Scripps Green Hospital, Scripps Mercy
Hospital San Diego, and Scripps Mercy Hospital Chula Vista from the time period
January 1, 2003 to December 31, 2005 are all included in this study. July 1, 2004 is
the date that the Scripps hospitals began participating in the CMS Hospital Quality
Alliance (HQ A) pay-for-reporting program, therefore, there are 18 months of data
from before the initiative began and 18 months o f data from after the initiative started.
The total patient population is 1,924 patients before participation in the Hospital
Quality Alliance and 2,030 patients after participation began, for a total of 3,954
patients included in the study. [Of note is the fact that data is not available from
Scripps Memorial Hospital Encinitas from January, 2003 to June, 2004. During that
timeframe Encinitas used the National Registry o f Myocardial Infarction (NRMI)
electronic application to track clinical information such as aspirin or beta blockers at
26
Reproduced with permission of the copyright owner. Further reproduction prohibited without permission.

arrival instead of MIDAS+. The older NRMI data could not be located, therefore, it
was not included in this analysis.]
Scripps Health patient level data from its participation in the Hospital Quality
Alliance is being used. While the HQA is a pay-for-reporting (P4R) program, it is the
precursor to a P4P program beginning on October 1, 2008. While not a true P4P
program currently, since it is well known in the industry that it is moving towards a
P4P program, hospitals are trying to achieve high scores to well position themselves
for the future. Therefore, HQA data is used as an approximation for future P4P
keeping in mind that P4P results may be greater/different than that through P4R. For
example, a study by Lindenauer et al found that performance on P4P metrics improved
with both P4R and P4P programs, however, hospitals participating in P4P improved
their scores more than hospitals participating in P4R . 6 6 It is expected that directional
effects of P4R and P4P will be the same but that the magnitude o f the impact on
process measure scores and outcomes may be different.
Additional Analysis
An additional analysis was conducted using nation-wide hospital data. For the
additional analysis, data on compliance with seven AMI indicators was used. [The
indicator for PCI within 120 minutes was excluded due to inconsistency of data
collected, as one time period reported PTCA within 90 minutes instead o f PCI within
120 minutes.] An indicator was also added to denote an overall process measure score.
This indicator is called “Weighted Average Score” and was calculated by adding up
27
Reproduced with permission of the copyright owner. Further reproduction prohibited without permission.
all the numerators for the seven individual measures and dividing that number by the
sum of all the individual measures’ denominators. Premier, Inc. hospitals’ data,
Scripps Health hospitals’ data, and other national Hospital Quality Alliance
participants’ data are included in this analysis. Observations were conducted over
various timeframes between October 1, 2002 and June 30, 2005.
Data from 10/02-9/03 (before the Premier Hospital Quality Incentive
Demonstration) was collected from the 54 Premier, Inc. hospitals participating in the
baseline data collection phase of the Demonstration. These 54 Premier, Inc. hospitals
represent 70,860 patients. Data from five Scripps Health facilities over the same time
period representing 4,511 patients was also used. (Scripps Memorial Hospital La Jolla
data was unable to be obtained from 1 0 /0 2 - 1 2 /0 2 , therefore, it was excluded from the
analysis.)
Another observation was conducted from 1/04-6/04 (after the Premier Hospital
Quality Incentive Demonstration and before the Hospital Quality Alliance). Data was
collected from 54 Premier, Inc. hospitals representing 37,422 patients for this time
frame. Data from five Scripps Health facilities over the same time period from 1/04-
6/04 representing 2,388 patients was also collected.
One more time frame of data was collected from 7/04-6/05 (after HQA). Data
from the same 54 Premier, Inc. hospitals representing 71,914 patients was collected as
well as data from the same five Scripps Health facilities representing 3,890 patients. In
addition, data from 4,180 other US hospitals (excluding the five Scripps Health and 54
Premier, Inc. facilities) participating in HQA representing 1,707,557 patients was
28
Reproduced with permission of the copyright owner. Further reproduction prohibited without permission.
collected for the time period 7/04-6/05. [Note that additional Premier, Inc. hospitals
joined the Premier Hospital Quality Incentive Demonstration over time. Fifty-four
hospitals participated in the program from the time of baseline data collection and
those were the facility scores used for this analysis.]
D a t a S o u r c e s
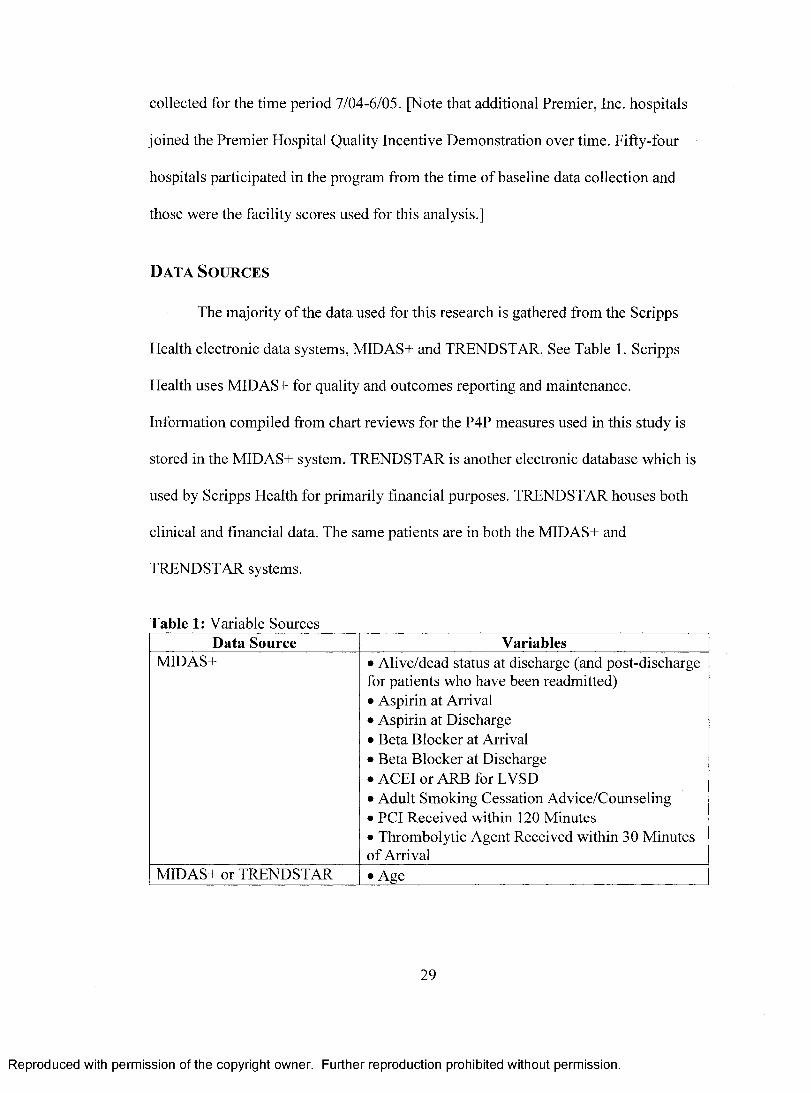
The majority o f the data used for this research is gathered from the Scripps
Health electronic data systems, MIDAS+ and TRENDSTAR. See Table 1. Scripps
Health uses MIDAS+ for quality and outcomes reporting and maintenance.
Information compiled from chart reviews for the P4P measures used in this study is
stored in the MIDAS+ system. TRENDSTAR is another electronic database which is
used by Scripps Health for primarily financial purposes. TRENDSTAR houses both
clinical and financial data. The same patients are in both the MIDAS+ and
TRENDSTAR systems.
Table 1: Variable SourcesData Source Variables
MIDAS+ • Alive/dead status at discharge (and post-discharge for patients who have been readmitted)• Aspirin at Arrival• Aspirin at Discharge• Beta Blocker at Arrival• Beta Blocker at Discharge• ACEI or ARB for LVSD• Adult Smoking Cessation Advice/Counseling• PCI Received within 120 Minutes• Thrombolytic Agent Received within 30 Minutes o f Arrival
MIDAS+ or TRENDSTAR •A g e
29
Reproduced with permission of the copyright owner. Further reproduction prohibited without permission.

• Race• Gender• Martial Status• Religion• Facility• Payor - Access to Care Proxy• Primary Care Physician - Access to Care Proxy• Coronary Artery Disease (CAD)• Prior Myocardial Infarction• Family History o f CAD• Dyslipidemia• Diabetes• Hypertension• Obesity• Depression• Smoking Status within last 12 months• Coronary Artery Bypass Graft (CABG) Surgery• Other Open Heart Surgery• Angioplasty / PCI Treatment• Thrombolysis Treatment• Other Primary Cardiac Procedures (Diagnostic or Treatment)• No Cardiac Treatment• Readmissions within 30 days
Social Security Death Index If patient is not classified as deceased in Scripps Health electronic records:• Date of Death
Interviews / Misc. Databases • Hospital Paid Full Time Employees (FTE) per Adjusted Occupied Bed• Hospital Rapid Response Team Available• Hospital Chest Pain Center Available• Hospital Cardiovascular Award (as determined by Solucient, U.S. News & World Report, etc.) during Year of Visit• Total Hospital Annual AMI Volume• Average Cardiologist Annual AMI Volume• Annual Hospital AMI Admissions per ICU Beds• Hospital Payor Mix• Teaching Hospital Status (as evidenced by a Graduate Medical Education program)• Surgical Back-up Available
30
Reproduced with permission of the copyright owner. Further reproduction prohibited without permission.

The Social Security Death Index was used as one resource to determine post
discharge mortality of patients in this study. The Social Security Death Index is
populated by “the Death Master File (DMF) from the Social Security Administration
(SSA). The database currently contains over 79 million records. The latest update used
for this analysis reflects the most current information provided by the SSA for deaths
through September 30, 2006. The file is created from internal SSA records o f deceased
persons possessing social security numbers and whose deaths were reported to the
SSA. Often this was done in connection with filing for death benefits by a family
member, an attorney, a mortuary, etc. Each update of the DMF includes corrections to
old data as well as additional names. [NOTE: If someone is missing from the list, it
may be that the benefit was never requested, an error was made on the form requesting
the benefit, or an error was made when entering the information into the SSDI. ] ” 6 7 The
Social Security Death Index is also used by FlealthGrades, an independent healthcare
rating company, to determine 30-day post discharge and 180-day post discharge AMI
mortality rates . 6 8
D a t a E l e m e n t s
Table 2 lists all the variables included in the model under the Empirical
Variable column and also links those variables to the theoretical variables listed in the
conceptual model (Attachment III). Table 2 describes the predicted effect on outcomes
31
Reproduced with permission of the copyright owner. Further reproduction prohibited without permission.

that each variable may have. The following section describes all variables in more
detail.
Table 2: Conceptual Domains, Theoretical Variables, Empirical Variables, and Prediction on Outcome
ConceptualDomain
Theoretical Variable Em pirical Variable Prediction
Patient Outcomes(DependentVariable)
Survival Post AMI Days Survival Post AMI
Not applicable, outcome o f interest
Alive/Dead at 30 days
Readmissions Readmissions within 30 days
Hospital Pay for Performance Scores
Aspirin at Arrival Aspirin at Arrival Administration o f these process measures will decrease mortality^0'56
Aspirin at Discharge Aspirin at DischargeBeta Blocker at Arrival
Beta Blocker at Arrival
Beta Blocker at Discharge
Beta Blocker at Discharge
ACEI for LVSD ACEI for LVSDSmoking Cessation Advice
Smoking Cessation Advice
PCI Received within 120 Mins
PCI Received within 120 Mins
Thrombolytic Agent Received within 30 Mins
Thrombolytic Agent Received within 30 Mins
PatientDemographics
Age Age Older age is associated with increased risk o f mortality
Race Race Life expectancy rates are better for whites than for minorities so minorities have an increased risk o f mortality69
Gender Gender Unknown direction o f effect - being male is associated with increased risk o f mortality70, however, for risk o f mortality after an AMI, studies have shown similar mortality rates across gender70
A ccess to Care Insurance Status Having regular access to care is associated with decreased risk o f mortality71
Primary Care Physician (PCP)
32
Reproduced with permission of the copyright owner. Further reproduction prohibited without permission.

Status
Education Data Unavailable Lower education andIncome lower income are both
associated with increased risk o f mortality.
Marital Status Martial Status Single and widowed individuals are associated with increased risk o f mortality compared to married people72
Religion Religion Religion may impact treatment decisions and patient behavior which may then impact outcomes yet direction o f its effect is unknown
HospitalCharacteristics
Facility Facility The aggregation o f the hospital characteristics in each facility may impact outcomes yet direction o f its effect is unknown
Nurse Staffing Ratio Minimum Nurse Staffing Ratio is set based upon bed type. Instead used Paid FTE per Adjusted Occupied Bed
Higher nurse/staff-to- patient staffing ratios may lead to greater compliance with performance metrics and better patient outcomes
Response Team to AMI in ED / Urgent Care
Rapid Response Team Having a Rapid Response Team or Chest Pain Center may lead to
Chest Pain Center quicker treatment and better compliance with performance metrics
Center o f Excellence / Award for Heart Care
Cardiovascular Care Award Received During Year o f Visit
Being designated as a Center o f Excellence for Heart Care may motivate compliance with performance metrics to continue to achieve recognition for high quality care
Total Hospital AMI Volume
Total Hospital AMI Admissions
Having higher volumes and more experience
Average Cardiologist AMI Volume
Average Cardiologist AMI Admissions
treating AMI patients may lead to better outcomes
Level o f Technology Available
No variable included as Scripps physicians felt that instead o f technology, bed level should be measured
Having more technology available may lead to quicker diagnosis and performance o f process measures
33
Reproduced with permission of the copyright owner. Further reproduction prohibited without permission.

Ratio o f AMI Admissions to ICU Beds
Having more beds available may lead to quicker treatment and therefore better outcomes
Hospital Profitability / Payor Mix
Payor Mix Hospitals in better financial positioning may be better equipped to provide quick and appropriate care in accordance with performance metrics. Hospitals with better payor mix may have healthier patients who may have better outcomes
Teaching Hospital Status
Teaching Hospital Status
Internal data from Scripps shows that compliance on performance metrics is greater for teaching patients
Surgical Back-Up Surgical Back-Up Having surgical back-up may lead to better outcomes i f complications arise
Patient’s Medical Condition
CAD CAD Uncertain effect - previous diagnosis o f CAD could mean that disease is more severe (increased risk o f mortality) or it could mean that the patient has a regular source o f care which is why CAD was diagnosed before the heart attack (decreased risk o f mortality)
Prior MI Prior MI A prior MI is associated with increased risk o f mortality73
Family History o f CAD
Family History o f CAD
B elie f that family history o f CAD is associated with increased risk o f mortality b/c family history o f CAD is a risk factor for heart disease74
Dyslipidemia Dyslipidemia B elie f that dyslipidemia is associated with increased risk o f mortality b/c it is associated with progression o f cardiovascular disease75
34
Reproduced with permission of the copyright owner. Further reproduction prohibited without permission.
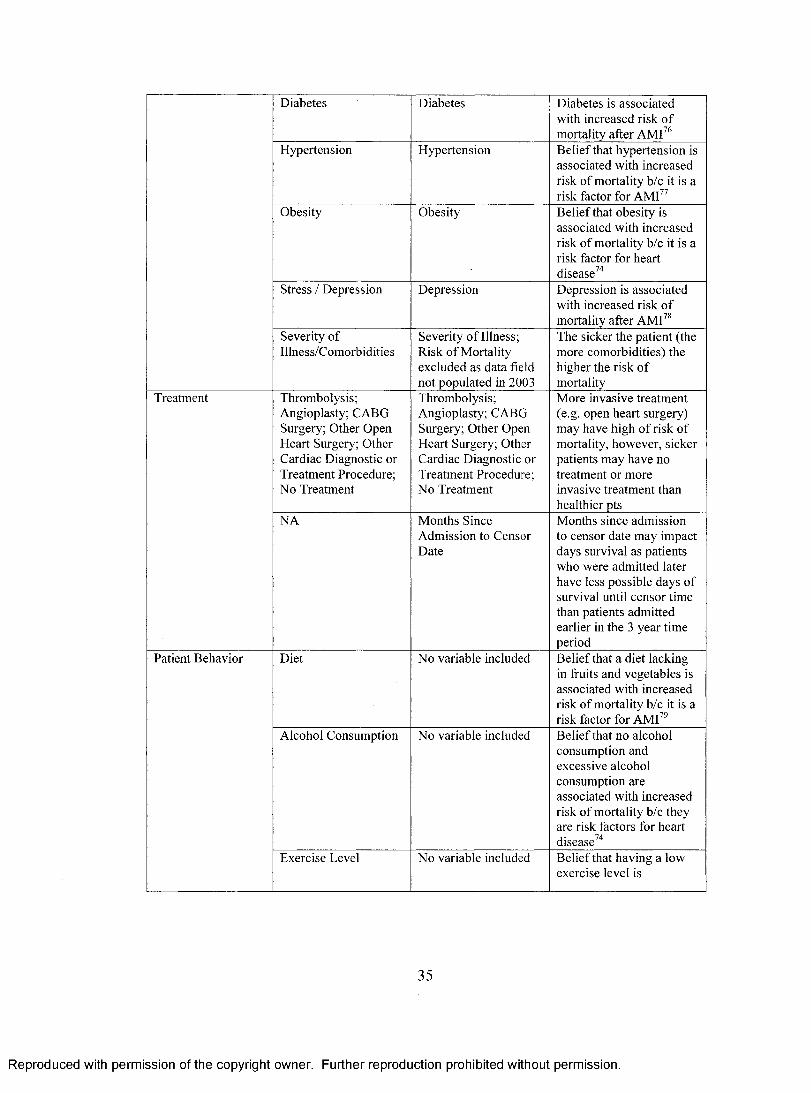
Diabetes Diabetes Diabetes is associated with increased risk o f mortality after AMI76
Hypertension Hypertension B elief that hypertension is associated with increased risk o f mortality b/c it is a risk factor for AMI77
Obesity Obesity B elief that obesity is associated with increased risk o f mortality b/c it is a risk factor for heart disease74
Stress / Depression Depression Depression is associated with increased risk o f mortality after AMI78
Severity o f Illness/Comorbidities
Severity o f Illness; Risk o f Mortality excluded as data field not populated in 2003
The sicker the patient (the more comorbidities) the higher the risk o f mortality
Treatment Thrombolysis; Angioplasty; CABG Surgery; Other Open Heart Surgery; Other Cardiac Diagnostic or Treatment Procedure; No Treatment
Thrombolysis; Angioplasty; CABG Surgery; Other Open Heart Surgery; Other Cardiac Diagnostic or Treatment Procedure; N o Treatment
More invasive treatment (e.g. open heart surgery) may have high o f risk o f mortality, however, sicker patients may have no treatment or more invasive treatment than healthier pts
NA Months Since Admission to Censor Date
Months since admission to censor date may impact days survival as patients who were admitted later have less possible days o f survival until censor time than patients admitted earlier in the 3 year time period
Patient Behavior Diet N o variable included B elief that a diet lacking in fruits and vegetables is associated with increased risk o f mortality b/c it is a risk factor for AMI79
Alcohol Consumption N o variable included B elief that no alcohol consumption and excessive alcohol consumption are associated with increased risk o f mortality b/c they are risk factors for heart disease74
Exercise Level N o variable included B elief that having a low exercise level is
35
Reproduced with permission of the copyright owner. Further reproduction prohibited without permission.
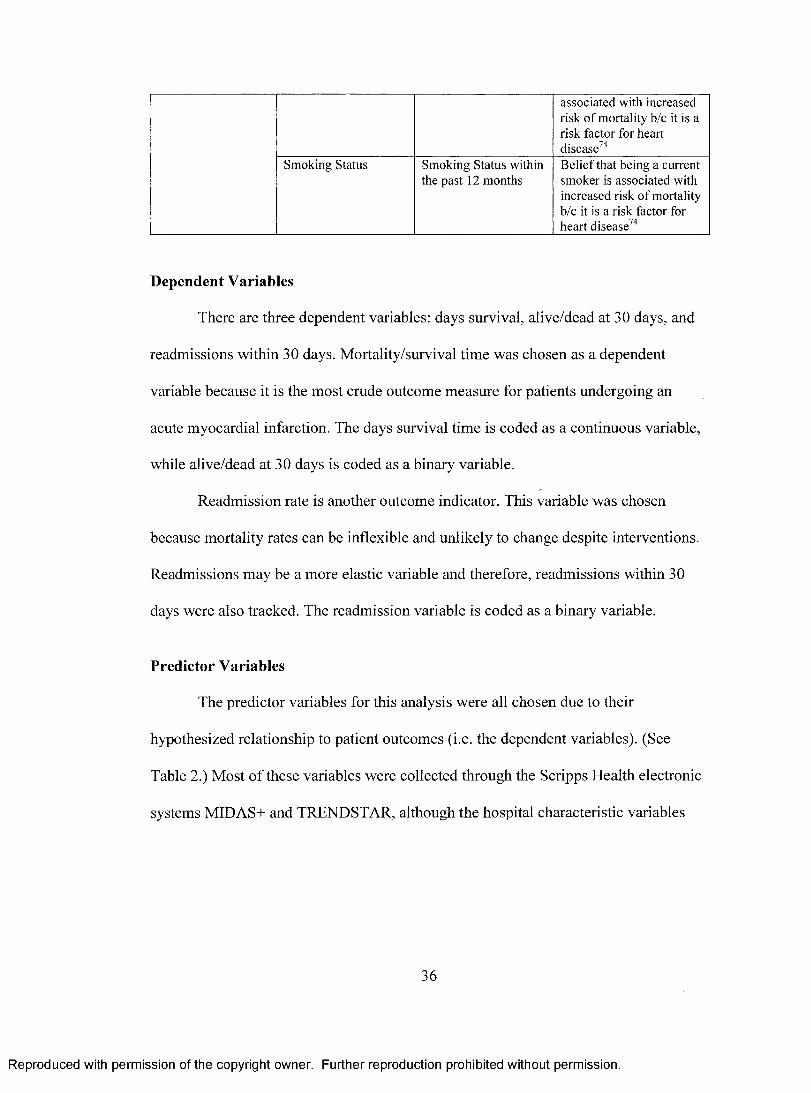
associated with increased risk o f mortality b/c it is a risk factor for heart disease74
Smoking Status Smoking Status within the past 12 months
B elie f that being a current smoker is associated with increased risk o f mortality b/c it is a risk factor for heart disease74
Dependent Variables
There are three dependent variables: days survival, alive/dead at 30 days, and
readmissions within 30 days. Mortality/survival time was chosen as a dependent
variable because it is the most crude outcome measure for patients undergoing an
acute myocardial infarction. The days survival time is coded as a continuous variable,
while alive/dead at 30 days is coded as a binary variable.
Readmission rate is another outcome indicator. This variable was chosen
because mortality rates can be inflexible and unlikely to change despite interventions.
Readmissions may be a more elastic variable and therefore, readmissions within 30
days were also tracked. The readmission variable is coded as a binary variable.
Predictor Variables
The predictor variables for this analysis were all chosen due to their
hypothesized relationship to patient outcomes (i.e. the dependent variables). (See
Table 2.) Most o f these variables were collected through the Scripps Health electronic
systems MIDAS+ and TRENDSTAR, although the hospital characteristic variables
36
Reproduced with permission of the copyright owner. Further reproduction prohibited without permission.

were collected through interviews and other databases. For more detail about how
each variable is coded, please refer to Attachment IV.
Pay-for-Performance Scores
There are nine variables related to P4P scores which comprise the regressors of
interest. There are eight individual variables: 1) the percent o f patients without aspirin
contraindications who received aspirin within 24 hours before or after hospital arrival;
2 ) the percent of patients without aspirin contraindications who are prescribed aspirin
at hospital discharge; 3) the percent of patients without beta blocker contraindications
who received a beta blocker within 24 hours after hospital arrival; 4) the percent of
patients without beta blocker contraindications who are prescribed a beta blocker at
hospital discharge; 5) the percent o f patients with LVSD and without both ACEI and
ARB contraindications who are prescribed an ACEI or ARB at hospital discharge; 6 )
the percent of patients with history o f smoking cigarettes within the past 1 2 months
who are given smoking cessation advice or counseling during the hospital stay; the
percent o f patients receiving PCI during the hospital stay with time from hospital
arrival to PCI of 120 minutes or less; and 8 ) the percent of patients without
contraindications to thrombolysis receiving thrombolytic therapy during the hospital
stay and having a time from hospital arrival to thrombolysis of 30 minutes or less and
one aggregate P4P compliance variable.
Each of the eight individual variables is coded as a binary variable with the
option o f being non-applicable for a particular patient. Therefore, the aspirin at arrival
37
Reproduced with permission of the copyright owner. Further reproduction prohibited without permission.
indicator is coded as 1 for yes, 0 for no, and 99 for not applicable. Not applicable
codes are used in instances such as a contraindication to aspirin at arrival (e.g. aspirin
allergy, active bleeding on arrival, Coumadin/warfarin as pre-arrival medication) or
where the measure does not apply such as no thrombolysis therapy was given or the
patient is not a smoker.
In addition to the eight individual regressors o f interest, another variable titled
“All Applicable P4P Measures” was created to reflect patients who received all
recommended AMI process measures where applicable. The all applicable P4P
measures variable is coded as 1 for yes and 0 for no with no option o f not applicable.
The process for determination o f the pay-for-performance scores is as follows:
all patients identified to have an acute myocardial infarction through a discharge
diagnosis coded as 410.00 through 410.92 are included in the MIDAS+ AMI Core
Measure Study. Abstractors review each patient record for those individuals included
in the AMI Core Measure Study and determine whether the patient had a
contraindication to any o f the eight measures. If the patient did have a
contraindication, he/she was excluded from the denominator for the compliance score
for that particular indicator. Therefore, the denominators for the eight individual
measures are different from each other. After each patient’s record is reviewed for
compliance with the performance metrics, a quality assurance check is completed by
another individual internally. After data is sent from MIDAS+ to CMS for
participation in the Hospital Quality Alliance, CMS’ designated Quality Improvement
Organization (QIO) Lumetra, does their own quality assurance check on each
38
Reproduced with permission of the copyright owner. Further reproduction prohibited without permission.

hospital’s data. If the Lumetra quality assurance review does not indicate at least 80%
congruence with the hospital data then the hospital does not receive the full Medicare
payment associated with participation in HQA. There were no instances o f data
congruence between Scripps Health facilities and Lumetra less than 80% during this
study’s time frame.
Patient Demographics
There are certain patient attributes that are difficult, if near impossible, to
change. These variables categorized as Patient Demographics often have a significant
impact upon outcomes so it is important to control for as many of these variables as
possible. The patient demographic variables included in this model are: age; race;
gender; payor and primary care physician as proxies for access to care; martial status;
and religion. Ideally, patients with the same clinical condition irrespective o f these
variables should receive the same treatment, however, the variables can impact
treatment decisions and often do affect outcomes.
Hospital Characteristics
There are certain hospital characteristics that may give patients treated in one
hospital a better chance of survival than patients treated in another hospital with
different characteristics. The following hospital characteristics may advantage patients
and are therefore included in this model: high FTE per adjusted occupied bed rates;
having a Rapid Response Team; having a Chest Pain Center; being received an award
for Excellence for Cardiovascular Care; having high hospital and average physician
39
Reproduced with permission of the copyright owner. Further reproduction prohibited without permission.

AMI volumes; having a low ratio of AMI patients to ICU beds; having better payor
mixes; being a teaching hospital; and having surgical back-up. These variables were
collected through interviews with physicians and cardiovascular administrators at
Scripps Health and through other databases used in the Strategic Planning, Human
Resources, and Finance departments. A variable for facility was also included in the
model.
Patient’s Medical Condition
A patient’s medical condition can have a large impact upon outcomes. It goes
without saying that sicker patients have an increased risk of mortality. Sicker patients
are determined to be those with multiple comorbidities and those with many or severe
complications. There are certain comorbidities that may increase a patient’s risk of
mortality due to the fact that these conditions are considered to be risk factors for heart
disease and/or AMI. The risk factors that are included as variables in this model are:
CAD; prior MI; family history of CAD; dyslipidemia; diabetes; hypertension; obesity;
and depression. Comorbidities were determined from additional chronic illnesses, self
medical history, and family medical history that were not only documented in the
medical record but also in either the MIDAS+ or TRENDSTAR electronic system.
Treatment
The type of treatment that a patient has may impact his/her survival. Surgeries
(CABG surgery and other open heart surgery) are invasive procedures that are
inherently more risky and may have higher rates of inpatient mortality than less
40
Reproduced with permission of the copyright owner. Further reproduction prohibited without permission.

invasive procedures. Angioplasty and thrombolytic therapy are other common,
medically recognized treatment options for AMI patients. Patients who do not have
surgery, angioplasty, or thrombolytic therapy and who have another primary cardiac
diagnostic or treatment procedure or who have no cardiac treatment may be at higher
risk for short and long term mortality than those who have an intervention known to
improve outcomes for heart attack patients.
Months since admission to censor date is also included as an independent
variable. Potential days survival until the censor date of October 1, 2006 is longer for
patients admitted in 2003 than for patients admitted in 2004 or 2005. The months since
admission variable was added to help control for this difference.
Patient’s Behavior
While Patient Demographics captures patient attributes that are inherent or
hard to change, Patient’s Behavior is a category of variables that are more easily
subject to change. Perhaps the single most important patient behavior responsible for
increased morbidity and mortality is smoking status.
Smoking status is an item usually collected through Scripps Health’s paper
medical record documents rather than electronically. Unfortunately, not all providers
document smoking status in a consistent fashion in the paper chart. MIDAS+ does
collect whether a patient was a smoker within the past 12 months. For feasibility and
reliability purposes, I will use this data field and categorize smokers as those who have
41
Reproduced with permission of the copyright owner. Further reproduction prohibited without permission.

smoked within the past 1 2 months and non-smokers as those who have not smoked
within the past 1 2 months.
S t u d y D e s ig n
This study has two aims: to determine the relationship between participation in
a pay-for-performance program and scores on process measures and to determine
whether pay-for-performance programs succeed in improving the overall quality of
patient care. Analyses to address both aims use the same study design: a quasi-
experimental time series design.
The study design for this analysis is depicted below.
Oi O2 O3 X O4 O5 06
Oi represents AMI performance metric scores from January to June, 2003, O2 from
July to December, 2003, O3 from January to June, 2004 O4 from July to December,
2004, O5 from January to June, 2005, and 06 from July to December, 2005. X
represents the implementation o f the Hospital Quality Alliance and Scripps Health
participation in this precursor to a pay-for-performance program. Based upon the
outcome patterns of patients treated in the Scripps Health system during the
observations one through six, one can infer whether pay-for-performance had an effect
on the performance metric scores.
According to Campbell and Stanley, the time series design controls many
internal threats to validity including maturation, testing, regression, selection,
80mortality, and interactions such as the interaction of selection and maturation.
42
Reproduced with permission of the copyright owner. Further reproduction prohibited without permission.

Maturation could occur if providers were getting better at treating AMI patients over
time, however, it is unlikely maturation would occur over one time period and not the
others. Furthermore, the instrumentation for data collection did not change over this
time period, so instrumentation is not a likely threat to internal validity. However, the
time series design does not control for the effect o f history. If history is not controlled,
then one cannot rule out the rival hypothesis that a simultaneous event produced the
changed in performance metric scores rather than the pay-for-performance program.
An additional analysis was conducted to address the threat to internal validity
from history. This difference-in-differences analysis compares participants of pay-for-
performance programs. It is difficult to identify and measure performance o f control
group hospitals (i.e. hospitals that did not participate in the Hospital Quality Alliance)
as almost all hospitals nation-wide participate in the HQA. These non-participating
hospitals may be less comparable to the Scripps hospitals because they are unique
facilities such as the Naval Medical Center and the Veteran’s Administration.
However, there is a group of hospitals that began a true P4P program before the HQA
began. The Premier, Inc. hospital system began participating in a pay-for-performance
program as a demonstration project with CMS. The Premier Hospital Quality
Incentive Demonstration began in 2003 whereas the Hospital Quality Alliance began
in 2004.
For the Premier, Inc. hospitals, one would expect that if P4P led to better
compliance with performance metrics, then the Premier hospitals would experience a
higher rate o f compliance with the performance metrics once they began their P4P
43
Reproduced with permission of the copyright owner. Further reproduction prohibited without permission.
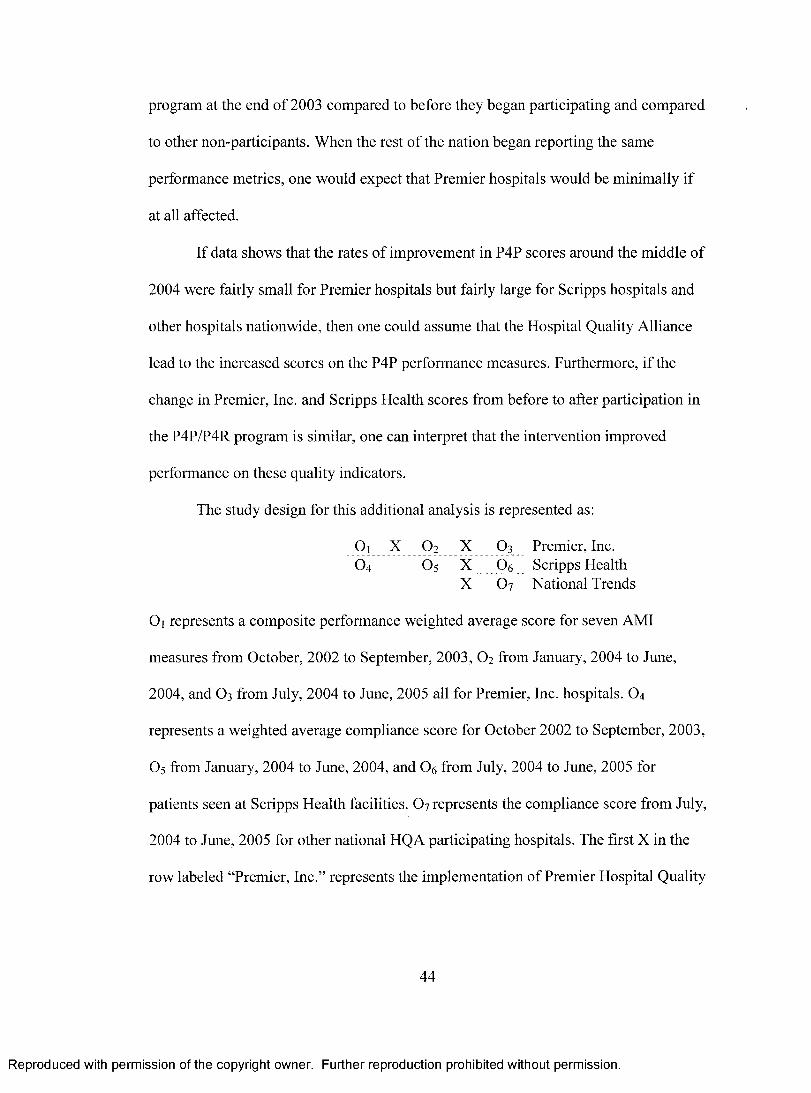
program at the end of 2003 compared to before they began participating and compared
to other non-participants. When the rest of the nation began reporting the same
performance metrics, one would expect that Premier hospitals would be minimally if
at all affected.
If data shows that the rates of improvement in P4P scores around the middle of
2004 were fairly small for Premier hospitals but fairly large for Scripps hospitals and
other hospitals nationwide, then one could assume that the Hospital Quality Alliance
lead to the increased scores on the P4P performance measures. Furthermore, if the
change in Premier, Inc. and Scripps Health scores from before to after participation in
the P4P/P4R program is similar, one can interpret that the intervention improved
performance on these quality indicators.
The study design for this additional analysis is represented as:
Oi X O2 X O3 Premier, Inc.O4 O5 X 06 Scripps Health
X 6 7 National Trends
Oi represents a composite performance weighted average score for seven AMI
measures from October, 2002 to September, 2003, O2 from January, 2004 to June,
2004, and O3 from July, 2004 to June, 2005 all for Premier, Inc. hospitals. O4
represents a weighted average compliance score for October 2002 to September, 2003,
O5 from January, 2004 to June, 2004, and 06 from July, 2004 to June, 2005 for
patients seen at Scripps Health facilities. O7 represents the compliance score from July,
2004 to June, 2005 for other national HQA participating hospitals. The first X in the
row labeled “Premier, Inc.” represents the implementation of Premier Hospital Quality
44
Reproduced with permission of the copyright owner. Further reproduction prohibited without permission.

Incentive Demonstration program which began October 1, 2003, whereas the other
three X ’s represent implementation of the HQA.
This modified recurrent institutional cycle design does control for the threat of
history.
S t a t is t ic a l M e t h o d s
Study Aim 1
To test the relationship between participation in the HQA and process measure
scores, time series observations on process measure compliance were collected.
Logistic regression analyses were conducted to determine whether the slope and
intercept of the process measure compliance scores changed pre-HQA to post-HQA.
“Logistic regression is a mathematical modeling approach that can be used to describe
81the relationship of several x’s [covariates] to a dichotomous dependent variable.”
The equation for the logistic regression that was conducted is
y = po + Pifi + P2 O2 *x) + P3X
where y is compliance with the process measure, Po is the constant/intercept, p is the
coefficient, t is a variable for time and x is a variable to denote a post-HQA score.
The logistic regression analysis was run for each of the process measures
independently with the process measure as the dependent variable. The post-HQA
variable included in the analysis was coded as 0 for a pre-HQA score and 1 for a post-
HQA score. The other covariate included in the analysis was a time variable which
was coded as 1, 2 or 3 for the three observations before HQA and the three
45
Reproduced with permission of the copyright owner. Further reproduction prohibited without permission.
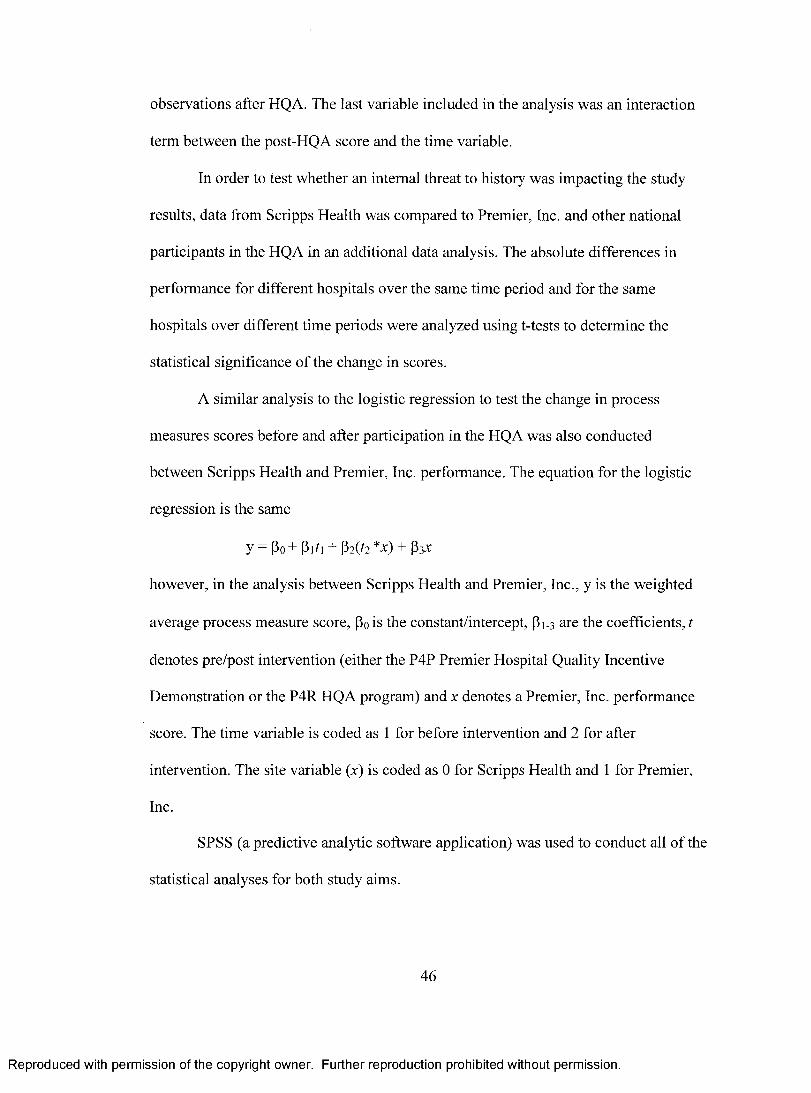
observations after HQA. The last variable included in the analysis was an interaction
term between the post-HQA score and the time variable.
In order to test whether an internal threat to history was impacting the study
results, data from Scripps Health was compared to Premier, Inc. and other national
participants in the HQA in an additional data analysis. The absolute differences in
performance for different hospitals over the same time period and for the same
hospitals over different time periods were analyzed using t-tests to determine the
statistical significance of the change in scores.
A similar analysis to the logistic regression to test the change in process
measures scores before and after participation in the HQA was also conducted
between Scripps Health and Premier, Inc. performance. The equation for the logistic
regression is the same
y = Po+ Plft + P2 ( / 2 *x) + P3X
however, in the analysis between Scripps Health and Premier, Inc., y is the weighted
average process measure score, p 0 is the constant/intercept, p i - 3 are the coefficients, t
denotes pre/post intervention (either the P4P Premier Hospital Quality Incentive
Demonstration or the P4R HQA program) and x denotes a Premier, Inc. performance
score. The time variable is coded as 1 for before intervention and 2 for after
intervention. The site variable (x) is coded as 0 for Scripps Health and 1 for Premier,
Inc.
SPSS (a predictive analytic software application) was used to conduct all of the
statistical analyses for both study aims.
46
Reproduced with permission of the copyright owner. Further reproduction prohibited without permission.

Study Aim 2
Survival analysis was used to determine pay-for-performance’s impact on
patient outcomes using days survival as the main outcome variable. Survival analysis
is the most appropriate statistical model to use because time is an important
component o f the outcome variable. “Survival analysis is a family o f techniques
dealing with the time it takes for something to happen: a cure, a failure, an employee
leaving, a relapse, a death, and so on.”
A Cox proportional hazard model was used to conduct the survival analysis.
By using a Cox proportional hazard model, no assumptions are made about the nature
or shape o f the hazard function. The model assumes that the underlying hazard rate
(rather than survival time) is a function of the independent variables . 8 3
The equation for the Cox proportional hazard model for individual i at time t is
hi(t) = X0 (Oexp{PiXii+...+pkxik}
The baseline hazard function (t) is the hazard for the individual when all
independent variables’ values are equal to zero, P is the coefficient, x is the covariate,
and h is the hazard o f death. “While no assumptions are made about the shape of the
underlying hazard function, the model equations.. .do imply two assumptions. First,
they specify a multiplicative relationship between the underlying hazard function and
the log-linear function of the covariates. This assumption is also called the
proportionality assumption. In practical terms, it is assumed that, given two
observations with different values for the independent variables, the ratio o f the hazard
functions for those two observations does not depend on time. The second
47
Reproduced with permission of the copyright owner. Further reproduction prohibited without permission.
assumption... is that there is a log-linear relationship between the independent
variables and the underlying hazard function . ” 8 3 Significance o f interaction terms
between each covariate and a time variable were analyzed to determine whether the
proportionality assumption was valid.
The outcome variable, days survival, was calculated with a censor date o f
October 1, 2006, therefore, if a patient had not passed away before October 1, 2006,
then he/she was censored. “A survival time is described as censored when there is a
follow-up time but the event has not yet occurred or is not known to have occurred . ” 8 4
All the covariates listed in the Empirical Variable column of Table 2 were
included for block entry by forward stepwise selection in the survival analysis. A
probability o f 0.05 was required for stepwise entry and a probability of 0.10 was
required for stepwise removal. A designated maximum of 20 iterations was used in the
stepwise selection o f covariates. After covariates were added into the model, forced
entry of one pay-for-performance metric was added so that only one of the regressors
of interest was in the model at one time. Hazard ratios were obtained for each
regressor o f interest on the full population of 3,954 patients and for each six month
time period between January 1, 2003 and December 31, 2005.
In addition, an analysis with forced entry of all covariates with no regressors of
interest was conducted on the total patient population in order to see the effect on the
hazard function for each individual covariate including those that were consistently
excluded from the model when stepwise variable selection was employed.
48
Reproduced with permission of the copyright owner. Further reproduction prohibited without permission.

While the primary data analysis was conducted using survival analysis,
additional outcome analyses were conducted using logistic regression.
The equation for a logistic model is:
z = a+PiXi+P2*2 +-• -+Pp^p
where z equals the odds o f mortality/readmissions, a is the intercept, P is the
coefficient, and x is the independent variable. All o f the covariates included in the
survival analysis (except months since admission to censor date) were included in the
logistic regression analyses, however, the outcome variable changed to alive/dead at
30 days and readmissions within 30 days. [The months since admission to censor date
variable was included in the survival analyses to control for the fact that patients
admitted earlier than others had greater potential days o f survival until censor time
than did patients admitted at later dates. With an outcome variable o f mortality at 30
days, this control variable is no longer needed as all patients were tracked for greater
than 30 days post-discharge regardless o f their admission or discharge date.] For the
logistic regressions, forward stepwise variable selection was employed with a
probability o f 0.05 for entry, 0.10 for removal and a maximum of 20 iterations. The
logistic regression analyses were conducted on the full model to determine whether
the process measures were significant predictors o f mortality and readmissions within
30 days. For measures that were statistically significant predictors of mortality and/or
readmissions, time series analyses looking at the hazard functions over all six
observational time periods were also conducted.
49
Reproduced with permission of the copyright owner. Further reproduction prohibited without permission.

Further logistic regression analyses were conducted to see whether the slope
and intercept o f the 30-day, 90-day, and 180-day mortality rates changed from before
participation in the FIQA to after participation in the HQA.
The equation for this logistic regression is
y = (3o + Pih + $2 ^ 2 *x) + P3X
where y is the mortality rate, Po is the constant/intercept, p 1 .3 are the coefficients, 1 is a
variable for time and x is a variable to denote a post-HQA score.
The logistic regression analysis was run three times with 30-day, 90-day, and
180-day mortality each as the dependent variable. This analysis is similar to that
conducted on the process measure scores with the post-HQA variable coded as 0 for a
pre-HQA score and 1 for a post-HQA score, the time variable coded as 1, 2 or 3 for
the three observations before HQA and the three observations after HQA, and
inclusion of the interaction term between the post-HQA score and the time variable.
R e s u l t s
Patient Characteristics
Refer to Table 3 for a listing of variable frequencies for non-continuous
variables and to Table 4 for a listing of variable means for continuous variables. For
the total patient population of AMI patients discharged from Scripps Health facilities
from January 1, 2003 to December 31, 2005, 63% were men, 67% were Caucasian,
53% were married, and 69% stated a religious affiliation. The average age of patients
was 70 years. Thirty percent o f the patients were seen at Scripps Memorial Hospital
50
Reproduced with permission of the copyright owner. Further reproduction prohibited without permission.

La Jolla, 29% at Scripps Mercy Hospital San Diego, 18% at Scripps Mercy Hospital
Chula Vista, 17% at Scripps Green Hospital, and six percent at Scripps Memorial
Hospital Encinitas. Thirty-one percent o f patients identified a primary care provider
and 96% identified a payor.
One hundred percent of patients had coronary artery disease, seven percent had
a previous myocardial infarction, two percent had a family history o f coronary artery
disease, 37% had dyslipidemia, 29% had diabetes, 62% had hypertension, seven
percent were obese, four percent were depressed and 18% were smokers within the
past 12 months. Again, it is important to note that the results are dependent upon
having comorbidities documented in the medical record as well as the electronic
system. The actual incidence o f comorbidities may be higher than these reported
statistics due to the fact that patients may not mention additional illnesses to their
physicians, physicians may not document all additional illnesses in the medical record,
and/or additional illnesses may be not be able to be documented through the electronic
systems as only a limited number of diagnoses can be tracked.
Out o f the various treatment options, eight percent of patients received CABG
surgery, one percent had other open heart surgery, 53% had a percutaneous coronary
intervention, four percent had thrombolytic therapy, 58% had another primary cardiac
diagnostic or treatment procedure (e.g., angiocardiogram, cardiac cath), and 23% had
no cardiac treatment. The percentages of patients with different treatment options add
up to more than 1 0 0 % because some patients had more than one o f the listed
interventions/treatments.
51
Reproduced with permission of the copyright owner. Further reproduction prohibited without permission.
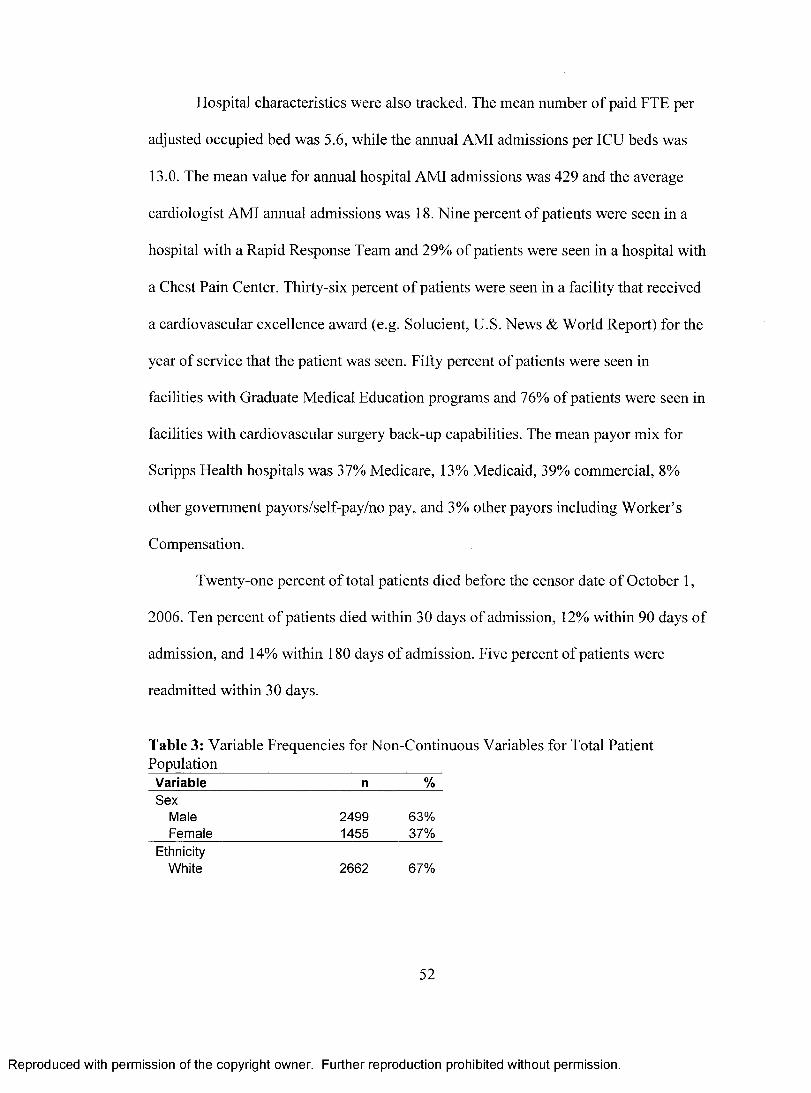
Hospital characteristics were also tracked. The mean number o f paid FTE per
adjusted occupied bed was 5.6, while the annual AMI admissions per ICU beds was
13.0. The mean value for annual hospital AMI admissions was 429 and the average
cardiologist AMI annual admissions was 18. Nine percent of patients were seen in a
hospital with a Rapid Response Team and 29% of patients were seen in a hospital with
a Chest Pain Center. Thirty-six percent o f patients were seen in a facility that received
a cardiovascular excellence award (e.g. Solucient, U.S. News & World Report) for the
year of service that the patient was seen. Fifty percent of patients were seen in
facilities with Graduate Medical Education programs and 76% of patients were seen in
facilities with cardiovascular surgery back-up capabilities. The mean payor mix for
Scripps Health hospitals was 37% Medicare, 13% Medicaid, 39% commercial, 8 %
other government payors/self-pay/no pay, and 3% other payors including Worker’s
Compensation.
Twenty-one percent o f total patients died before the censor date o f October 1,
2006. Ten percent o f patients died within 30 days of admission, 12% within 90 days of
admission, and 14% within 180 days o f admission. Five percent of patients were
readmitted within 30 days.
Table 3: Variable Frequencies for Non-Continuous Variables for Total Patient Population______________________________
Variable n %Sex
Male 2499 63%Female 1455 37%
EthnicityWhite 2662 67%
52
Reproduced with permission of the copyright owner. Further reproduction prohibited without permission.

African/American 126 3%Native American 5 0%Asian/Pac Islander 434 11%Other 638 16%Unknown 89 2%
Marital StatusSingle 921 23%Widowed 687 17%Divorced/Separated 232 6%Married 2114 53%
ReligionStated Religion 2699 69%No Stated Religion 1219 31%
FacilityChula Vista 713 18%Encinitas 249 6%Green 663 17%La Jolla 1173 30%Mercy 1156 29%
Identified PCPNo/Unknown 2731 69%Yes 1223 31%
Identified PayorNo/Unknown 164 4%Yes 3790 96%
CensoredYes/Alive 3135 79%No/Dead 819 21%
ACEI or ARB for LVSDNo 125 23%Yes 430 77%Not Applicable 3399
Smoking Cessation AdviceNo 157 24%Yes 492 76%Not Applicable 3305
Aspirin at ArrivalNo 121 5%Yes 2449 95%Not Applicable 1384
Aspirin at Discharge No 185 6%Yes 2977 94%Not Applicable 792
Beta Blocker at ArrivalNo 205 9%
53
Reproduced with permission of the copyright owner. Further reproduction prohibited without permission.

Yes 2010 91%Not Applicable 1739
Beta Blocker at DischargeNo 324 11%Yes 2742 89%Not Applicable 888
Thrombolysis w/in 30 minNo 113 75%Yes 38 25%Not Applicable 3803
PCI w/in 120 minNo 237 56%Yes 188 44%Not Applicable 3529
All Applicable P4P MeasuresNo 1055 27%Yes 2899 73%
CABG TreatmentNo 3650 92%Yes 304 8%
Other Open Heart SurgeryNo 3906 99%Yes 48 1%
PCI/Angioplasty TxNo 1849 47%Yes 2105 53%
Thrombolysis TreatmentNo 3787 96%Yes 167 4%
Oth Cardiac Proc (Dx or Tx)No 1670 42%Yes 2284 58%
No Cardiac TreatmentNo 3032 77%Yes 922 23%
CADNo 3 0%Yes 3951 100%
Prior MlNo 3661 93%Yes 293 7%
Family History of CADNo 3871 98%Yes 83 2%
DyslipidemiaNo 2478 63%
54
Reproduced with permission of the copyright owner. Further reproduction prohibited without permission.

Yes 1476 37%Diabetes
No 2825 71%Yes 1129 29%
HypertensionNo 1503 38%Yes 2451 62%
ObesityNo 3683 93%Yes 271 7%
DepressionNo 3799 96%Yes 155 4%
SmokerNo or Unknown 3247 82%Yes 707 18%
Readmit w/in 30 daysNo 3748 95%Yes 206 5%
Rapid Response TeamNo 3616 91%Yes 338 9%
Chest Pain CenterNo 2798 71%Yes 1156 29%
Cardiovascular Award Yr of VisitNo 2514 64%Yes 1440 36%
Teaching Hospital StatusNo 1985 50%Yes 1969 50%
Surgical Back-UpNo 962 24%Yes 2992 76%
30-Day MortalityAlive 3554 90%Dead 400 10%
90-Day MortalityAlive 3470 88%Dead 484 12%
180-Day MortalityAlive 3382 86%Dead 572 14%
Reproduced with permission of the copyright owner. Further reproduction prohibited without permission.

Table 4: Variable Means for Continuous Variables for Total Patient PopulationVariable MeanAge 69.67Months Since Admission 26.64Paid FTE/Adjusted Occupied Bed 5.60Hospital Annual AMI Admits 428.86Avg Annual Cardiologist AMI Admits 18.30Annual AMI Admits / ICU Beds 13.01Payor: % Medicare 36.59Payor: % MediCal 13.35Payor: % Commercial 38.65Payor: % Other Gvmt Payors / Self Pay 8.45Payor: % Other / Workers Comp 3.10
Some of the patient characteristics changed over the observational time
periods. See Attachment V for a full listing of variable frequencies at each
observational time period and Table 5 for means o f age and hospital characteristics at
each observational time period. The percent o f male patients ranged from 63% - 69%
in the time periods after participation in the HQA compared to 60% - 61% before. The
mean age o f patients ranged from 70 - 71 years during observations one through three
and ranged from 67 - 70 years during observations four through six. Observation time
period two and three (from July 1, 2003 to June 30, 2004) had a high percent of
Asian/Pacific Islander patients (18% - 22%) compared to the other time periods where
the percent of Asian/Pacific Islander patients ranged from five to nine. As previously
noted, AMI patients seen at Encinitas from January 1, 2003 to June 30, 2004 were not
included in the analysis, which impacted the percent o f patients seen at each Scripps
facility before compared to after participation in HQA. The total patient volume
remained similar over this time frame. Forty-five percent of patients from July 1, 2005
56
Reproduced with permission of the copyright owner. Further reproduction prohibited without permission.
to December 31, 2005 identified a PCP compared to a range from 27% - 34% in the
other time periods.
[Because patients from Encinitas were not included before participation in the
HQA, analyses were conducted excluding Encinitas patients after participation in
HQA to see if the results would change. The general findings remained the same
whether post-HQA Encinitas patients were included or not.]
The percent o f patients treated with PCI generally trended upward over time.
The percent o f patients with thrombolytic therapy slightly decreased over time. There
was also an increase in other primary cardiac diagnostic and treatment procedures
from before to after participation in HQA. Conversely, the percent of patients
receiving no cardiac treatment decreased steadily from 30% during observation one to
17% in observation six.
There were small increases from before and after participation in HQA with
patients who had a family history of CAD (one percent before to three percent after)
and patients who had dyslipidemia (30% - 35% before to 40% - 47% after).
Hospital-wide paid FTE per adjusted occupied bed increased from 5.3 in
observation one to 5.8 in observation six. Rapid Response Teams began being
deployed in 2005 and were not present until then. The percent of patients seen in a
hospital who received a cardiovascular clinical excellence award during the year of the
patient’s visit was lower in 2003 (21% - 23%) than in 2004 and 2005 (33% - 48%).
Annual hospital AMI admissions decreased in 2005 (362 - 369) compared to 2003 and
57
Reproduced with permission of the copyright owner. Further reproduction prohibited without permission.

2004 (444 - 464). The annual AMI admissions per ICU bed decreased in 2005 (mean
of 11) compared to a mean of 14 in 2003 and 2004
Changes in the regressors of interest over the time periods are detailed in
Figures 1-9. The majority of the pay-for-performance metrics increased in compliance
over this timeframe. Process measure scores are discussed in more detail in the
Process Measure Analysis section. [Note: The denominators (i.e., n) of the individual
regressors o f interest are different from each other during the same time periods
because of instances where the measure is not applicable to certain patients, as
explained in the Data Elements section.]
The percent o f patients who had died before the censor date was highest for the
earlier time periods (i.e., earlier discharge dates) and lowest for the later time periods,
which is as expected. Given that the follow-up time until censoring is longer for the
patients admitted earlier, there is greater opportunity for the patients in the earlier
observation periods to be determined to be deceased. The percent of patients who had
died within 30 days of discharge decreased from 13% in observation one to eight
percent in observation six. Similar results were seen in 90-day mortality which
decreased over the same time period from 15% to 1 0 %, and 180-day mortality which
decreased from 18% to 1 1 %.
Table 5: Means of Age and Hospital Characteristics at Each Observation Time Period1/1/03- 7/1/03- 1/1/04- 7/1/04- 1/1/05- 7/1/05-
Variables 6/30/03 12/31/03 6/30/04 12/31/04 6/30/05 12/31/05Age 71.03 71.75 70.09 68.78 67.43 69.52Paid FTE per Adj Occ Bed 5.33 5.52 5.48 5.71 5.73 5.84Hosp Annual AMI Admits 460.38 444.23 453.49 463.94 362.15 368.94
58
Reproduced with permission of the copyright owner. Further reproduction prohibited without permission.

Avg Cardiologist AMI Vol 17.94 17.80 19.26 20.15 16.73 16.97AMI Admits/ICU Beds 14.21 13.95 13.65 13.90 10.89 10.99Payor: % Medicare 37.14 37.92 35.61 34.70 37.67 37.51Payor: % MediCal 14.00 13.93 13.84 12.97 12.75 12.63Payor: % Commercial 37.14 36.52 39.11 41.73 37.81 38.21Payor: % Oth Gvmt/SIf Py 8.90 8.87 8.25 7.58 8.76 8.69Payor: % Oth (Wrk Comp) 2.95 2.87 3.18 3.02 3.30 3.28
Pay-for-Performance Process Measure Analysis
Scripps Performance Results
Compliance with providing all the applicable AMI process measures increased
at Scripps Health over all six observations, going from 60% at observation one to 8 6 %
at observation six. See Figure 1. The logistic regression for patients receiving all
applicable P4P measures identified that time (beta, 0.28; p < 0.0001) and the post-
HQA/site (beta, 0.68; p = 0.0002) variables were statistically significant. See Table 6 .
Figure 1: All Applicable P4P Measure Compliance Over Time
All Applicable P4P Measures
100%90%80%70%60%50%40%30%20%10%0%
n=642
1/1/03-
n=548
7/1/03-
2Z2%_ * -75% '
n=734 n=836 n=668
1/1/04- 7/1/04-
86%
n=526
1/1/05- 7/1/05-6/30/03 12/31/03 6/30/04 12/31/04 6/30/05 12/31/05
59
Reproduced with permission of the copyright owner. Further reproduction prohibited without permission.

Table 6: Logistic Regression Results of Scripps Process Measure Scores Before and After HQA________________________________________________________________Regressor of Interest B S.E. Wald df Sig. Exp(B)
95% Cl Exp(B) Lower Upper
All Applicable P4PTime 0.2784 0.0575 23.411 1 0.0000 1.3210 1.1801 1.4787Post 0.6754 0.1837 13.514 1 0.0002 1.9648 1.3707 2.8165Post by Time 0.0564 0.0921 0.3753 1 0.5401 1.0580 0.8833 1.2673Constant 0.1140 0.1240 0.8454 1 0.3579 1.1208
Aspirin at ArrivalTime 0.0877 0.1333 0.4329 1 0.5106 1.0917 0.8406 1.4178Post 0.0943 0.5025 0.0352 1 0.8511 1.0989 0.4104 2.9426Post by Time 0.4691 0.2807 2.7934 1 0.0947 1.5986 0.9222 2.7713Constant 2.5121 0.2794 80.837 1 0.0000 12.3313
Aspirin at DischargeTime 0.1729 0.1079 2.5697 1 0.1089 1.1888 0.9622 1.4687Post 0.7039 0.4060 3.0061 1 0.0829 2.0216 0.9123 4.4797Post by Time 0.2073 0.2168 0.9142 1 0.3390 1.2304 0.8044 1.8819Constant 2.0316 0.2276 79.657 1 0.0000 7.6264
Beta Blocker at ArrivalTime 0.1889 0.1048 3.2504 1 0.0714 1.2079 0.9837 1.4834Post 1.5529 0.4324 12.899 1 0.0003 4.7251 2.0248 11.027Post by Time -0.2458 0.2099 1.3705 1 0.2417 0.7821 0.5183 1.1802Constant 1.5353 0.2157 50.645 1 0.0000 4.6425
Beta Blocker at DischargeTime 0.1300 0.0892 2.1246 1 0.1450 1.1388 0.9562 1.3563Post 0.2992 0.3006 0.9909 1 0.3195 1.3488 0.7483 2.4313Post by Time 0.2590 0.1559 2.7594 1 0.0967 1.2956 0.9545 1.7587Constant 1.5555 0.1917 65.844 1 0.0000 4.7376
Smoking Cessation AdviceTime 0.3486 0.1433 5.9188 1 0.0150 1.4171 1.0701 1.8767Post 0.2455 0.4720 0.2706 1 0.6029 1.2783 0.5069 3.2238Post by Time 0.3639 0.2454 2.1987 1 0.1381 1.4390 0.8895 2.3280Constant 0.0492 0.3129 0.0248 1 0.8750 1.0505
ACEI or ARB for LVSDTime -0.0971 0.1608 0.3641 1 0.5462 0.9075 0.6621 1.2438Post -0.6955 0.5127 1.8407 1 0.1749 0.4988 0.1826 1.3624Post by Time 0.5573 0.2614 4.5455 1 0.0330 1.7460 1.0460 2.9143Constant 1.2881 0.3441 14.015 1 0.0002 3.6260
Thrombolysis w/in 30 minsTime 0.1698 0.3050 0.3099 1 0.5777 1.1851 0.6518 2.1548Post -0.8566 1.0094 0.7201 1 0.3961 0.4246 0.0587 3.0705Post by Time 0.1838 0.4901 0.1406 1 0.7077 1.2018 0.4598 3.1407Constant -1.1957 0.6010 3.9587 1 0.0466 0.3025
PCI w/in 120 minutesTime 0.8992 0.1952 21.220 1 0.0000 2.4575 1.6763 3.6029
60
Reproduced with permission of the copyright owner. Further reproduction prohibited without permission.
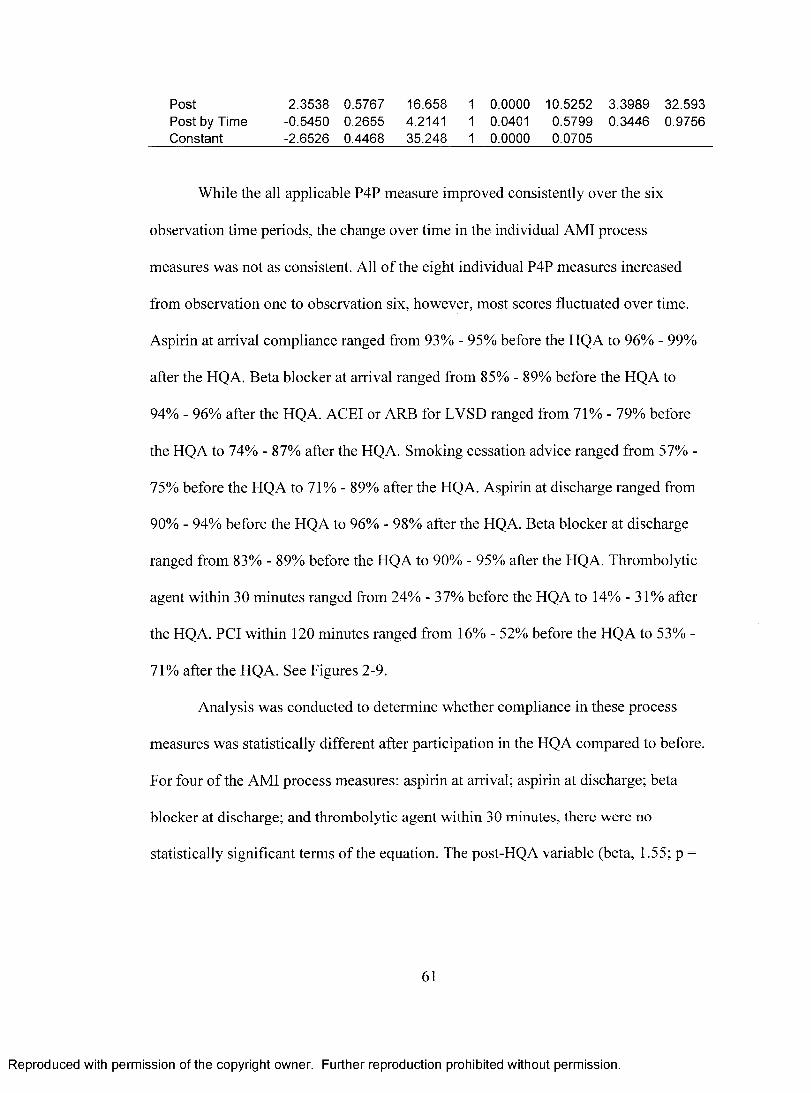
Post 2.3538 0.5767 16.658 1 0.0000 10.5252 3.3989 32.593Post by Time -0.5450 0.2655 4.2141 1 0.0401 0.5799 0.3446 0.9756Constant -2.6526 0.4468 35.248 1 0.0000 0.0705
While the all applicable P4P measure improved consistently over the six
observation time periods, the change over time in the individual AMI process
measures was not as consistent. All o f the eight individual P4P measures increased
from observation one to observation six, however, most scores fluctuated over time.
Aspirin at arrival compliance ranged from 93% - 95% before the HQA to 96% - 99%
after the HQA. Beta blocker at arrival ranged from 85% - 89% before the HQA to
94% - 96% after the HQA. ACEI or ARB for LVSD ranged from 71% - 79% before
the HQA to 74% - 87% after the HQA. Smoking cessation advice ranged from 57% -
75% before the HQA to 71% - 89% after the HQA. Aspirin at discharge ranged from
90% - 94% before the HQA to 96% - 98% after the HQA. Beta blocker at discharge
ranged from 83% - 89% before the HQA to 90% - 95% after the HQA. Thrombolytic
agent within 30 minutes ranged from 24% - 37% before the HQA to 14% - 31% after
the HQA. PCI within 120 minutes ranged from 16% - 52% before the HQA to 53% -
71% after the HQA. See Figures 2-9.
Analysis was conducted to determine whether compliance in these process
measures was statistically different after participation in the HQA compared to before
For four o f the AMI process measures: aspirin at arrival; aspirin at discharge; beta
blocker at discharge; and thrombolytic agent within 30 minutes, there were no
statistically significant terms of the equation. The post-HQA variable (beta, 1.55; p =
61
Reproduced with permission of the copyright owner. Further reproduction prohibited without permission.

0.0003) was statistically significant in the beta blocker at arrival equation. Time was
the only variable with a statistically significant beta/coefficient for smoking cessation
advice (beta, 0.35; p = 0.015). ACEI or ARB for LVSD had statistically significant
coefficients for the interaction term between post-HQA and time (beta, 0.56; p =
0.033). The time variable (beta, 0.90; p < 0.0001), the post-HQA variable (beta, 2.35;
p < 0.0001), and the interaction term (beta, -0.55; p = 0.04) were all statistically
significant for PCI within 120 minutes. See Table 6 .
Figure 2: Aspirin at Arrival Compliance Over Time
Aspirin at Arrival
100%99%
96%
94%i3%92%
90%n=489 n=414 n=457 n=497 n=409 n=304
88%1/1/03- 7/1/03- 1/1/04- 7/1/04- 1/1/05- 7/1/05-6/30/03 12/31/03 6/30/04 12/31/04 6/30/05 12/31/05
62
Reproduced with permission of the copyright owner. Further reproduction prohibited without permission.

Figure 3: Beta Blocker at Arrival Compliance Over Time
! Beta Blocker at Arrival
100%
I 96%95%
90% 89%
85%
80% r
n=420 n=380 n=400 n=344n=40575%
1/1/03-6/30/03
7/1/03-12/31/03
1/1/04-6/30/04
7/1/04-12/31/04
1/1/05-6/30/05
7/1/05-12/31/05
Figure 4: ACEI or ARB for LVSD Compliance Over Time
ACEI for LVSD
90%87%
85%80% 79%75%70%65%60%55%
*4%71%
n=89 n=94 n=69n=10650%1/1/03- 7/1/03- 1/1/04- 7/1/04- 1/1/05- 7/1/05-6/30/03 12/31/03 6/30/04 12/31/04 6/30/05 12/31/05
Reproduced with permission of the copyright owner. Further reproduction prohibited without permission.

Figure 5: Smoking Cessation Advice/Counseling Compliance Over Time
Smoking Cessation Advice
95% 90% 85% 80% 75% 70% 65% 60%
; 55% ! 50%
89%
-♦ 73% 71%
57%n=101 n=130 n=129 n=93
1/1/03-6/30/03
7/1/03-12/31/03
7/1/05-12/31/05
1/1/04-6/30/04
7/1/04-12/31/04
1/1/05-6/30/05
Figure 6: Aspirin at Discharge Compliance Over Time
Aspirin at Discharge
100%98%98%
96%94%92%
156%
94%
90%88%
86% n=527 n=451 n=585 n=669 n=51684%
1/1/03- 7/1/03- 1/1/04- 7/1/04- 1/1/05- 7/1/05-6/30/03 12/31/03 6/30/04 12/31/04 6/30/05 12/31/05
64
Reproduced with permission of the copyright owner. Further reproduction prohibited without permission.

Figure 7: Beta Blocker at Discharge Compliance Over Time
Beta Blocker at Discharge
100%
95%
90% 90%89%
85%;3%
80%
n=491 n=439 n=649 n=515 n=41475%
1/1/03-6/30/03
7/1/03-12/31/03
1/1/04-6/30/04
7/1/04-12/31/04
1/1/05-6/30/05
7/1/05-12/31/05
Figure 8: Thrombolytic Agent Within 30 Minutes Compliance Over Time
Thrombosis w/in 30 min
100%90%80%70%60%50%40%30%20%10%0%
28%!4%4%
n=18 n=28 n=21 n=16n=38 n=30
1/1/03- 7/1/03- 1/1/04- 7/1/04- 1/1/05- 7/1/05-6/30/03 12/31/03 6/30/04 12/31/04 6/30/05 12/31/05
65
Reproduced with permission of the copyright owner. Further reproduction prohibited without permission.

Figure 9: PCI Within 120 Minutes Compliance Over Time
PCI w/in 120 min
100%90%80%70%60%50%40%30%20%10%0%
!6%52%
28%
n=77 n=68n=72 n=67 n=58
1/1/03- 7/1/03- 1/1/04- 7/1/04- 1/1/05- 7/1/05-6/30/03 12/31/03 6/30/04 12/31/04 6/30/05 12/31/05
Premier, Inc. and Scripps Health Performance Results
The data collected in order to determine whether other events in history could
create another legitimate rival hypothesis to P4P as a causal factor for increased
performance metric scores showed that Premier, Inc. and Scripps Health scores
increased at each time interval analyzed. See Figure 10 and Table 7.
Scripps Health and Premier, Inc. hospitals started out at statistically
significantly different levels of performance with the AMI P4P indicators as measured
by the weighted average score (absolute difference, 7.7; 95 Cl, 6 .9-8.5; p < 0.0001).
See Table 8 . After Premier hospitals began participating in the Premier Hospital
Quality Incentive Demonstration, their performance increased (absolute difference,
1.3; 95 Cl, 0.9-1.6 ; p < 0.0001) as did Scripps (absolute difference, 2.7; 95 Cl, 1.0-4.3;
p = 0.002), although Scripps did not participate in any P4P or P4R program over this
66
Reproduced with permission of the copyright owner. Further reproduction prohibited without permission.

time. The process measure scores of the two facilities were still significantly different
(absolute difference, 6.3; 95 Cl, 5.3-7.3; p < 0.0001) at the second observation from
1/04-6/04.
Between observation two (1/04-6/04) and observation three (7/04-6/05), both
health systems began participating in the HQA. From time two to time three, Premier,
Inc. improved its performance at a statistically significant level (absolute difference,
0.9; 95 Cl, 0.6-1.1; p < 0.0001) as did Scripps Health (absolute difference, 4.9; 95 Cl,
3.5-6.4; p < 0.0001), yet their performance was still statistically different from each
other (absolute difference, 2.2; 95 Cl, 1.5-2.9; p < 0.0001). [Of note for the time
period three is that the Scripps Health facilities’ performance was similar (i.e., not
statistically different) to that of other HQA participants nation-wide.]
Scripps Health and Premier, Inc. had different levels o f performance during the
first observation. The ceiling o f performance is 100%, so Premier, Inc. starting at 93%
compliance with the process measures had less opportunity to improve than did
Scripps Health at 85% compliance. Because the two systems started out at different
levels of performance, the slope and intercepts o f their levels o f performance were
tested against each other. The time variable (beta, 0.23; p = 0.002) and the Premier/site
variable (beta, 0.85; p < 0.0001) were both statistically significant in the comparison
of facility scores from observation one to observation two. See Table 9. From
observation two to observation three, the time variable (beta, 0.59; p < 0.0001), the
Premier variable (beta, 1.23 ; p < 0 .0001) and the time and site interaction variable
(beta, -0.41, p < 0.0001) were all statistically significant. See Table 10.
67
Reproduced with permission of the copyright owner. Further reproduction prohibited without permission.

Figure 10: Premier, Inc. and Scripps Health Weighted Average AMI Process Measure Compliance Over Time
Weighted Average AMI Process Measure Score
100%
95%
90%
85%
80%
75%
10/02-9/03 1/04-6/04 7/04-6/05
■ Premier ■«— Scripps
Table 7: Premier, Inc., Scripps Health, and Other National HQA Participants’ Process Measure Scores
1 0 /0 2 -9 /0 3 1 /0 4 -6 /0 4 7/04-6/05Premier, Inc. % n % n % n
Aspirin on Arrival 96.4 (13,436) 95.9 (7,256) 96.1 (14,012)Aspirin at Discharge 96.8 (18,247) 96.9 (10,262) 96.8 (18,627)ACEI or ARB for LVSD 85.5 (4,115) 82.6 (2,384) 85.0 (2,394)Beta Blocker on Arrival 93.3 (11,495) 92.7 (6,136) 94.3 (11,272)Beta Blocker at Discharge 94.4 (17,538) 95.0 (10,016) 95.8 (19,155)Smoking Cessation Advice 78.3 (5,520) 90.4 (1,322) 93.6 (6,220)Thrombolysis w/in 30 mins 41.8 (509) 47.8 (46) 38.5 (234)Weighted Average Score 93.1 (70,860) 94.3 (37,422) 95.2 (71,914)
Scripps HealthAspirin on Arrival 93.6 (1,054) 94.4 (517) 97.0 (756)Aspirin at Discharge 92.0 (1,075) 93.0 (627) 96.5 (1,100)ACEI or ARB for LVSD 76.6 (197) 64.3 (84) 83.8 (74)Beta Blocker on Arrival 84.0 (907) 84.5 (465) 93.1 (625)Beta Blocker at Discharge 82.9 (1,006) 86.3 (608) 91.9 (1,073)Smoking Cessation Advice 54.1 (196) 75.0 (76) 78.6 (238)Thrombolysis w/in 30 mins 27.6 (76) 18.2 (11) 20.8 (24)Weighted Average Score 85.3 (4,511) 88.0 (2,388) 93.0 (3,890)
Oth Nat'l HQA Participants
68
Reproduced with permission of the copyright owner. Further reproduction prohibited without permission.

Aspirin on Arrival 94.7 (376,314)Aspirin at Discharge 94.8 (406,184)ACEI or ARB for LVSD 82.3 (51,869)Beta Blocker on Arrival 90.6 (316,685)Beta Blocker at Discharge 93.4 (415,266)Smoking Cessation Advice 88.4 (129,657)Thrombolysis w/in 30 mins 38.0 (11,582)Weighted Average Score 92.4 (1,707,557)
Table 8: Differences in Performance Measure Scores Between Scripps Health, Premier, Inc., and Other National HQA Participants Before and After P4P and P4R
Wghtd Absolute DifferenceTimeframe Avg N Between Groups
Same Hosp; Diff Time date % # % 95% Cl p-valuePremier, Inc. Premier, Inc.
10/02-9/03 1/04 - 6/04
93.194.3
(70,860)(37,422)
1.3 0.9- 1.6 < 0.0001
Premier, Inc. Premier, Inc.
1/04 - 6/04 7/04 - 6/05
94.395.2
(37,422)(71,914)
0.9 0.6-1.1 < 0.0001
Scripps Health Scripps Health
10/02-9/03 1/04 - 6/04
85.388.0
(4,511)(2,388)
2.7 1.0-4.3 0.0022
Scripps Health Scripps Health
1/04 - 6/04 7/04 - 6/05
88.093.0
(2,388)(3,890)
4.9 3.5-6.4 < 0.0001
Same Time; Diff HospPremier, Inc. Scripps Health
10/02-9/0310/02-9/03
93.185.3
(70,860)(4,511)
7.7 6.9 - 8.5 < 0.0001
Premier, Inc. Scripps Health
1/04-6/041/04-6/04
94.388.0
(37,422)(2,388)
6.3 5.3-7.3 < 0.0001
Premier, Inc. Scripps Health
7/04 - 6/05 7/04 - 6/05
95.293.0
(71,914)(3,890) 2.2 1.5 -2.9 < 0.0001
Scripps Health 7/04 - 6/05 93.0 (3,890) 0.6 not statisticallyOth Nat'l HQA 7/04 - 6/05 92.4 (1,707,557) significantly different
Table 9: Scripps Health and Premier, Inc. Performance Before and After P4P95% Cl Exp(B)
Before P4P B S.E. Wald df Sig. Exp(B) Lower UpperTime 0.2326 0.0758 9.4159 1 0.0022 1.2618 1.0877 1.4639Premier 0.8546 0.1115 58.731 1 0.0000 2.3504 1.8890 2.9246Premier by Time -0.0204 0.0804 0.0641 1 0.8001 0.9798 0.8370 1.1470Constant 1.5295 0.1052 211.46 1 0.0000 4.6159
Note: Time coded as 1 for 10/02-9/03 and 2 for 1/04-6/04.
69
Reproduced with permission of the copyright owner. Further reproduction prohibited without permission.

Table 10: Scripps Health and Premier, Inc. Performance Before and After P4R
Before P4R B S.E. Wald df Sig. Exp(B)95% Cl Exp(B) Lower Upper
Time 0.5853 0.0889 43.379 1 0.0000 1.7956 1.5086 2.1373Premier 1.2277 0.1487 68.170 1 0.0000 3.4134 2.5504 4.5683Premier by Time -0.4138 0.0933 19.687 1 0.0000 0.6611 0.5507 0.7937Constant 1.4093 0.1408 100.23 1 0.0000 4.0931
Note: Time coded as 1 for 1/04-6/04 and 2 for 7/04-6/05.
Process-Outcomes Link Analysis
Survival Analysis Mortality Results
The results o f the survival analysis to test whether process measures affect
outcomes are presented in Table 12. This survival analysis was conducted on the total
population o f 3,954 patients for each regressor of interest. Three o f the regressors of
interest had a statistically significant impact on outcomes (i.e., better mortality) at a p-
value o f less than 0.05: aspirin at arrival (hazard ratio, 0.53; 95 Cl, 0.39-0.71 ; p <
0.0001); beta blocker at arrival (hazard ratio, 0,62; 95 Cl, 0.46-0.82; p = 0.0009); and
ACEI or ARB for LVSD (hazard ratio, 0.67; 95 Cl, 0.46-0.98; p = 0.04). Refer to
Attachment VI for the hazard functions o f covariates included in the full model
analysis o f each regressor of interest.
Table 11: Survival Analysis Results for Regressors of Interest in Total Population
Measure Name B S.E. Wald df Sig. Exp(B)95% Cl Exp(B)
Lower UpperAspirin at Arrival -0.6412 0.1536 17.435 1 0.0000 0.5267 0.3898 0.7116Aspirin at D/C -0.2995 0.1576 3.6134 1 0.0573 0.7412 0.5442 1.0094Beta Blocker at Arr -0.4832 0.1453 11.065 1 0.0009 0.6168 0.4640 0.8200Beta Blocker at D/C 0.0090 0.1576 0.0033 1 0.9544 1.0091 0.7409 1.3743Smk Cess Advice -0.0635 0.2922 0.0472 1 0.8281 0.9385 0.5294 1.6639ACEI for LVSD -0.4013 0.1934 4.3060 1 0.0380 0.6695 0.4583 0.9780Thromb 30 mins 0.8405 0.4584 3.3622 1 0.0667 2.3176 0.9437 5.6915PCI 120 mins 0.1076 0.2974 0.1308 1 0.7176 1.1136 0.6217 1.9945
70
Reproduced with permission of the copyright owner. Further reproduction prohibited without permission.

All Applicable P4P 0.0145 0.0828 0.0306 1 0.8611 1.0146 0.8627 1.1933
While not statistically significant, it is interesting to note that the all applicable
P4P variable has a positive coefficient and a hazard ratio that is greater than 1.0,
denoting that receiving all applicable P4P process measures may be predictive of
worse outcomes (higher mortality). One possible reason for this finding is that
providing thrombolytic agents for AMI treatment is no longer the standard of care for
hospitals with catheterization laboratories (cath labs) and is now only common in rural
hospitals without high levels of technology available. All Scripps Health hospitals
have cath labs, therefore, if the variable changed to all applicable and recommended
P4P measures rather than all applicable P4P measures, the results may change.
Indeed, the results did change when an analysis was conducted using an all
applicable and recommended P4P measure that includes seven AMI process measures
and excludes the measure for thrombolytic agent received within 30 minutes. The all
applicable and recommended P4P variable now has a negative coefficient and a hazard
ratio less than one, denoting that it is predictive o f lower mortality. However, the
results are not statistically significant. See Table 13.
Table 12: All Applicable and Recommended P4P Variable Survival Analysis Results
Measure Name B S.E. Wald df Sig. Exp(B)95% Cl Exp(B) Lower Upper
All App & Rec P4P -0.1020 0.0858 1.4124 1 0.2347 0.9030 0.7632 1.0685
[Analyses were run using the all applicable and recommended P4P variable to
determine whether any of the main study findings changed using this variable instead
71
Reproduced with permission of the copyright owner. Further reproduction prohibited without permission.
of the all applicable P4P variable. While the percent compliance during each
observation period was slightly higher for the all applicable and recommended P4P
variable than the all applicable P4P measure, the results of the analyses were similar in
that the rate of improvement before participation in the HQA was not statistically
different than the rate of improvement after participation in the HQA.]
Survival Analysis Times Series Mortality Results
A time series design was used to determine if there was any difference in the
regressors of interests’ impact on outcomes over time. One would expect the impact of
an indicator such as aspirin at arrival to be consistent over time. Some of the
regressors of interest showed no consistently statistically significant impact on
outcomes over time. For each time period, beta blocker at discharge, smoking
cessation advice/counseling, thrombolytic agent within 30 minutes, and PCI within
120 minutes did not affect outcomes at a statistically significant level. Aspirin at
arrival was found to be a significant prediction o f lower (i.e. better) mortality for two
o f the six observation time periods (hazard ratio, 0.51; 95 Cl, 0.27-0.98; p = 0.04 for
7/03- 12/03 and hazard ratio, 0.38; 95 Cl, 0.20-0.73; p = 0.004 for 7/04-12/04).
Aspirin at discharge was also a significant prediction of lower mortality for three
observation time periods (hazard ratio, 0.39; 95 Cl, 0.22-0.71; p = 0.002 for 1/03-6/03;
hazard ratio, 0.45; 95 Cl, 0.23-0.87; p = 0.02 for 7/04-12/04; and hazard ratio, 0.27; 95
Cl, 0.08-0.90; p = 0.03 for 1/05-6/05). Beta blocker at arrival was a predictor of lower
mortality for one time period (hazard ratio, 0.36; 95 Cl, 0.20-0.66; p = 0.001 for 1/04-
72
Reproduced with permission of the copyright owner. Further reproduction prohibited without permission.

6/04). One observation time period (1/04-6/04) showed that ACEIs or ARBs for
LVSD improved outcomes (hazard ratio, 0.46; 95 Cl, 0.21-0.99; p = 0.05). Receiving
all recommended P4P measures was a predictor o f improved outcomes for observation
four from 7/04-12/04 (hazard ratio, 0.70; 95 Cl, 0.49 - 1.00; p = 0.05). The hazard
ratios differed over time, which is likely due to the small sample size within each six
month time period. However, the direction of the effect (e.g. negative coefficient and
hazard ratio less than 1 .0 ) was consistent for the time periods that were statistically
significant. See Table 13.
Table 13; Time Series Survival Analysis Results for Regressors o f Interest
B SE Wald df Sig. Exp(B)95% Cl Exp(B)
Lower UpperAspirin at ArrivalJan - June '03 -0.5961 0.3460 2.9681 1 0.0849 0.5510 0.2796 1.0855July - Dec '03 -0.6714 0.3334 4.0561 1 0.0440 0.5110 0.2658 0.9822Jan - June '04 -0.4739 0.3194 2.2021 1 0.1378 0.6225 0.3329 1.1642July - Dec '04 -0.9706 0.3375 8.2705 1 0.0040 0.3789 0.1955 0.7341Jan - June '05 -0.4411 0.4753 0.8613 1 0.3534 0.6433 0.2534 1.6331July - Dec '05 -0.7891 0.7480 1.1131 1 0.2914 0.5000 0.1049 1.9677Aspirin at D/CJan - June '03 -0.9377 0.3038 9.5270 1 0.0020 0.3915 0.2158 0.7102July - Dec '03 Coefficients did not converge for split file so no model fitted for this timeJan - June '04 -0.1060 0.3380 0.0983 1 0.7539 0.8995 0.4637 1.7446July - Dec '04 -0.7991 0.3375 5.6058 1 0.0179 0.4497 0.2321 0.8715Jan - June '05 -1.3268 0.6218 4.5534 1 0.0329 0.2653 0.0784 0.8975July - Dec '05 10.5639 433.66 0.0006 1 0.9806 38710.7 0.0000Beta Blocker at ArrivalJan - June '03 -0.2909 0.2717 1.1464 1 0.2843 0.7476 0.4389 1.2733July - Dec '03 -0.4630 0.3437 1.8148 1 0.1779 0.6294 0.3209 1.2344Jan - June '04 -1.0155 0.3084 10.841 1 0.0010 0.3622 0.1979 0.6630July - Dec '04 -0.7180 0.4015 3.1978 1 0.0737 0.4877 0.2220 1.0714Jan - June '05 -0.5114 0.3921 1.7012 1 0.1921 0.5996 0.2781 1.2932July - Dec '05 12.5175 396.34 0.0010 1 0.9748 273073 0.0000Beta Blckr at D/CJan - June '03 -0.2740 0.3479 0.6201 1 0.4310 0.7604 0.3845 1.5037July - Dec '03 Coefficients did not converge for split file so no model fitted for this timeJan - June '04 0.4048 0.4666 0.7526 1 0.3857 1.4990 0.6006 3.7411
73
Reproduced with permission of the copyright owner. Further reproduction prohibited without permission.

July - Dec '04 -0.0740 0.3235 0.0523 1 0.8192 0.9287 0.4927 1.7507Jan - June '05 -0.7125 0.5462 1.7013 1 0.1921 0.4904 0.1681 1.4307July - Dec '05 -0.9228 0.6305 2.1421 1 0.1433 0.3974 0.1155 1.3675Smk Cess AdviceJan - June '03 -0.9137 0.6991 1.7080 1 0.1912 0.4011 0.1019 1.5786July - Dec '03 0.0733 1.1547 0.0040 1 0.9494 1.0760 0.1119 10.3451Jan - June '04 0.5500 0.5701 0.9305 1 0.3347 1.7332 0.5669 5.2984July - Dec '04 0.6463 0.6564 0.9696 1 0.3248 1.9085 0.5272 6.9083Jan - June '05 Coefficients did not converge for split file so no model fitted for this timeJuly - Dec '05 Coefficients did not converge for split file so no model fitted for this timeACEI/ARB for LVSDJan - June '03 -0.1198 0.4106 0.0851 1 0.7705 0.8871 0.3967 1.9837July - Dec '03 -0.4370 0.4163 1.1019 1 0.2938 0.6459 0.2856 1.4608Jan - June '04 -0.7807 0.3943 3.9205 1 0.0477 0.4581 0.2115 0.9921July - Dec '04 -0.7089 0.4504 2.4768 1 0.1155 0.4922 0.2036 1.1900Jan - June '05 0.3678 1.0585 0.1207 1 0.7283 1.4445 0.1814 11.5008July - Dec '05 -0.7841 0.8175 0.9200 1 0.3375 0.4565 0.0920 2.2664Thromb w/in 30Jan - June '03 -11.6878 462.55 0.0006 1 0.9798 0.0000 0July - Dec '03 Coefficients did not converge for split file so no model fitted for this timeJan - June '04 0.5166 1.2308 0.1762 1 0.6747 1.6764 0.1502 18.7084July - Dec '04 5.2525 6.6947 0.6156 1 0.4327 191.045 0.0004 9.5E+07Jan - June '05 9.0075 26.102 0.1191 1 0.7300 8163.87 0.0000 1.3E+26July - Dec '05 Coefficients did not converge for split file, so no model fitted for this timePCI w/in 120 minsJan - June '03 Coefficients did not converge for split file, so no model fitted for this timeJuly - Dec '03 Coefficients did not converge for split file, so no model fitted for this timeJan - June '04 0.0893 0.6056 0.0218 1 0.8827 1.0934 0.3337 3.5830July - Dec '04 Coefficients did not converge for split file, so no model fitted for this timeJan - June '05 -0.4601 0.7410 0.3856 1 0.5346 0.6312 0.1477 2.6970July - Dec '05 Coefficients did not converge for split file, so no model fitted for this timeAll Applicable P4PJan - June '03 0.2336 0.1804 1.6760 1 0.1955 1.2631 0.8869 1.7990July - Dec '03 -0.0105 0.1981 0.0028 1 0.9576 0.9895 0.6712 1.4589Jan - June '04 0.0323 0.1706 0.0358 1 0.8499 1.0328 0.7393 1.4429July - Dec '04 -0.3572 0.1814 3.8772 1 0.0489 0.6996 0.4903 0.9984Jan - June '05 -0.0395 0.2622 0.0227 1 0.8802 0.9612 0.5750 1.6069July - Dec '05 0.5410 0.4222 1.6416 1 0.2001 1.7177 0.7508 3.9298
Refer to Attachment VII for the hazard functions of covariates included in the
time series models for each regressor of interest.
74
Reproduced with permission of the copyright owner. Further reproduction prohibited without permission.

Logistic Regression Mortality Results
In a logistic regression analysis with 30-day post-discharge mortality as the
outcome variable, aspirin at arrival (odds ratio, 0.39; 95 C l , 0.25-0.61; p < 0.0001),
aspirin at discharge (odds ratio, 0.41; 95 Cl, 0.22-0.75; p = 0.004), beta blocker at
arrival (odds ratio, 0.48; 95 Cl, 0.32-0.72; p < 0.0003), and ACEI or ARB for LVSD
(odds ratio, 0.35; 95 Cl, 0.17-0.72; p = 0.005) were all predictors o f lower patient
mortality. See Table 15.
Table 14: Alive/Dead at 30 Days Outcome Results for Regressors o f Interest in Total Population__________________________________________________________________
Measure Name B SE Wald df Sig. Exp(B)95% Cl Exp(B) Lower Upper
Aspirin at Arrival -0.9437 0.2287 17.020 1 0.0000 0.3892 0.2486 0.6093Aspirin at D/C -0.9013 0.3150 8.1889 1 0.0042 0.4061 0.2190 0.7528Beta Blocker at Arr -0.7301 0.2024 13.008 1 0.0003 0.4818 0.3240 0.7165Beta Blocker at D/C -0.4739 0.3037 2.4349 1 0.1187 0.6226 0.3433 1.1290Smk Cess Advice 0.6669 0.6756 0.9746 1 0.3235 1.9483 0.5183 7.3234ACEI for LVSD -1.0627 0.3755 8.0083 1 0.0047 0.3455 0.1655 0.7213Thromb 30 mins 2.4802 1.3502 3.3743 1 0.0662 11.944 0.8470 168.43PCI 120 mins -0.0729 0.4086 0.0318 1 0.8585 0.9297 0.4174 2.0709All Applicable P4P 0.1541 0.1293 1.4201 1 0.2334 1.1666 0.9054 1.5032
Logistic Regression Time Series Mortality Results
The hazard functions for the statistically significant regressors o f interest in the
full model were tracked over time using logistic regression. Aspirin at arrival was a
predictor o f better outcomes during observation two (odds ratio, 0.25; 95 Cl, 0.09-
0.70; p = 0.008). Aspirin at discharge was a predictor of better outcomes over time
period one (odds ratio, 0.22; 95 Cl, 0.08-0.62; p = 0.004), time period four (odds ratio,
0.18; 95 Cl, 0.05-0.64; p = 0.008), and time period five (odds ratio, 0.02; 95 Cl, 0.00-
75
Reproduced with permission of the copyright owner. Further reproduction prohibited without permission.

0.37; p = 0.009). During observation three (odds ratio, 0.19, 95 Cl, 0.08-0.44; p =
0.0001) and observation five (odds ratio, 0.30, 95 Cl, 0.09-0.96; p = 0.04) beta blocker
at arrival was a significant predictor o f lower mortality. ACEI or ARB for LVSD had
a statistically significant positive impact on outcomes during time period three (odds
ratio, 0.10, 95 Cl, 0.02-0.60; p = 0.01). Similar to the survival analysis looking at the
process measures’ impact on mortality over time, the logistic regression over each six
month time period shows a mostly consistent pattern in the direction of the process
measures’ effect. See Table 16.
Table 15: Alive/Dead at 30 Days Time Series Outcome Results for StatisticallySignificant Regressors of Interest in Total Population
B S.E. Wald df Sig. Exp(B)95% Cl Exp(B) Lower Upper
Aspirin at ArrivalJan - June '03 -0.8053 0.4378 3.3838 1 0.0658 0.4469 0.1895 1.0541July - Dec '03 -1.3747 0.5216 6.9469 1 0.0084 0.2529 0.0910 0.7030Jan - June '04 -0.8598 0.4913 3.0631 1 0.0801 0.4232 0.1616 1.1086July - Dec '04 -0.8426 0.6275 1.8034 1 0.1793 0.4306 0.1259 1.4728Jan - June '05 -1.1214 0.7527 2.2194 1 0.1363 0.3258 0.0745 1.4246July - Dec '05 19.9181 18881.9 0.0000 1 0.9992 4.5E+08 0.0000
Aspirin at DischargeJan - June '03 -1.5026 0.5193 8.3715 1 0.0038 0.2226 0.0804 0.6159July - Dec '03 -0.7341 0.8079 0.8258 1 0.3635 0.4799 0.0985 2.3378Jan - June '04 -0.2126 0.8459 0.0631 1 0.8016 0.8085 0.1540 4.2436July - Dec '04 -1.7081 0.6438 7.0386 1 0.0080 0.1812 0.0513 0.6400Jan - June '05 -3.9890 1.5295 6.8014 1 0.0091 0.0185 0,0009 0.3712July - Dec '05 17.3388 14093.9 0.0000 1 0.9990 3.4E+07 0.0000
Beta Blocker at ArrivalJan - June '03 -0.5804 0.4214 1.8974 1 0.1684 0.5597 0.2451 1.2782July - Dec '03 -0.6067 0.4654 1.6993 1 0.1924 0.5451 0.2189 1.3573Jan - June '04 -1.6853 0.4445 14.3767 1 0.0001 0.1854 0.0776 0.4430July - Dec '04 -0.9254 0.6881 1.8087 1 0.1787 0.3964 0.1029 1.5269Jan - June '05 -1.2079 0.5979 4.0806 1 0.0434 0.2988 0.0926 0.9647July - Dec '05 18.5513 11224.1 0.0000 1 0.9987 1.1E+08 0.0000
ACEI/ARB for LVSDJan - June '03 -1.1742 0.7463 2.4754 1 0.1156 0.3091 0.0716 1.3345July - Dec '03 -0.4290 0.8894 0.2326 1 0.6296 0.6512 0.1139 3.7221
76
Reproduced with permission of the copyright owner. Further reproduction prohibited without permission.

Jan-June'04 -2.2266 0.8752 6.4717 1 0.0110 0.1079 0.0194 0.5998Ju ly-D ec '04 -0.3417 1.2451 0.0753 1 0.7837 0.7105 0.0619 8.1543Jan-June'05 -0.2003 8507.2 0.0000 1 1.0000 1.8141 0.0000 .Ju ly-D ec '05 -1.2879 1.2815 1.0099 1 0.3149 0.2759 0.0224 3.4002
Logistic Regression Morbidity Results
Besides mortality, another indicator o f patient outcomes is readmission rates.
Using readmissions within 30 days as the outcome variable, a logistic regression
analysis identified that aspirin at discharge (odds ratio, 3.1; 95 Cl, 1.23-7.79; p = 0.02)
was a predictor of more readmissions within 30 days of discharge while receiving all
applicable P4P measures was a predictor of less readmissions within 30 days (odds
ratio, 0.65; 95 Cl, 0.48-0.89; p = 0.007). See Table 17.
Table 16: Readmission in 30 Days Outcome Results for Regressors of Interest inTotal Population
Measure Name B SE Wald df Sig. Exp(B)95% Cl Exp(B) Lower Upper
Aspirin at Arrival 0.0327 0.4402 0.0055 1 0.9408 1.0332 0.4360 2.4483Aspirin at Discharge 1.1306 0.4705 5.7736 1 0.0163 3.0974 1.2317 7.7895Beta Blocker at Arr 0.5151 0.4342 1.4077 1 0.2354 1.6739 0.7147 3.9201Beta Blocker at D/C 0.2534 0.2692 0.8857 1 0.3467 1.2883 0.7601 2.1836Smk Cess Advice 0.0032 0.3770 0.0001 1 0.9933 1.0032 0.4792 2.1003ACEI for LVSD 0.0799 0.3718 0.0462 1 0.8299 1.0832 0.5227 2.2447Thromb 30 mins -0.2662 0.6521 0.1667 1 0.6831 0.7663 0.2135 2.7506PCI 120 mins -0.7717 0.5815 1.7613 1 0.1845 0.4622 0.1479 1.4448All Applicable P4P -0.4246 0.1585 7.1765 1 0.0074 0.6541 0.4794 0.8923
Logistic Regression Time Series Morbidity Results
Looking at the significant regressors o f interest’s impact on readmissions over
time shows that receiving all applicable P4P measures was a predictor o f fewer
readmissions within 30 days from 1/04-6/04 (odds ratio, 0.30; 95 Cl, 0.14-0.62; p =
77
Reproduced with permission of the copyright owner. Further reproduction prohibited without permission.
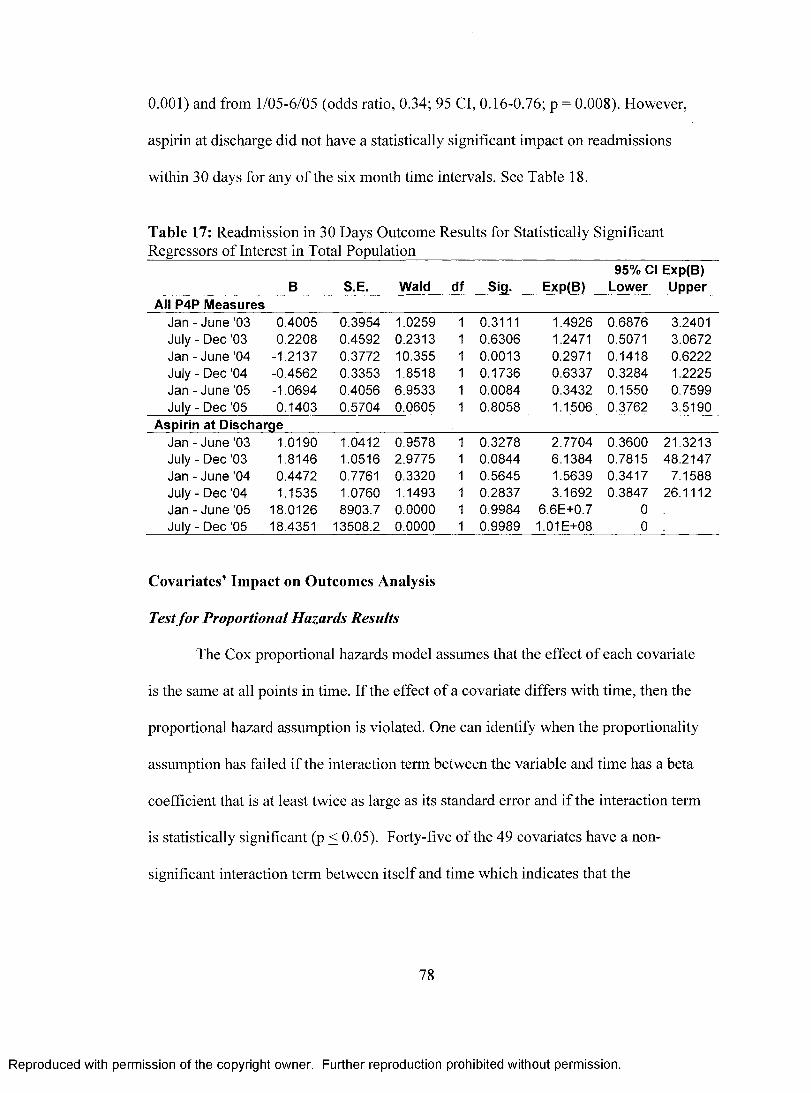
0.001) and from 1/05-6/05 (odds ratio, 0.34; 95 Cl, 0.16-0.76; p = 0.008). However,
aspirin at discharge did not have a statistically significant impact on readmissions
within 30 days for any o f the six month time intervals. See Table 18.
Table 17: Readmission in 30 Days Outcome Results for Statistically Significant Regressors of Interest in Total Population__________________________________
B S.E. Wald df Sig. Exp(B)95% Cl Exp(B)
Lower UpperAll P4P Measures
Jan - June '03 0.4005 0.3954 1.0259 1 0.3111 1.4926 0.6876 3.2401July - Dec '03 0.2208 0.4592 0.2313 1 0.6306 1.2471 0.5071 3.0672Jan - June '04 -1.2137 0.3772 10.355 1 0.0013 0.2971 0.1418 0.6222July - Dec ’04 -0.4562 0.3353 1.8518 1 0.1736 0.6337 0.3284 1.2225Jan - June ’05 -1.0694 0.4056 6.9533 1 0.0084 0.3432 0.1550 0.7599July - Dec '05 0.1403 0.5704 0.0605 1 0.8058 1.1506 0.3762 3.5190
Aspirin at DischargeJan - June '03 1.0190 1.0412 0.9578 1 0.3278 2.7704 0.3600 21.3213July - Dec '03 1.8146 1.0516 2.9775 1 0.0844 6.1384 0.7815 48.2147Jan - June '04 0.4472 0.7761 0.3320 1 0.5645 1.5639 0.3417 7.1588July - Dec '04 1.1535 1.0760 1.1493 1 0.2837 3.1692 0.3847 26.1112Jan - June'05 18.0126 8903.7 0.0000 1 0.9984 6.6E+0.7 0July - Dec '05 18.4351 13508.2 0.0000 1 0.9989 1.01E+08 0
Covariates’ Impact on Outcomes Analysis
Test fo r Proportional Hazards Results
The Cox proportional hazards model assumes that the effect of each covariate
is the same at all points in time. If the effect of a covariate differs with time, then the
proportional hazard assumption is violated. One can identify when the proportionality
assumption has failed if the interaction term between the variable and time has a beta
coefficient that is at least twice as large as its standard error and if the interaction term
is statistically significant (p < 0.05). Forty-five of the 49 covariates have a non
significant interaction term between itself and time which indicates that the
78
Reproduced with permission of the copyright owner. Further reproduction prohibited without permission.

proportional hazards assumption has not been violated. Four variables did fail the
proportionality assumption: Asian/Pacific Islander race (beta, -0.04; p = 0.008);
identified payor (beta, 0.14; p = 0.006); thrombolysis treatment (beta, -0.06; p =
0.005); and depression (beta, 0.05; p = 0.04). These four variables may be time
dependent or may be interacting with one or more covariates and time. See Table 11.
Table 18: Test for Proportional Hazards ResultsInteraction Variables B SE Wald df Sig. Exp(B)Chula Vista*time 0.6702 4 0.9549Encinitas*time 0.0280 0.0556 0.2533 1 0.6148 1.0284Green*time 0.0054 0.0317 0.0287 1 0.8654 1.0054La Jolla*time 0.0022 0.0310 0.0049 1 0.9443 1.0022Mercy*time -0.0106 0.0265 0.1603 1 0.6889 0.9894Age*time -0.0004 0.0003 1.3068 1 0.2530 0.9996Female*time -0.0120 0.0084 2.0464 1 0.1526 0.9881Single*time 1.1549 3 0.7638Widowed*time 0.0120 0.0122 0.9674 1 0.3253 1.0121Divorced/Sep*time 0.0122 0.0165 0.5441 1 0.4607 1.0122Married*time 0.0055 0.0104 0.2760 1 0.5994 1.0055White*time 11.5778 5 0.0411African American*time -0.0083 0.0236 0.1251 1 0.7235 0.9917Native American*time 1.7233 5.2730 0.1068 1 0.7438 5.6027Asian/Pac Isbtime -0.0377 0.0143 6.9601 1 0.0083 0.9630Other Race*time 0.0046 0.0127 0.1322 1 0.7162 1.0046Unk Race*time 0.0831 0.0468 3.1538 1 0.0758 1.0866Stated Religion*time -0.0042 0.0086 0.2410 1 0.6235 0.9958Identified PCP*time 0.0071 0.0083 0.7228 1 0.3952 1.0071Identified Payor*time 0.1353 0.0494 7.4856 1 0.0062 1.1448CABG Surgery*time 0.0106 0.0166 0.4093 1 0.5223 1.0107Oth Open Heart*time -0.0216 0.0337 0.4090 1 0.5225 0.9787PCI Tx*time 0.0083 0.0109 0.5860 1 0.4440 1.0084Thrombolysis Tx*time -0.0604 0.0213 8.0281 1 0.0046 0.9414Oth Card Dx Tx*time -0.0184 0.0161 1.3140 1 0.2517 0.9817No Cardiac Tx*time -0.0311 0.0185 2.8299 1 0.0925 0.9694CAD*time 0.0882 0.1661 0.2821 1 0.5953 1.0922Prior Ml*time 0.0026 0.0169 0.0246 1 0.8755 1.0026Family Hx CAD*time 0.0343 0.0660 0.2692 1 0.6039 1.0348Dyslipidemia*time 0.0157 0.0103 2.3093 1 0.1286 1.0158Diabetes*time -0.0007 0.0085 0.0070 1 0.9332 0.9993
Reproduced with permission of the copyright owner. Further reproduction prohibited without permission.

Hypertension*time 0.0108 0.0078 1.8941 1 0.1687 1.0109Obesity*time -0.0024 0.0204 0.0139 1 0.9062 0.9976Depression*time 0.0504 0.0245 4.2307 1 0.0397 1.0516Smoker*time -0.0186 0.0125 2.2266 1 0.1357 0.9816FTE/Occ Bed*time 0.0161 0.0155 1.0713 1 0.3006 1.0162Rapid Resp Trrftime -0.0275 0.0477 0.3324 1 0.5643 0.9729Chest Pain Ctr*time -0.0052 0.0239 0.0475 1 0.8274 0.9948CV Award*time -0.0310 0.0255 1.4772 1 0.2242 0.9695Hosp AMI VoPtime 0.0000 0.0001 0.0616 1 0.8039 1.0000MD AMI VoPtime 0.0024 0.0028 0.7017 1 0.4022 1.0024Adm/ICU Beds*time -0.0038 0.0049 0.6010 1 0.4382 0.9962Medicare*time -0.0023 0.0069 0.1098 1 0.7403 0.9977MediCaPtime -0.0042 0.0103 0.1660 1 0.6837 0.9958CommerciaPtime -0.0030 0.0078 0.1469 1 0.7015 0.9970Oth Gvmt/SP*time 0 .Oth Pyr/WC*time 0 .Surg Backup*time -0.0018 0.0269 0.0047 1 0.9455 0.9982Teaching Hosp*time 0.0006 0.0252 0.0005 1 0.9823 1.0006
Covariate Survival Analysis Results
The following covariates were predictors o f lower mortality when in the full
model for survival analysis: widowed (hazard ratio, 0.80; 95 Cl, 0.64-0.99; p = 0.04);
identified a PCP (hazard ratio 0.76; 95 Cl, 0.65-0.99; p = 0.0005); CABG surgery
(hazard ratio, 0.58; 95 Cl, 0.40-0.83; p = 0.003); PCI treatment (hazard ratio, 0.48; 95
Cl, 0.39-0.59; p < 0.0001); dyslipidemia (hazard ratio, 0.42; 95 Cl, 0.34-0.50; p <
0.0001); hypertension (hazard ratio, 0.84; 95 Cl, 0.73-0.97; p - 0.02); and increased
rate o f AMI admission to ICU beds (hazard ratio, 0.64; 95 Cl, 0.42-0.98; p = 0.04).
Conversely, the following covariates were predictors o f higher (i.e., worse) mortality
when in the full model for survival analysis: Encinitas hospital (hazard ratio, 25.0; 95
Cl, 2.7-227.3; p = 0.004); Mercy hospital (hazard ratio, 13.4; 95 Cl, 2.0-89.6; p =
0.008); increased age (hazard ratio, 1.04; 95 Cl, 1.03-1.05; p < 0.0001); identified a
80
Reproduced with permission of the copyright owner. Further reproduction prohibited without permission.

payor (hazard ratio, 3.0; 95 Cl, 1.46-5.98; p = 0.003); thrombolysis treatment (hazard
ratio, 1.55; 95 Cl, 1.00-2.38; p = 0.05); no cardiac treatment (hazard ratio 1.68; 95 Cl,
1.17-2.40; p = 0.005); diabetes (hazard ratio, 1.17; 95 Cl, 1.00-1.37; p = 0.05); and
increased annual hospital AMI admissions (hazard ratio, 1.02; 95 Cl, 1.00-1.03; p =
0.03). See Table 14.
Table 19: Covariate Hazard Functions
Covariates B SE Wald df Sig. Exp(B)95% Cl Exp(B)
Lower UpperChula Vista 13.793 4 0.0080Encinitas 3.2170 1.1272 8.1453 1 0.0043 24.954 2.7395 227.31Green 0.3869 2.6798 0.0208 1 0.8852 1.4724 0.0077 281.26La Jolla 4.8870 3.2021 2.3292 1 0.1270 132.56 0.2493 70482Mercy 2.5931 0.9706 7.1381 1 0.0075 13.371 1.9953 89.598Age 0.0377 0.0035 114.37 1 0.0000 1.0384 1.0313 1.0456Female -0.0589 0.0782 0.5665 1 0.4516 0.9428 0.8088 1.0990Single 8.7622 0.0326Widowed -0.2249 0.1098 4.1984 1 0.0405 0.7986 0.6440 0.9903Divorced/Separtd 0.1931 0.1504 1.6469 1 0.1994 1.2130 0.9032 1.6289Married -0.0560 0.0959 0.3413 1 0.5591 0.9455 0.7835 1.1410White 0.6209 0.9870African American 0.0208 0.1951 0.0114 1 0.9150 1.0210 0.6966 1.4965Native American 0.0747 1.0046 0.0055 1 0.9407 1.0775 0.1504 7.7188Asian/Pacific Isldr 0.0221 0.1227 0.0324 1 0.8572 1.0223 0.8038 1.3002Other -0.0492 0.1010 0.2376 1 0.6260 0.9520 0.7810 1.1603Unknown -0.1945 0.3590 0.2934 1 0.5881 0.8233 0.4073 1.6640Stated Religion 0.0552 0.0809 0.4658 1 0.4949 1.0568 0.9018 1.2383Mos Since Admit 0.0088 0.0114 0.6026 1 0.4376 1.0089 0.9866 1.0316Identified PCP -0.2747 0.0787 12.185 1 0.0005 0.7598 0.6512 0.8865Identified Payor 1.0844 0.3594 9.1063 1 0.0025 2.9578 1.4624 5.9822CABG Tx -0.5488 0.1867 8.6410 1 0.0033 0.5776 0.4006 0.8329Oth Open Heart 0.5468 0.3021 3.2771 1 0.0703 1.7278 0.9558 3.1234PCI Tx -0.7360 0.1096 45.071 1 0.0000 0.4790 0.3864 0.5938Thrombolysis Tx 0.4357 0.2206 3.9003 1 0.0483 1.5460 1.0033 2.3823Oth Cardiac Proc 0.2381 0.1567 2.3075 1 0.1288 1.2688 0.9332 1.7252No Cardiac Tx 0.5158 0.1831 7.9356 1 0.0048 1.6750 1.1699 2.3982CAD -0.8021 1.0143 0.6253 1 0.4291 0.4484 0.0614 3.2737Prior Ml -0.0971 0.1562 0.3863 1 0.5343 0.9075 0.6681 1.2326Family Hx CAD -0.5211 0.5849 0.7938 1 0.3730 0.5939 0.1887 1.8688Dyslipidemia -0.8797 0.1002 77.096 1 0.0000 0.4149 0.3409 0.5049Diabetes 0.1611 0.0802 4.0369 1 0.0445 1.1748 1.0040 1.3746
Reproduced with permission of the copyright owner. Further reproduction prohibited without permission.

Hypertension -0.1721 0.0737 5.4537 1 0.0195 0.8419 0.7287 0.9727Obesity -0.2532 0.1918 1.7432 1 0.1867 0.7763 0.5331 1.1305Depression -0.3028 0.2061 2.1580 1 0.1418 0.7387 0.4932 1.1065Smkr Past 12 Mo -0.1255 0.1243 1.0206 1 0.3124 0.8820 0.6914 1.1253FTE/Adj Occ Bed 0.1742 0.1765 0.9736 1 0.3238 1.1903 0.8421 1.6823Rapid Resp Tm -0.7087 0.4351 2.6528 1 0.1034 0.4923 0.2098 1.1550Chest Pain Ctr 0CV Award Yr Visit -0.6358 0.3549 3.2096 1 0.0732 0.5295 0.2641 1.0616Hosp AMI Admits 0.0158 0.0071 4.9456 1 0.0262 1.0160 1.0019 1.0303Avg MD AMI Adm 0.0401 0.0512 0.6149 1 0.4329 1.0409 0.9416 1.1508AMI Adm/ICU Bd -0.4456 0.2150 4.2959 1 0.0382 0.6405 0.4202 0.9761Medicare -0.3454 0.3034 1.2965 1 0.2549 0.7079 0.3906 1.2830MediCal -0.4018 0.3715 1.1697 1 0.2795 0.6691 0.3231 1.3859Commercial -0.7990 0.4716 2.8700 1 0.0902 0.4498 0.1785 1.1336Oth Gvmt/Self Py -1.0648 0.6094 3.0529 1 0.0806 0.3448 0.1044 1.1384Oth Pyr Wrk Cmp 0Teaching Hosp -0.2640 0.4764 0.3070 1 0.5795 0.7680 0.3019 1.9536Surgical Backup 0a = Degree of freedom reduced because of constant or linearly dependent covariates b = Constant or Linearly Dependent Covariates Chest_Pain_Center = Facility_Code(4); Other_including_Workers_Comp = 180 + 4.979*Facility
Pay-for-Performance Outcomes Analysis
Mortality Pre and Post-Intervention Results
Thirty-day, 90-day, and 180-day mortality rates all improved from 2003 to
2005. Before participation in the HQA, 30-day mortality ranged from 11% - 13%,
while after participation in the HQA, the rate dropped between eight percent and nine
percent. Similarly, 90-day mortality went from 13% - 15% before the HQA to 10% -
11% after the HQA. Sixteen to 18% of patients died within 180 days before
participation in the HQA compared to 11% - 14% after. See Figures 11-13.
82
Reproduced with permission of the copyright owner. Further reproduction prohibited without permission.

Figure 11: 30-Day Mortality Rates Over Time
30-Day Mortality Rate
20%18%16%
10%8%6%4%2%0%
11%
1/1/03-6/30/03
7/1/03-12/31/03
1/1/04-6/30/04
7/1/04-12/31/04
Figure 12: 90-Day Mortality Rates Over Time
90-Day Mortality Rate
1/1/05-6/30/05
7/1/05-12/31/05
20%18%16%14%12%10%
8%6%4%2%0%
T3%- 11%
10%
1/1/03-6/30/03
7/1/03-12/31/03
1/1/04-6/30/04
7/1/04-12/31/04
1/1/05-6/30/05
7/1/05-12/31/05
83
Reproduced with permission of the copyright owner. Further reproduction prohibited without permission.

Figure 13: 180-Day Mortality Rates Over Time
180-Day Mortality Rate
20%18%16%14%12%10%
8%6%4%2%0%
.18%
16%.14%
12%- ♦ 11%
1/1/03-6/30/03
7/1/03-12/31/03
1/1/04-6/30/04
7/1/04-12/31/04
1/1/05-6/30/05
7/1/05-12/31/05
The results of the logistic regression to determine whether HQA impacted 30-
day, 90-day, or 180-day mortality showed that none of the variables (time, post-HQA,
and time/post-HQA interaction) were statistically significant in any o f the three
equations. See Tables 19-21.
Table 20: Logistic Regression Results of 30-Day Mortality Before and After HQA
30-Day Mortality B S.E. Wald df Sig. Exp(B)95% Cl Exp(B) Lower Upper
Time -0.0555 0.0830 0.4465 1 0.5040 0.9461 0.8040 1.1132Post -0.4796 0.2704 3.1441 1 0.0762 0.6191 0.3644 1.0518Post by Time 0.0336 0.1300 0.0667 1 0.7963 1.0341 0.8015 1.3342Constant -1.8791 0.1816 107.12 1 0 . 0 0 0 0 0.1527
Table 21: Logistic Regression Results o f 90-Day Mortality Before and After HQA
90-Day Mortality B S.E. Wald df Sig. Exp(B)95% Cl Exp(B) Lower Upper
Time -0.0840 0.0777 1.1683 1 0.2798 0.9195 0.7896 1.0707Post -0.3131 0.2457 1.6232 1 0.2027 0.7312 0.4517 1.1836Post by Time -0.0164 0.1195 0.0189 1 0.8905 0.9837 0.7783 1.2433
84
Reproduced with permission of the copyright owner. Further reproduction prohibited without permission.

Constant -1.6424 0.1690 94.456 1 0.0000 0.1935
Table 22: Logistic Regression Results o f 180-Day Mortality Before and After HQA
180-Day Mortality B S.E. Wald df Sig. Exp(B)95% Cl Exp(B) Lower Upper
Time -0.0803 0.0725 1.2255 1 0.2683 0.9228 0.8005 1.0638Post -0.2737 0.2290 1.4291 1 0.2319 0.7605 0.4855 1.1913Post by Time -0.0423 0.1115 0.1438 1 0.7046 0.9586 0.7705 1.1927Constant -1.4528 0.1582 84.375 1 0.0000 0.2339
Morbidity Pre and Post-Intervention Results
The rate o f readmissions within 30 days decreased from seven percent in the
beginning of 2003 to four percent at the end o f the 2005. Unlike the mortality rates,
the decline in morbidity (readmission) rates did not show a consistent improvement, as
scores fluctuated during this time. However, the results of the logistic regression
identified that neither the intercept of the post-HQA performance nor the rate of
readmissions post-participation in the HQA were statistically significant. This finding
was similar to the result of the logistic regression for mortality. See Figure 14 and
Table 22.
85
Reproduced with permission of the copyright owner. Further reproduction prohibited without permission.

Figure 14: 30-Day Readmission Rates Over Time
30-Day Readmission Rate
20%18%16%14%
1/1/03-6/30/03
7/1/03-12/31/03
1/1/04-6/30/04
7/1/04-12/31/04
1/1/05-6/30/05
7/1/05-12/31/05
Table 22: Logistic Regression Results o f Readmission Within 30-Days Before and After HQ A_______________________________________________________________
95% Cl Exp(B)30-Day Readmit B S.E. Wald df Sig. Exp(B) Lower UpperTime -0.1714 0.1201 2.0362 1 0.1536 0.8425 0.6657 1.0661Post -0.0712 0.3540 0.0405 1 0.8405 0.9312 0.4653 1.8636Post by Time -0.0108 0.1762 0.0037 1 0.9513 0.9893 0.7003 1.3975Constant -2.5307 0.2540 99.268 1 0.0000 0.0796
D is c u s s io n
Pay-for-Performance’s Impact on Process Measures
From 2003 to 2005, Scripps Health’s performance in AMI process measures
improved substantially. Compliance with all applicable P4P measures increased from
60% to 8 6 % from observation one to observation six. Over the same period of time,
aspirin at arrival improved from 93% to 99%. Beta blocker at arrival improved from
85% to 96%. ACEI or ARB for LVSD improved from 75% to 87%. Smoking
86
Reproduced with permission of the copyright owner. Further reproduction prohibited without permission.

cessation advice improved from 57% to 89%. Aspirin at discharge improved from
91% to 98%. Beta blocker at discharge improved from 86% to 95%. PCI within 120
minutes improved from 16% to 71%. Thrombolytic agent within 30 minutes was the
only indicator without any consistent improvement over the three years, perhaps
impacted by the infrequency o f patients receiving thrombolytic therapy. Thrombolytic
agent within 30 minute performance went from 24% in early 2003 to 31% in late
2005.
Scripps Health has improved its performance in providing all applicable P4P
measures for AMI patients consistently during all six observation time periods from
2003 to 2005. The slope, measuring the rate o f improvement, before and after
participation in the HQA did not change, indicating that the rate o f improvement did
not change after participation in the HQA. The coefficients o f the post-HQA variable
and the interaction term suggest that initiation o f participation in the HQA may have
led or contributed to a lower than expected performance in providing all applicable
P4P measures in the forth observation given the performance prior to participation in
the HQA. The post-HQA intercept noting the different level o f performance in
providing all applicable P4P measures after initiation of the HQA was statistically
significant.
Aspirin at arrival, aspirin at discharge, beta blocker at discharge, and
thrombolytic agent received within 30 minutes did not have statistically significant
differences in performance from before participation in the HQA to after participation
in the HQA. The slope of performance with beta blocker at arrival did not change with
87
Reproduced with permission of the copyright owner. Further reproduction prohibited without permission.

participation in the HQA but its intercept for scores post-HQA did. Compliance with
providing beta blockers at arrival was at a higher level after participation in the HQA
began than would have been expected given the rate of improvement for this indicator
before participation in the HQA. Smoking cessation advice/counseling compliance did
not change in slope or intercept, however, the changes taking place over time (from
observation one through three to observation four through six) were statistically
significant, suggesting seasonal, cyclical, or time dependent change effects present.
The slope of performance with the ACEI or ARB for LVSD metric did change at a
statistically significant level, indicating that participation in the HQA may have
contributed to a change in improvement rate for this measure. Compliance with PCI
within 120 minutes changed dramatically from before to after participation in the
HQA. The intercept and the change in slope (i.e. the betas for the post-HQA variable
and the interaction term) indicate that participation in the HQA may have slowed the
level and rate of improvement in compliance with PCI within 120 minutes. However,
it is important to keep in mind that there is a ceiling for performance (i.e., 100%
compliance) and sustaining the high levels of improvement experienced before the
HQA may be unfeasible at later time periods.
In summary, the data analyses indicate that Scripps Health’s improvements in
P4P process measure compliance for AMI patients cannot be attributed to its
participation in the Hospital Quality Alliance. If the HQA had made an impact on
process measure compliance, one would have expected a significant change in slope
(i.e., increased slope indicates better performance) and/or a significant change in
88
Reproduced with permission of the copyright owner. Further reproduction prohibited without permission.

intercept of the post-HQA variable (i.e., intercept at higher value than expected due to
pre-HQA slope indicates better performance), which did not happen. In certain metrics
(e.g., all applicable P4P measures and PCI within 120 minutes), participation may
have negatively impacted the level o f performance and/or rate o f improvement in
performance, as the slope and/or intercept of post-HQA compliance was not as high as
expected based upon pre-HQA scores. Further analysis should be conducted with a
time fit (rather than a linear model) to take into account the asymptotic nature of
process measure performance. Should the results of the time fit model analysis be
similar to these results, then research on potential unintended consequences of
participation in the HQA is recommended.
Before drawing the conclusion that the HQA did not affect process measures, it
is important to note some limitations o f this analysis. The Scripps Health process
measure performance was improving before initiation of participation in the HQA.
Anticipation of the HQA and knowledge o f the process measures the HQA would
track may have motivated improvement in compliance with the measures during this
time. Conversely, there could have been other events in history, such as new journal
articles, that led to improvement before the HQA. The reason for improvement in
scores before participation in the HQA is unknown.
The HQA could have impacted performance in indirect ways. To prepare for
the HQA and reaching high levels o f process measure compliance, there may have
been changes in staffing, documentation, and care processes. These changes could all
impact process measure scores, however, these changes could take place gradually
89
Reproduced with permission of the copyright owner. Further reproduction prohibited without permission.

before and/or after the HQA. While motivated by the HQA, these changes may not be
captured between observation three and four when participation in the HQA began. If
changes did not occur during that time period, they would not be attributed to the
HQA given the study design that was used.
Perhaps beginning to collect and monitor data on the AMI process measures
motivated improvement in scores either irrespective of or in conjunction with
participation in the HQA. Williams et al suggest that collecting data on performance
? o
measures may be a sufficient catalyst for improvement. However, the results of this
study do not confirm other studies’ findings that P4P improves process measures.12,13
This research suggests that it may not be P4P (but perhaps collection and monitoring
o f data or publication of new evidence-based medicine) that drives improvement. On
the other hand, it is important to do further analysis to look for early and lagged effects
of participation in the HQA before concluding that the HQA had/has no impact on
process measure scores.
Had the results of the previous analysis shown that participation in the HQA
significantly impacted Scripps Health’s process measure scores, an analysis to test
whether the internal threat of history was present would have been conducted.
However, the null hypothesis for the first study aim held, which is that process
measures did not improve as a result of pay-for-performance. Nevertheless, the data
that would have been used to test the internal threat o f history was useful in comparing
Scripps Health performance with that of another hospital system, Premier, Inc., that
participated in an earlier P4P program as well as that o f other hospitals nation-wide
90
Reproduced with permission of the copyright owner. Further reproduction prohibited without permission.

participating in the HQA.
Scripps Health and Premier, Inc. started out with much different levels of
performance with the AMI process measures (absolute difference 7.7%), which
decreased over time, dropping to an absolute difference of 6.3% in time period two
and to 2.2% in time period three after Scripps began participating in the HQA. Scripps
Health’s performance from 7/04-6/05 was similar (not statistically different) to that of
other hospitals participating in the HQA nation-wide, which suggests that Premier,
Inc. had characteristics that encouraged or made it easier to comply with the AMI
process measures than other hospitals nationally. Premier, Inc. began using a
sophisticated reporting and analytics tool to monitor and track process measure
performance before Scripps Health did. According to Stephanie Alexander, Senior
Vice President for Premier Healthcare Informatics (personal communication, 2007),
the 54 hospitals that began participating in the Premier Hospital Quality Incentive
Demonstration we required to use the Premier decision support analytic tools to
collect, monitor, and analyze their performance on the 34 measures used in the
demonstration project before the program began. This is likely a key reason for the
variation in performance levels at the first observation, However, further research into
the differences between Premier, Inc. hospitals and others nation-wide (including
Scripps) is recommended.
The test to identify whether the P4P program that Premier, Inc. participated in
changed its performance compared to Scripps Health (the control) determined that the
Premier Hospital Quality Incentive Demonstration cannot be attributed to the
91
Reproduced with permission of the copyright owner. Further reproduction prohibited without permission.

improvement in scores. The slopes of the Premier, Inc. performance in comparison to
the Scripps Health performance over the same time period were not statistically
different. The time variable and the site variable were statistically significant,
indicating that the facilities started out at different levels of performance and that there
was significant increase in performance for both organizations from 10/02-9/03 to
1/04-6/04.
From 1/04-6/04 to 7/04-6/05, there was a statistically significant intervention
impacting Premier, Inc. and Scripps Health facilities’ performance on the AMI process
measures. The slopes for the two health system’s performance were statistically
different from each other. The statistical significance in slopes combined with the
variable coefficients indicates that participation in the HQA had a larger impact on
Scripps Health than it did for Premier, Inc. Given that Premier, Inc. was already
participating in a P4P program and Scripps Health began participating in a public
reporting initiative for the first time, it makes sense that Premier, Inc. would not have
experienced as great an impact as Scripps Health. In addition, the time and the site
variables were statistically significant suggesting that performance started out at
statistically different levels and that both systems experienced significant increases in
scores over this time frame.
The analysis comparing Scripps Health performance to itself suggests that
participation in the HQA did not change the rate o f improvement in Scripps Health’s
compliance with AMI process measures, yet the analysis comparing Scripps Health
performance to Premier, Inc. performance suggests otherwise. It is important to note
92
Reproduced with permission of the copyright owner. Further reproduction prohibited without permission.

that the time period for these analyses differs. The analysis comparing Scripps Health
to itself is a time series design looking at performance from 1/03-12/05 in six month
intervals. The analysis comparing Scripps Health to Premier, Inc. performance was
based upon scores from 1/04-6/04 compared to 7/04-6/05. In addition, the two
analyses used different metrics. The analysis comparing Scripps Health to itself used
an all applicable P4P metric as well as eight individual measures. The analysis
comparing Scripps Health to Premier, Inc. included a weighted average metric of the
numerators and denominators o f seven individual measures. Further analysis is
recommended to determine the impact of the HQA on process measure compliance. It
would be ideal to conduct an additional analysis comparing Scripps Health to a like
hospital system that did not participate in the HQA, yet it is unlikely that one exists.
The largest change in scores occurred for Premier, Inc. when it started
participating in its first intervention (the P4P program) and for Scripps Health when it
started participating in its only intervention (the P4R program). The larger change in
scores over the time period o f the first intervention for Premier, Inc. and the time
period of the only intervention for Scripps Health may indicate that improvement was
occurring from 10/02-6/05 but that the initiation of public interest in the AMI process
measure scores may have increased internal emphasis on performance. While it is
tempting to draw this conclusion, given the lack of statistical significance of the P4P
program and the conflicting results for the statistical significance o f the P4R program,
conclusions of this nature are unwarranted. Further analysis using a time fit or learning
model to account for the performance metric ceiling is recommended.
93
Reproduced with permission of the copyright owner. Further reproduction prohibited without permission.

Process-Outcomes Link
Although evidence-based literature suggests that compliance with the eight
AMI process measures used in this analysis should lead to improved patient outcomes
(i.e. increased probability o f survival), this study showed that not all o f the measures
were associated with a statistically significant reduction in mortality in the Scripps
Health system. A survival analysis on the full model of 3,954 patients using days
survival as the outcome variable indicated that aspirin at arrival, beta blocker at
arrival, and ACEI or ARB for LVSD were predictors of lower mortality at a p-value <
0.05. Aspirin at arrival was associated with a 47% lower risk of death (hazard ratio;
0.53), beta blocker at arrival was associated with a 26% lower risk o f death (hazard
ratio; 0.74), and ACEI or ARB for LVSD was associated with a 33% lower risk of
death (hazard ratio; 0.67).
Similarly, a logistic regression on the full model of patients using 30-day
mortality as the outcome variable indicated that all three of the above noted indicators
(aspirin at arrival, beta blocker at arrival, ACEI/ARB for LVSD) as well as aspirin at
discharge were all predictors of lower mortality at a p-value <0.01. Aspirin at arrival
was associated with a 61% lower odds o f death within 30 days (odds ratio; 0.39),
aspirin at discharge was associated with a 59% lower odds of death within 30 days
(odds ratio; 0.41), beta blocker at arrival was associated with a 52% lower odds of
death within 30 days (odds ratio; 0.48), and ACEI or ARB for LVSD was associated
with a 65% lower odds o f death within 30 days (odds ratio; 0.35).
94
Reproduced with permission of the copyright owner. Further reproduction prohibited without permission.

Further research on the P4P measures that were not associated with improved
outcomes at a statistically significant level (e.g., beta blocker at discharge, smoking
cessation advice, thrombolytic agent within 30 minutes, PCI within 120 minutes) is
recommended using a larger patient population. If analyses are conducted on a large
patient population and the results still show that these indicators are not predictors of
improved outcomes at a statistically significant level, then it may be important to
revisit the value o f including these measures in P4P programs. Although evidence-
based literature identifies certain process measures as predictive of better outcomes,
the literature also suggests that not all process measures are indeed good predictors of
outcomes.27’65 If there are other indicators that are statistically significant predictors of
lower mortality, then perhaps increased attention should be focused on those
indicators rather than these four indicators.
Outcomes data for Premier, Inc. patients was not able to be obtained, however,
analyses comparing Scripps Health and Premier, Inc. process measure compliance and
patient mortality could shed further light on the relationship between the AMI P4P
indicators and patient outcomes.
While mortality is the outcome o f most interest, as it is often the primary
concern of the patient and the healthcare provider, readmissions are a way to assess
potential morbidity. If a patient is readmitted to a hospital within 30-days, it may
indicate that the patient had a complication while recovering from earlier treatment. A
readmission may also indicate that appropriate care may not have been received at an
earlier visit, warranting a return with continued illness that is more severe and cannot
95
Reproduced with permission of the copyright owner. Further reproduction prohibited without permission.

be handled on an outpatient basis. A logistic regression on the total patient population
using readmissions within 30-days as the outcome variable identified that receiving
aspirin at discharge was associated with an increased probability of having a
readmission within 30-days, while receiving all recommended P4P measures was
associated with a decreased probability of having a readmission within 30-days. This
analysis shows that although receiving all applicable P4P measures is not a predictor
of lower mortality, it may be a predictor o f lower morbidity. Patients receiving all
applicable P4P measures had a 35% lower odds o f a readmission within 30 days (odds
ratio; 0.65).
Aspirin at discharge was found to be a significant predictor of higher morbidity
(readmissions within 30 days). This result may be confounded by the fact that the
patients who received aspirin at discharge had higher incidence o f comorbities that can
lead to disease complications. For example, there higher rates o f obesity (eight percent
o f patients with aspirin at discharge had obesity compared to three percent without)
and smokers (19% of patients with aspirin at discharge were current smokers
compared to 14% without aspirin at discharge). There was also a large difference in
patients receiving no cardiac treatment for AMI (17% of patients with aspirin at
discharge had no cardiac treatment compared to 40% without), which is a predictor of
higher mortality. Patients without cardiac treatment who die have no opportunity to be
readmitted, which may affect readmission rates. Further research is needed to
determine whether there are other characteristics o f patients receiving aspirin at
discharge that are associated with increased readmission rates. Confounding variables
96
Reproduced with permission of the copyright owner. Further reproduction prohibited without permission.

impacting these results may be a more likely hypothesis than concluding that
providing aspirin at discharge is indeed increasing readmission rates.
Covariates’ Impact on Outcomes
The test of the proportional hazard assumption was violated for four variables:
Asian/Pacific Islander race; identified payor; thrombolysis treatment; and depression.
“If we estimate a proportional hazard model when the assumption is violated for some
variable (thereby suppressing the interaction), then the coefficient we estimate for that
variable is a sort o f average effect over the range of times observed in the data.”85
Therefore, caution must be taken in making conclusions based upon these four
covariates. Asian/Pacific Islander race and depression did not have a statistically
significant impact on outcomes, while identified payor and thrombolysis treatment
were predictors of worse mortality. Thrombolytic administration is no longer the
recommended treatment for patients seen in hospitals with cath labs and was only
given to a small subset o f patients. All Scripps Health facilities have cath labs,
therefore, it is not surprising that thrombolysis treatment was associated with worse
outcomes. Patients with an identified payor had a mean age of 70 compared to a mean
age o f 54 for those patients without an identified payor. Age may be confounding the
negative effect on outcomes that identified payor is indicating. However, it is
important to note again that no conclusions should be made based upon the
thrombolytic agent within 30 minute or the identified payor variables.
97
Reproduced with permission of the copyright owner. Further reproduction prohibited without permission.

There were other covariates that were determined to have a statistically
significant impact on outcomes that did not violate the proportional hazards
assumption. Being widowed, having an identified PCP, having CABG surgery, having
PCI surgery, having dyslipidemia, having hypertension, and having a higher
admissions per 1CU bed ratio were all predictors of lower/better mortality. Being
treated at Scripps Memorial Hospital Encinitas or Scripps Mercy Hospital San Diego
was associated with worse outcomes than patients seen at Scripps Mercy Hospital
Chula Vista. Other predictors o f higher mortality rates were increased age, having no
cardiac treatment, having diabetes, and having higher hospital-wide annual AMI
admissions.
Being widowed was associated with a 20% lower risk of death (hazard ratio;
0.80) than being single. This finding is interesting considering that the literature
suggests that being single and being widowed are associated with higher rates of
mortality compared to married individuals.72 One difference in these populations that
could possibly account for some of the difference in risk of death was that only 9% of
widowers were current smokers compared to 28% of single people. Additional
analysis is recommended on possible differences in widowed and single patient
populations that may impact the risk of death.
Having an identified PCP was used as a proxy for access to care, the
assumption being that if a patient has an identified physician, then perhaps the patient
is being seen for regular preventive, well-check, and follow-up to treatment exams. As
noted in Table 2, having regular access to care is associated with decreased mortality,
98
Reproduced with permission of the copyright owner. Further reproduction prohibited without permission.

which was confirmed with this analysis. This study showed that having an identified
PCP was associated with a 24% lower risk of death (hazard ratio; 0.76) than patients
who did not have an identified PCP.
The belief before beginning the data analysis was that PCI procedures may be
associated with better outcomes as they are less invasive (and therefore less risky) and
require less recovery time than do open heart surgeries. It is interesting that CABG
surgery, as well as PCI treatment, was associated with improved outcomes. Patients
with CABG surgery had a 42% lower risk o f death (hazard ratio; 0.58) and patients
with PCI/angioplasty had a 52% lower risk of death (hazard ratio; 0.48) than patients
without these treatments. For more severe patients, CABG surgery may be preferable
to PCI treatment. For the patients in this study, both treatment options were shown to
be effective in reducing mortality.
The comorbidities dyslipidemia and hypertension were included in the analysis
because they are risk factors for heart disease. This analysis showed that patients who
had dyslipidemia had a 58% lower risk o f death (hazard ratio; 0.42) and patients who
had hypertension had a 16% lower risk o f death (hazard ratio; 0.84) than patients who
did not have these conditions. This finding was opposite of what was expected. One
explanation for this finding is that patients who have documented and coded illness are
likely being treated for their condition. Some individuals without documented and
coded illness may have other chronic conditions but may not be getting treatment or
having active management of their disease. Additionally, in some cases, patients
without the specified illness may be sicker than those who do have the specified
99
Reproduced with permission of the copyright owner. Further reproduction prohibited without permission.

illness. For instance, patients with hypotension may be too sick to treat and may have
a higher risk of death than hypertensive patients. Given that the direction o f the effect
on mortality was unexpected for patients with dyslipidemia and hypertension, further
research is recommended related to these comorbidities.
The ratio of AMI admissions per ICU beds was used as a proxy for technology.
The expectation before running the analysis was that the lower the ratio of admissions
per ICU bed, the higher the technology available for that facility. However, the results
turned out otherwise, with higher rates o f AMI admissions per ICU bed being a
predictor o f improved patient outcomes. As the ratio o f annual AMI admission per
ICU beds increases by one (e.g., from 13.0 to 14.0), there is a 36% lower risk o f death
(hazard ratio; 0.64). Perhaps for this study, a high ratio o f AMI volume to ICU beds is
an indicator of the fact that higher levels o f volume necessitate increased throughput
and efficiency which lead to faster time to treatment. According to one interventional
cardiologist at Scripps Green Hospital, the busier his day is, the more efficient and
responsive he is to staff. Again, additional research is needed to determine whether
this is a valid rival hypothesis.
Patients seen at Scripps Memorial Hospital Encinitas had a 25% higher risk of
death (hazard ratio; 25.0) and patients seen at Scripps Mercy Hospital San Diego had a
13% higher risk o f death (hazard function; 13.4) than patients seen at Scripps Mercy
Hospital Chula Vista. [Note that the interpretation of hazard functions is different for
categorical variables than for continuous and binary variables.] There may be
differences in the patient populations that confound and/or lead to these results. For
100
Reproduced with permission of the copyright owner. Further reproduction prohibited without permission.
instance, at Scripps Memorial Hospital Encinitas, 67% of patients received all
recommended P4P metrics compared to 73% at Scripps Mercy Hospital Chula Vista.
At Scripps Mercy Hospital San Diego only 30% o f patients had an identified PCP
(predictive o f lower mortality) than patients at Scripps Mercy Hospital Chula Vista
where 47% had an identified PCP. Follow-up analysis on differences between these
facilities is needed to better understand their impact on outcomes.
The data from this study confirmed what is well known in the general
population, which is that older patients have increased risk of death. In this study of
AMI patients, for each additional year older a patient is, his/her risk of dying is four
percent (hazard ratio; 1.04) greater that o f the previous year.
It is intuitive that patients receiving no cardiac treatment were shown to have
worse outcomes in this study as they may be too sick to treat. Standard interventions
for heart attack patients like PCI procedures and CABG surgeries are proven in
evidence-based literature to improve outcomes. However, patients may refuse
treatment, may have contraindications to treatment, or may not benefit from treatment
given the severity of their condition. Patients in this study who received no cardiac
treatment had 68% higher risk of death (hazard ratio; 1.68).
As noted in Table 2, other literature has shown that patients with diabetes who
have an AMI have a higher risk o f mortality. Similar to the literature on this subject,
this study confirmed that the comorbidity o f diabetes is a predictor of increased
mortality. Patients with diabetes had a 17% higher risk of death (hazard ratio; 1.17)
than those who did not.
101
Reproduced with permission of the copyright owner. Further reproduction prohibited without permission.

An interesting result of this analysis was that the higher the annual AMI
admissions, the worse the outcome. Each additional annual AMI admission is
predictive o f a two percent higher risk of death (hazard ratio; 1.02). Volume is often
used as an indicator o f high performing health care providers in recognition awards
such as the U.S. News & World Report or the Leapfrog Top 100 Hospitals list. It is
believed that the more often an organization or a clinician performs a certain service,
the better he/she/it is at it. The results o f this study indicate that higher hospital AMI
volume may be a predictor of worse outcomes (i.e., higher mortality). The non-
intuitive result illuminates the issue that annual AMI admissions is an indicator of
disease burden only. Volume does not denote whether optimal therapy was given.
Additional analysis using the number of CABG surgeries for patients who receive a
CABG surgery and number o f PCI procedures performed for patients who receive a
PCI, is recommended rather than the number of patients seen irrespective o f treatment.
Should results o f follow-up analysis support this study’s findings, a rival hypothesis
that if volumes increase past a certain threshold, resources may not be able to support
the increase in volume with the same high level of service should be investigated.
Perhaps the needed beds, cardiologists, or equipment is not available in a timely
manner if volumes are higher than ideal for a certain facility.
Pay-for-Performance’s Impact on Outcomes
The regression discontinuity analysis did not note any significant changes in
mortality due to participation in the HQA. Thirty-day, 90-day, and 180-day mortality
102
Reproduced with permission of the copyright owner. Further reproduction prohibited without permission.
rates did improve over the time period, however, the slope and intercept of the post-
HQA compared to pre-HQA time periods were not statistically significant. If the HQA
was responsible for a change in patient outcomes, one would expect the slope and/or
intercept of the performance after participation in the HQA to be different from the
performance before participation in the HQA. However, the slope and intercept did
not change at a statistically significant level, therefore, one cannot conclude that the
noted improvements in 30-day, 90-day, and 180-day mortality rates were caused by
pay-for-performance.
A trend line for readmission rates within 30 days shows a general downward
trend in readmission rates from 2003 to 2005, possibly indicating that patient
morbidity improved during this time. Again, if the HQA provided the impetus for
improvement, one would expect the slope and/or intercept o f the performance pre-
HQA to be different from post-HQA, which was not the case. Therefore, it is not
appropriate to conclude that the HQA improved Scripps Health’s readmission rate
within 30 days.
The randomized and non-randomized controlled trials on P4P suggest that the
majority o f studies/indicators analyzed achieved their desired outcome, however, some
studies also show that the desired outcomes were not achieved and that unintended
11 58effects o f P4P may exist. ’ This study’s results indicate that in a healthcare system
that is already improving performance on process measures liked to P4P/P4R
programs and already improving mortality rates, P4P/P4R participation does not break
that pattern. While participation in the HQA may have affected process and/or
103
Reproduced with permission of the copyright owner. Further reproduction prohibited without permission.

outcomes at Scripps Health, it cannot be confirmed by this study. The null hypothesis
for the second study aim held, which is that outcomes did not improve as a results of
P4P. However, this study is able to confirm that a health system can both participate in
a P4P/P4R program and continue to improve outcomes.
Some healthcare providers argue that the P4P metrics are not indicators that
should be of primary focus when providing patient care and that by participating in
public reporting and P4P programs, all one’s time is spent documenting information
and collecting new data rather than improving care. The results of this study challenge
the notion that participating in the HQA can be a hindrance to providing high quality
care, as Scripps was able to do both.
Summary
This is an exploratory analysis. The study results identified that Scripps Health
process measure compliance increased over the study time period, however, the
conclusion cannot be made that P4P caused the increase in performance levels over
this time. This study found that four of the eight individual AMI process measures
were predictors of improved outcomes at statistically significant levels. However, this
study also found that P4P was not the direct cause of improved patient outcomes.
At the onset of this research project, the intent was to find out whether P4P
achieved its intended effect of improving outcomes. The literature suggests that by
complying with certain process measures, outcomes should improve. The problem
with the current literature is that it assumes that if everything else is held constant and
104
Reproduced with permission of the copyright owner. Further reproduction prohibited without permission.
process measures improve, outcomes will improve. In the actual context o f hospital
operations, there are limited resources. In order to improve process measure scores,
another activity that may also lead to improved outcomes may be overlooked or
forgotten. There is the potential to decrease or not affect outcomes by participating in
P4P if limited resources are shifted to focus on activities that are not the most
important in ensuring the best possible outcomes. This research showed that for
Scripps Health, survival did improve from 2003 to 2005. Therefore, the potential
unintended effects of participation in the HQA did not have a significantly negative
impact on outcomes.
Further research to determine what factors led to the improved outcomes from
2003 to 2005 would be beneficial. For instance, the mean hospital paid FTE per
adjusted occupied beds variable increased over time. Further analysis could be done to
determine whether increases in staffing had a statistically significant impact on patient
mortality and if there were certain factors that led to increased staffing levels. In
addition, the percent o f patients with no cardiac treatment decreased during this time
period from 30% in early 2003 to 17% in late 2005, and having no cardiac treatment
was a statistically significant predictor o f higher mortality. Focusing on appropriate
acute care treatment options and treatment o f comorbid/chronic conditions is also
recommended.
Rosenthal and Frank said that there is little empirical evidence to support the
effectiveness of paying for quality in healthcare.64 This study cannot support or refute
Rosenthal and Frank’s statement, however, it can pose additional questions and areas
105
Reproduced with permission of the copyright owner. Further reproduction prohibited without permission.
for research. For instance, other literature shows that public reporting increases
improvement beyond the collection of data and private reporting.86 This study does not
show a significant difference in improvement rates before and after public reporting,
so does collecting data result in improvements up to a certain point and then does
public reporting/P4P drive performance to a level which is not easily achieved without
a financial and/or reputation risk to the healthcare provider? Are there process
measures that may be more indicative of lower mortality than those currently used by
P4P and P4R programs? Can the early and lagged effects o f participation in P4R/P4P
programs be quantified so that the question o f whether it is effective to pay for quality
in healthcare be answered? The intent o f this research was to answer questions about
the value and impact of P4P. Instead of answering those questions, this analysis
identified additional areas of needed investigation.
L im it a t io n s
There are a number of limitations of this study. The limitations span from the
study design to the data that was able to be collected. Ideally, a true experimental
study design with patients seen from hospitals nation-wide randomized into pay-for-
performance and non-P4P payment methodologies would have been used. Ideally, all
the data identified in the conceptual model would have been able to be obtained and
the sample size for the patient-level data would have been similar to that which was
collected for the other nation-wide HQA participants (e.g., greater than one million) so
that one could have confidence that the sample size is large enough to elicit significant
106
Reproduced with permission of the copyright owner. Further reproduction prohibited without permission.

results. However, it is often unrealistic or unfeasible to conduct ideal studies. True
experimental study designs with randomized hospitals into P4P and non-P4P programs
have not yet been conducted and would require collaboration with payment
organizations such as insurance companies, employers, and/or the federal government.
It is also difficult to obtain large scale, national patient-level data with the patient
demographic, patient behavior, hospital characteristic, treatment, and outcome
information needed due to patient privacy rules. Given these constraints, a quasi-
experimental study was conducted. Inherent in this study are limitations.
One set o f limitations are those due to the data that was able to be collected.
Scripps Health patient level data was used rather than national data. Due to
relationships with Scripps Health and an understanding of the data collected and its
organizational characteristics, it was felt that a study using Scripps Health data could
be conducted in a timely fashion, whereas, contacting hospitals nationally and
establishing cooperation and Institutional Review Board approval could take years to
complete.
Scripps Health operates five hospital campuses in San Diego County. Each
hospital campus serves different populations o f patients as evidenced through the
different locations, payor mixes and religious affiliations. While each of the five
facilities is different from each other, there may be characteristics of Scripps Health
(such as the performance rate of process measures and outcomes before participation
in the HQA) that limit the ability to apply this study’s findings to other hospitals.
107
Reproduced with permission of the copyright owner. Further reproduction prohibited without permission.
External validity may be compromised due to the fact that patient data has been
collected from one health system in one geographical location.
The goal of this study is to determine how P4P affects patient outcomes,
however, this study uses scores from the Hospital Quality Alliance, which is a pay-for-
reporting program. Reimbursement for participation in the Hospital Quality Alliance is
the same for all participants regardless o f one’s process measure scores. The fact that
payment does not reward the high performers (and potentially disadvantage the low
performers) may limit the ability to extrapolate these findings to true P4P programs.
The HQA was chosen as the intervention because most hospitals have not participated
in a true P4P program and those that have (e.g., Premier, Inc.) do not make patient
level data available to the public. Since these findings are based upon a pay-for-
reporting system, they may underestimate the true effect of a P4P program. If high
performing hospitals were paid more than others, it may create a larger motivation to
improve one’s scores. Because Scripps Health has expected (and the expectation has
since been confirmed) that the Hospital Quality Alliance will eventually become a true
P4P program, this potential limitation may be mitigated but not eliminated.
Another potential limitation to this study is that the total patient population of
3,954 patients may be too small to yield statistically significant results on outcomes.
Results o f analyses on the full patient population and in the time series design that are
not currently statistically significant could become statistically significant if the
patient population was larger.
108
Reproduced with permission of the copyright owner. Further reproduction prohibited without permission.
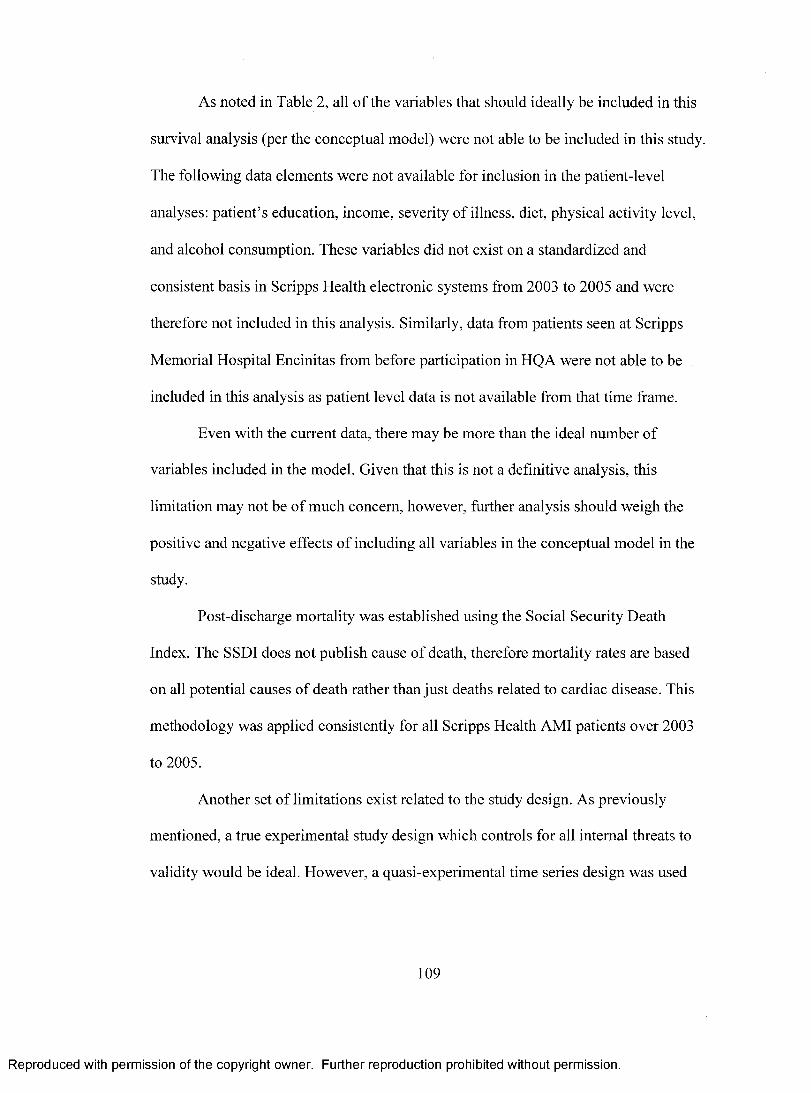
As noted in Table 2, all o f the variables that should ideally be included in this
survival analysis (per the conceptual model) were not able to be included in this study.
The following data elements were not available for inclusion in the patient-level
analyses: patient’s education, income, severity of illness, diet, physical activity level,
and alcohol consumption. These variables did not exist on a standardized and
consistent basis in Scripps Health electronic systems from 2003 to 2005 and were
therefore not included in this analysis. Similarly, data from patients seen at Scripps
Memorial Hospital Encinitas from before participation in HQA were not able to be
included in this analysis as patient level data is not available from that time frame.
Even with the current data, there may be more than the ideal number of
variables included in the model. Given that this is not a definitive analysis, this
limitation may not be o f much concern, however, further analysis should weigh the
positive and negative effects o f including all variables in the conceptual model in the
study.
Post-discharge mortality was established using the Social Security Death
Index. The SSDI does not publish cause o f death, therefore mortality rates are based
on all potential causes of death rather than just deaths related to cardiac disease. This
methodology was applied consistently for all Scripps Health AMI patients over 2003
to 2005.
Another set of limitations exist related to the study design. As previously
mentioned, a true experimental study design which controls for all internal threats to
validity would be ideal. However, a quasi-experimental time series design was used
109
Reproduced with permission of the copyright owner. Further reproduction prohibited without permission.
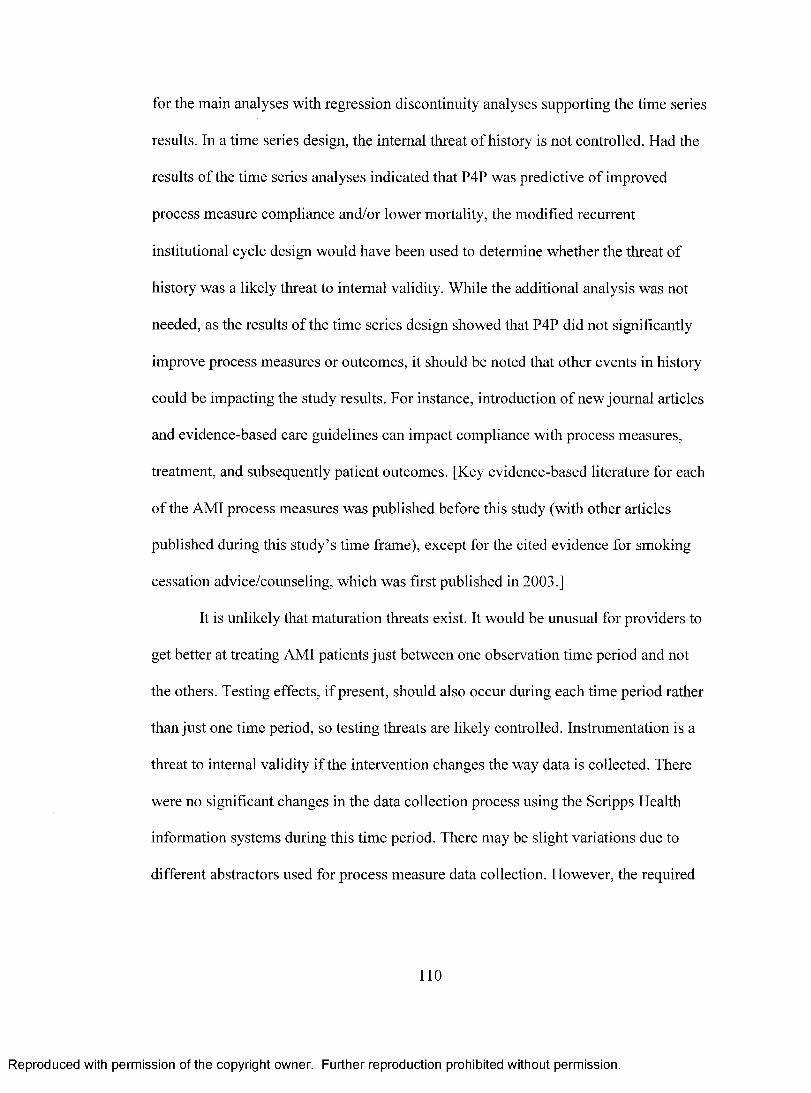
for the main analyses with regression discontinuity analyses supporting the time series
results. In a time series design, the internal threat of history is not controlled. Had the
results of the time series analyses indicated that P4P was predictive o f improved
process measure compliance and/or lower mortality, the modified recurrent
institutional cycle design would have been used to determine whether the threat of
history was a likely threat to internal validity. While the additional analysis was not
needed, as the results of the time series design showed that P4P did not significantly
improve process measures or outcomes, it should be noted that other events in history
could be impacting the study results. For instance, introduction of new journal articles
and evidence-based care guidelines can impact compliance with process measures,
treatment, and subsequently patient outcomes. [Key evidence-based literature for each
of the AMI process measures was published before this study (with other articles
published during this study’s time frame), except for the cited evidence for smoking
cessation advice/counseling, which was first published in 2003.]
It is unlikely that maturation threats exist. It would be unusual for providers to
get better at treating AMI patients just between one observation time period and not
the others. Testing effects, if present, should also occur during each time period rather
than just one time period, so testing threats are likely controlled. Instrumentation is a
threat to internal validity if the intervention changes the way data is collected. There
were no significant changes in the data collection process using the Scripps Health
information systems during this time period. There may be slight variations due to
different abstractors used for process measure data collection. However, the required
110
Reproduced with permission of the copyright owner. Further reproduction prohibited without permission.

80% abstraction accuracy rate was always met, so while instrumentation could be a
threat to internal validity, it is unlikely to be a significant threat in this study.
Regression threats are controlled because regression towards the mean trends decline
over time and, therefore, would be an unlikely rival hypothesis for a change in scores
from after compared to before participation in the HQA. Selection is not a threat
because all patients selected by MIDAS+ for the AMI Focus Study based upon
diagnosis codes 410.00 - 410.92 are included in the analysis. Patients are not able to
drop out o f the study. Attrition is another unlikely threat as none of the patients or
hospitals dropped out of the study. Interactions such as those between selection and
maturation are also controlled with the time series design.
The time series study design, however, does not control for external threats to
validity such as interaction of testing and the intervention and the interaction between
selection and the intervention. Similar analyses to those conducted in this study using
different patient populations is recommended in order to substantiate the external
validity o f the results of this study.
The time series design compares data from after an intervention to before an
intervention, so the timing of the intervention is o f key importance. The analyses to
determine whether P4P affected process measures and/or outcomes used the date of
initiation o f HQA as the intervention date. Hospitals learned about the HQA before the
implementation date, however, from subjective discussions with California hospitals
in early 2004, many were not prepared for the HQA. Most hospitals mentioned a
desire and an intent to participate but some had to scramble to sign up before the
111
Reproduced with permission of the copyright owner. Further reproduction prohibited without permission.

deadline and the majority had not been actively focused on making improvements in
these measures. When participation in the HQA began on July 1, 2004, discharges
from the fourth quarter o f 2003 were submitted to the HQA. However, October 1,
2003 was not chosen as the intervention date because hospitals did not have the
opportunity to affect care processes for patients previously discharged. Therefore, the
implementation date for July 1, 2004 (the implementation date of the HQA) was
chosen as the intervention date. It is possible, however, for early or lagged effects to
have occurred. Efforts are being currently made at Scripps Health to improve AMI
process measure scores in anticipation o f CMS’ Values Based Purchasing plan. These
analyses did not specifically look for early or delayed effects of participation in the
HQA, although they could exist.
Most o f the analyses were conducted with patient-level data from Scripps
Health. However, for the modified recurrent institutional cycle design between
Premier, Inc. and Scripps Health, a major limitation exists. Scripps Health and
Premier, Inc. are different hospital systems and may be non-equivalent. Scripps Health
is located in San Diego, California, while the Premier, Inc. hospitals are located
nation-wide. Both hospital systems have different information technology systems
used to collect patient data and process measure compliance. Differences between
performance improvement activities and the systems’ Board/management
prioritization o f quality improvement is unknown. Both hospital systems are similar in
that they functioned from 2003 to 2005 in a largely decentralized fashion with
different (i.e. non-standardized) care processes utilized by the different facilities
112
Reproduced with permission of the copyright owner. Further reproduction prohibited without permission.
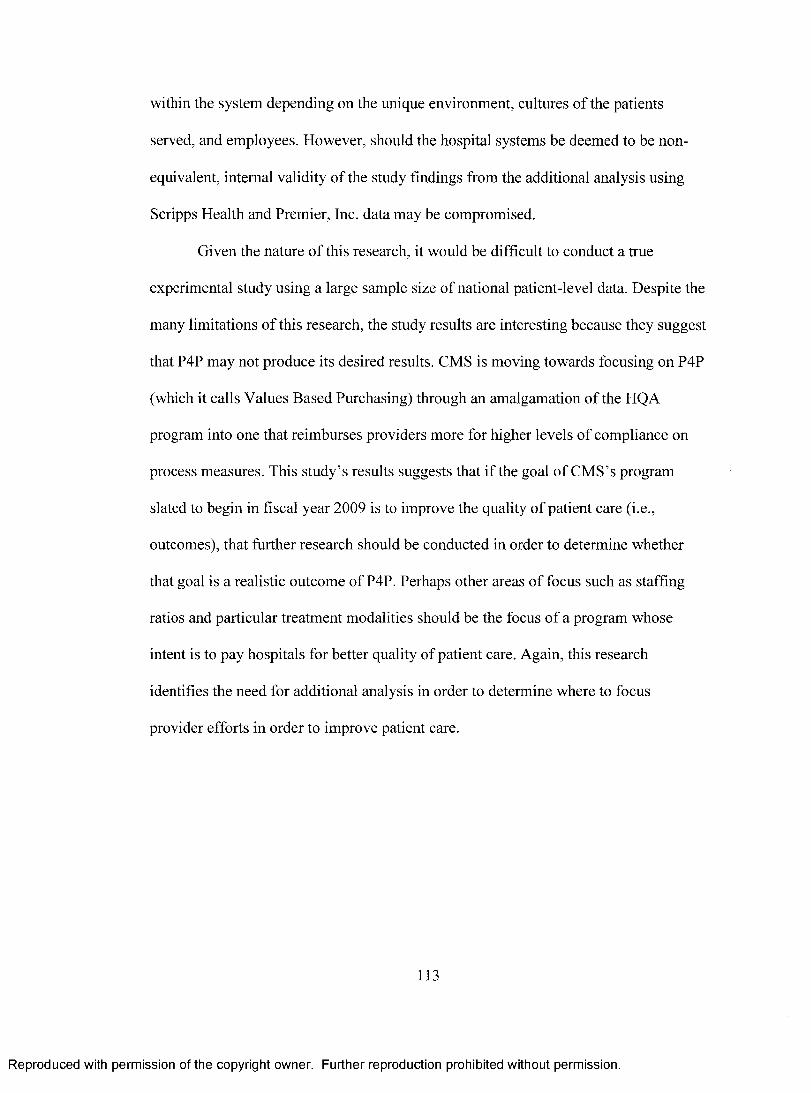
within the system depending on the unique environment, cultures of the patients
served, and employees. However, should the hospital systems be deemed to be non
equivalent, internal validity of the study findings from the additional analysis using
Scripps Health and Premier, Inc. data may be compromised.
Given the nature o f this research, it would be difficult to conduct a true
experimental study using a large sample size o f national patient-level data. Despite the
many limitations o f this research, the study results are interesting because they suggest
that P4P may not produce its desired results. CMS is moving towards focusing on P4P
(which it calls Values Based Purchasing) through an amalgamation of the HQA
program into one that reimburses providers more for higher levels o f compliance on
process measures. This study’s results suggests that if the goal o f CMS’s program
slated to begin in fiscal year 2009 is to improve the quality o f patient care (i.e.,
outcomes), that further research should be conducted in order to determine whether
that goal is a realistic outcome of P4P. Perhaps other areas of focus such as staffing
ratios and particular treatment modalities should be the focus o f a program whose
intent is to pay hospitals for better quality of patient care. Again, this research
identifies the need for additional analysis in order to determine where to focus
provider efforts in order to improve patient care.
113
Reproduced with permission of the copyright owner. Further reproduction prohibited without permission.

Attachment I: Premier Hospital Quality Incentive Demonstration87
According the CMS Fact Sheet, “The Premier Hospital Quality Incentive Demonstration will recognize and provide financial rewards to hospitals that demonstrate high quality performance in a number of areas o f acute care. The demonstration involves a CMS partnership with Premier, Inc., a nationwide organization of not-for-profit hospitals, and will reward participating top performing hospitals by increasing their payment for Medicare patients. Participating hospitals’ performance under the demonstration will be posted at www.cms.hhs.gov for health care professionals.
CMS is pursuing a vision to improve the quality o f health care by expanding the information available about quality o f care and through direct incentives to reward the delivery of superior quality care. Through the Premier Hospital Quality Incentive Demonstration, CMS aims to see a significant improvement in the quality of inpatient care by awarding bonus payments to hospitals for high quality in several clinical areas, and by reporting extensive quality data on the CMS web site. Premier was selected for the demonstration because, through its database o f hospitals in the Premier Perspective system, it has the ability to track and report quality data for 34 quality measures for each of its hospitals. This capability to immediately provide such a broad set of quality data makes the Premier database operationally unique and enables a rapid test of the concept of incentives for high performance in several areas o f quality.
Under the demonstration, top performing hospitals will receive bonuses based on their performance on evidence-based quality measures for inpatients with: heart attack, heart failure, pneumonia, coronary artery bypass graft, and hip and knee replacements. The quality measures proposed for the demonstration have an extensive record of validation through research, and are based on work by the Quality Improvement Organizations (QIOs), the Joint Commission on Accreditation of Healthcare Organizations (JCAHO), the Agency for Healthcare Research and Quality, the National Quality Forum (NQF), the Premier system and other CMS collaborators.
Hospitals will be scored on the quality measures related to each condition measured in the demonstration. Composite quality scores will be calculated annually for each demonstration hospital by ‘rolling-up’ individual measures into an overall quality score for each clinical condition. CMS will categorize the distribution o f hospital quality scores into deciles to identify top performers for each condition.
CMS will identify hospitals in the demonstration with the highest clinical quality performance for each of the five clinical areas. Hospitals in the top 20% of quality for those clinical areas will be given a financial payment as a reward for the quality of their care. Hospitals in the top decile of hospitals for a given diagnosis will be
114
Reproduced with permission of the copyright owner. Further reproduction prohibited without permission.

provided a 2% bonus o f their Medicare payments for the measured condition, while hospitals in the second decile will be paid a 1% bonus. The cost of the bonuses to Medicare will be about $7 million a year, or $21 million over three years.
In year three, hospitals that do not achieve performance improvements above demonstration baseline will have adjusted payments. The demonstration baseline will be clinical thresholds set at the year one cut-off scores for the lower 9th and 10th decile hospitals. Hospitals will receive 1% lower DRG payment for clinical conditions that score below the 9th decile baseline level and 2% less if they score below the 10th decile baseline level.
Hospitals participating in Premier Hospital Quality Incentive Demonstration reported previously collected quality data currently available in the Premier Perspective database to provide a historical reference on these quality indicators. The data was published at www.cms.hhs.gov in early 2004. The first year results will be reported in 2005 recognizing those hospitals with the highest quality and noting those hospitals that received bonus awards.
Participation in the demonstration is voluntary and open to hospitals in the Premier Perspective system as o f March 31, 2003. A total of 274 hospitals are participating in the demonstration. CMS will use the Premier demonstration as a pilot test o f this concept, and may develop a request for additional proposals for this concept once we obtain results from the evaluation of the Premier demonstration.”
115
Reproduced with permission of the copyright owner. Further reproduction prohibited without permission.

88Attachment II: Hospital Quality Initiative
According to the Hospital Quality Initiative Overview prepared by CMS, “Quality health care is a high priority for the Bush administration, the Department of Health and Human Services (HHS), and the Centers for Medicare & Medicaid Services (CMS). In November 2001, HHS announced the Quality Initiative to assure quality health care for all Americans through accountability and public disclosure. The Initiative is intended to (a) empower consumers with quality o f care information to make more informed decisions about their health care, and (b) encourage providers and clinicians to improve the quality o f health care.
The Quality Initiative was launched nationally in November 2002 for nursing homes, and was expanded in 2003 to the nation’s home health care agencies and hospitals. In 2004, the Quality Initiative was further expanded to officially include kidney dialysis facilities that provide services for patients with ESRD. This comprehensive approach to improving healthcare quality also includes the Doctor’s Office Quality-Information Technology (DOQ-IT) project.
The Hospital Quality Initiative uses a variety o f tools to help stimulate and support improvements in the quality o f care delivered by hospitals. The intent is to help improve hospitals’ quality of care by distributing objective, easy to understand data on hospital performance. This will encourage consumers and their physicians to discuss and make better informed decisions on how to get the best hospital care, create incentives for hospitals to improve care, and support public accountability.
CMS is working in conjunction with the Hospital Quality Alliance (HQA), a public- private collaboration on hospital measurement and reporting. This collaboration includes the American Hospital Association, the Federation o f American Hospitals, and the Association of American Medical Colleges, and is supported by Agency for Healthcare Research Quality (AHRQ), CMS and other organizations such as the National Quality Forum, the Joint Commission on Accreditation o f Healthcare Organizations, American Medical Association, Consumer-Purchaser Disclosure Project, AFL-CIO, AARP and the U.S. Chamber of Commerce. Through this initiative, a robust, prioritized and standardized set of hospital quality measures has been refined for use in voluntary public reporting. As the first step, Hospital Compare, a new website/webtool developed to publicly report valid, credible and user-friendly information about the quality of care delivered in the nation’s hospitals, debuted in April at www.hospitalcompare.hhs.gov and www.medicare.gov.
The Hospital Quality Initiative is complex and differs in several ways from the Nursing Home Quality Initiative and Home Health Quality Initiative. In the previous initiatives, CMS had well-studied and validated clinical data sets and standardized data transmission infrastructure from which to draw a number o f pertinent quality
116
Reproduced with permission of the copyright owner. Further reproduction prohibited without permission.
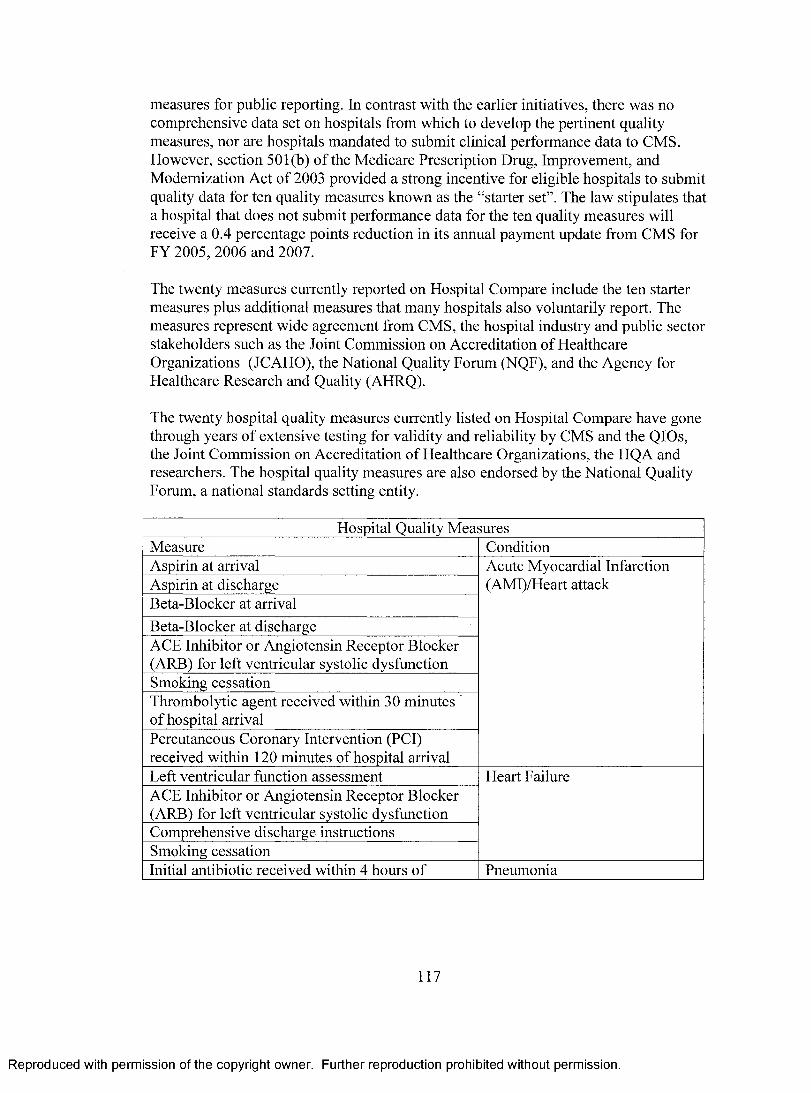
measures for public reporting. In contrast with the earlier initiatives, there was no comprehensive data set on hospitals from which to develop the pertinent quality measures, nor are hospitals mandated to submit clinical performance data to CMS. However, section 501(b) of the Medicare Prescription Drug, Improvement, and Modernization Act of 2003 provided a strong incentive for eligible hospitals to submit quality data for ten quality measures known as the “starter set”. The law stipulates that a hospital that does not submit performance data for the ten quality measures will receive a 0.4 percentage points reduction in its annual payment update from CMS for FY 2005, 2006 and 2007.
The twenty measures currently reported on Hospital Compare include the ten starter measures plus additional measures that many hospitals also voluntarily report. The measures represent wide agreement from CMS, the hospital industry and public sector stakeholders such as the Joint Commission on Accreditation of Healthcare Organizations (JCAHO), the National Quality Forum (NQF), and the Agency for Healthcare Research and Quality (AHRQ).
The twenty hospital quality measures currently listed on Hospital Compare have gone through years o f extensive testing for validity and reliability by CMS and the QIOs, the Joint Commission on Accreditation o f Healthcare Organizations, the HQA and researchers. The hospital quality measures are also endorsed by the National Quality Forum, a national standards setting entity.
Hospital Quality MeasuresMeasure ConditionAspirin at arrival Acute Myocardial Infarction
(AMI)/Heart attackAspirin at dischargeBeta-Blocker at arrivalBeta-Blocker at dischargeACE Inhibitor or Angiotensin Receptor Blocker (ARB) for left ventricular systolic dysfunctionSmoking cessationThrombolytic agent received within 30 minutes of hospital arrivalPercutaneous Coronary Intervention (PCI) received within 120 minutes of hospital arrivalLeft ventricular function assessment Heart FailureACE Inhibitor or Angiotensin Receptor Blocker (ARB) for left ventricular systolic dysfunctionComprehensive discharge instructionsSmoking cessationInitial antibiotic received within 4 hours of Pneumonia
117
Reproduced with permission of the copyright owner. Further reproduction prohibited without permission.

hospital arrivalPneumococcal vaccination statusBlood culture performed before first antibiotic receivedSmoking cessationOxygenation assessmentAppropriate initial antibiotic selectionProphylactic antibiotic received within 1 hour prior to surgical incision
Surgical Infection Prevention
Prophylactic antibiotics discontinued within 24 hours after surgery end time
These measures were chosen because they are related to three serious medical conditions and prevention o f surgical infections and it is possible for hospitals to submit information on for public reporting today. Both JCAHO and CMS provide their own processes to submit data and use data edit procedures to check data for completeness and accuracy. In addition, the quality measures are well understood by providers and stakeholders and can be validated by CMS with existing resources through its QIO program. The ultimate goal of CMS and its collaborators in the HQA is for this set o f measures to be reported by all hospitals, and accepted by all purchasers, oversight and accrediting entities, payers and providers. In the future, additional quality measures will be added to Hospital Compare.
CMS, along with its sister agency AHRQ, is in the final stages developing a standardized survey of patient perspectives of their hospital care, known as Hospital CAHPS (HCAHPS). Information from this survey will be publicly reported on Hospital Compare in the future. The survey has been tested by hospitals in Arizona, Maryland and New York as part of a CMS pilot project. Additional testing occurred in Connecticut and select sites around the country. Public reporting of standardized measures on patients’ perspectives o f the quality of hospital care will encourage consumers and their physicians to discuss and make more informed decisions on how to get the best hospital care, as well as increase the public accountability o f hospitals.
The Quality Initiative employs a multi-pronged approach to support, provide incentives and drive systems and facilities - including the clinicians and professionals working in those settings - toward superior care through:• Ongoing regulation and enforcement conducted by State survey agencies and CMS• New consumer hospital quality information on our websites, www.hospitalcompare.hhs.gov and www.medicare.gov, and at 1-800-MEDICARE• The testing o f rewards for superior performance on certain measures of quality• Continual, community-based quality improvement resources through the QIOs• Collaboration and partnership to leverage knowledge and resources
118
Reproduced with permission of the copyright owner. Further reproduction prohibited without permission.
CMS will continue to conduct regulation and enforcement activities to ensure that Medicare hospitals comply with federal standards for patient health and safety and quality of care. The survey and certification program is a joint effort o f the federal and state governments to ensure safety and improve the quality of care in health care facilities. These activities provide an important view of the quality o f care in hospitals.
CMS and the HQA will conduct an integrated communications campaign to encourage consumers and their physicians to discuss and make informed decisions on how to get the best hospital care. They will encourage patients to access hospital quality information on www.hospitalcompare.hhs.gov and www.medicare.gov or by calling 1- 800-MEDICARE. CMS will also direct the QIOs to promote awareness, understanding and use o f quality measures by working with clinicians and intermediaries including primary care physicians, community organizations, and the media.
As part of the Hospital Quality Initiative, CMS is exploring pay-for-performance via the Premier Hospital Quality Incentive Demonstration. Under the demonstration, hospitals will receive bonuses based on their performance on quality measures selected for inpatients with specific clinical conditions: heart attack, heart failure, pneumonia, coronary artery bypass graft, and hip and knee replacements. Hospitals will be scored on the quality measures related to each condition measured. Composite scores will be calculated annually for each demonstration hospital. Separate scores will be calculated for each clinical condition by “rolling up” individual measures into an overall score.
CMS will categorize the distribution o f hospital scores into deciles to identify top performers for each condition. For each condition, all o f the hospitals in the top 50% will be reported as top performers. Those hospitals in the top 20% will be recognized and given a financial bonus. By the end of the demonstration, it is anticipated that participating hospitals will show improvement from performance in year one. In year three, hospitals will receive lower payments if they score below clinical baselines set in the first year for the bottom 20% of hospitals.
The QIOs will continue to work with hospitals to improve performance on the hospital-reported measures and to develop and implement continuous quality improvement programs. The QIOs have worked with physicians, hospitals, and other providers on improvement activities for the past 20 years and have seen providers achieve a 10-20% relative improvement in performance. For the past three years, the QIOs have been working with hospitals to improve performance on most of the starter set of 10 hospital quality measures. During this period, performance on these measures has improved across the country. As part o f this initiative, the QIOs are also working with community, health care and business organizations, and with the local media to
119
Reproduced with permission of the copyright owner. Further reproduction prohibited without permission.

provide quality information to the public and encourage hospitals to use the information to improve care.
To be effective, the Hospital Quality Initiative must truly be a collaborative effort with hospitals and their associations, physicians, other clinicians, federal and state agencies, QIOs, independent health care quality organizations, private purchasers, accrediting organizations, and consumer advocates. The initiative is designed to improve communication among all parties to positively impact quality o f care. By collaborating to expand knowledge and resources, all partners can achieve greater and immediate improvements in the quality o f hospital care. The HQA, mentioned earlier, is a prime example of a cooperative effort in the Hospital Quality Initiative.
120
Reproduced with permission of the copyright owner. Further reproduction prohibited without permission.

Reproduced with
permission
of the copyright owner.
Further reproduction prohibited
without permission.
Attachment III: Conceptual Model
Patient Behavior* Diet (Fruits/Veggies)
* Failure to Drink Any Alcohol* Exercise Level* Smoking Status
Treatm ent* Thrombolysis* Angioplasty
* CABG * Other Open Heart Surgery
* Other Cardiac Diagnostic and Treatment Services
* N o Treatment
OutcomeDays Survival;
Readmissions in 30 Days
Regressor of Interest Increased P4P scores
* Aspirin at Arrival * Aspirin at Discharge
* Beta Blocker at Arrival* Beta Blocker at Discharge* ACEI or ARB for LVSD
* Smoking Cessation Advice* PCI Received w/in 120 Mins
* Thrombolytic Agent Received w/in 30 Minutes o f Arrival
Patient Dem ographics* Age* Race
* Gender* Access to Care
* Education* Income
* Marital Status* Religion
Patient's M edical Condition Hospital Characteristics /* CAD W orking Environm ent
* Prior MI * Staffing Ratios* Family Hx o f CAD * Response Team to AMI in ED
* Dyslipidemia * Center o f Excellence for Heart Care* Diabetes * Hospital / MD AMI Volume
* Hypertension * Technology Available* Obesity * Hospital Wealth / Payor Mix
* Stress / Depression * Teaching Hospital Status* Severity o f Illness / Comorbidities * Surgical Back-up

Reproduced with
permission
of the copyright owner.
Further reproduction prohibited
without permission.
Attachment IV: Variable Coding
Outcome Survival Post AMI Days Survival Post AMI continuous variableAlive/Dead at 30 Days Dead = 1; Alive = 0
Readmissions Readmissions within 30 Days Readmission = 1; Not = 0Regressor of Interest
Aspirin at Arrival Aspirin at Arrival Yes = 1; No = 0; NA = 99Aspirin at Discharge Aspirin at Discharge Yes = 1; No = 0; NA = 99Beta Blocker at Arrival Beta Blocker at Arrival Yes = 1; No = 0; NA = 99Beta Blocker at Discharge Beta Blocker at Discharge Yes = 1; No = 0; NA = 99ACEI or ARB for LVSD ACEI for LVSD Yes = 1; No = 0; NA = 99Adult Smoking Cessation Advice Smoking Cessation Advice Yes = 1; No = 0; NA = 99PCI Received w/in 120 mins of Arrival
PCI Received within 120 Mins of Arrival
Yes = 1; No = 0; NA = 99
Thrombolytic Agent Received w/in 30 mins of Arrival
Thrombolytic Agent Received w/in 30 Mins of Arrival
Yes = 1; No = 0; NA = 99
All Applicable P4P measures All Applicable P4P measures Yes = 1; No = 0PatientDemographics
Age Age continuous variableRace Race categorical variable
White = 1 (excluded); African American = 2; 3 = Native American; 4 = Asian/Pacific Islander; 5 = Other; 6 = Unknown
Gender Gender Female = 1; Male = 0

Reproduced with
permission
of the copyright owner.
Further reproduction prohibited
without permission.
PatientDemographics(cont'd)
Access to Care Insurance Status (Payor) Insurance Listed = 1; No or Unknown = 0
PCP Status Insurance Listed = 1; No or Unknown = 0
Education Data Unavailable NAIncome Data Unavailable NAMartial Status Martial Status categorical variable
Single = 1 (excluded); Widowed = 2; Divorced/Separated = 3; Married = 4
Religion Religion Stated Religion = 1; Not = 0
HospitalCharacteristics
Facility Facility categorical variable Chula Vista = 1 (excluded); Encinitas = 2; Green = 3; La Jolla = 4; Mercy San Diego = 5
Staffing Ratios Paid FTE per Adjusted Occupied Bed
continuous variable
Response Team to AMI in ED / Urgent Care
Rapid Response Team Yes = 1; No = 0Chest Pain Center Yes = 1; No = 0
Center of Excellence for Heart Care Center of Excellence for Cardiovascular Care
Yes = 1; No = 0

Reproduced with
permission
of the copyright owner.
Further reproduction prohibited
without permission.
HospitalCharacteristics
AMI Volume Total Hospital AMI Annual Admissions
continuous variable
(cont'd) AMI Volume (cont'd) Average Cardiologist AMI Annual Admissions
continuous variable
Technology Available Ratio of AMI Admissions to ICU Beds
continuous variable
Hospital Wealth / Payor Mix Payor Mix: % Medicare; % Medical; % Commercial; % Other Governmental & Self Pay; % Other
all continuous variables
Teaching Hospital Status Teaching Hospital Status Yes = 1; No = 0Surgical Back-Up Surgical Back-Up Present Yes = 1; No = 0
Patient's CAD CAD Yes = 1; No = 0Medical Prior MI Prior MI Yes = 1; No = 0Condition Family History of CAD Family History of CAD Yes = 1; No = 0
High LDL / Low HDL Levels Dyslipidemia Yes = 1; No = 0Diabetes Diabetes Yes = 1; No = 0Hypertension Hypertension Yes = 1; No = 0Obesity Obesity Yes = 1; No = 0Stress / Depression Depression Yes = 1; No = 0Severity of Illness / Risk of Mortality
Inconsistent Data NA
Treatment Thrombolysis Thrombolysis Thrombolysis = 1; Not = 0Angioplasty Angioplasty Angioplasty = 1; Not = 0CABG CABG CABG= 1; Not = 0

Reproduced with
permission
of the copyright owner.
Further reproduction prohibited
without permission.
Treatment Other Open Heart Surgery Other Open Heart Surgery Other Surgery = 1; Not = 0(cont'd) Other Cardiac Diagnostic or Other Cardiac Diagnostic or Other Cardiac Dx or Tx = 1;
Treatment Procedure Treatment Procedure Not = 0No Treatment No Treatment No Treatment = 1; Not = 0Months Since Admission Months Since Admission continuous variable
Patient Diet (Fruits / Veggies) No variable included NABehavior Failure to Drink any Alcohol No variable included NA
Exercise Level No variable included NASmoking Status Smoking Status within the past 12
monthsYes = 1; No or Unknown = 0
toU i

Reproduced with
permission
of the copyright owner.
Further reproduction prohibited
without permission.
Attachment V: Covariate Frequencies Over Time
Observation 1 1/1/03-6/30/03
Observation 2 7/1/03-12/31/03
Observation 3 1/1/04-6/30/04
Observation 4 7/1/04-12/31/04
Observation 5 1/1/05-6/30/05
Observation 6 7/1/05-12/31/05
n % n % n % n % n % n %Total Patients 642 100% 548 100% 734 100% 836 l()U"„ 668 100% 526 100%
SexMale 391 61% 331 60% 441 60% 529 63% 442 66% 365 69%Female 251 39% 217 40% 293 40% 307 37% 226 34% 161 31%
Age< 5 0 56 9% 30 5% 70 10% 82 10% 75 11% 44 8%50-59 87 14% 79 14% 112 15% 139 17% 123 18% 91 17%60-69 121 19% 109 20% 144 20% 185 22% 151 22% 113 21%70-79 171 27% 156 28% 202 28% 221 26% 175 26% 116 22%80+ 203 32% 174 32% 206 28% 209 25% 148 22% 162 31%
i
Ethnicity i
White 480 75% 311 57% 434 59% 531 64% 495 74% 411 78%African American 8 1% 18 3% 36 5% 22 3% 25 4% 17 3%Native American 2 0% 1 0% 1 0% 1 0% 0 0% 0 0%Asian/Pac Islander 42 7% 120 22% 131 18% 73 9% 40 6% 28 5%Other 109 17% 97 18% 132 18% 199 24% 99 15% 2 0%Unknown 1 0% 1 0% 0 0% 10 1% 9 1% 68 13%
Marital StatusSingle 134 21% 111 20% 188 26% 199 24% 165 25% 124 24%Widowed 125 19% 121 22% 133 18% 132 16% 108 16% 68 13%Divorced/Separted 34 5% 36 7% 47 6% 44 5% 41 6% 30 6%Married 349 54% 280 51% 366 50% 461 55% 354 53% 304 58%
ReligionStated Religion 442 69% 377 69% 511 70% 606 72% 437 65% 326 67%

Reproduced with
permission
of the copyright owner.
Further reproduction prohibited
without permission.
Observation 1 1/1/03-6/30/03
Observation 2 7/1/03-1: 5 1 03
Observation 3 1/1/04-6/30/04
Observation 4 7/1/04-12/31/04
Observation 5 1/1/05-6/30/05
Observation 6 7/1/05-12/31/05
n % n O n 0//o n % n % n O./oNo Stated Religion 200 31% \ - \ 31% 223 30% 2 R) 28% 231 35% 164 33%
FacilityChula Vista 139 22% 124 23% 160 22% 138 17% 81 12% 71 13%Encinitas 0 0% 0 0% 0 0% 104 12% 81 12% 64 12%Green 127 20% 123 22% 122 17% 96 11% 112 17% 83 16%La Jolla 148 23% 113 21% 233 32% 315 38% 196 29% 168 32%Mercy 228 36% 188 34% 219 30% 183 22% 198 30% 140 27%
PCPNo/Unknown 469 73% 364 66% 515 70% 608 73% 486 73% 289 55%Yes 173 l_ 27% 184 34% 219 30% 228 27% 182 27% 237 45%
PayorNo/Unknown 23 4% 26 5% 23 3% 38 5% 28 4% 26 5%Yes 619 96% 522 95% 711 97% 798 95% 640 96% 500 95%
CensoredYes/Alive 451 70% 411 75% 551 75% 682 82% 576 86% 464 88%No/Dead 191 30% 137 25% 183 25% 154 18% 92 14% 62 12%
ACEI for LVSD :No 28 25% 19 21% 27 29% 28 26% 14 17% 9 13%Yes 85 75% 70 79% 67 71% 78 74% 70 83% 60 87%Not Applicable 529 459 640 730 584 457
Smoking Cessation AdviceNo 43 43% 18 25% 35 27% 37 29% 14 11% 10 11%Yes 58 57% 53 75% 95 73% 92 71% 111 89% 83 89%Not Applicable 541 477 604 707 543 433

Reproduced with
permission
of the copyright owner.
Further reproduction prohibited
without permission.
Observation 1 1/1/03-6/30/03
Observation 2 7/1/03-12/31/03
Observation 3 1/1/04-6/30/04
Observation 4 7/1/04-12/31/04
Observation 5 1/1/05-6/30/05
Observation 6 7/1/05-12/31/05
n 0//o n OA/Q n % n % n % n %Aspirin at Arrival i
No 36 7% 22 5% 29 6% 20 4% 10 2% 4 1%Yes 453 93% 392 95% 428 94% 477 96% 399 98% 300 99%Not Applicable 153 134 277 339 259 222
Aspirin at DischargeNo 48 9% 47 10% 38 6% 27 4% 18 3% 7 2%Yes 479 91% 404 90% 547 94% 642 96% 498 97% 407 98%Not Applicable 115 97 149 167 152 112
Beta Blocker at ArrivalNo h 64 15% 48 13% 44 11% 16 r 4% 22 6% 11 4%Yes 356 85% 332 87% 356 89% 389 96% 322 94% 255 96%Not Applicable 222 168 334 431 324 260
Beta Blocker at DischargeNo 71 14% 73 17% 64 11% 64 10% 31 6% 21 5%Yes 420 86% 366 83% 494 89% 585 90% 484 94% 393 95%Not Applicable 151 109 176 187 153 112
Thrombolytic w/in 30 minNo 29 76% 19 63% 13 72% 23 82% 18 86% 11 69%Yes 9 24% 11 37% 5 28% 5 18% 3 14% 5 31%Not Applicable 604 518 716 808 647 510
PCI w/in 120 minNo 70 84% 52 72% 32 48% 36 47% 30 44% 17 29%Yes 13 16% 20 28% 35 52% 41 53% 38 56% 41 71%Not Applicable 559 476 667 759 600 468
j;

Reproduced with
permission
of the copyright owner.
Further reproduction prohibited
without permission.
Observation 1 1/1/03-6/30/03
Observation 2 7/1/03-12/31/03
Observation 3 1/1/04-6/30/04
Observation 4 7/1/04-12/31/04
Observation 5 1/1/05-6/30/05
Observation 6 7/1/05-12/31/05
n /o n % n 0/1/o n % n % n %A ll Applicable P4P Measures p...............
No 259 40% 185 34% 205 28% 205 25% 126 19% 75 14%Yes 383 60% 363 66% 529 72% 631 75% 542 81% 451 86%
!
CABG SurgeryNo 591 92% 518 95% 689 94% 758 91% 614 92% 480 91%Yes 51 8% 30 5% 45 6% 78 9% 54 8% 46 9%
Other Open Heart SurgeryNo 637 99% 539 98% 728 99% 824 99% 658 99% 520 99%Yes 5 1% 9 2% 6 1% 12 1% 10 1% 6 1%
PCI/Angioplasty TxNo 370 58% 286 52% 361 49% 369 44% 256 38% 207 39%Yes 272 42% 262 48% 373 51% 467 56% 412 62% 319 61%
Thrombosis TreatmentNo 607 95% 513 94% 713 97% 806 96% 643 96% 505 96%Yes 35 5% 35 6% 21 3% 30 4% 25 4% 21 4%
Other Prim. Cardiac Proc. (dx or tx)No 322 50% 272 50% 358 49% 323 39% 215 32%
o00 34%Yes 320 50% 276 50% 376 51% 513 61% 453 68% 346 66%
N o Cardiac TxNo 450 70% 391 71% 522 71% 657 79% 575 86% 437 83%Yes 192 30% 157 29% 212 29% 179 21% 93 14% 89 17%
1CAD
No 1 0% 0 0% 0 0% 0 0% 0 0% 2 0%Yes 641 100% 548 100% 734 100% 836 100% 668 100% 524 100%

Reproduced with
permission
of the copyright owner.
Further reproduction prohibited
without permission.
Observation 1 1/1/03-6/30/03
Observation 2 7/1/03-12/31/03
Observation 3 1/1/04-6/30/04
Observation 4 7/1/04-12/31/04
Observation 5 1/1/05-6/30/05
Observation 6 7/1/05-12/31/05
11 Q //O a O a/O n % n % n % n %Prior MI
No 604 94% 507 93% 682 93% 767 92% 622 93% 479 91%Yes 38 6% 41 7% 52 7% 69 8% 46 7% 47 9%
1Family History o f CAD i ■
No i 635 99% 543 99% 724 99% 809 97% 650 97% 510 97%Yes 7 1% 5 1% 10 1% 27 3% 18 3% 16 3%
DyslipidemiaNo 452 70% 377 69% 480 65% 501 60% 391 59% 277 53%Yes 190 30% 171 31% 254 35% 335 40% 277 41% 249 47%
DiabetesNo 445 69% 399 73% 525 72% 605 72% 482 72% 369 70%Yes 197 31% 149 27% 209 28% 231 28% 186 28% 157 30%
Hypertension :No 252 39% 205 37% 282 38% 319 38% 260 39% 185 35%Yes 390 61% 343 63% 452 62% 517 62% r 408 61% 341 65%
Obesity---------- - - ........
No 599 93% 507 93% 687 94% 782 94% 616 92% 492 94%Yes 43 7% 41 7% 47 6% 54 6% 52 8% 34 6%
Depression 1
No 617 96% 522 95% 708 96% 802 96% 646 97% 504 96%Yes 25 4% 26 5% 26 4% 34 4% 22 3% 22 4%
SmokerNo or Unknown 533 83% 474 86% 592 81% 688 82% 535 80% 425 81%Yes 109 17% 74 14% 142 19% 148 18% 133 20% 101 19%

Reproduced with
permission
of the copyright owner.
Further reproduction prohibited
without permission.
Observation 1 Observation 2 Observation 3 Observation 4 Observation 5 Observation 61/1/03-6/30/03 7/1/03-12/31/03 1/1/04-6/30/04 7/1/04-12/31/04 1/1/05-6/30/05 7/1/05-12/31/05
n % n (1/0 u 0/' n % ii 0'I) n 0//o
Readmit w/in 30 daysNo 599 93% 524 96% 698 95% 788 94% 634 95% 505 96%Yes 43 7% 24 4% 36 5% 48 6% 34 5% 21 4%
Paid FTE per Adj Occ Bed4 .5 -4 .9 131 20% 64 12% 110 15% 27 3% 14 2% 12 2%5 .0 -5 .4 211 33% 196 36% 278 38% 223 27% 146 22% 53 10%5 .5 -5 .9 258 40% 182 33% 266 36% 372 44% 386 58% 350 67%6.0 - 6.4 42 7% 106 19% 80 11% 149 18% 70 10% 28 5%6.5+ 0 0% 0 0% 0 0% 65 8% 52 8% r “ 83 16%
Rapid Response TeamNo 642 100% 548 100% 734 100% 836 100% 470 70% 386 73%Yes 0 0% 0 0% 0 0% 0 0% 198 30% 140 27%
Chest Pain CenterNo 414 64% 360 66% 515 70% 653 78% 470 70% 386 73%Yes 228 36% 188 34% 219 30% 183 22% 198 30% 140 27%
CV Award During Yr o f VisitNo 494 77% 435 79% 393 54% 557 67% 360 54% 275 52%Yes 148 23% 113 21% 341 46% 279 33% 308 46% 251 48%
Annual AMI Admissions< 2 0 0 0 0% 0 0% 0 0% 0 0% 274 41% 218 41%200 - 399 266 41% 247 45% 282 42% 338 40% 198 30% 140 27%400 - 599 228 36% 188 34% 159 24% 183 22% 0 0% 0 0%600 - 800 0 0% 0 0% 233 35% 315 38% 196 29% 168 32%800+ 148 23% 113 21% 0 0% 0 0% 0 0% 0 0%
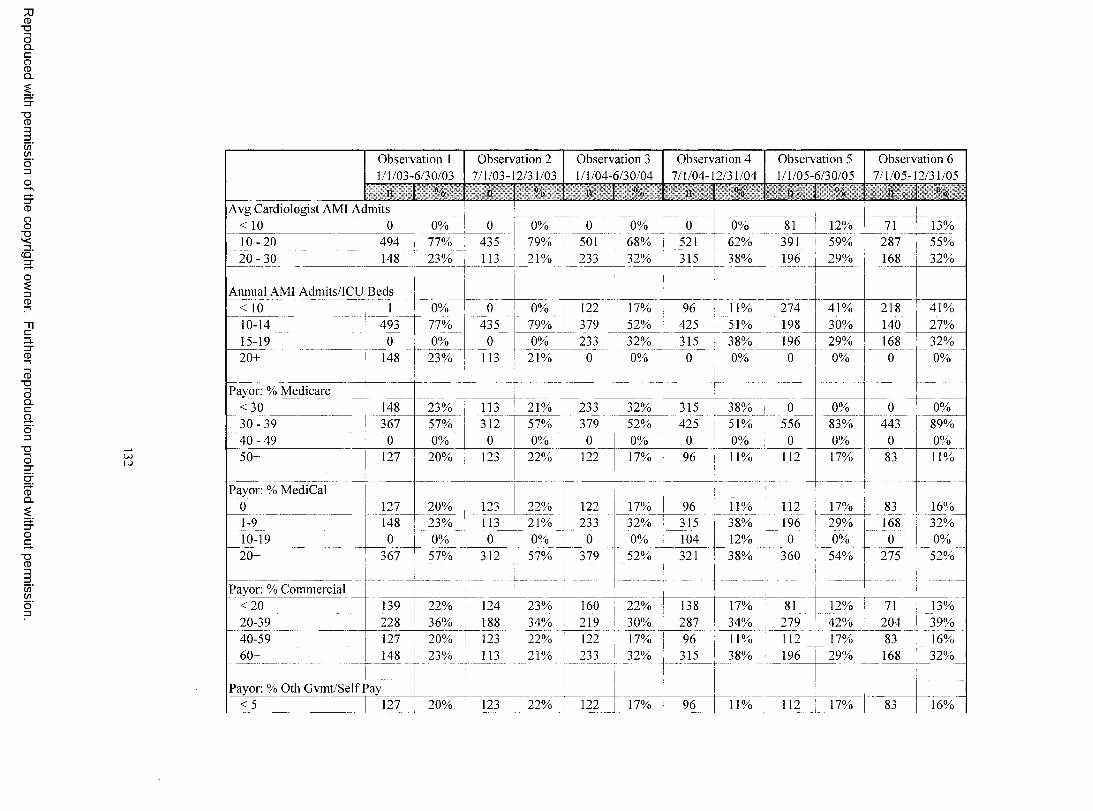
Reproduced with
permission
of the copyright owner.
Further reproduction prohibited
without permission.
Observation 1 1/1/03-6/30/03
Observation 2 7/1/03-12/31/03
Observation 3 1/1/04-6/30/04
Observation 4 7/1/04-12/31/04
Observation 5 1/1/05-6/30/05
Observation 6 7/1/05-12/31/05
n % n % n % n % n % n f). i)
A vg Cardiologist AMI Admits< 10 0 0% 0 0% o 0% 0 0% 81 12% 71 13%1 0 -2 0 494 77% 435 79% 501 68% 521 62% 391 59% 287 55%2 0 - 3 0 148 23% 113 21% 233 32% 315 38% 196 29% 168 32%
Annual AMI Admits/ICU Beds< 10 1 0% 0 0% 122 17% 96 11% 274 41% 218 41%10-14 493 77% 435 79% 379 52% 425 51% 198 30% 140 27%15-19 0 0% 0 0% 233 ^ 32% 315 38% 196 29% 168 32%20+ 148 23% 113 21% 0 0% 0 0% 0 0% 0 , 0%
Payor: % Medicare< 3 0 148 23% 113 21% 233 32% 315 38% 0 0% 0 0%3 0 - 3 9 367 57% 312 57% 379 52% 425 51% 556 83% 443 89%O
nIo
0 0% 0 0% 0 0% 0 0% 0 0% 0 0%50+ 127 20% 123 22% 122 17% 96 11% 112 17% 83 11%
Payor: % MediCal j0 127 20% 123 22% 122 17% 96 11% 112 17% 83 16%1-9 148 23% 113 H 21% 233 32% 315 38% 196 29% 168 32%10-19 0 i 0% 0 0% 0 0% 104 12% 0 0% 0 0%20+ 367 57% 312 57% 379 52% 321 38% 360 54% h 275 52%
Payor: % Commercial-------- --------- - ________ j. ...... . -------- 1 - --..—
< 2 0 139 22% 124 23% 160 j 22% 138 17% 81 12% 71 13%20-39 228 36% 188 r 3 4 % 219 30% 287 34% 279 42% 204 39%40-59 127 20% 123 22% 122 17% 96 11% 112 17% 83 16%60+ 148 23% 113 21% 233 32% 315 38% 196 29% 168 32%
!
Payor: % Oth Gvmt/Self Pay< 5 127 20% 123 22% 122 17% 96 11% 112 17% 83 16%

Reproduced with
permission
of the copyright owner.
Further reproduction prohibited
without permission.
U>
Observation 1 1/1/03-6/30/03
Observation 2 7/1/03-12/31/03
Observation 3 1/1/04-6/30/04
Observation 4 7/1/04-12/31/04
Observation 5 1/1/05-6/30/05
Observation 6 7/1/05-12/31/05
n °fl n « o n “h n % n % n %5-9 148 23% 1 11 21% 2''3 32% 419 50% 100 29% H>S 32%10-14 228 36% 188 34% 379 52% 321 38% 360 54% 275 52%15+ 139 22% 124 23% 0 0% 0 0% 0 0% 0 0%
Payor: % Oth Incl Wrk Comp< 5 642 100% 548 100% 734 100% 836 100% 668 100% 526 100%
Teaching Hospital StatusNo 287 45% 237 43% 393 54% 557 67% 279 42% 232 44%Yes , 355 55% 311 57% 341 46% 279 33% 389 58% 294 56%
iSurgical Back-up 1
No 139 22% 124 23% 160 J 22% 242 29% 162 24% 135 26%Yes 503 78% 424 77% 574 78% 594 71% r~506 76% 391 74%
30-Day MortalityAlive 561 87% 482 88% ^ 650 89% 766 92% 611 91% 484 92%Dead 81 13% 66 12% 84 11% ^ 70 8% 57 1 9% 42 8%
90-Day Mortality I
Alive 544 85% 473 86% 637 87% 741 89% 599 I 9o% n 476 90%Dead 98 15% 75 14% 97 13% 95 11% 69 10% 50 10%
1
180-Day Mortality |Alive 527 82% , 4 5 9 84% 619 84% 721 86% 589 88% 467 89%Dead 115 18% I- 89 16% 115 16% 115 14% 79 12% 59 11%

Attachment VI: Covariates Included in Stepwise Survival Analysis on Total Population
Results o f M odel w ith Aspirin at Arrival
Measure Name B SE Wald df Sig- L\p(IJ), 95.()‘, u Cl hxp(B)
Lower LpperChula Vista 33.8999 4 0.0000Encinitas -0.1210 0.1797 0.4537 1 0.5006 0.8860 0.6230 1.2600Green 0.0448 0.1706 0.0690 1 0.7927 1.0458 0.7486 1.4610La Jolla -0.6455 0.1442 20.0331 1 0.0000 0.5244 0.3953 0.6957Mercy 0.1140 0.1084 1.1075 1 0.2926 1.1208 0.9063 1.3860Age 0.0394 0.0038 106.6588 1 0.0000 1.0402 1.0324 1.0480Single 9.4984 0.0233Widowed -0.2831 0.1285 4.8578 1 0.0275 0.7534 0.5857 0.9691Divorced/Separated 0.1965 0.1725 1.2970 1 0.2548 1.2171 0.8679 1.7069Married -0.0301 0.1101 0.0746 1 0.7848 0.9704 0.7821 1.2040Identified PCP -0.3535 0.0933 14.3548 1 0.0002 0.7022 0.5848 0.8431Identified Payor 1.5366 0.5049 9.2615 1 0.0023 4.6486 1.7280 12.506PCI Tx -0.7567 0.1123 45.4293 1 0.0000 0.4692 0.3765 0.5847Dyslipidemia -0.9383 0.1238 57.4167 1 0.0000 0.3913 0.3070 0.4988Depression -0.5344 0.2717 3.8702 1 0.0492 0.5860 0.3441 0.9980Aspirin at Arrival -0.6412 0.1536 17.4353 1 0.0000 0.5267 0.3898 0.7116
Measure Name 11 SEif
Wald df sig. F.xp(B)95.0°.;, c i r.xpdD Lower tipper
Chula Vista 48.9382 4 0.0000Encinitas -0.0290 0.2276 0.0163 1 0.8984 0.9714 0.6218 1.5174Green -0.2023 0.2245 0.8124 1 0.3674 0.8168 0.5261 1.2682La Jolla -2.5615 0.5275 23.5792 1 0.0000 0.0772 0.0274 0.2170Mercy 0.2351 0.1464 2.5786 1 0.1083 1.2651 0.9495 1.6856Age 0.0399 0.0045 77.3883 1 0.0000 1.0407 1.0315 1.0499Female -0.2616 0.1011 6.6947 1 0.0097 0.7698 0.6314 0.9385Identified Payor 2.5948 1.0032 6.6895 1 0.0097 13.3937 1.8747 95.689PCI Tx -0.6575 0.1359 23.4197 1 0.0000 0.5181 0.3970 0.6762N o Cardiac Tx 0.4475 0.1382 10.4904 1 0.0012 1.5644 1.1933 2.0510Dyslipidemia -0.6225 0.1213 26.3342 1 0.0000 0.5366 0.4231 0.6806Diabetes 0.3941 0.1022 14.8755 1 0.0001 1.4830 1.2139 1.8118Rapid Resp Team -0.8133 0.2741 8.8022 1 0.0030 0.4434 0.2591 0.7588MD AMI Volume 0.1045 0.0338 9.5323 1 0.0020 1.1101 1.0389 1.1862Aspirin at Discharge -0.2995 0.1576 3.6134 1 0.0573 0.7412 0.5442 1.0094
Measure Name 11 SI.i
Wald d f Sig. 1 xptHJ! 95.ono ( i i:.\p (ii) I Lower Lpper
Chula Vista 37.1830 4 0.0000Encinitas -0.2397 0.2339 1.0501 1 0.3055 0.7869 0.4975 1.2445
Reproduced with permission of the copyright owner. Further reproduction prohibited without permission.
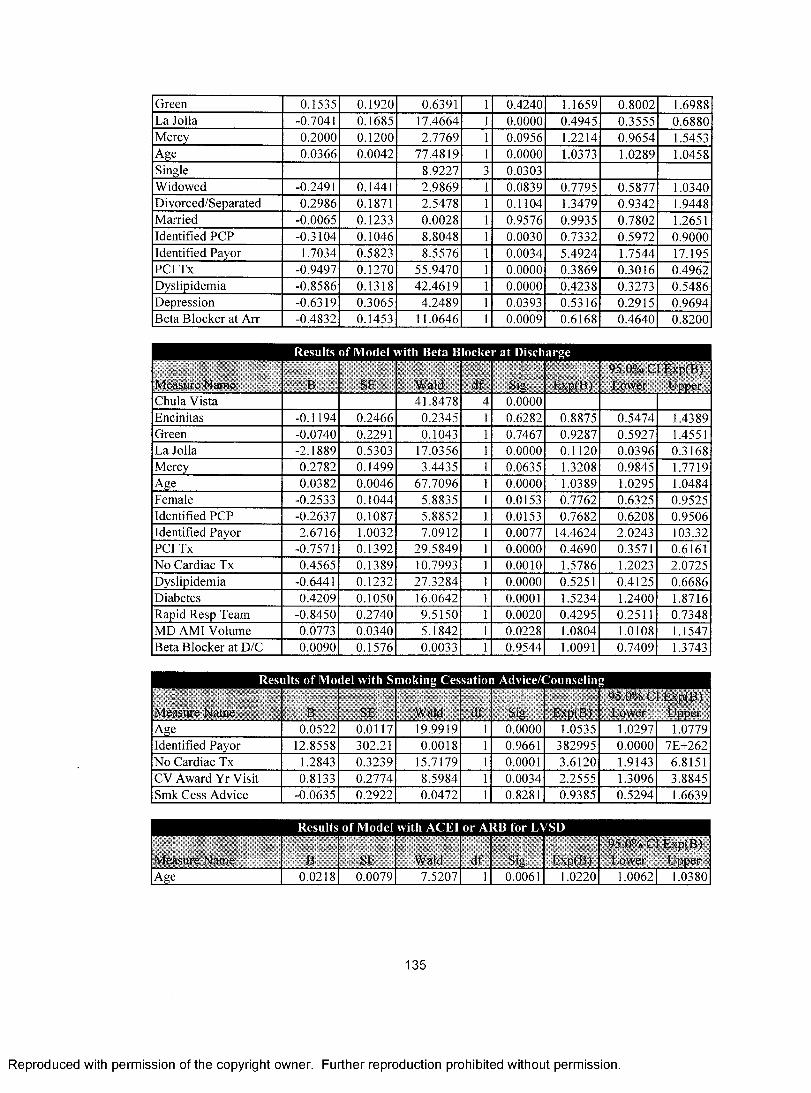
Green 0.1535 0.1920 0.6391 1 0.4240 1.1659 0.8002 1.6988La Jolla -0.7041 0.1685 17.4664 1 0.0000 0.4945 0.3555 0.6880Mercy 0.2000 0.1200 2.7769 1 0.0956 1.2214 0.9654 1.5453Age 0.0366 0.0042 77.4819 1 0.0000 1.0373 1.0289 1.0458Single 8.9227 0.0303Widowed -0.2491 0.1441 2.9869 1 0.0839 0.7795 0.5877 1.0340Divorced/Separated 0.2986 0.1871 2.5478 1 0.1104 1.3479 0.9342 1.9448Married -0.0065 0.1233 0.0028 1 0.9576 0.9935 0.7802 1.2651Identified PCP -0.3104 0.1046 8.8048 1 0.0030 0.7332 0.5972 0.9000Identified Payor 1.7034 0.5823 8.5576 1 0.0034 5.4924 1.7544 17.195PCI Tx -0.9497 0.1270 55.9470 1 0.0000 0.3869 0.3016 0.4962Dyslipidemia -0.8586 0.1318 42.4619 1 0.0000 0.4238 0.3273 0.5486Depression -0.6319 0.3065 4.2489 1 0.0393 0.5316 0.2915 0.9694Beta Blocker at Arr -0.4832 0.1453 11.0646 1 0.0009 0.6168 0.4640 0.8200
Measure Name B SE Wald d f Sig, ExpiB)95.0% Cl Lxp(B) Lower Upper
Chula Vista 41.8478 4 0.0000Encinitas -0.1194 0.2466 0.2345 1 0.6282 0.8875 0.5474 1.4389Green -0.0740 0.2291 0.1043 1 0.7467 0.9287 0.5927 1.4551La Jolla -2.1889 0.5303 17.0356 1 0.0000 0.1120 0.0396 0.3168Mercy 0.2782 0.1499 3.4435 1 0.0635 1.3208 0.9845 1.7719Age 0.0382 0.0046 67.7096 1 0.0000 1.0389 1.0295 1.0484Female -0.2533 0.1044 5.8835 1 0.0153 0.7762 0.6325 0.9525Identified PCP -0.2637 0.1087 5.8852 1 0.0153 0.7682 0.6208 0.9506Identified Payor 2.6716 1.0032 7.0912 1 0.0077 14.4624 2.0243 103.32PCI Tx -0.7571 0.1392 29.5849 1 0.0000 0.4690 0.3571 0.6161N o Cardiac Tx 0.4565 0.1389 10.7993 1 0.0010 1.5786 1.2023 2.0725Dyslipidemia -0.6441 0.1232 27.3284 1 0.0000 0.5251 0.4125 0.6686Diabetes 0.4209 0.1050 16.0642 1 0.0001 1.5234 1.2400 1.8716Rapid Resp Team -0.8450 0.2740 9.5150 1 0.0020 0.4295 0.2511 0.7348MD AMI Volume 0.0773 0.0340 5.1842 1 0.0228 1.0804 1.0108 1.1547Beta Blocker at D/C 0.0090 0.1576 0.0033 1 0.9544 1.0091 0.7409 1.3743
Measure Name B SE Wald d f Sig. Exp(B)95.0% Cl E.xp(B) Lower Upper
Age 0.0522 0.0117 19.9919 1 0.0000 1.0535 1.1)297 1.0779Identified Payor 12.8558 302.21 0.0018 1 0.9661 382995 0.0000 7E+262N o Cardiac Tx 1.2843 0.3239 15.7179 1 0.0001 3.6120 1.9143 6.8151CV Award Yr Visit 0.8133 0.2774 8.5984 1 0.0034 2.2555 1.3096 3.8845Smk Cess Advice -0.0635 0.2922 0.0472 1 0.8281 0.9385 0.5294 1.6639
Measure Name B SE Wald df Sig.
1
: i \p (B )95.0% Cl I xp(B) Lower Upper
Age 0.0218 0.0079 7.5207 □ 0.0061 1.0220 1.0062 1.0380
Reproduced with permission of the copyright owner. Further reproduction prohibited without permission.

Identified Payor 11.6020 158.40 0.0054 1 0.9416 109316 0.0000 7E+139N o Cardiac Tx 0.5439 0.1846 8.6767 1 0.0032 1.7227 1.1996 2.4738Dyslipidemia -0.8687 0.2414 12.9457 1 0.0003 0.4195 0.2613 0.6733ACEI for LVSD -0.4013 0.1934 4.3060 1 0.0380 0.6695 0.4583 0.9780
Measure Name B si-: Wald d f . Sig- l:\p (B )95.01 ii Cl l.\p (B ) Lower Upper
Age 0.0764 0.0185 1 7.02 ' 1 1 0.0000 1 1)794 1.0409 1.1193PCI Tx -2.3551 0.6772 12.0943 1 0.0005 0.0949 0.0252 0.3578MD AMI Volume 0.0969 0.0424 5.2141 1 0.0224 1.1018 1.0138 1.1973Thromb 30 mins 0.8405 0.4584 3.3622 1 0.0667 2.3176 0.9437 5.6915
Measure Name B SE Wald d f Sig. l'\p (B )95.0% Cl l \p(.B) Lower Upper
Age 0.0496 0.0123 16.2400 1 0.0001 1.0508 1.0258 1.0765Identified PCP -0.8192 0.4137 3.9203 1 0.0477 0.4408 0.1959 0.9918Oth Open Heart Surg 1.5377 0.7456 4.2537 1 0.0392 4.6538 1.0794 20.065Oth Cardiac Dx Tx 1.1058 0.3820 8.3787 1 0.0038 3.0218 1.4291 6.3892No Cardiac Tx 2.6608 0.7943 11.2211 1 0.0008 14.3070 3.0160 67.867Dyslipidemia -1.4195 0.4442 10.2107 1 0.0014 0.2418 0.1012 0.5776PCI 120 mins 0.1076 0.2974 0.1308 1 0.7176 1.1136 0.6217 1.9945
Measure Name B SE Wald d f Sig. h \p (B )95.0".,Cl INpfBj Lower Upper
Chula Vista 50.7085 4 0.0000Encinitas 0.1937 0.1837 1.1117 1 0.2917 1.2137 0.8467 1.7397Green -0.9376 0.5222 3.2234 1 0.0726 0.3916 0.1407 1.0898La Jolla 0.2066 0.3410 0.3673 1 0.5445 1.2295 0.6303 2.3986Mercy 0.8249 0.2668 9.5586 1 0.0020 2.2817 1.3525 3.8492Age 0.0387 0.0033 136.3460 1 0.0000 1.0394 1.0327 1.0462Single 9.2243 0.0265Widowed -0.2237 0.1073 4.3471 1 0.0371 0.7995 0.6479 0.9867Divorced/Separated 0.1878 0.1490 1.5895 1 0.2074 1.2066 0.9011 1.6158Married -0.0281 0.0928 0.0916 1 0.7622 0.9723 0.8106 1.1663Identified PCP -0.2923 0.0775 14.2395 1 0.0002 0.7465 0.6414 0.8689Identified Payor 1.1090 0.3585 9.5697 1 0.0020 3.0315 1.5014 6.1209CABG Tx -0.4582 0.1700 7.2617 1 0.0070 0.6324 0.4532 0.8825PCI Tx -0.7810 0.1045 55.8814 1 0.0000 0.4580 0.3732 0.5620No Cardiac Tx 0.2632 0.0981 7.1935 1 0.0073 1.3011 1.0734 1.5770Dyslipidemia -0.9066 0.0997 82.7575 1 0.0000 0.4039 0.3322 0.4910Diabetes 0.1668 0.0790 4.4570 1 0.0348 1.1815 1.0120 1.3793Hypertension -0.2001 0.0727 7.5856 1 0.0059 0.8186 0.7099 0.9439Rapid Resp Team -0.4787 0.1772 7.3004 1 0.0069 0.6196 0.4378 0.8768Payor: Medicare 0.0688 0.0330 4.3516 1 0.0370 1.0712 1.0042 1.1427All Applicable P4P 0.0145 0.0828 0.0306 1 0.8611 1.0146 0.8627 1.1933
136
Reproduced with permission of the copyright owner. Further reproduction prohibited without permission.

Attachment VII: Covariates Included in Stepwise Survival Analysis with Times Serie Model
Measure Name B SE Wald df Siu.i
l.xpl B)95.0% Cl IAp<B) Lower Upper
Jan - June '03Age 0.0505 0.0080 39.8887 1 0.0000 1.0518 1.0355 1.0685Single 8.0661 3 0.0447Widowed -0.1343 0.2647 0.2575 1 0.6119 0.8743 0.5204 1.4689Divorced/Sep. 0.9478 0.3991 5.6408 1 0.0175 2.5800 1.1801 5.6402Married -0.0694 0.2357 0.0865 1 0.7686 0.9330 0.5878 1.4810PCI -0.5725 0.2332 6.0280 1 0.0141 0.5641 0.3572 0.8909Dyslipidemia -0.6977 0.2543 7.5297 1 0.0061 0.4977 0.3024 0.8193FTE/Occ Bed 0.5784 0.2509 5.3135 1 0.0212 1.7832 1.0905 2.9159AMI Vol/ICU Bed -0.0906 0.0313 8.3835 1 0.0038 0.9134 0.8591 0.9712
July - Dec '03Age 0.0318 0.0091 12.3088 1 0.0005 1.0323 1.0141 1.0508PCI -0.8266 0.2769 8.9131 1 0.0028 0.4375 0.2543 0.7528Dyslipidemia -1.0204 0.3156 10.4551 1 0.0012 0.3605 0.1942 0.6691MD AMI Vol -0.0829 0.0256 10.5325 1 0.0012 0.9204 0.8755 0.9677
Jan - June '04Age 0.0328 0.0075 18.9996 1 0.0000 1.0334 1.0182 1.0488Dyslipidemia -0.8441 0.2523 11.1895 1 0.0008 0.4300 0.2622 0.7050MD AMI Vol -0.0510 0.0162 9.9234 1 0.0016 0.9503 0.9206 0.9809Payor 11.7195 163.119 0.0052 1 0.9427 122945.2 0.0000 9E+143CABG 0.8636 0.3362 6.5977 1 0.0102 2.3717 1.2271 4.5840
July - Dec '04Age 0.0384 0.0082 22.0170 1 0.0000 1.0392 1.0226 1.0560PCI -1.1742 0.2564 20.9696 1 0.0000 0.3091 0.1870 0.5109Dyslipidemia -1.1427 0.3027 14.2534 1 0.0002 0.3190 0.1762 0.5773Diabetes 0.5383 0.2302 5.4678 1 0.0194 1.7130 1.0910 2.6897Chest Pain Ctr 0.5835 0.2149 7.3711 1 0.0066 1.7923 1.1762 2.7312
Jan - June '05Age 0.0464 0.0098 22.5312 1 0.0000 1.0474 1.0276 1.0677PCI -0.8223 0.2745 8.9734 1 0.0027 0.4394 0.2566 0.7526Dyslipidemia -1.0248 0.3476 8.6919 1 0.0032 0.3589 0.1816 0.7093CABG -5.4559 1.4727 13.7240 1 0.0002 0.0043 0.0002 0.0766PCP -0.7182 0.3023 5.6443 1 0.0175 0.4876 0.2696 0.8819Oth Open Heart 4.5779 1.0738 18.1760 1 0.0000 97.3080 11.8617 798.273Obesity -12.9575 333.47 0.0015 1 0.9690 0.0000 0.0000 2E+278
| July - D ec '05Dyslipidemia -1.4689 0.4867 9.1098 1 0.0025 0.2302 0.0887 0.5975Oth Open Heart 2.8566 1.0553 7.3274 1 0.0068 17.4014 2.1995 137.671Religious 1.2051 0.5319 5.1337 1 0.0235 3.3372 1.1766 9.4651No Cardiac Tx 1.3818 0.3471 15.8512 1 0.0001 3.9821 2.0169 7.8622
137
Reproduced with permission of the copyright owner. Further reproduction prohibited without permission.

Significant C ovariates in Aspirin at Discharge M odel
Measure Name B SE Wald df Sin. I \p (B )95.0°v. Cl I \p (B ) l.uwcr I 'ppcr
Jan - June '03Age 0.0543 0.0087 39.4572 1 0.0000 1.05581 1.0381 1.0739PCI -0.4380 0.2220 3.8943 1 0.0484 0.6453 0.4177 0.9970Dyslipidemia -0.7086 0.2478 8.1765 1 0.0042 0.4924 0.3029 0.8002Diabetes 0.6023 0.1964 9.4020 1 0.0022 1.8262 1.2427 2.6838Chest Pain Ctr 0.6442 0.2211 8.4853 1 0.0036 1.9044 1.2346 2.9376Hosp AMI Admits -0.0040 0.0008 24.4023 1 0.0000 0.9961 0.9945, 0.9976
Jan - June '04Age 0.0452 0.0086 27.8069 1 0.0000 1.0462 1.0288 1.0639Dyslipidemia -0.5834 0.2363 6.0971 1 0.0135 0.5580 0.3512 0.8866CABG 0.8608 0.3428 6.3055 1 0.0120 2.3650 1.2079 4.6304MD AMI Vol -0.1141 0.0216 27.9946 1 0.0000 0.8921 0.8552 0.9307Mos Since Admit -0.1557 0.0597 6.7995 1 0.0091 0.8559 0.7614 0.9621
July - Dec '04Age 0.0339 0.0089 14.5106 1 0.0001 1.0345 1.0166 1.0527PCI -0.7643 0.2564 8.8848 1 0.0029 0.4656 0.2817 0.7697Dyslipidemia -0.5042 0.2474 4.1526 1 0.0416 0.6040 0.3719 0.9809MD AMI Vol -0.0615 0.0195 9.9108 1 0.0016 0.9403 0.9050 0.9771Single 5.3835 0.1458Widowed -0.4011 0.3147 1.6250 1 0.2024 0.6696 0.3614 1.2406Divorced/Separtd 0.4222 0.3928 1.1555 1 0.2824 1.5254 0.7064 3.2939Married -0.3166 0.2673 1.4034 1 0.2362 0.7286 0.4315 1.2303Oth Cardiac Dx/Tx -0.4196 0.2351 3.1865 1 0.0742 0.6573 0.4146 1.0420
Jan - June '05Age 0.0630 0.0184 11.7497 1 0.0006 1.0650 1.0273 1.1041PCI -1.1700 0.5024 5.4226 1 0.0199 0.3104 0.1159 0.8309Diabetes 0.9204 0.3894 5.5857 1 0.0181 2.5103 1.1701 5.3852N o Cardiac Tx 0.8925 0.4883 3.3406 1 0.0676 2.4413 0.9375 6.3577
July - Dec '05Age 0.0558 0.0204 7.4977 1 0.0062 1.0574 1.0160 1.1005PCI -2.1102 0.5679 13.8082 1 0.0002 0.1212 0.0398 0.3689White 10.6060 4 0.0314African American 0.7562 0.7693 0.9663 1 0.3256 2.1302 0.4716 9.6220Native American 0.9328 0.7608 1.5033 1 0.2202 2.5416 0.5722 11.2904Asian/Pacific Isl 2.9340 1.0701 7.5177 1 0.0061 18.8024 2.3087 153.131Other -0.9704 1.0392 0.8720 1 0.3504 0.3789 0.0494 2.9048
a = Degree o f freedom reduced because o f constant or linearly dependent covariates
Measure Name B SI. Wald d f Sig-1 '. INp(B)
| 95.0% Cl l-\p(U> j Lower 1 Ipper
Jan - June '03 |Age 0.0535 0.0087 38.1785 1 0.0000 1.0550 1.0372 1.0730PCI -0.6887 0.2727 6.3802 1 0.0115 0.5022 0.2943 0.8570Dyslipidemia -0.9782 0.3019 10.4962 1 0.0012 0.3760 0.2081 0.6795
Reproduced with permission of the copyright owner. Further reproduction prohibited without permission.

Hosp AMI Admits -0.0018 0.0005 14.1942 1 0.0002 0.9982 0.9972 0.9991July - Dec. '03
> cro CD 0.0457 0.0106 18.6928 1 0.0000 1.0468 1.0253 1.0687PCI -1.0924 0.2987 13.3734 1 0.0003 0.3354 0.1868 0.6023Dyslipidemia -0.8866 0.3373 6.9094 1 0.0086 0.4120 0.2127 0.7981Single 16.5009 0.0009Widowed -0.8424 0.3901 4.6622 1 0.0308 0.4307 0.2005 0.9252Divorced/Separtd 0.6804 0.4396 2.3959 1 0.1217 1.9748 0.8343 4.6742Married 0.4372 0.3019 2.0973 1 0.1476 1.5483 0.8569 2.7978PCI -0.9102 0.2624 12.0356 1 0.0005 0.4024 0.2406 0.6730Prior M l -1.4522 0.7290 3.9683 1 0.0464 0.2341 0.0561 0.9769MD AMI Admits -0.0748 0.0264 8.0004 1 0.0047 0.9280 0.8811 0.9773
Jan - June '04Age 0.0208 0.0081 6.5930 1 0.0102 1.0210 1.0049 1.0373PCI -0.8080 0.2453 10.8525 1 0.0010 0.4457 0.2756 0.7209Dyslipidemia -0.6462 0.2613 6.1161 1 0.0134 0.5240 0.3140 0.8745Payor 11.8731 178.479 0.0044 1 0.9470 143361.2 0.0000 1E+157CABG 0.8169 0.3558 5.2720 1 0.0217 2.2636 1.1270 4.5463AMI Vol/ICU Bed -0.1674 0.0485 11.9217 1 0.0006 0.8459 0.7692 0.9302
July - Dec. '04Age 0.0339 0.0090 14.2293 1 0.0002 1.0344 1.0164 1.0528PCI -1.2278 0.2952 17.2981 1 0.0000 0.2929 0.1643 0.5225Dyslipidemia -0.6807 0.3052 4.9733 1 0.0257 0.5063 0.2783 0.9209Chest Pain Ctr 0.8264 0.2330 12.5856 1 0.0004 2.2852 1.4475 3.6075
Jan - June '05Age 0.0424 0.0111 14.6253 1 0.0001 1.0434 1.0209 1.0663PCI -0.9294 0.3180 8.5392 1 0.0035 0.3948 0.2117 0.7364Dyslipidemia -0.9419 0.3750 6.3094 1 0.0120 0.3899 0.1870 0.8131CABG -16.4216 257.908 0.0041 1 0.9492 0.0000 0.0000 3E+212Oth Open Heart 4.8938 1.1078 19.5168 1 0.0000 133.4662 15.2210 1170.3
July - Dec. '05Oth Open Heart 3.5584 1.0569 11.3359 1 0.0008 35.1061 4.4235 278.609No Cardiac Tx 1.7844 0.3606 24.4914 1 0.0000 5.9562 2.9380 12.0751
Measure Name
1
B ! SE
| '
Wald d f Sig.
[ ':
' I’.xpfB)95.0% Cl ExplB) Lower Upper
Jan - June '03Age 0.0500 0.0089 31.3390 1 0.0000 1.0513 1.0331 1.0699No Cardiac Tx 0.6518 0.2097 9.6655 1 0.0019 1.9190 1.2724 2.8942Dyslipidemia -1.0429 0.2641 15.5900 1 0.0001 0.3524 0.2100 0.5914Diabetes 0.6407 0.2122 9.1142 1 0.0025 1.8977 1.2520 2.8766CV Award Yr Visit -1.8926 0.4411 18.4049 1 0.0000 0.1507 0.0635 0.3577
Jan - June '04Age 0.0447 0.0088 25.6835 1 0.0000 1.0457 1.0278 1.0640CABG 0.9472 0.3397 7.7766 1 0.0053 2.5785 1.3251 5.0176MD AMI Admits -0.1130 0.0237 22.6504 1 0.0000 0.8931 0.8525 0.9357
July - Dec. '04
Reproduced with permission of the copyright owner. Further reproduction prohibited without permission.

Age 0.0386 0.0089 18.6717 1 0.0000 1.0394 1.0213 1.0577MD AMI Admits -0.0758 0.0206 13.4932 1 0.0002 0.9270 0.8902 0.9652PCI -0.8372 0.2454 11.6383 1 0.0006 0.4329 0.2676 0.7003
Jan - June '05Age 0.0541 0.0163 11.0878 1 0.0009 1.0556 1.0225 1.0898No Cardiac Tx 0.8051 0.4509 3.1874 1 0.0742 2.2368 0.9243 5.4134PCI -1.0489 0.4544 5.3291 1 0.0210 0.3503 0.1438 0.8535
July - Dec. '05No Cardiac Tx 2.2814 0.4526 25.4048 1 0.0000 9.7900 4.0319 23.7716
Measure Name B Sh Wald df Siu. L.\p( B)95.0% Cl INplU) Lower Upper
Jan - June '03Age 0.0766 0.0260 8.6970 1 0.0032 1.0797 1.0260 1.13611
| July - Dec. '03 |Depression 2.4378 0.9145 7.1058 1 0.0077 11.4474 1.9067 1 68.72841
Jan - June ’04CABG 1.9190 0.8415 5.1999 1 0.0226 6.8140 1.3094 35.4586Oth Cardiac Dx/Tx -1.3918 0.5511 6.3796 1 0.0115 0.2486 0.0844 0.7321AMI Vol/ICU Bed -0.5172 0.1267 16.6729 1 0.0000 0.5962 0.4651 0.7642
July - Dec. '04Age 0.1327 0.0320 17.1989 1 0.0000 1.1420 1.0725 1.2159Chula Vista 12.3933 4 0.0147Encinitas -3.5539 1.1751 9.1473 1 0.0025 0.0286 0.0029 0.2863Green -2.8503 1.1405 6.2453 1 0.0125 0.0578 0.0062 0.5407La Jolla -3.3590 1.1058 9.2275 1 0.0024 0.0348 0.0040 0.3037Mercy -4.2626 1.2503 11.6238 1 0.0007 0.0141 0.0012 0.1633Oth Open Heart 3.6262 1.4727 6.0628 1 0.0138 37.5707 2.0954 673.634Hypertension 1.4512 0.6620 4.8062 1 0.0284 4.2683 1.1663 15.6215Mos Since Admit 0.7132 0.2077 11.7891 1 0.0006 2.0405 1.3581 3.0657
Measure Name B SE Wald d f ...Sig- .. E\p( B)95.0% Cl l .xp(B) Lower Upper
Jul\ - Dec '03Dyslipidemia -1.2148 0.5393 5.0738 □ 0.0243 0.2968 0.1031 0.8540
Jan - June '04Oth Cardiac Dx/Tx -1.4614 0.4071 12.8884 1 0.0003 0.2319 0.1044 0.5150Paid FTE/Occ Bed 0.9935 0.4541 4.7869 1 0.0287 2.7008 1.1091 6.5769
July - Dec '04Dyslipidemia -1.6722 0.7450 5.0376 1 0.0248 0.1878 0.0436 0.8090Oth Cardiac Dx/Tx -1.0289 0.4378 5.5221 1 0.0188 0.3574 0.1515 0.8430
Jan - June '05Age 0.0808 0.0342 5.5895 1 0.0181 1.0842 1.0139 1.1594No Cardiac Tx 1.2595 0.6344 3.9419 1 0.0471 3.5236 1.0163 12.2166
a = Constant or Linearly Dependent Covariates F a c ility C o d e(l) = 0 ; O th erO p en H eartS u rgery =
Reproduced with permission of the copyright owner. Further reproduction prohibited without permission.

0 ; CAD - 1 ; Family Hx CAD = 0 ; Rapid_Response_Team = 0
Measure Name B SE ! Wald , df Sig. L \p(B )| 95.0% Cl l:\p (B )
Lower UpperJan - June '03
Age 0.0836 0.0490 2.9096 □ 0.0881 1.0872 0.9876 1.1969Jan - June '04
Age 0.1020 0.0407 6.2954 □ 0.0121 1.1074 1.0226 1.1993July - Dec '04
Age 0.3957 0.2354 2.8250 1 0.0928 1.4855 0.9364 2.3565Diabetes 9.9209 8.4119 1.3909 1 0.2382 20350.57 0.0014 2.9E+11
a = Constant or Linearly Dependent Covariates Facility Code( 1) = 0 ; Facility Code(2) = 0 ; R ace(l) = 0 ; Race(4) = 0 ; Other Open Heart Surgery = 0 ; No Cardiac Tx = 0 ; CAD = 1 ; Prior MI = 0 ; Rapid Response Team = 0b = Constant or Linearly Dependent Covariates Facility_Code(2) = 0 ; Race(4) = 0 ; CABG = 0 ; Other Open Heart Surgery = 0 ; N o Cardiac Tx = 0 ; CAD = 1 ; Family Hx CAD = 0
Measure Name mm SE , Wald , df Sig. . L \p(B )95.0°,, Cl L \p(B) Lower Upper
Jan - June '05Age 0.0758 0.0315 5.8122 1 0.0159 1.0788 1.0143 1.1474
Measure Namei
Bi
SE Wald d f Sin. INpiB)■ 95.0'.’,. Cl EAplB) | lam er Upper
Jan - June '03Age 0.0371 0.0066 31.9357 1 0.0000 1.0378 1.0245 1.0512Payor 11.5906 138.818 0.0070 1 0.9335 108080.5 0.0000 2E+123CABG -0.9255 0.3740 6.1230 1 0.0133 0.3963 0.1904 0.8250PCI -0.7964 0.1882 17.9007 1 0.0000 0.4509 0.3118 0.6521Dyslipidemia -0.8964 0.2114 17.9846 1 0.0000 0.4080 0.2696 0.6175Diabetes 0.3441 0.1597 4.6426 1 0.0312 1.4107 1.0316 1.9292FTE/Occ Bed 0.4571 0.2264 4.0755 1 0.0435 1.5795 1.0134 2.4617CV Award -0.6223 0.2620 5.6400 1 0.0176 0.5367 0.3211 0.8970
July - Dec '03Age 0.0337 0.0079 18.2644 1 0.0000 1.0343 1.0184 1.0504Payor 11.5852 161.289 0.0052 1 0.9427 107492.8 0.0000 2E+142PCI -1.0454 0.2176 23.0773 1 0.0000 0.3515 0.2295 0.5385Dyslipidemia -0.9363 0.2664 12.3549 1 0.0004 0.3921 0.2326 0.6608CV Award -1.0210 0.3075 11.0276 1 0.0009 0.3602 0.1972 0.6581PCP -0.6360 0.1926 10.9050 1 0.0010 0.5294 0.3629 0.7722
Jan - June '04Age 0.0365 0.0063 33.6451 1 0.0000 1.0372 1.0245 1.0501Payor 11.8038 164.896 0.0051 1 0.9429 133758.6 0.0000 3E+145PCI -0.4487 0.1822 6.0677 1 0.0138 0.6384 0.4468 0.9124Dyslipidemia -0.8713 0.2045 18.1546 1 0.0000 0.4184 0.2803 0.6247
141
Reproduced with permission of the copyright owner. Further reproduction prohibited without permission.

MD AMI Vol -0.0456 0.0139 10.7542 1 0.0010 0.9554 0.9297 0.9818July - Dec '04
Age 0.0407 0.0068 36.0978 1 0.0000 1.0415 1.0278 1.0554PCI -1.0476 0.1977 28.0693 1 0.0000 0.3508 0.2381 0.5168Dyslipidemia -0.8596 0.2068 17.2810 1 0.0000 0.4233 0.2823 0.6349Diabetes 0.4099 0.1790 5.2455 1 0.0220 1.5066 1.0609 2.1395PCP -0.4957 0.1829 7.3493 1 0.0067 0.6091 0.4256 0.8717MD AMI Vol -0.0556 0.0154 13.0036 1 0.0003 0.9459 0.9177 0.9749Religious -0.3793 0.1731 4.7988 1 0.0285 0.6843 0.4874 0.9609
Jan - June '05Age 0.0499 0.0083 35.9481 1 0.0000 1.0512 1.0342 1.0685CABG -5.4805 1.2485 19.2685 1 0.0000 0.0042 0.0004 0.0481PCI -1.0113 0.2357 18.4052 1 0.0000 0.3637 0.2292 0.5774Dyslipidemia -1.1324 0.3074 13.5697 1 0.0002 0.3223 0.1764 0.5887PCP -0.6556 0.2704 5.8791 1 0.0153 0.5191 0.3056 0.8819Oth Open Hrt 4.7810 1.0373 21.2448 1 0.0000 119.2242 15.6112 910.53Hypertension -0.6189 0.2145 8.3263 1 0.0039 0.5385 0.3537 0.8199
July - Dec '05Age 0.0417 0.0109 14.6131 1 0.0001 1.0426 1.0205 1.0652PCI -1.2652 0.2949 18.4114 1 0.0000 0.2822 0.1583 0.5030Dyslipidemia -1.6908 0.3876 19.0319 1 0.0000 0.1844 0.0863 0.3941Thrombosis 1.7602 0.5663 9.6626 1 0.0019 5.8139 1.9162 17.6393
Reproduced with permission of the copyright owner. Further reproduction prohibited without permission.
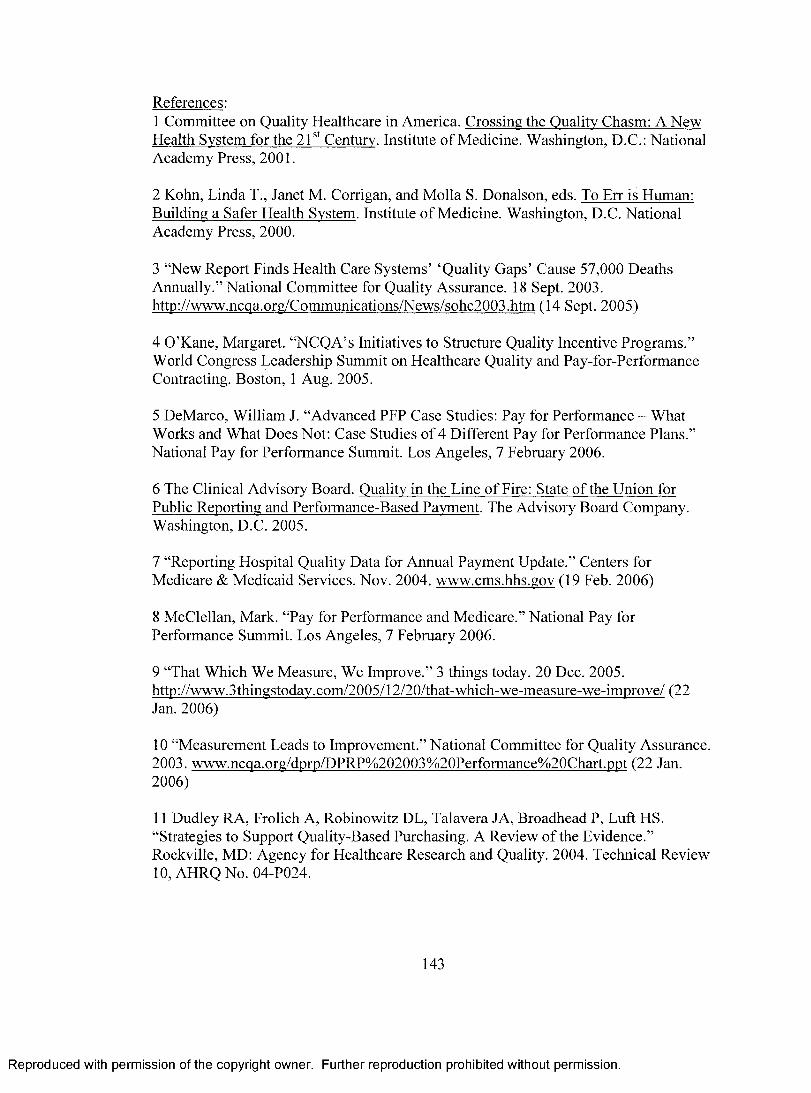
References:1 Committee on Quality Healthcare in America. Crossing the Quality Chasm: A New Health System for the 21st Century. Institute o f Medicine. Washington, D.C.: National Academy Press, 2001.
2 Kohn, Linda T., Janet M. Corrigan, and Molla S. Donalson, eds. To Err is Human: Building a Safer Health System. Institute o f Medicine. Washington, D.C. National Academy Press, 2000.
3 “New Report Finds Health Care Systems’ ‘Quality Gaps’ Cause 57,000 Deaths Annually.” National Committee for Quality Assurance. 18 Sept. 2003. httn://www.ncqa.org/Communications/News/sohc2003.htm (14 Sept. 2005)
4 O’Kane, Margaret. “NCQA’s Initiatives to Structure Quality Incentive Programs.” World Congress Leadership Summit on Healthcare Quality and Pay-for-Performance Contracting. Boston, 1 Aug. 2005.
5 DeMarco, William J. “Advanced PFP Case Studies: Pay for Performance - What Works and What Does Not: Case Studies o f 4 Different Pay for Performance Plans.” National Pay for Performance Summit. Los Angeles, 7 February 2006.
6 The Clinical Advisory Board. Quality in the Line o f Fire: State of the Union for Public Reporting and Performance-Based Payment. The Advisory Board Company. Washington, D.C. 2005.
7 “Reporting Hospital Quality Data for Annual Payment Update.” Centers for Medicare & Medicaid Services. Nov. 2004. www.cms.hhs.gov (19 Feb. 2006)
8 McClellan, Mark. “Pay for Performance and Medicare.” National Pay for Performance Summit. Los Angeles, 7 February 2006.
9 “That Which We Measure, We Improve.” 3 things today. 20 Dec. 2005. http://www.3thingstodav.com/2005/12/20/that-which-we-measure-we-improve/ (22 Jan. 2006)
10 “Measurement Leads to Improvement.” National Committee for Quality Assurance. 2003. www.ncqa.org/dprp/DPRP%202003%20Performance%20Chart.ppt (22 Jan. 2006)
11 Dudley RA, Frolich A, Robinowitz DL, Talavera JA, Broadhead P, Luft HS. “Strategies to Support Quality-Based Purchasing. A Review o f the Evidence.” Rockville, MD: Agency for Healthcare Research and Quality. 2004. Technical Review 10, AHRQ No. 04-P024.
143
Reproduced with permission of the copyright owner. Further reproduction prohibited without permission.

12 Shortell, Stephen M. “Pay for Performance: An Overview o f the California Experiment.” National Pay for Performance Summit. Los Angeles, 6 February 2006.
13 “Medicare Demonstration Shows Hospital Quality o f Care Improves with Payments Tied to Quality.” Centers for Medicare & Medicaid Services. 14 Nov. 2005. http://www.cms.hhs.gov/apps/media/press/release.asp7CounterM729 (5 Feb. 2006)
14 O’Leary, Dennis S. “Setting National Pay for Performance Standards.” National Pay for Performance Summit. Los Angeles, 8 February 2006.
15 “Zero sum.” Wikipedia The Free Encyclopedia. 19 May 2007. http://en.wikipedia.org/wiki/zero-sum (21 May 2007)
16 Blendon RJ, Schoen C, DesRoches CM, Osborn R, Zapert K, Raleigh E. “Confronting Competing Demands to Improve Quality: A Five-Country Hospital Survey.” Health Affairs. 2004; 23(3): 119-135.
17 Haley RW, Culver DH, Morgan WM, Emori TG, Munn VP, Hooton TP. “The Efficacy of Infection Surveillance and Control Programs in Preventing Nosocomial Infections in U.S. Hospitals.” American Journal o f Epidemiology. 1985; 121:182-205.
18 Langreth, Robert. “Fixing Hospitals.” Forbes.com. 20 June, 2005. http://www.forbes.com/business/global/2005/0620/054.html (5 Feb. 2006)
19 “The State o f Health Care Quality: 2003.” National Committee for Quality Assurance. 18 Sept 2003 http://www.ncqa.org/Communications/News/sohc2003.htm (5 Feb. 2006)
20 McGlynn EA, Asch SM, Adams J, Keesey J, Hicks J, DeCristofaro A, Kerr EA. “The Quality o f Health Care Delivered to Adults in the United States.” New England Journal o f Medicine. 2003; 348(26):265-45.
21 Woolf SH. “The Need for Perspective in Evidence-Based Medicine.” JAMA 1999; 282(24):2358-65.
22 Waksman, Ron. “Antagonists’s View: Will Cost Constraints Affect the Widespread Use of DES?” American College o f Cardiology. 26 Aug. 2004 http://www.cardiosource.com/expertopinions/hottopics/article.asp7paperEm74 (21 Jan. 2006)
23 “Complete Summary.” National Quality Measures Clearinghouse. Agency for Healthcare Research and Quality. 2005.
144
Reproduced with permission of the copyright owner. Further reproduction prohibited without permission.

http://www.qualitymeasures.ahrq.gov/summary/summary.aspx?ss= 1 &doc id=::6054 (19 Feb. 2006)
24 “Hospital Quality Alliance.” Centers of Medicare & Medicaid Services. Feb. 2006. http://www.cms.hhs.gov/HospitalQualitvInits/15 HospitaIQualityAlliance.asp#TopOf Page (19 Feb. 2006)
25 Loeb, Jerod M. “Dissecting the Data...Implications for Nursing.” Joint Commission on Accreditation o f Healthcare Organizations. Letter to the Author. 4 Jan. 2006
26 Tu, JV, Cameron C. “Impact o f an Acute Myocardial Infarction Report Card in Ontario, Canada.” International Journal fo r Quality in Health Care. Apr. 2003;15(2): 131-7.
27 Griffith JR, Knutzen SR, Alexander JA. “Structural versus Outcomes Measures in Hospitals: A Comparison o f Joint Commission and Medicare Outcomes Scores in Hospitals.” Quality Management in Health Care. Winter 2002; 10(2):29-38.
28 Williams SC, Schmaltz SP, Morton DJ, Koss RG, Loeb JM. “Quality of Care in U.S. Hospitals as Reflected by Standardized Measures, 2002-2004.” New England Journal o f Medicine. 2005; 353(3):255-64.
29 “Browse-Disease/Condition Results.” National Quality Measures Clearinghouse.The Agency for Healthcare Research and Quality. 30 Jan. 2006. http://www.qualitymeasures.ahrq ■gov/browse/browsemode.aspx?node=4289&type=l& view=all (5 Feb. 2006)
30 Weisman SM, Graham DY, “Evaluation o f the Benefits and Risks of Low-Dose Aspirin in the Secondary Prevention of Cardiovascular and Cerebrovascular Events.” Archives o f Internal Medicine. 2002; 162:2197-2202.
31 Antithrombotic Trialists’ Collaboration. “Collaborative Meta-Analysis of Randomized Trails of Antiplatelet Therapy for Prevention of Death, Myocardial Infarction, and Stroke in High Risk Patients.” British Medical Journal. 2002; 324:71- 86 .
32 Antithrombotic Trialists’ Collaboration. “Collaborative Overview o f Randomized Trials of Antiplatelet Therapy -I: Prevention of Death, Myocardial Infarction, and Stroke by Prolonged Antiplatelet Therapy in Various Categories o f Patients.” British Medical Journal. 1994; 308:81-106.
145
Reproduced with permission of the copyright owner. Further reproduction prohibited without permission.

33 Lau J, Antman EM, Jimenez-Silva J, Kupelnick B, Mosteller F, Chalmers TC. “Cumulative Meta-Analysis of Therapeutic Trials for Myocardial Infarction.” New England Journal o f Medicine. 1992; 327:248-254.
34 Menon V, Flarrington RA, Hochman JS, Cannon CP, Goodman SD, Wilcox RG, et al. “Thrombolysis and Adjunctive Therapy in Acute Myocardial Infarction: The Seventh ACCP Conference on Antithrombotic and Thrombolytic Therapy.” Chest. 2004; 126:549S-575S.
35 Antman EM, Anbe DT, Armstrong PW, Bates ER, Green LA, Eland M, et al.“ACC/APIA Guidelines for the Management o f Patients with ST-Elevation Myocardial Infarction - Executive Summary: A Report of the American College o f Cardiology/ American Heart Association Task Force on Practice Guidelines.” Circulation. 2004; 110:588-636.
36 Patrono C, Bachmann F, Baigent C, Bode C, De Caterina R, Charbonnier B, et al. “Expert Consensus Document on the Use of Antiplatelet Agents. The Task Force on the Use of Antiplatelet Agents in Patients with Atherosclerotic Cardiovascular Disease of the European Society o f Cardiology.” European Heart Journal. 2004; 25:166-181.
37 Hougton T, Freemantle N, Cleland JG. “Are Beta-Blockers Effective in Patients who Develop Heart Failure Soon After Myocardial Infarction? A Meta-Regression Analysis o f Randomized Trails.” European Journal o f Heart Failure. 2000; 2:333-340.
38 Olsson G, Wikstrand J, Wamold I. Manger Cats V, McBoyle D, Herlitz J, et al. “Metoprolol-Induced Reduction in Postinfarction Mortality: Pooled Results from Five Double-Blind Randomized Trials.” European Heart Journal. 1992; 13:28-32.
39 Antman EM, Lau J, Kupelnick B, Mosteller F, Chalmers TC. “A Comparison of Results o f Meta-Analyses o f Randomized Control Trials and Recommendations of Clinical Experts. Treatments for Myocardial Infarction.” Journal o f American Medical Association. 1992; 268:240-248.
40 Freemantle N, Cleland J, Young P, Mason J, Harrison J. “Beta Blockade After Myocardial Infarction: Systematic Review and Meta Regression Analysis.” British Medical Journal 1999; 318:1730-1737.
41 Van de Werf F, Ardissino D, Betriu A, Cokkinos DV, Falk E, Fox KA, et al. “Management of Acute Myocardial Infarction in Patients Presenting with ST-Segment Elevation.” The Task Force on the Management of Acute Myocardial Infarction o f the European Society of Cardiology. European Heart Journal. 2003; 24:28-66.
146
Reproduced with permission of the copyright owner. Further reproduction prohibited without permission.
42 Latini R, Tognoni G, Maggioni AP, Baigent C, Braunwald E, Chen ZM, et al. “Clinical Effects o f Early Angiotensin-Converting Enzyme Inhibitor Treatment for Acute Myocardial Infarction are Similar in the Presence and Absence of Aspirin: Systematic Overview of Individual Data from 96,712 Randomized Patients.” Angiotensin-Converting Enzyme Inhibitor Myocardial Infarction Collaborative Group. Journal o f the American College o f Cardiology. 2000; 35:1801-1807.
43 ACE Inhibitor Myocardial Infarction Collaborative Group. “Indications for ACE Inhibitors in the Early Treatment o f Acute Myocardial Infarction: Systematic Overview o f Individual Data from 100,000 Patients in Randomized Trials.” Circulation. 1998; 97:2202-2212.
44 Domanski MJ, Exner DV, Borkowf CB, Geller NL, Rosenberg Y, Pfeffer MA, “Effect o f Angiotensin Converting Enzyme Inhibition on Sudden Cardiac Death in Patients Following Acute Myocardial Infarction. A Meta-Analysis o f Randomized Clinical Trials.” Journal o f the American College o f Cardiology. 1999; 33:598-604.
45 Lee VC, Rhew DC, Dylan M, Badamgarav E, Braunstein GD, Weingarten SR. “Meta-Analysis: Angiotensin-Receptor Blockers in Chronic Heart Failure and High- Risk Acute Myocardial Infarction.” Annals o f Internal Medicine. 2004; 141:693-704.
46 Lopez-Sendon J, Swedberg K, McMurray J, Tamargo J, Maggioni AP, Dargie H, et al. “Expert Consensus Document on Angiotensin Converting Enzyme Inhibitors in Cardiovascular Disease.” The Task Force on ACE-Inhibitors of the European Society o f Cardiology.” European Heart Journal. 2004; 25:1454-1470.
47 Wilson K, Gibson N, Willan A, Cook D. “Effect of Smoking Cessation on Mortality After Myocardial Infarction: Meta-Analysis o f Cohort Studies.” Archives o f Internal Medicine. 2000; 160:939-944.
48 Critchley JA, Capewell S. “Mortality Risk Reduction Associated with Smoking Cessation in Patients with Coronary Heart Disease: A Systematic Review.” JAMA. 2003; 290:86-97.
49 Houston TK, Allison JJ, Person S, Kovac S, Williams OD, Kiefe CL “Post- Myocardial Infarction Smoking Cessation Counseling: Associations with Immediate and Late Mortality in Older Medicare Patients.” American Journal o f Medicine. 2005; 118:269-275.
50 Rea TD, Heckbert SR, Kaplan RC, Smith NL, Lemaitre RN, Psaty BM. “Smoking Status and Risk for Recurrent Coronary Events After Myocardial Infarction.” Annals o f Internal Medicine. 2002; 137:494-500.
147
Reproduced with permission of the copyright owner. Further reproduction prohibited without permission.

51 Hartwell D, Colquitt J, Loveman E, Clegg AJ, Brodin H, Waugh N, et al. “Clinical Effectiveness and Cost-Effectiveness of Immediate Angioplasty for Acute Myocardial Infarction: Systematic Review and Economic Evaluation.” Health Technology Assessment. 2005; 9:1-114.
52 Cucherat M, Bonnefoy E, Tremeau G. “Primary Angioplasty Versus Intravenous Thrombosis for Acute Myocardial Infarction.” Cochrane Database System Review. 2003; CD001560.
53 Keeley EC, Boura JA, Grines CL. “Primary Angioplasty Versus Intravenous Thrombolytic Therapy for Acute Myocardial Infarction: A Quantitative Review of 23 Randomized Trials.” Lancet. 2003; 361:13-20.
54 Zeymer U, Vogt A, Zahn R, Weber MA, Tebbe U, Gottwi, M, et al. “Predictors of In-Hospital Mortality in 1333 Patients with Acute Myocardial Infarction Complicated by Cardiogenic Shock Treated with Primary Percutaneous Coronary Intervention (PCI); Results o f Primary PCI Registry of the Arbeitsgemeinschaft Leitende Kardiologische Krankenhausarzte (ALKK).” European Heart Journal. 2004; 25:322- 328.
55 Cannon CP, Gibson CM, Labrew CT, Shoultz DA, Levy D, French WJ, et al. “Relationship of System-Onset-to-Balloon Time and Door-to-Balloon Time with Mortality in Patients Undergoing Angioplasty for Acute Myocardial Infarction.” JAMA 2000; 283:2941-2947.
56 Fibrinolytic Therapy Trialists’ (FTT) Collaborative Group. “Indications for Fibrinolytic Therapy in Suspected Acute Myocardial Infarction: Collaborative Overview o f Early Mortality and Major Morbidity Results for All Randomized Trials o f More than 1000 Patients.” Lancet 1994; 343(8893):311-322.
57 Rosenthal MB, Frank RG, Li Z, Epstein AM. “Early Experience with Pay-for- Performance: From Concept to Practice.” JAMA. 2005; 294(14): 1788-93.
58 Petersen LA, Woodard LD, Urech T, Daw C, Sookanan S. “Does Pay-for- Performance Improve the Quality of Health Care.” Annals o f Internal Medicine. 2006; 145:265-72.
59 “Pay-for-Performance Programs Show Quality Improvements.” Capitation Management Report. July 2005; 12(7):82-4, 73.
60 Beaulieu ND, Horrigan DR. “Putting Smart Money to Work for Quality Improvement.” Health Services Research. Oct 2005; 40(5 Pt 1): 1318-34.
148
Reproduced with permission of the copyright owner. Further reproduction prohibited without permission.

61 “Continued Quality Improvement in California Health Care Announced by Integrated Healthcare Association.” Medical News Today. 17 July, 2006. http://www.medicalnewstoday.com/medicalnews.php?newsid=47234 (16 Apr. 2007)
62 Liu X, Mills A. “The Effect o f Performance-Related Pay of Hospital Doctors on Hospital Behaviours: A Case Study from Shandong, China.” Human Resources o f Health. Oct 2005; 3:11.
63 Sipkoff, Martin. “Is Pay for Performance Part of the Cure or the Problem?” Managed Care. July 2005; 14(7):48-9,51,55-6.
64 Rosenthal, Meredith B and Richard G Frank. “What is the Empirical Basis for Paying for Quality in Health Care?” Medical Care Research & Review. 2006; 63(2):135-57.
65 Fonarow GC, Abraham WT, Albert NM, Stough WG, Gheorghiade M, Greenberg BH, O ’Connor CM, Pieper K, Sun JL, Yancy JB. “Association Between Performance Measures and Clinical Outcomes for Patients Hospitalized with Heart Failure.” JAMA. 2007; 297(l):61-70.
6 6 Lindenauer PK, Remus D, Roman S, Rothberg MB, Benjamin EM, Ma A, Bratzler DW. “Public Reporting and Pay for Performance in Hospital Quality Improvement.” New England Journal o f Medicine. 2007; 356:486-96.
67 “Social Security Death Index.” Ancestry.com. 2006. http://www.ancestry.com/search/db.aspx2dbidA3693 (29 Jan. 2006)
6 8 Mack M, Herbert MA, Prince S. “Comparing ‘Hospital Report Cards’. Difficult? No, Impossible!” Medical City. Cardiopulmonary Research Science and Technology Institute (CRSTI). www.crsti.org/posters/STSDataMgrReptCards.pdf (17 Feb. 2006)
69 “Life Expectancy at Birth by Race and Sex, 1930 - 2002.” National Center for Health Statistics. Sept. 2003. www.cdc.gov/nchs. (18 Feb. 2006)
70 “The Gender Gap in U.S. Mortality.” Population Reference Bureau. 2006. http://www.prb.org/Template.cfm?Section=PRB&template=/ContentManagement/Con tentDisplay.cfm&ContentID=l 831 (18 Feb. 2006)
71 Proser, Michelle. “Medical Homes: The Unsung Solution for Quality Health Care.” American Family Physicians. 2005; 71 (9): 1664-5.
72 van Poppel F, Joung I. “Long-Term Trends in Martial Status Mortality Differences in the Netherlands 1850-1970.” Journal o f Biosocial Science. 2001; 33(2):279-303.
149
Reproduced with permission of the copyright owner. Further reproduction prohibited without permission.

73 “Acute Myocardial Infarction.” Heart Healthy Women. July 2005. http://www.hearthealthywomen.org/professionals/coronary artery disease/acute myoc ardial infarction.html (19 Feb. 2006)
74 “Risk Factors and Coronary Heart Disease.” American Heart Association. Feb.2006. http://www.americanheart.org/presenter.ihtml7identifieF4726 (19 Feb. 2006)
75 Logan, Paul and Sean Clarke. “Nutritional and Medical Therapy for Dyslipidemia in Patients with Cardiovascular Disease.” American Association of Critical-Care Nurses. Feb. 2001http://www.aacn.org/AACN/irnIci.nsf/bd5ca01ff707c8948825653fO00cd2b6/6db3a6eb a73b891588256a480071b6d7?QpenDocument (19 Feb. 2006)
76 Londahl M, Katzman P, Nilsson A, Ljungdahl L, Prutz KG. “Cardiovascular Prevention Before Admission Reduces Mortality Following Acute Myocardial Infarction in Patients with Diabetes.” Journal o f Internal Medicine. 2002; 251:325-330.
77 Larson C, Gullberg B, Merlo J, Rastam L, Lindblad U. “Female Advantage in AMI Mortality is Reversed in Patients with Type 2 Diabetes in the Skaraborg Project.” Diabetes Care. 2005; 28:2246-2248.
78 Bush DE, Ziegelstein RC, Tayback M, Richter D, Steven S, Zahalsky H, Fauerback JA. “Even Minimal Symptoms of Depression Increase Mortality Risk After Acute Myocardial Infarction.” American Journal o f Cardiology. 2002; 89(1):112-3.
79 “Heart Attack - 9 Risk Factors.” Irishhealth.com. Aug. 2004. http://www.irishhealth.com/index.html?level=4&id=6236 (19 Feb. 2006)
80 Campbell, Donald T. and Julian C. Stanley. Experimental and Quasi-Experimental Designs for Research. Boston: Houghton Mifflin Company, 1963.
81 Kleinbaum, David G., and Mitchel Klein. Logistic Regression. 2nd ed. New York: Springer-Verlag, 2002.
82 Farmer, Melissa. “Survival Analysis.” Health Services 237B: Special Topics in Health Services Research Methodology. University of California Los Angeles. Los Angeles, 2 March 2002.
83 “Survival/Failure Time Analysis.” StatSoft, Inc. 2003. http://www.statsoft.com/textbook/stsurvan.htmI (26 Feb. 2006)
150
Reproduced with permission of the copyright owner. Further reproduction prohibited without permission.

84 Bewick V, Cheek L, Ball J. “Statistics Review 12: Survival Analysis.” Critical Care 2004; 8:389-94.
85 Ettner, Susan. “Survival Analysis III.” Health Services 237C: Introduction to Health Services Research Methods. University o f California Los Angeles. Los Angeles, 4 June2007.
86 Hibbard, Judith H., Jean Stockard, and Martin Tusler. “Hospital Performance Reports: Impact on Quality, Market Share, and Reputation.” Health Affairs. 2005; 24(4): 1150-1160.
87 “Rewarding Superior Quality Care: The Premier Hospital Quality Incentive Demonstration.” Centers for Medicare & Medicaid Services. Mar. 2005. http://www.cms.hhs.gov/HospitalQualitvInits/35 HospitalPremier.asp#TopOfPage (21 Jan. 2006)
88 “Hospital Quality Initiative Overview.” Centers for Medicare & Medicaid Services. Dec. 2005 http ://www.cms.hhs. gov/HospitalQualitylnits/ (22 Jan. 2006)
151
Reproduced with permission of the copyright owner. Further reproduction prohibited without permission.


](https://img.pdfslide.us/doc/110x75/5556ced7d8b42abb428b5615/acute-myocardial-infarction-final2.jpg)


