Embed Size (px)
Citation preview
Pay Distribution in the Top Executive Team Lucian Bebchuk,∗ Martijn Cremers,** and Urs Peyer***
This draft: April 2007
Abstract
We investigate the distribution of pay in the top executive team in public companies. In
particular, we focus on the relationship between the CEO’s pay slice (CPS) – the fraction of top-five compensation that is captured by the CEO – and various potential explanatory variables. Consistent with the hypothesis that CPS is higher when the CEO is more central in the top team in terms of ability, contribution, or power, we find that CPS is high when the CEO has long tenure and/or chairs the board, and when other executives have fewer on the board and a smaller ownership stake. We also find that CPS is high when insiders are protected by high entrenchment level and when the total top-five compensation is small relative to peer companies. Finally, controlling for changes in firm and CEO characteristics, we find that CEOs have been increasing their CPS, as well as the fraction of both equity-based compensation and non-equity compensation, during the past decade.
Keywords: Executive compensation, corporate governance, CEOs, options, equity-based compensation, non-equity compensation, Tobin's Q, entrenchment, independent directors, board size, CEO tenure, acquisitions, variability of returns, pay distribution, and internal pay equity. JEL Classification: D23, G32, G38, J33, J44, K22, M14.
∗ Harvard Law School and NBER ** Yale School of Management *** INSEAD We are grateful to Alma Cohen, Will Goetzmann, Yaniv Grinstein, Ehud Kamar, Steve Kaplan, and participants in a Harvard workshop and the NYU-Penn conference for their helpful comments. For financial support, we would like to thank the Guggenheim Foundation, the John M. Olin Center for Law, Economics, and Business, and the Harvard Law School Program on Corporate Governance.
1
I. INTRODUCTION
Although the compensation of executives has been the subject of much research in
economics and finance, the distribution of pay in the top executive team has received relatively
little attention from financial economists. We seek to help fill this void by investigating in this
paper the distribution of pay among executives in the top management team of public companies.
In particular, we study the CEO's pay slice (CPS), which we define as the percentage of
aggregate top-five total compensation captured by the CEO. We seek to explore the potential
determinants of CPS by studying how it relates to various characteristics of the firm, the CEO,
and the circumstances.
Understanding CPS is necessary for obtaining a complete picture of pay arrangements at
the top. While much attention has been given to the level of CEO pay, changes in CEO pay
levels can result from each of two different sources – a change in the total compensation pie
given to the top executive team (even without a change in the CEO's slice), and a change in the
CEO's slice (even without a change in the top team's compensation total).
We investigate how the relation between CPS and firm and CEO characteristics. We find
that CPS is higher when the CEO chairs the board, when the CEO has longer tenure, and when
other members of the top executive team have fewer board seats or lower ownership stake. These
findings are consistent with the hypothesis that CPS is higher when the CEO is more central
within the top of executive team in terms of ability, contribution, or power.
We also obtain two findings that do not follow from this hypothesis, and we dicuss
possible explanations for them. One finding is that CPS is higher when shareholder rights are
weaker and the firm has more management entrenching provisions, especially when the firm
does not have a large blockholder. The other finding is that CPS is higher when the total
compensation paid to the top team is lower relative to similar companies.
We also examine the two components of CPS – the CEO's slice of the top executive
team's total equity-based compensation, and the CEO's slice of the total compensation that is not
based on equity paid to the team. These two components largely move together, i.e., they are
highly correlated. Both have been trending upwards, thus both contributing to the upward trend
of CPS as a whole. They also correlate similarly with most of the CEO and firm characteristics,
which helps interpreting some results.
2
We also find that CPS has been increasing. Bebchuk and Grinstein (2005) and Frydman
(2005) observed that average CPS levels have been trending upwards, but did not control for
possible changes in firm and CEO characteristics. We confirm the existence of this trend
controlling for both observable and unobservable firm and CEO characteristics. Thus, to the
extent that differences in CPS reflect differences in the relative significance of the CEO in the
top management team, this significance seems to have been growing over time.
The literature on executive compensation to which we seek to contribute is large (see
Core, Guay, and Larcker (2003) for a review). The main aspects of compensation arrangements
to which researchers have paid attention are the level and performance-sensitivity of a given
executive's compensation. In particular, the literature has devoted much attention to studying
how the level of CEO pay is correlated with various characteristics of the CEO, the firm, or the
circumstances. Among other things, studies examined how CEO pay is correlated with protection
from takeovers and the strength of shareholder rights (Borokhovich, Brunarski, and Parrino
(1997)), the presence of blockholders (e.g., Cyert, Kang, and Kumar (2002)), the size of the
board (e.g., Core, Holthausen, and Larcker (1999)), whether directors are busy serving on other
boards (Core, Holthausen, and Larcker (1999)), whether the CEO also chairs the board (Cyert,
Kang, and Kumar (2002), Conyon and Murphy (2000)), the tenure of the CEO (Ryan and
Wiggins (2003)), whether the CEO came from outside the firm (Murphy (2002), and current and
past returns (Murphy (1985)).
In contrast, in this paper we examine how various CEO and firm characteristics –
including many whose relation with the level of CEO pay prior work has examined – are
correlated with the ratio of CEO to other top team members’ pay. Thus, this paper complements
the above work by examining the effect of such variables on another significant dimension of
pay arrangements. Note that a finding that a particular variable is correlated with higher CEO
pay does not imply, of course, that it is also correlated with higher CPS; it might even be that it is
associated with a lower CPS if it is associated with even greater increases in other top executives'
pay than with increases in CEO pay. In many settings, it might be potentially worthwhile to
attribute changes in CEO pay levels to their potential different sources – an increase in the total
compensation pie given to the top executive team, and an increase in the CEO's slice. Our work
complements existing work on CEO pay by identifying whether certain variables that have been
found to result in higher CEO pay do so, at least in part, through the channel of higher CPS.
3
Our analysis is organized as follows. Section II describes our data and presents summary
statistics. Section III presents our empirical analysis of the relationship between CPS and various
aspects of the firm, the CEO, and the environment. Section IV examines changes in CPS over the
past decade and during a CEO's service. Section V breaks down compensation into its equity and
non-equity components and separately analyzes the CEO's slice of each of these components.
Finally, Section IV concludes.
II. THE DATA AND SUMMARY STATISTICS
A. The CEO’s Pay Slice
In order to study the distribution of pay in the top executive team in public companies,
we rely on data from the Compustat ExecuComp database from 1993 – 2004. In particular, we
compute the CEO's pay slice (CPS), defined as the fraction of the CEO’s total compensation
relative to the combined total compensation of the top five executives (including the CEO) in
that company, such that the CPS will be in the unit interval.1 Our main measure is based on the
total compensation to each executive, including salary, bonus, other annual pay, the total value of
restricted stock granted that year, the Black-Scholes value of stock options granted that year,
long-term incentive payouts, and all other total compensation (as reported in ExecuComp item #
TDC1).
In addition, we also decompose the compensation of the CEO and other top executives
into the part that is equity-based (i.e., from options and restricted stock grants) and the remainder
(non-equity-based) component, and compute the CPS for each component separately (CPS-E and
CPS-NE, respectively). Specifically, CPS-E is the CEO’s pay slice based upon equity-based
compensation only, defined as the total value of restricted stock granted and the Black-Scholes
value of stock options granted. CPS-NE is based upon the non-equity-based compensation only,
defined as the total compensation minus the equity-based compensation.
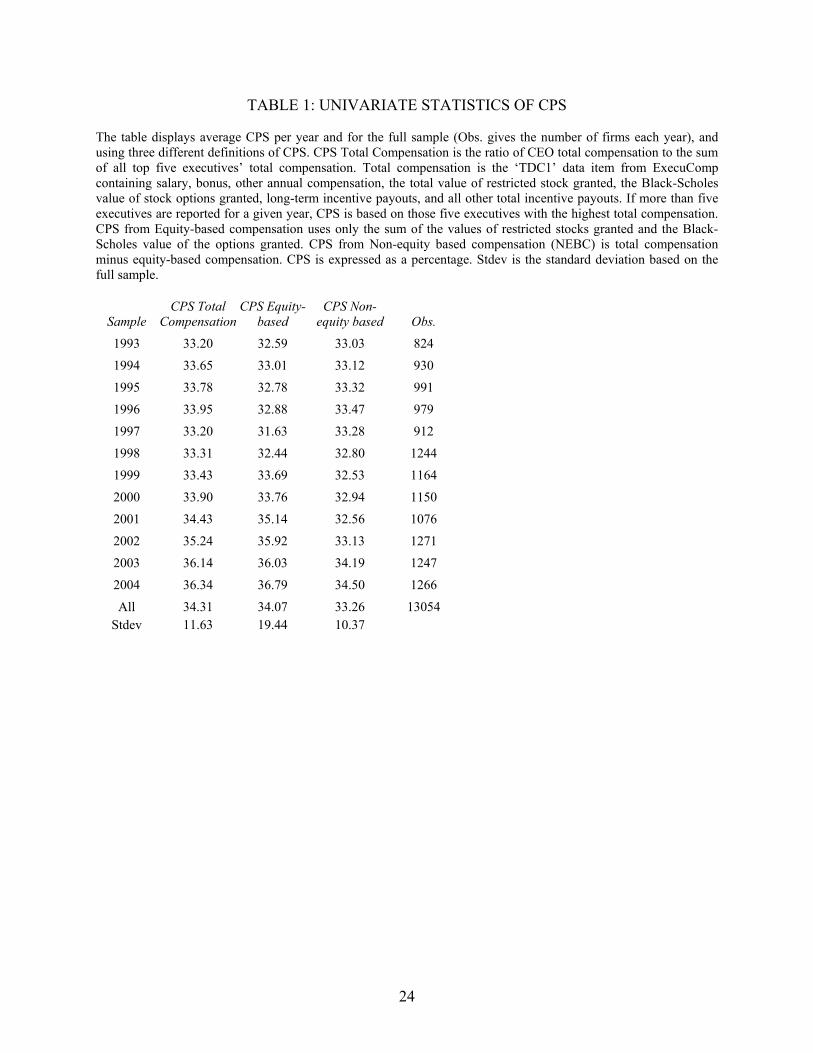
Univariate statistics for our time period of 1993 – 2004 are shown in Table 1. Using the
universe of firms in the ExecuComp database, we find that the CEO’s pay slice is, on average,
34.3%. Similar slices are given to the CEO in terms of equity and non-equity-based
1 Whenever ExecuComp reports more than five executives in a given year, we select the top five executives (in terms of total compensation) only to compute CPS for that year.
4
compensation. We observe an increase in all three CPS measures from 1993 to 2004. CPS
increases from 33.2% in 1993 to 36.3% in 2004, an increase of approximately 10%. Of course,
this might be not due to an actual time trend, but rather due to the changing characteristics of
firms and CEOs in the sample. We will come back to this subject in Section IV, where we report
evidence that, after controlling for firm and CEO characteristics, a positive time trend does
indeed exist.
B. CEO and Firm Characteristics
A large body of research has investigated the correlation between various firm and CEO
characteristics and the pay of CEOs. It is thus natural to examine how these variables are
correlated with CPS. We group the variables into CEO characteristics, measures of the
shareholder rights/power, and firm characteristics. We first define each of those variables and
then show univariate statistics in Table 2, including the average and standard deviations of each
variable for the full sample, as well as the two samples resulting from a split at the median CPS
each year, and four samples resulting from a split at CPS quartiles each year. We also report the
difference-in-mean test statistics of each variable across these samples.
1. CEO Characteristics
The CEO characteristics are based upon ExecuComp data: CEO tenure, CEO age, CEO
coming from the outside, CEO as founder, and the percentage of CEO equity ownership. CEO
tenure is the difference between the year of the observation and the year in which the executive
became CEO. In our panel data sample, average CEO tenure is 6.8 years.2 When comparing the
average tenure between firms with above versus below average CPS, we find no statistically
significant difference. However, looking at the quartiles, we find that tenure displays a non-linear
relation with CPS. In the regressions, we thus include tenure and tenure squared. Age reflects the
CEO’s age in each given year, with an average of 54.7 years.
We determine whether the CEO came from outside or inside the company by comparing
the date the executive joined the company versus the date the executive became CEO. In cases
where the two dates were in the same year, the dummy variable called CEO from outside equals
to one. On average, 15% of the CEOs joined the company from outside. In the univariate
2 Kaplan and Minton (2006) show that CEO tenure has decreased over our time sample.
5
statistics, there is not a significantly higher fraction of CEOs that joined the firm from the outside
in the subsample of high or low CPS. However, the quartile analysis suggests that there might be
potential non-linearities. The dummy variable called founder CEO takes a value of one if the
CEO is classified as the founder of the company. We call a CEO the founder if the executive
became CEO at least five years before the firm went public. We use the first listing year in CRSP
as a proxy for the year in which the firm went public. Thirteen percent of CEO-year observations
are classified as founders in our sample. There is a significantly higher fraction of founder CEOs
in the subsample with low CPS, and the relation seems to be relatively linear based upon the CPS
quartile breakdown.
Finally, the percentage of CEO equity ownership equals the CEO stock ownership
relative to total shares outstanding. On average, CEOs own 2.2% of the company’s equity. We
also compute the other insiders’ ownership as the sum of the stocks owned by the other
executives as reported in ExecuComp, relative to the total number of shares outstanding. In our
sample the other top executive ownership is an average 1.4%. Average CEO ownership is higher
in the subsample with below average CPS. However, the relation is non-linear again. We thus
follow Morck, Shleifer, and Vishny (1988) in defining piece-wise linear ownership variables in
our regression analysis.
2. Shareholder Rights/Power
The second set of variables relates to the power of shareholders, consisting of the
entrenchment index (Eindex), a broader governance index (Gindex), institutional block
ownership, and the ‘abnormal’ level of compensation to the top executives relative to the firm’s
industry and size. Following Bebchuk et al. (2004), we use the entrenchment index denoted by
Eindex and consisting of 6 shareholder rights provisions in a firm’s charter. Eindex ranges
between 0 and 6, where higher values indicate weaker shareholder rights or more entrenched
management.3 The average firm has an Eindex of 2.2. As a robustness test, we have also used the
3 The Eindex is based on data from the Investor Responsibility Research Center (IRRC), which are updated in the years 1990, 1993, 1995, 1998, 2000, 2002, and 2004. For the years where IRRC data is not updated, we use the last value available. For further details, see Bebchuk et al. (2004). Our results are qualitatively similar when we use Gindex rather than Eindex. The results using Gindex are available upon request.
6
Gompers et al. (2003) governance index (Gindex), consisting of 24 charter provisions, and the
results are qualitatively similar.
The variable called Block is the fraction of shares owned by institutional blockholders,
using the Thompson 13F database. Following Cremers and Nair (2005), blockholders are defined
as single institutions owning at least 5% of outstanding shares. We find that block ownership is
higher in the subsample of firms with low CPS, but this difference is not statistically significant.
In our sample, we find that in the average firm, blockholders own 9% of the shares outstanding,
with on average 79% of firms having at least one institutional blockholder.
The final measure related to shareholder power is the total amount of compensation paid
to the top five executives relative to firms in the same industry and of similar size. To this end,
we run an industry fixed-effects regression of the total compensation of the top five executives
with year dummies and a size variable (log of equity market capitalization). Industries are
defined at the two-digit SIC level, and size is the company’s market value of equity. We call the
residual of this equation the Abnormal Total Compensation.
3. Other Firm Characteristics
We use the Compustat database to compute the return on assets (ROA), leverage, firm
size, and high-tech industry dummy. ROA is defined as net profits divided by the book value of
assets, leverage is long-term debt divided by book value of assets, and firm size is measured as
the logarithm of the book value of assets (log book value). All three variables display a
significantly higher average for firms with higher CPS. Following Murphy (1999), we define a
dummy variable called high tech equal to one if the firm is an IT-related industry.4 The
subsample with low CPS has a higher fraction of high-tech firms.
Finally, we use CRSP to compute the annualized stock return for the current and past
year. Firms with a higher CPS have a higher average stock return this year as well as last year.
III. POTENTIAL DETERMINANTS OF CPS
4 Specifically, the high-tech dummy equals one if the firm has one of the following four-digit SIC numbers: of 3570, 3571, 3572, 3576, 3577, 3661, 3674, 4812, 4813, 5045, 5961, 7370, 7371, 7372, 7373.
7
In order to better understand the properties of CPS, we first investigate whether CPS
characterizes a CEO and/or a firm by looking at the correlations between CPS(t) and CPS(t-1)
for CEOs that stay in office. This correlation is 0.45 and is very highly significantly different
from zero. Therefore, there is persistence of CPS for a given CEO. For the firm, we test the
correlation between CPS(t-1) and CPS(t+1), where t is the year of a CEO change. There are
1,480 such events in our database where the old (new) CEO is in office for the full year t-1 (t+1).
This correlation coefficient is 0.33, again highly significantly different from zero. Thus, there is
also persistence within firms across different CEOs. In this section we examine the
characteristics of the CEO, the firm, and the circumstances that are associated with high and low
CPS as well as the variables that are associated with changes within the tenure of a CEO and
within the life of the firm.
As explained earlier, the results in the literature concerning how various variables are
correlated with the level of CEO compensation do not directly imply any relation between these
variables and CPS. The analysis below therefore seeks to provide a novel set of results with
respect to the relationship between such variables and CPS.
One natural hypothesis for which we find significant support in the data is that CPS
reflects the relative significance of the CEO in terms of abilities, contribution, or power. A
greater relative significance of the CEO might come from being a "star CEO" -- the CEO having
(or being perceived as having) superior talents or qualifications that enhance the CEO's relative
contribution to the firm as well as the value of outside opportunities. A greater relative
significance of the CEO might also come from the CEO having relatively more power and
influence over the board of directors. Greater relative significance in terms of contribution and
power are, of course, not mutually exclusive, and can sometimes reinforce and complement each
other. Each one of them, as well as their combined force, can lead to a CEO capturing a larger
slice of the total compensation in the top team.
A. Which Firms and CEOs Have High CPS?
Table 3 displays the results of five pooled regressions with CPS as the dependent variable
on the various CEO, shareholder power, and firm characteristics as described in section 2, using
fixed industry-effects and year dummies. The first three regressions do not require that the CEO
was already CEO the previous year and thus have the largest number of observations. The last
8
two regressions incorporate that restriction, because they add variables of the ownership in the
beginning of the year as well as the stock market return from the preceding year.
1. CPS and CEO Characteristics
Discussing the results by variable group, we start by considering the CEO characteristics
in the first three regressions – the length of tenure, age, whether the CEO came from the outside,
and whether the CEO is a founder.5
Tenure: Here, we find that CPS is significantly increasing in tenure in the first three
regressions, while the effect is strongest in the earlier years as Tenure squared has a negative
coefficient. There are three explanations, all pushing in the same direction. First, higher tenure
might reflect a higher ability/contribution on the part of the CEO – either because of the
acquisition of human capital (learning by doing) or because of a selection/survival effect (CEOs
who have relatively lower ability tend to depart earlier). Second, the longer the CEO serves, the
more power and influence the CEO is likely to have over directors, and the CEO might use this
increased power and influence not only to increase the top team's total pie but also to increase his
or her own slice of it; that is, there is no reason to expect the CEO to use increases in power and
influence to press for higher pay to other top team members as hard as for higher pay to himself
or herself.
Our result is consistent with the finding in the literature that long CEO tenure is
associated with higher CEO pay (Core, Holthausen, and Larcker (1999) and Cyert, Kang, and
Kumar (2002)). It indicates that the result in the literature is at least partly due to an increase in
CPS. It would be interesting to examine in subsequent work whether the effect on the CEO pay
level is solely due to the increase in CPS. That is, do CEOs use increased power to benefit also
other team members and is longer CEO tenure thus associated with higher compensation to the
other members of the top team as well?
It is far from clear that this result can be expected under a pure tournament model.
Longer tenure might be correlated with higher likelihood of departure. This increased likelihood
of the CEO leaving might be sufficient to provide the other executives with sufficient incentives
to excel, such that their salaries can be kept relatively low, in turn resulting in a high CPS. To the
5 In regressions 4 and 5 we subsequently add the CEO ownership in the piecewise linear specification as in Morck, Shleifer, and Vishny (1988).
9
extent that this is the case, this result indicates that CPS reflects not only tournament model but
also the CEO'S relative significance.
Age: We find that CPS is lower for CEOs whose age exceeds 65. This might be due to
the fact that their outside opportunities are lower; that their influence is weakening as their
retirement is looming; or that their contribution/level of activity is starting to decline. The
coefficient of the dummy for young CEOs (below 50) is negative in all regressions but not
significant.
CEO Background: We find that CPS is higher for CEOs coming from the outside. This
result is consistent with the findings of Murphy (2002) that first-year CEOs get higher pay if they
are hired from the outside. Bebchuk and Fried (2004) argue that outsiders are often already
CEOs and thus have higher opportunity costs, which requires paying them more. Clearly, as the
CEO is staying longer, whether he or she came initially from inside or outside recedes in
significance, and consistent with this we find in regression 3 that the interaction of outside with
tenure is negative.
Also, the first three regressions indicate that founders have lower CPS. Once ownership
is controlled for, however, the evidence for this correlation in the fourth and fifth regressions is
mixed.
CEO Ownership: Regressions 4 and 5 of Table 3 add ownership variables for both the
CEO and other insiders. We find strong evidence for a non-linear relationship between CPS and
CEO ownership: at low levels of CEO ownership (less than 1% of firms on average), there is no
effect. CPS is decreasing in CEO ownership for medium levels of CEO ownership (between 5%
and 25% ownership, on average for about 7% of firms), but increasing in CEO ownership for
very high levels of CEO ownership (higher than 25% ownership, on average for about 5% of
firms).
Thus, the association between ownership and CPS is similar to the association between
ownership and Q in the well-known results of Morck, Vishny, and Shleifer (1988). Their
interpretation could be applied to the case under consideration if one were to assume that
increasing CPS decreases value for public shareholders. Within the range 5%-25%, increased
ownership provides incentives to enhance shareholder value. Beyond 25%, under this story,
increased ownership makes the CEO entrenched and the board more willing to increase CPS and
giving little weight to outside investors' interests.
10
2. CPS and Shareholder Rights
Next, we consider the power of shareholders as measured by the entrenchment index
Eindex, the fraction of outstanding equity owned by institutional blockholders, and the relative
total compensation paid to the top executive team (relative to firms of similar size in the same
industry).
Table 3 shows clearly that high entrenchment is associated with higher CPS. The
coefficient of the entrenchment index is significant and economically meaningful in all
regressions. This result might suggest that higher entrenchment is associated with greater
dominance of the CEO in the top executive team.
Borokhovich et al. (1997) and Fahlenbrach (2004) find that anti-takeover provisions are
correlated with higher CEO pay. Our result indicates that at least one channel through which
entrenchment might lead to increased CEO pay is through increasing the CEO's slice. This raises
the question, which future research might want to examine, whether weaker shareholder rights
also increase total top-five compensation as well as the compensation of members of this team
other than the CEO.
We also consider the presence of institutional blockholders, holding at least 5% of
outstanding shares. Having a blockholder can lead to more monitoring (Shleifer and Vishny
(1986)), and there is much empirical evidence that block ownership can influence governance,
particularly executive compensation.6 We find that institutional block ownership is higher in the
subsample of firms with low CPS. However, the difference is not statistically significant, and
neither is it in regression 1 when considered in isolation.
However, we find a strong interaction between the Eindex and blockholding, indicating a
complementary effect consistent with Cremers and Nair (2005) and Cremers, Nair, and Wei
(2006). Specifically, the results in regression 2 indicate that more entrenchment (higher Eindex)
is only associated with higher CPS in the presence of a large institutional blockholder.
What can explain the identified association between entrenchment and CPS? Might it be
that, when the threat of a takeover is weaker, it is especially important to give high-powered
incentives to the CEO? Or that, when the takeover threat is reduced, the CEO is in a better
6 See e.g., Cyert, Kang, and Kumar (2002), Core, Holthausen, and Larcker (1999), Hambrick and Finkelstein (1995), Tosi and Gomez-Meija (1989), and Bertrand and Mullainathan (2000, 2001).
11
position to grab a larger fraction of the top-five pay? Trying to explain the identified connection
between entrenchment and CPS is a worthwhile task for future research.
3. CPS and Total Top-Five Compensation
Abnormal Total Compensation measures the size of the total compensation piece to the
top 5 executives that is being sliced. It makes sense to look not on the absolute level of
compensation but rather on how large compensation is large relative to similar firms, because of
the strong relationship between the level of pay and firm size and industry (see, e.g., Bebchuk
and Grinstein (2005)). To this end, Abnormal Total Compensation is computed as the residual of
the regression of (the log of) total compensation of the top 5 executives on (the log of) market
cap and industry and year fixed effects.
All five regressions indicate that CPS is higher when total compensation is lower
(relative to firm characteristics). One possible explanation is that, assuming arm’s length
contracting between the firm and all of the top-five executives, firms cannot reduce CEO pay
level below peer companies as much as they can for other top-five executives because CEOs are
more “mobile” in terms of more opportunities to switch or because a CEO departure would be
especially disruptive and costly for the firm. Another possible explanation is that, to the extent
that CEOs have an influence on their own pay, they are less willing to be “generous" toward
their team members when the pie to be divided is smaller.
4. CPS and Firms' Financial Characteristics
Lastly, we have financial variables about the firm: ROA, leverage, firm size, the high
tech industry dummy, and the return for current and past year.
We find that CPS is higher when leverage is higher. It is unclear how to explain this
association. While leverage is viewed as costly to the members of the top executive team, it
might be especially costly to the CEO, who might suffer disproportionate loss of reputation in
the event of default. Accordingly, when leverage is high, the CEO might need more
compensation, and might be more aggressive about securing large compensation while in
control. CPS is also higher when ROA, current stock returns, and the stock returns of the prior
12
year, are higher. This could be explained by the CEO's compensation being more sensitive to
performance than that of the other members of the team.7
B. Firm and CEO Fixed-Effects Regressions
Fixed-effect regressions are displayed in Table 4, which ensure that our results are not
driven by any constant firm characteristics that have been omitted from our regressions. The
CEO fixed-effect regressions go a step further and enable us to obtain results (for variables that
can change during the service of a CEO) that are not vulnerable even to omitted CEO variables
that are constant through time. In both cases, we run two regressions – one with all our
observations, and one with only those CEOs who were in place in the previous year already and
for whom we thus have ownership and prior returns data.
The regressions display the robustness of results we obtained earlier. Increases in tenure
continue to be associated with higher CPS, with a declining degree as tenure increases. The firm
fixed-effect regressions where we have more variation in terms of changes from one age group to
another indicate that CPS is lower for CEOs whose age exceeds 65.
Other variables that exhibit significant variation within firm-years and CEO service are
the performance metrics – ROA, current year return, and prior year return. The regressions
indicate the robustness of the positive correlation between CPS and performance.
The extent to which total top-five compensation is high relative to peers also might
change significantly from year to year and thus is another variable on which the fixed effect
regressions can shed light. All four regressions confirm that CPS is negatively correlated with
lower abnormal top-five compensation.
Finally, the Eindex changes little with a CEO’s tenure or for each firm, while there are
sufficient changes in institutional blockholdings within firms and even within a CEO’s tenure.
As a result, the interaction between Eindex and blockholding is still (marginally) significant
when using firm (or CEO) fixed effects.
7 This result is consistent with Barron and Waddell (2003) who compare equity-based compensation across top executives, and Aggarwal and Samwick (2003) who compare pay-performance sensitivities of CEOs to those of divisional managers. Both find that CEOs receive more incentive compensation.
13
The fixed effect regressions also provide further evidence of the persistence within the
CEO and firm across time. Re-running the regressions in Table 4 with CEO dummies, we find a
large number of the CEO dummies to be significantly different from zero, where the CEO with
the median CPS was the hold-out group. In particular, of the 1429 CEO dummies that could be
estimated (i.e., having sufficient number of time series observations), we find 278 to be
significantly different from the median CEO’s CPS. In addition, the R-squared of the CEO fixed
effect regression of 4.3% (column 3 of Table 4) is higher than the R-squared of 2.9% from
running the same regression without fixed effects (not tabulated). Similar results and inference
obtain for the firm analysis (not shown). Both tests provide further evidence of the persistence of
CPS within a CEO and firm through time.
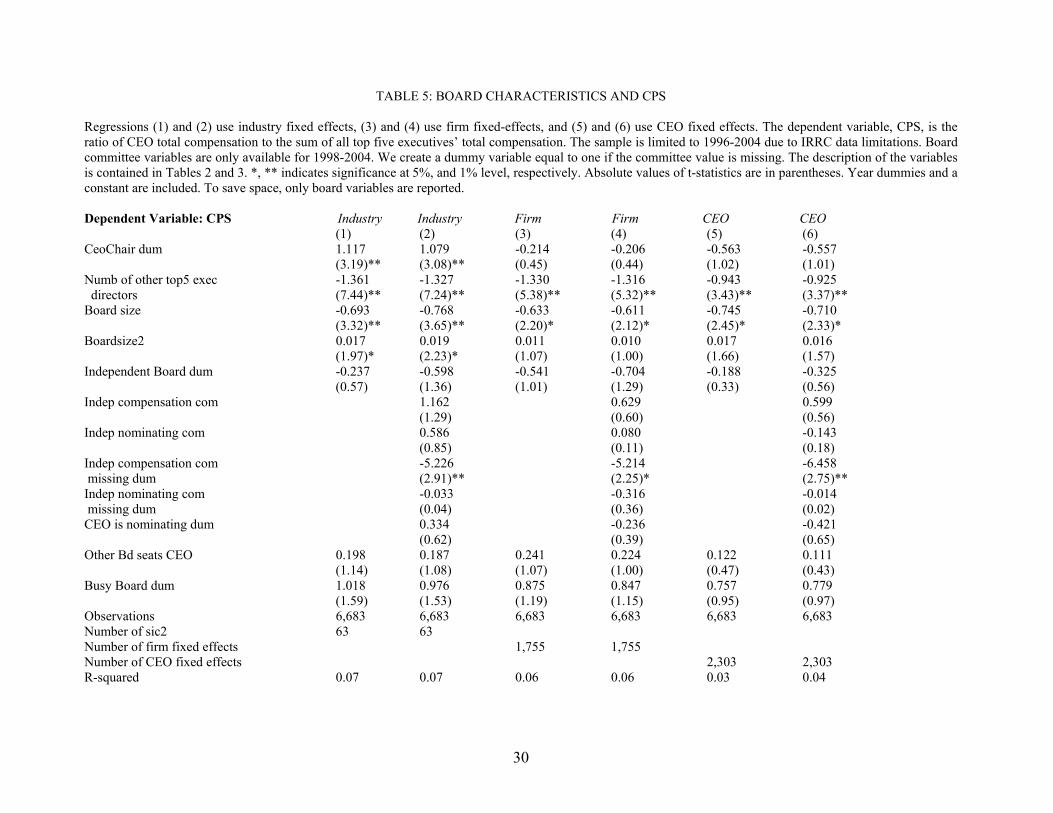
C. Board Characteristics
Table 5 presents the relationship between CPS and the following board characteristics: a
dummy of whether the CEO is also the chairman of the board, the number of other top 5
executives on the board, the size of the board, the number of other CEO board seats, and
dummies for an independent board, compensation committee, and nominating committee,
whether the CEO is on the nominating committee, and finally whether the board is considered to
be ‘busy’. Due to data limitations in IRRC, board characteristics are only available from 1996
onwards, with board committee variables only available from 1998.
We run six regressions. Regressions 1 and 2 are pooled regressions, regressions 3 and 4
are fixed firm-effect regressions, and regressions 5 and 6 are CEO fixed-effect regressions. In
each pair of regressions, the first regression uses all the observations from 1996 onwards and
does not have board committee variables, and the second regression uses the observations from
1998 and includes the committee variables. The results can be summarized as follows.
CEO-Chair: We use data from ExecuComp to determine whether the CEO is also the
Chairman of the Board and create a dummy variable (CEOCHAIR) equal to one if the CEO is
also Chairman. The coefficient of the dummy indicating that the CEO is also chair is positive
and significant in the first two regressions, and positive but not significant in the other four. A
positive correlation might reflect the likelihood that a CEO who serves as chair will be a
dominant player. The CEO's being a chair might be a reflection of greater ability, or it might
14
provide the CEO with more power and influence over the board, and each factor operates to
increase the CEO's dominance.
Our result is consistent with studies indicating that CEO compensation is higher when the
CEO is also chair of the board. (Goyal and Park (2002), Cyert, Kang, and Kumar (2002),
Conyon and Murphy (2000), and Core, Holthausen, and Larcker (1999)). The results indicate
that the higher CEO pay associated with CEO-Chair is at least partly due to higher CPS.
Non-CEO Executives on Board: While the CEO is generally a member of the board, and
firms vary only whether the CEO is also chair, there is significant variance among firms in terms
of how many other executives serve on the board. Using IRRC data, we construct a variable
equal to the number of executives other than the CEO who serve on the board. The number of
other executives on the board is determined by matching the names and age of the board
members in IRRC to the names of the other top four executives in ExecuComp.
The coefficient of this variable is negative and highly significant in all six regressions.
This result is consistent with viewing CPS as reflecting the CEO's relative significance in terms
of abilities and/or power. The presence of other executives on the board might reflect that their
contributions and abilities are also highly appreciated. This presence also means that the CEO is
not the only member of the top executive team that has direct communications channels and
board collegiality links with the directors.
Board Size: We also include the board size, using information from IRRC. The
coefficient of board size is negative and significant in each of the six regressions. We are not
sure how to interpret this result. One possibility is that a larger board size makes it more likely
that non-CEO executives will serve on the board and, notwithstanding the control for the number
of non-CEO directors, this factor drives the result.
There is evidence in the literature that board size is positively correlated with the level of
CEO pay (Core, Holthausen, and Larcker (1999)).8 Our finding that board size is negatively
correlated with CPS indicates that while firms with large boards have higher CEO compensation,
they increase their top-five team pay even more, so that their CPS is still lower.
8 Yermack (1996) finds that pay-performance sensitivity decreases when the board size increases. Our question is, of course, not whether CEO (performance) pay is higher but rather whether the CEO's slice is higher
15
Independence: The coefficient on the board having a majority of independent directors is
negative but is not significant in all six regressions. Theoretically, the relationship between
independence and CPS seems unclear. Although at first glance, board independence weakens the
CEO, it does not strengthen the other executives. Independence has to do more with the relative
significance of the management team and the board than with the relative significance of
members of the top executive team vis-à-vis each other. Furthermore, when the board is not
independent, it is likely that a significant number of the top-five executive team will be on the
board themselves.
We also do not find evidence of significant association between CPS and the
independence of the compensation committee and the nomination committee.
Board Seats in Other Companies: Finally, we use IRRC data to construct two variables
about seats on other boards of publicly traded companies that either the CEO or other directors
have. At first glance, one might think that if the CEO gives less time to the company because of
other occupations, he should be paid less. However, we conjecture that the number of seats on
other boards reflects how much of a star status and outside opportunities the CEO has. On
average, the CEO has 0.5 other board seats in publicly traded companies. Consistent with our
conjecture, the coefficient of the number of board seats of the CEO is positive, though not
significant, in all six regressions.
Following Core, Holthausen, and Larcker (1999), and Fich and Shivdasani (2006), we
define a busy board dummy equal to one if the average director holds three or more
directorships. They find that CEO compensation goes up with the number of outside directors
serving on three or more other boards. We find that the coefficient of the busy board dummy is
positive but not significant in all six regressions.
Thus, we do not find evidence that the channel through which a busy board leads to an
increase in CEO pay is through raising CPS. While a busy board may not be effective in limiting
CEO pay, it may be similarly lax with respect to other executives' pay. Thus, it might be that a
busy board results in an increase in overall total top-five compensation, an effect that can
produce an increase in CEO pay even without raising CPS.
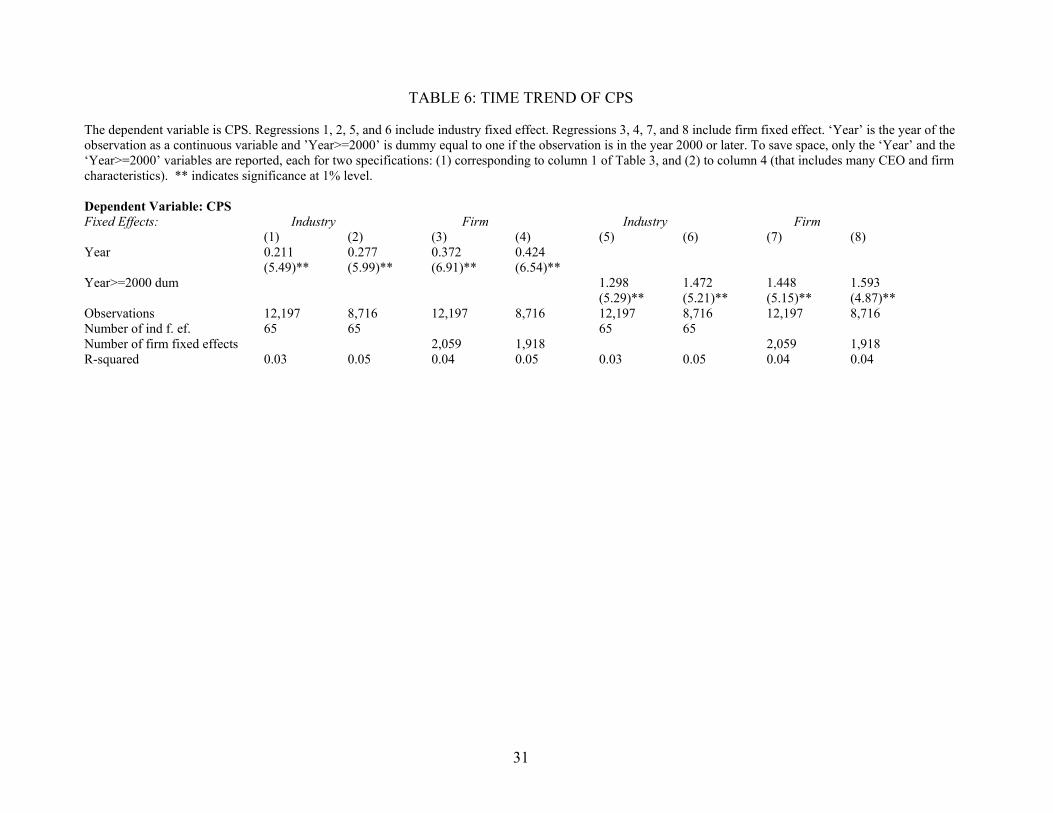
IV. CHANGES OVER TIME
16
As was noted earlier, we find (consistent with Bebchuk and Grinstein (2005) and
Frydman (2005)) that average CPS levels have been trending upwards. We now turn to
investigate whether a time trend still remains in existence when one controls for changes in the
characteristics (both observable and unobservable) of firms and CEOs.
We explore this issue by adding two variables that can capture the time trend to our
earlier regressions: first, the number of years that passed since the beginning of the period of
examination and second, a dummy for whether we are in the second half of the period. For each
we run four regressions: with industry and firm-fixed effects, and for each with and without CEO
and other insider-ownership variables.
The results in Table 6 indicate strong evidence for a time trend in CPS, with any
additional year increasing the share to the CEO by an additional 0.2 – 0.4 percentage points.
Importantly, this time trend in CPS is observed while controlling for the level of total
compensation to the top 5, given that abnormal total compensation, industry dummies, and firm
size are always included as well. The trend towards a growing centrality and power of the CEO
is also born out by the post-2002 dummy, which is highly significant and economically
meaningful, suggesting that CPS is about 1.3 –1.6 percentage points higher in the second half of
our sample.
Khuranah (2002) has argued that during the period under examination, CEOs have
become increasingly viewed as stars – or, in his words, as "the corporate savior."9 Our results
indicate that CEO centrality has not only increased in terms of outside perceptions but has also
been reflected in increased CPS.
The finding that CPS has been increasing over time raises questions that would be
worthwhile examining in future research. First, what explains this trend? Second, what is the
relationship, if any, between this trend and the trend toward increasing top-five compensation
(relative to rank-and-file employees)? Below we sketch and discuss several explanations.
• Increasing CEO turnover: During the considered period, the tenure of CEOs has
decreased and the odds of losing the CEO position in any given year have increased (Kaplan and
Minton (2006)), and CEO pay had to rise to compensate CEO for the increased likelihood of job
loss. To investigate this explanation, it would be worthwhile identifying empirically what has
9 Malmendier and Tate (2005) try to measure the extent to which CEOs are stars. It would be interesting to examine whether measures of CEO stardom have increased over the period under examination.
17
been happening during the same period to the tenure and turnover of top-five executives other
than the CEO.
• Increasing Outside Options for CEOs: During the considered period, the incidence of
CEOs switching to a CEO position in another company has increased (Murphy (2002)), and
firms might have had to raise CEO pay to prevent their CEOs from switching. To investigate this
explanation, it would be worthwhile identifying empirically whether a similar increase in outside
options has not been taking place for top-five executives other than CEOs – that is, to find out
how the incidence of switching to other firms by such top-five executives has changed over the
considered period.
• Increases in Firms’ Market Capitalization: Gabaix and Landier (2006) suggest that the
increases in CEO pay have been driven by increase in the market capitalization by firms. The
question is why this factor has not applied with equal strength to top-five executives other than
the CEO.
• Increase in the value of general managerial skills: It might be argued that the gap
between CEOs and other top executives has widened because general managerial skills have
become more important (Frydman (2005)). To the extent that CEOs have more general
managerial skills, this could make both the contribution to the firm and the outside options of
CEOs more valuable compared with other top executives. This explanation could be tested by
comparing the relative changes in the compensation of non-CEO top executives that have more
and less general managerial skills – e.g., CFOs vs. Presidents or COOs.
• Increase in the Compensation of Other Top Professionals: Kaplan and Rauh (2006))
argue that the upward trend in CEO pay should be understood against the background of the
upward trend in the compensation of other top professionals such as lawyers or money managers.
This explanation again raises the question why it does not apply with equal force to CEOs and
non-CEO top executives.
V. EQUITY VERSUS NON-EQUITY COMPENSATION
Thus far, we have looked at all components of compensation together, using only total
compensation figures for both the CEO and the other executives. We now turn to separately
consider the two components of compensation, namely the part that is equity-based, defined as
18
options and restricted stock, and the non-equity part, the remainder. We denote the CEO's slice
of total equity compensation to the top 5 executives by CPS-E, and the CEO's slice of the total
non-equity compensation by CPS-NE.
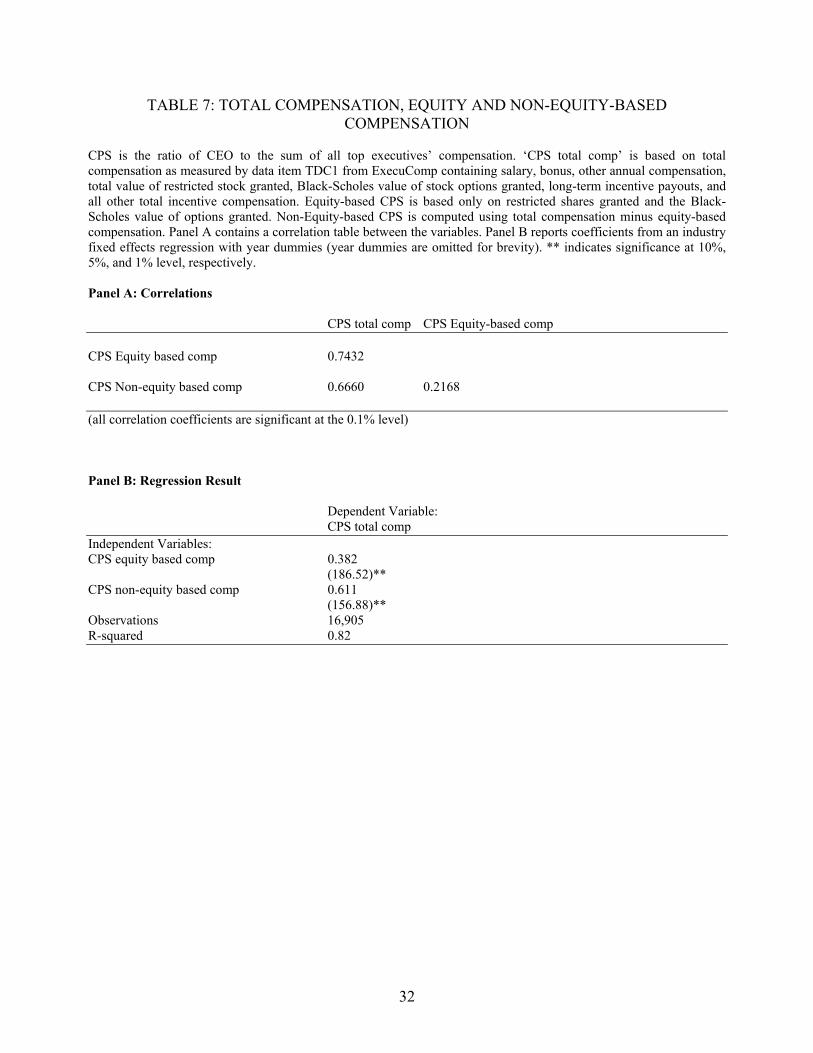
The first question is how CPS-E and CPS-NE are correlated. There are two possible
hypotheses. First, if the CEO gets a higher slice of one type of compensation, he or she can be
given relatively less of the other type of comp, in which case a negative correlation would be
predicted. Alternatively, if the CEO is more significant in terms of ability or influence relative to
others, the CEO will get a higher slice of both equity and non-equity comp. In this case, the
correlation would be positive.
Table 7 panel A displays the correlation between CPS, CPS-E, and CPS-NE. We find that
both components have high correlations with CPS (66% and 74% for CPS-E and CPS-NE,
respectively), but a much lower though still highly significant and positive correlation with each
other, of 22%.
In Panel B of Table 7, we present the results of a regression of CPS on its two
components, including industry fixed effects and year dummies. We find that the variance in
CPS is not driven primarily by variance in one of the components. Rather, each component
contributes substantially to the variance in CPS.
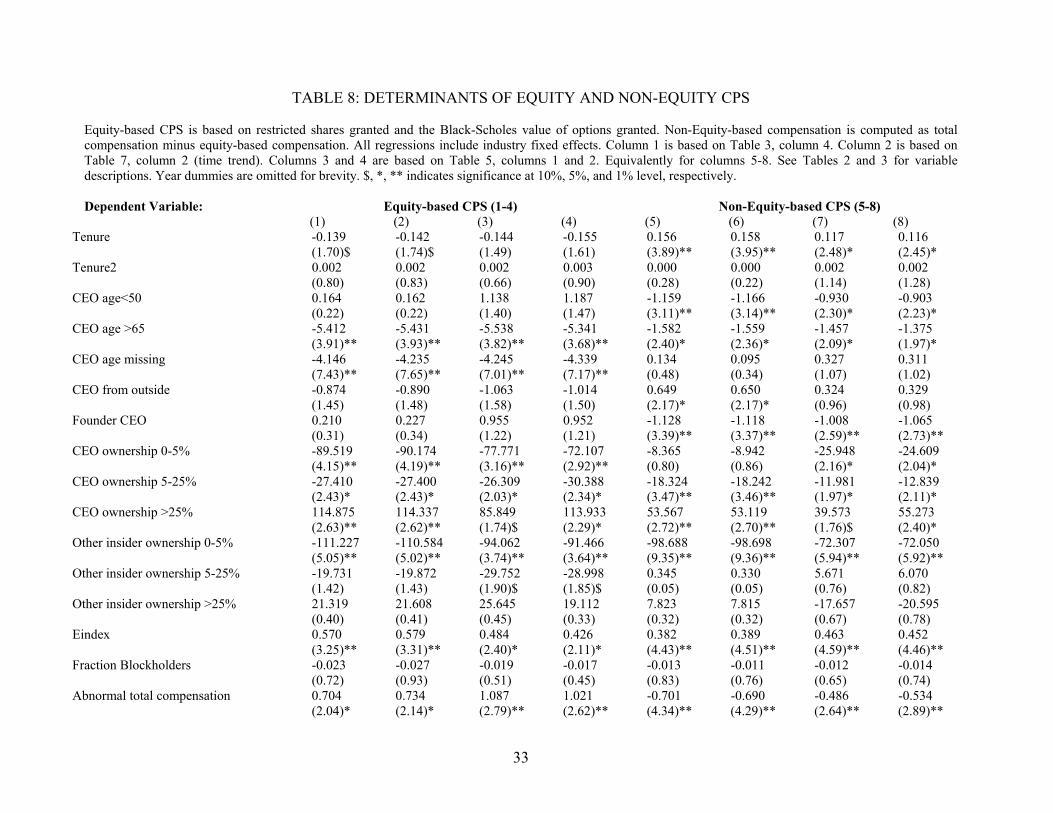
Next, Table 8 presents the regression results relating CPS to the various characteristics of
the CEO, the firm, and the environment, but now separately for CPS-E and CPS-NE. This allows
a test of whether CPS-E and CPS-NE have a different relationship with any of the characteristics
that we have found to have a significant association with CPS as a whole, or whether any of
those previously found relationships are driven by only one of the components.
Again starting with the CEO characteristics, we find that the positive relationship
between CPS and tenure is driven totally by CPS-NE. The longer the tenure, the more the slice
of non-equity compensation taken by the CEO. In contrast, with increased tenure, the CEO's
slice of equity comp actually goes down. This might be explained by the idea that it is the stock
and now the flow of equity compensation that provide CEOs with the right incentives, and CEOs
with longer tenures are already loaded with significant options/shares of the company.
The lower CPS of CEOs older than 65 is driven by both CPS-E and CPS-NE. However,
the especially young CEOs, i.e., those below 50 years of age, get systematically lower CPS-NE
but not when it comes to equity. This fact might reflect that, if youth is correlated with a longer
19
horizon and (thus) more willingness to take risks, younger CEOs have a relative preference for
equity compensation.
The results for the outside CEO dummy are a bit surprising. The larger CPS of outside
CEOs appears to be driven by larger CPS-NE. In particular, the ‘CEO from the outside’ dummy
has a positive and significant coefficient in the CPS-NE regressions, but using CPS-E the
coefficient is negative (though not significant). At first glance, one might have expected that
outsiders would receive relatively higher CPS-E to get the right incentives in place, as they
presumably are starting with no options or shares. However, we find that the outsiders' larger
slice is driven by the non-equity-based compensation.
Turning to the ownership variables, for CPS (see Tables 3 and 4) we observed a lower
CPS if either the CEO or the other insiders own more shares, except when either category of
ownership is very large and goes beyond 25% of outstanding shares. Table 8 shows that the same
holds for both components of CPS, but also reveals an interesting difference in CEO versus other
insiders’ ownership. For the majority of firms, falling in the group of 0 – 5% ownership by either
CEO or other insiders, we find that the relationship between ownership and CPS-E is much
stronger for ownership and CPS-NE when using CEO ownership. For example, the coefficient of
‘CEO ownership 0 – 5%’ equals -89.5 in regression 1 for CPS-E, but only -8.4 in regression 5
for CPS-NE. However, for ownership by other insiders we find hardly a difference. For
example, the coefficient of ‘Other insider ownership 0 – 5%’ equals -111.2 in regression 1 for
CPS-E and -98.7 in regression 5 for CPS-NE. It is also interesting to note that CEO ownership
increases both slices in the range above 25%, but decreases both in the range below 25%.
For shareholder power, we continue to find strong association with entrenchment.
Moreover, we find that this association is with both components.
Comparing the impact of the overall compensation level of the top 5 executives (relative
to firms of similar size and in the same industry), we find a strong difference across the two
components. When the abnormal total compensation is high, CPS-E is higher (e.g., coefficient of
0.704 in regression 1), but CPS-NE is lower (e.g., coefficient of -0.701 in regression 5). While
higher abnormal total compensation is likely driven by higher total equity-based compensation,
that by itself would not imply that a relatively larger fraction of that would be awarded to CEOs,
as Table 8 shows. Rather, this result suggests that when compensation is high, and given that
20
CEO pay is the most salient to investors, higher levels of CEO compensation may be easier to
justify if they come in the form of equity compensation.
The earlier results about the role of executives on the board hold for both components,
with the CEO as the chair increasing both CPS-E and CPS-NE and more other executives on the
board decreasing both of them. Finally, the increase of CPS over time is not limited to one of the
components, but both CPS-E and CPS-NE have been going up. However, CPS-E (see the ‘year’
coefficient of 0.345 in regression 2) has gone up faster than CPS, NE (see the ‘year’ coefficient
of 0.147 in regression 6).
IX. CONCLUSION
In this paper, we investigate the distribution of pay among top executives, focusing on the
CEO's pay slice. Examining the potential determinants of CPS, we find that CPS has a rich and
interesting set of relationships with various aspects of the CEO, the firm, and the environment.
Among other things, we found that CPS is high when the CEO has long tenure and/or chairs the
board, when other executives have fewer on the board and a smaller ownership stake, when
insiders are protected by high entrenchment level, and when the total top-five compensation is
small relative to peer companies. Controlling for changes in firm and CEO characteristics, we
find that CPS has been increasing over the past decade. Identifying the reason for this trend is an
important topic for future research.
21
References Aggarwal, R. K., and A. Samwick (2003), “Performance Incentives within Firms: The Effect of
Managerial Responsibility,” Journal of Finance 58-4, 1613-1649. Barron, J. M., and G. R. Waddell (2003), “Executive Rank, Pay, and Project selection,” Journal
of Financial Economics 67, 305-349. Bebchuk, L. A., and J. M. Fried (2003), “Executive Compensation as an Agency Problem,”
Journal of Economic Perspectives 17, 71–92. Bebchuk, L. A. and Y. Grinstein (2005), “The Growth of Executive Pay,” Oxford Review of
Economic Policy 21, 283-303. Bebchuk, L. A., A. Cohen, and A. Ferrell (2004), “What Matters in Corporate Governance,”
Harvard University Olin Discussion Paper No. 491. Bertrand, M. and S. Mullainathan (2000), “Agents With and Without Principals,” American
Economics Review 90, 203-208. Bertrand, M. and S. Mullainathan (2001), “Are CEOs Rewarded for Luck? The Ones without
Principals Are,” Quarterly Journal of Economics 116, 901-932. Borokhovich, K. A., K. R. Brunarski, and R. Parrino (1997), “CEO Contracting and Anti-
Takeover Amendments,” Journal of Finance 52, 1495-1517. Conyon, M., and K. J. Murphy (2000), “The Prince and the Pauper? CEO Pay in the U.S. and the
U.K.,” Economic Journal 110, 640-671. Core, J. E., W. Guay, and D. F. Larcker (2003), “Executive Equity Compensation and
Incentives: A Survey,” Economic Policy Review 9, 27–50. Core, J. E., R. W. Holthausen, and D. F. Larcker (1999), “Corporate Governance, Chief
Executive Officer Compensation, and Firm Performance,” Journal of Financial Economics 51, 371-40.
Cremers, K. J. M. and V. B. Nair (2005), "Governance Mechanisms and Equity Prices," Journal
of Finance 60-6, 2859-2894. Cremers, K. J. M., V. B. Nair, and C. Wei (2006), "Governance Mechanisms and Bond Prices,"
Review of Financial Studies, forthcoming. Cyert, R., S. Kang, and P. Kumar (2002), “Corporate Governance, Takeovers and Top-
Management Compensation: Theory and Evidence,” Management Science 48, 453-469.
22
Fahlenbrach, R. (2004), “Shareholder Rights and CEO Compensation,” University of Pennsylvania, Institute for Law & Economics Research Paper.
Fich, E. M. and A. Shivdasani (2006), “Are Busy Boards Effective Monitors?” Journal of
Finance 61, 689-724. Frydman, C. (2005), “Rising through the Ranks: The Evolution of the Market for Corporate
Executives, 1936-2003,” MIT Sloan School Working Paper. Gabaix, X. and A. Landier (2006), “Why Has CEO Pay Increased So Much?”, MIT Department
of Economics Working Paper No. 06-13. Gompers, P. A., J. L. Ishii, and A. Metrick (2003), “Corporate Governance and Equity Prices,”
Quarterly Journal of Economics 118, 107-155. Goyal, V. K. and C. W. Park (2002), “Board Leadership Structure and CEO Turnover,” Journal
of Corporate Finance 8, 49-66. Hambrick, D. C. and S. Finkelstein (1995), “The Effects of Ownership Structure on Conditions
at the Top: The Case of CEO Pay Raises,” Strategic Management Journal 16, 175-193. Kaplan, S. N. and B. Minton (2006), “How has CEO Turnover Changed? Increasingly
Performance Sensitive Boards and Increasingly Uneasy CEOs,” NBER Working Paper 12465.
Kaplan, S. and J. Rauh (2006), “Wall Street and Main Street: What Contributes to the Rise in the
Highest Incomes?,” CRSP Working Paper No. 615. Khurana, R. (2002), Searching for a Corporate Savior: The Irrational Quest for Charismatic
CEOs, Princeton University Press. Malmendier, U. and J. A. Tate (2005), “Superstar CEOs”, Working paper. Morck, R., A. Shleifer, and R. Vishny (1988), “Management Ownership and Market Valuation:
An Empirical Analysis,” Journal of Financial Economics 20, 293–315. Murphy, K. J. (1985), “Corporate Performance and Managerial Remuneration: An Empirical
Analysis,” Journal of Accounting and Finance 7, 11-42. Murphy, K. J. (1999), “Executive Compensation,” in Ashenfelter, O., and D. Card, eds.,
Handbook of Labor Economics Vol. 3, North-Holland, Amsterdam. Murphy, K. J. (2002), “Explaining Executive Compensation: Managerial Power vs. the
Perceived Cost of Stock Options,” University of Chicago Law Review 69, 847–869.
23
Ryan, H. E. and R. A. Wiggins (2003), “Who Is in Whose Pocket? Director Compensation, Board Independence, and Barriers to Effective Monitoring,” working paper, Louisiana State University and Bentley College.
Shleifer, A. and R. W. Vishny (1986), “Large Shareholders and Corporate Control,” Journal of
Political Economy 94, 461-488. Tosi, H. L. and L. R. Gomez-Mejia (1989), “The Decoupling of CEO Pay and Performance: An
Agency Theory Perspective,” Administrative Science Quarterly 34, 169-189. Yermack, D. (1996), “Higher Market Valuation for Firms with a Small Board of Directors,”
Journal of Financial Economics 40, 185–211.
24
TABLE 1: UNIVARIATE STATISTICS OF CPS
The table displays average CPS per year and for the full sample (Obs. gives the number of firms each year), and using three different definitions of CPS. CPS Total Compensation is the ratio of CEO total compensation to the sum of all top five executives’ total compensation. Total compensation is the ‘TDC1’ data item from ExecuComp containing salary, bonus, other annual compensation, the total value of restricted stock granted, the Black-Scholes value of stock options granted, long-term incentive payouts, and all other total incentive payouts. If more than five executives are reported for a given year, CPS is based on those five executives with the highest total compensation. CPS from Equity-based compensation uses only the sum of the values of restricted stocks granted and the Black-Scholes value of the options granted. CPS from Non-equity based compensation (NEBC) is total compensation minus equity-based compensation. CPS is expressed as a percentage. Stdev is the standard deviation based on the full sample.
Sample CPS Total
CompensationCPS Equity-
based CPS Non-
equity based Obs.
1993 33.20 32.59 33.03 824
1994 33.65 33.01 33.12 930
1995 33.78 32.78 33.32 991
1996 33.95 32.88 33.47 979
1997 33.20 31.63 33.28 912
1998 33.31 32.44 32.80 1244
1999 33.43 33.69 32.53 1164
2000 33.90 33.76 32.94 1150
2001 34.43 35.14 32.56 1076
2002 35.24 35.92 33.13 1271
2003 36.14 36.03 34.19 1247
2004 36.34 36.79 34.50 1266
All 34.31 34.07 33.26 13054 Stdev 11.63 19.44 10.37
25
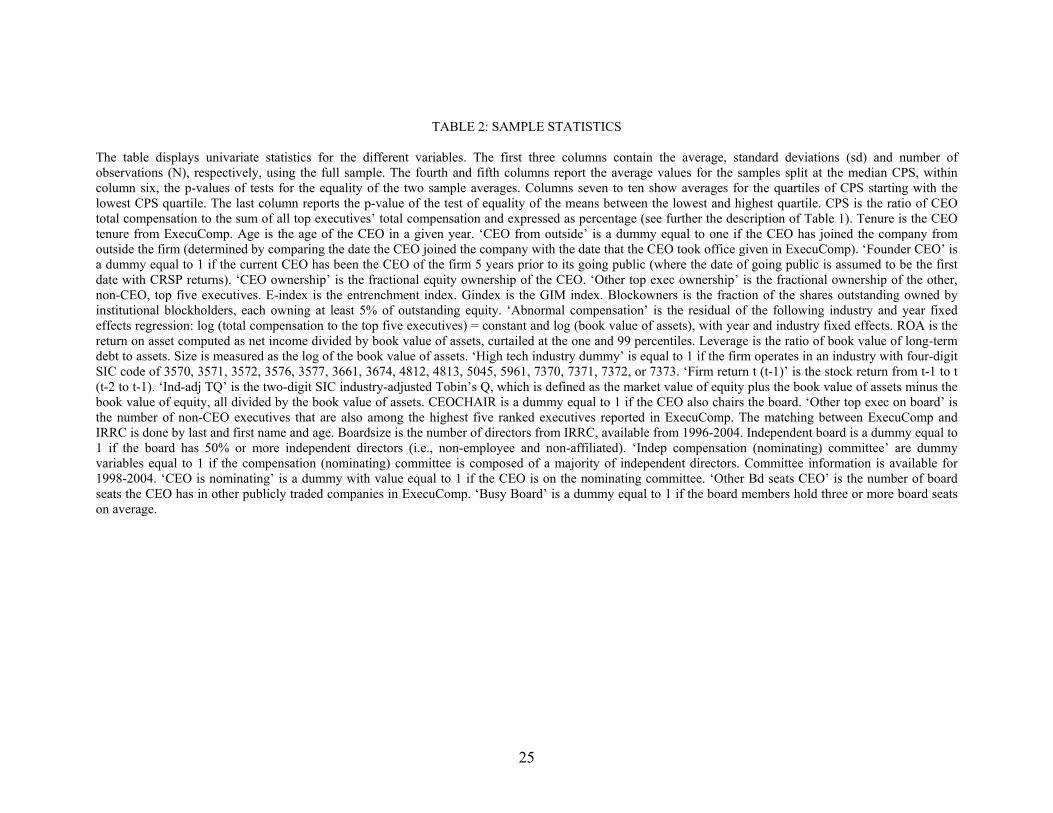
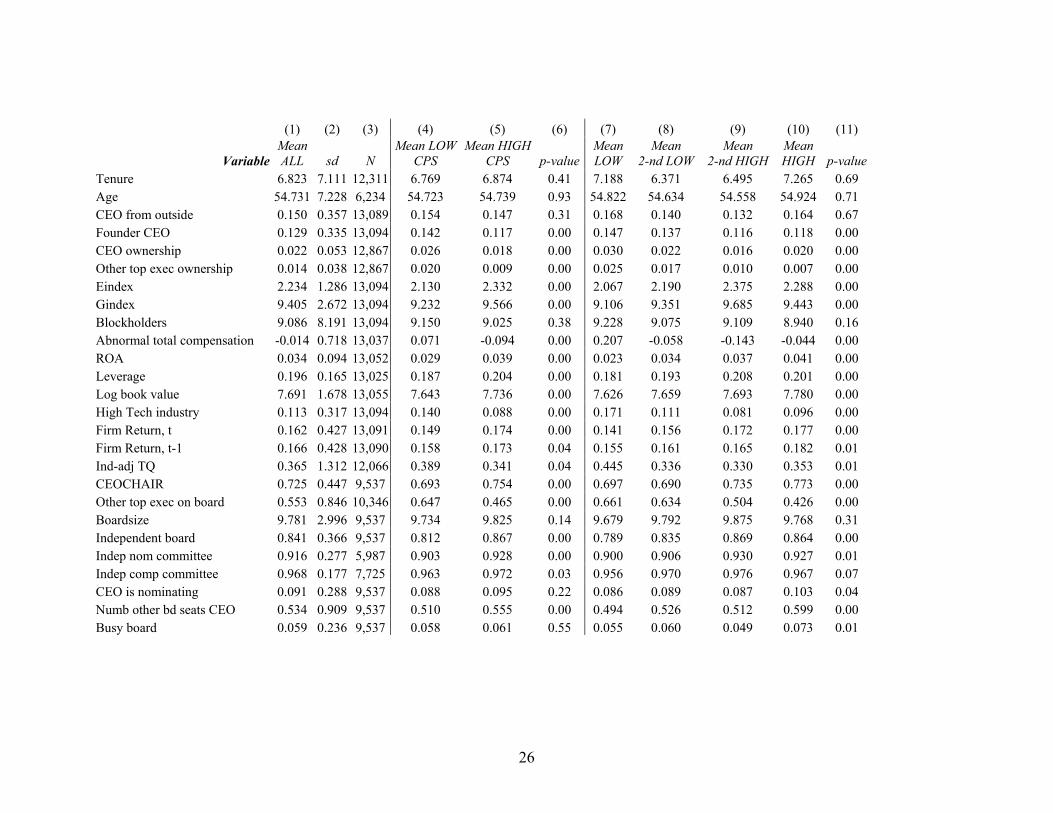
TABLE 2: SAMPLE STATISTICS
The table displays univariate statistics for the different variables. The first three columns contain the average, standard deviations (sd) and number of observations (N), respectively, using the full sample. The fourth and fifth columns report the average values for the samples split at the median CPS, within column six, the p-values of tests for the equality of the two sample averages. Columns seven to ten show averages for the quartiles of CPS starting with the lowest CPS quartile. The last column reports the p-value of the test of equality of the means between the lowest and highest quartile. CPS is the ratio of CEO total compensation to the sum of all top executives’ total compensation and expressed as percentage (see further the description of Table 1). Tenure is the CEO tenure from ExecuComp. Age is the age of the CEO in a given year. ‘CEO from outside’ is a dummy equal to one if the CEO has joined the company from outside the firm (determined by comparing the date the CEO joined the company with the date that the CEO took office given in ExecuComp). ‘Founder CEO’ is a dummy equal to 1 if the current CEO has been the CEO of the firm 5 years prior to its going public (where the date of going public is assumed to be the first date with CRSP returns). ‘CEO ownership’ is the fractional equity ownership of the CEO. ‘Other top exec ownership’ is the fractional ownership of the other, non-CEO, top five executives. E-index is the entrenchment index. Gindex is the GIM index. Blockowners is the fraction of the shares outstanding owned by institutional blockholders, each owning at least 5% of outstanding equity. ‘Abnormal compensation’ is the residual of the following industry and year fixed effects regression: log (total compensation to the top five executives) = constant and log (book value of assets), with year and industry fixed effects. ROA is the return on asset computed as net income divided by book value of assets, curtailed at the one and 99 percentiles. Leverage is the ratio of book value of long-term debt to assets. Size is measured as the log of the book value of assets. ‘High tech industry dummy’ is equal to 1 if the firm operates in an industry with four-digit SIC code of 3570, 3571, 3572, 3576, 3577, 3661, 3674, 4812, 4813, 5045, 5961, 7370, 7371, 7372, or 7373. ‘Firm return t (t-1)’ is the stock return from t-1 to t (t-2 to t-1). ‘Ind-adj TQ’ is the two-digit SIC industry-adjusted Tobin’s Q, which is defined as the market value of equity plus the book value of assets minus the book value of equity, all divided by the book value of assets. CEOCHAIR is a dummy equal to 1 if the CEO also chairs the board. ‘Other top exec on board’ is the number of non-CEO executives that are also among the highest five ranked executives reported in ExecuComp. The matching between ExecuComp and IRRC is done by last and first name and age. Boardsize is the number of directors from IRRC, available from 1996-2004. Independent board is a dummy equal to 1 if the board has 50% or more independent directors (i.e., non-employee and non-affiliated). ‘Indep compensation (nominating) committee’ are dummy variables equal to 1 if the compensation (nominating) committee is composed of a majority of independent directors. Committee information is available for 1998-2004. ‘CEO is nominating’ is a dummy with value equal to 1 if the CEO is on the nominating committee. ‘Other Bd seats CEO’ is the number of board seats the CEO has in other publicly traded companies in ExecuComp. ‘Busy Board’ is a dummy equal to 1 if the board members hold three or more board seats on average.
26
(1) (2) (3) (4) (5) (6) (7) (8) (9) (10) (11)
Variable Mean ALL sd N
Mean LOW CPS
Mean HIGH CPS p-value
Mean LOW
Mean 2-nd LOW
Mean 2-nd HIGH
Mean HIGH p-value
Tenure 6.823 7.111 12,311 6.769 6.874 0.41 7.188 6.371 6.495 7.265 0.69 Age 54.731 7.228 6,234 54.723 54.739 0.93 54.822 54.634 54.558 54.924 0.71 CEO from outside 0.150 0.357 13,089 0.154 0.147 0.31 0.168 0.140 0.132 0.164 0.67 Founder CEO 0.129 0.335 13,094 0.142 0.117 0.00 0.147 0.137 0.116 0.118 0.00 CEO ownership 0.022 0.053 12,867 0.026 0.018 0.00 0.030 0.022 0.016 0.020 0.00 Other top exec ownership 0.014 0.038 12,867 0.020 0.009 0.00 0.025 0.017 0.010 0.007 0.00 Eindex 2.234 1.286 13,094 2.130 2.332 0.00 2.067 2.190 2.375 2.288 0.00 Gindex 9.405 2.672 13,094 9.232 9.566 0.00 9.106 9.351 9.685 9.443 0.00 Blockholders 9.086 8.191 13,094 9.150 9.025 0.38 9.228 9.075 9.109 8.940 0.16 Abnormal total compensation -0.014 0.718 13,037 0.071 -0.094 0.00 0.207 -0.058 -0.143 -0.044 0.00 ROA 0.034 0.094 13,052 0.029 0.039 0.00 0.023 0.034 0.037 0.041 0.00 Leverage 0.196 0.165 13,025 0.187 0.204 0.00 0.181 0.193 0.208 0.201 0.00 Log book value 7.691 1.678 13,055 7.643 7.736 0.00 7.626 7.659 7.693 7.780 0.00 High Tech industry 0.113 0.317 13,094 0.140 0.088 0.00 0.171 0.111 0.081 0.096 0.00 Firm Return, t 0.162 0.427 13,091 0.149 0.174 0.00 0.141 0.156 0.172 0.177 0.00 Firm Return, t-1 0.166 0.428 13,090 0.158 0.173 0.04 0.155 0.161 0.165 0.182 0.01 Ind-adj TQ 0.365 1.312 12,066 0.389 0.341 0.04 0.445 0.336 0.330 0.353 0.01 CEOCHAIR 0.725 0.447 9,537 0.693 0.754 0.00 0.697 0.690 0.735 0.773 0.00 Other top exec on board 0.553 0.846 10,346 0.647 0.465 0.00 0.661 0.634 0.504 0.426 0.00 Boardsize 9.781 2.996 9,537 9.734 9.825 0.14 9.679 9.792 9.875 9.768 0.31 Independent board 0.841 0.366 9,537 0.812 0.867 0.00 0.789 0.835 0.869 0.864 0.00 Indep nom committee 0.916 0.277 5,987 0.903 0.928 0.00 0.900 0.906 0.930 0.927 0.01 Indep comp committee 0.968 0.177 7,725 0.963 0.972 0.03 0.956 0.970 0.976 0.967 0.07 CEO is nominating 0.091 0.288 9,537 0.088 0.095 0.22 0.086 0.089 0.087 0.103 0.04 Numb other bd seats CEO 0.534 0.909 9,537 0.510 0.555 0.00 0.494 0.526 0.512 0.599 0.00 Busy board 0.059 0.236 9,537 0.058 0.061 0.55 0.055 0.060 0.049 0.073 0.01
27
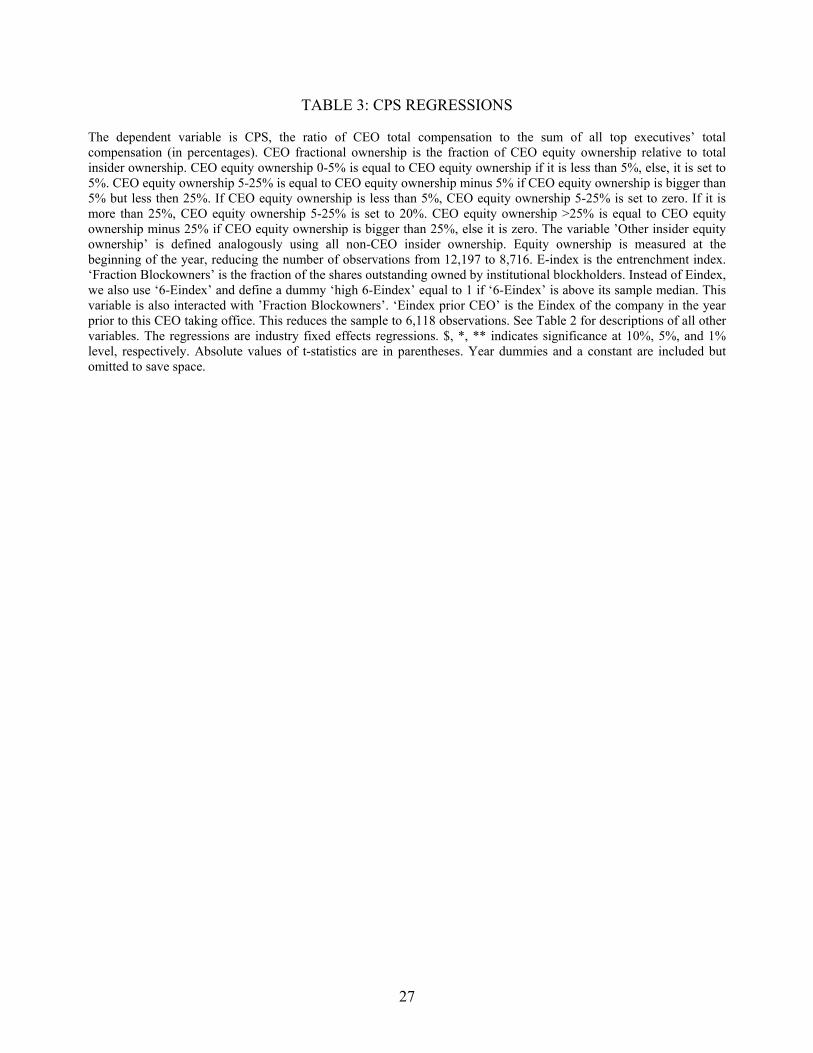
TABLE 3: CPS REGRESSIONS
The dependent variable is CPS, the ratio of CEO total compensation to the sum of all top executives’ total compensation (in percentages). CEO fractional ownership is the fraction of CEO equity ownership relative to total insider ownership. CEO equity ownership 0-5% is equal to CEO equity ownership if it is less than 5%, else, it is set to 5%. CEO equity ownership 5-25% is equal to CEO equity ownership minus 5% if CEO equity ownership is bigger than 5% but less then 25%. If CEO equity ownership is less than 5%, CEO equity ownership 5-25% is set to zero. If it is more than 25%, CEO equity ownership 5-25% is set to 20%. CEO equity ownership >25% is equal to CEO equity ownership minus 25% if CEO equity ownership is bigger than 25%, else it is zero. The variable ’Other insider equity ownership’ is defined analogously using all non-CEO insider ownership. Equity ownership is measured at the beginning of the year, reducing the number of observations from 12,197 to 8,716. E-index is the entrenchment index. ‘Fraction Blockowners’ is the fraction of the shares outstanding owned by institutional blockholders. Instead of Eindex, we also use ‘6-Eindex’ and define a dummy ‘high 6-Eindex’ equal to 1 if ‘6-Eindex’ is above its sample median. This variable is also interacted with ’Fraction Blockowners’. ‘Eindex prior CEO’ is the Eindex of the company in the year prior to this CEO taking office. This reduces the sample to 6,118 observations. See Table 2 for descriptions of all other variables. The regressions are industry fixed effects regressions. $, *, ** indicates significance at 10%, 5%, and 1% level, respectively. Absolute values of t-statistics are in parentheses. Year dummies and a constant are included but omitted to save space.
28
Dependent Variable: CPS, Industry fixed effects regressions (1) (2) (3) (4) (5) Tenure 0.137 0.140 0.101 0.076 0.847 (3.80)** (3.86)** (5.20)** (1.69) (5.43)** Tenure2 -0.003 -0.003 0.001 -0.064 (2.62)** (2.68)** (0.48) (3.57)** CEO age<50 -0.195 -0.181 -0.270 -0.146 -0.584 (0.54) (0.50) (0.75) (0.35) (1.32) CEO age >65 -2.887 -2.904 -2.873 -2.615 -4.557 (4.23)** (4.26)** (4.26)** (3.49)** (3.72)** CEO age missing -0.867 -0.865 -0.931 -1.377 -1.511 (3.18)** (3.18)** (3.42)** (4.36)** (4.22)** CEO from outside 1.008 0.994 2.327 0.124 2.153 (3.39)** (3.34)** (5.69)** (0.36) (4.95)** CEO from outside * -0.158 tenure (4.90)** Founder CEO -1.096 -1.106 -0.927 -0.689 1.730 (3.22)** (3.25)** (2.71)** (1.83)$ (2.42)* CEO ownership 0-5% -14.310 -6.221 (1.21) (0.32) CEO ownership 5-25% -22.974 -28.365 (3.84)** (2.39)* CEO ownership >25% 108.607 86.079 (4.87)** (2.15)* Other insider ownership 0-5% -111.224 -148.307 (9.30)** (9.37)** Other insider ownership 5-25% -2.097 20.534 (0.28) (1.93)$ Other insider ownership >25% 24.834 -22.848 (0.89) (0.53) Eindex 0.408 0.404 0.360 (4.87)** (4.83)** (3.67)** Eindex prior CEO 0.357 (3.18)** Fraction Blockholders -0.002 0.112 -0.002 -0.018 -0.038 (0.12) (2.51)* (0.10) (1.04) (1.87)$ 6-Eindex -0.167 (1.38) 6-Eindex * Fraction -0.027 Blockholders (2.72)** Abnormal total -1.522 -1.519 -1.519 -0.423 -1.674 compensation (10.42)** (10.40)** (10.42)** (2.31)* (7.88)** ROA 8.258 8.264 8.626 8.856 5.640 (7.05)** (7.06)** (7.37)** (6.09)** (3.35)** Leverage 2.233 2.218 2.235 1.859 2.048 (3.04)** (3.02)** (3.04)** (2.16)* (2.04)* Log book value 0.099 0.098 0.094 0.024 -0.131 (1.26) (1.25) (1.20) (0.25) (1.20) High tech -0.450 -0.454 -0.313 -1.134 0.242 (0.98) (0.99) (0.68) (2.10)* (0.38) Firm return t 0.798 0.794 0.801 0.895 0.571 (3.11)** (3.10)** (3.13)** (2.97)** (1.54) Firm return t-1 0.917 0.742 (3.00)** (2.03)* Observations 12,197 12,197 12,197 8,716 6,118 R-squared 0.03 0.03 0.03 0.05 0.08
29
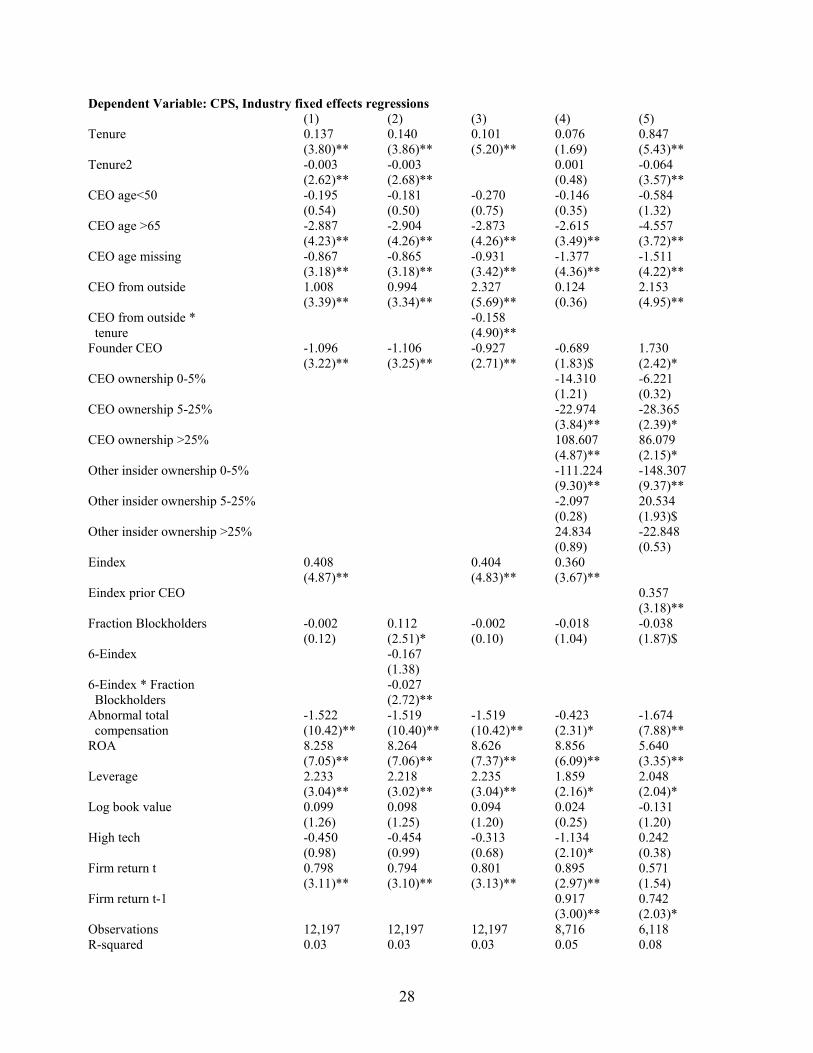
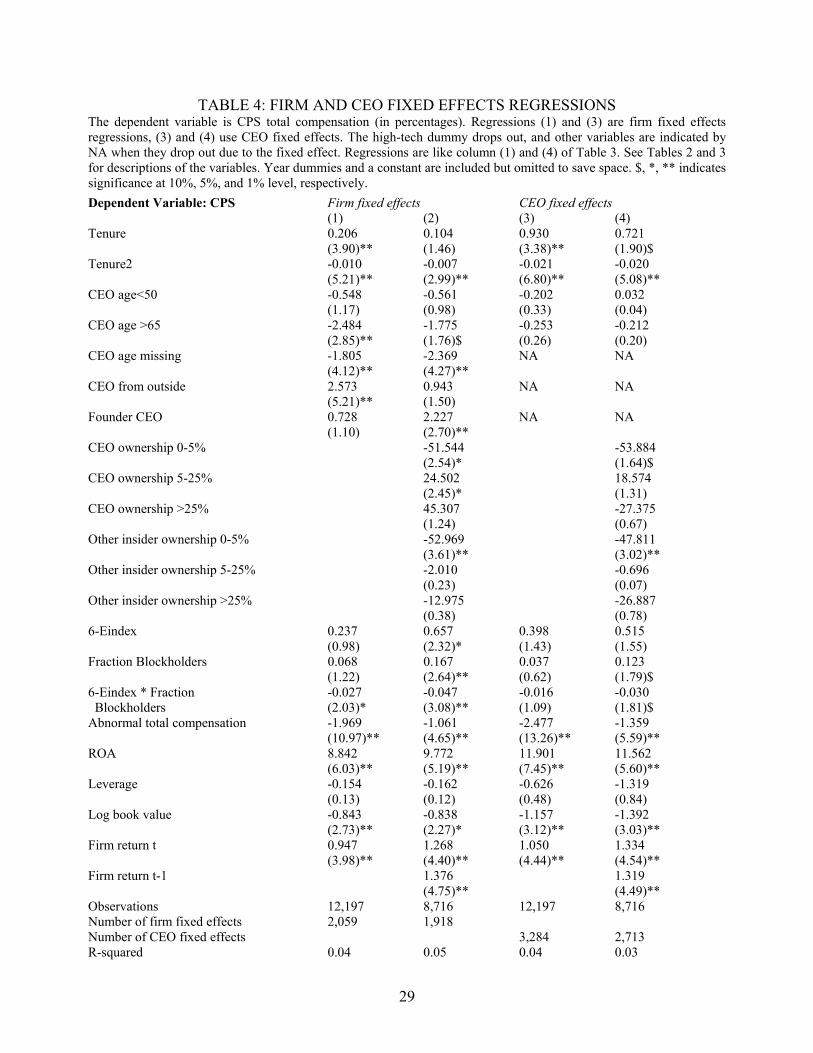
TABLE 4: FIRM AND CEO FIXED EFFECTS REGRESSIONS The dependent variable is CPS total compensation (in percentages). Regressions (1) and (3) are firm fixed effects regressions, (3) and (4) use CEO fixed effects. The high-tech dummy drops out, and other variables are indicated by NA when they drop out due to the fixed effect. Regressions are like column (1) and (4) of Table 3. See Tables 2 and 3 for descriptions of the variables. Year dummies and a constant are included but omitted to save space. $, *, ** indicates significance at 10%, 5%, and 1% level, respectively.
Dependent Variable: CPS Firm fixed effects CEO fixed effects (1) (2) (3) (4) Tenure 0.206 0.104 0.930 0.721 (3.90)** (1.46) (3.38)** (1.90)$ Tenure2 -0.010 -0.007 -0.021 -0.020 (5.21)** (2.99)** (6.80)** (5.08)** CEO age<50 -0.548 -0.561 -0.202 0.032 (1.17) (0.98) (0.33) (0.04) CEO age >65 -2.484 -1.775 -0.253 -0.212 (2.85)** (1.76)$ (0.26) (0.20) CEO age missing -1.805 -2.369 NA NA (4.12)** (4.27)** CEO from outside 2.573 0.943 NA NA (5.21)** (1.50) Founder CEO 0.728 2.227 NA NA (1.10) (2.70)** CEO ownership 0-5% -51.544 -53.884 (2.54)* (1.64)$ CEO ownership 5-25% 24.502 18.574 (2.45)* (1.31) CEO ownership >25% 45.307 -27.375 (1.24) (0.67) Other insider ownership 0-5% -52.969 -47.811 (3.61)** (3.02)** Other insider ownership 5-25% -2.010 -0.696 (0.23) (0.07) Other insider ownership >25% -12.975 -26.887 (0.38) (0.78) 6-Eindex 0.237 0.657 0.398 0.515 (0.98) (2.32)* (1.43) (1.55) Fraction Blockholders 0.068 0.167 0.037 0.123 (1.22) (2.64)** (0.62) (1.79)$ 6-Eindex * Fraction -0.027 -0.047 -0.016 -0.030 Blockholders (2.03)* (3.08)** (1.09) (1.81)$ Abnormal total compensation -1.969 -1.061 -2.477 -1.359 (10.97)** (4.65)** (13.26)** (5.59)** ROA 8.842 9.772 11.901 11.562 (6.03)** (5.19)** (7.45)** (5.60)** Leverage -0.154 -0.162 -0.626 -1.319 (0.13) (0.12) (0.48) (0.84) Log book value -0.843 -0.838 -1.157 -1.392 (2.73)** (2.27)* (3.12)** (3.03)** Firm return t 0.947 1.268 1.050 1.334 (3.98)** (4.40)** (4.44)** (4.54)** Firm return t-1 1.376 1.319 (4.75)** (4.49)** Observations 12,197 8,716 12,197 8,716 Number of firm fixed effects 2,059 1,918 Number of CEO fixed effects 3,284 2,713 R-squared 0.04 0.05 0.04 0.03
30
TABLE 5: BOARD CHARACTERISTICS AND CPS
Regressions (1) and (2) use industry fixed effects, (3) and (4) use firm fixed-effects, and (5) and (6) use CEO fixed effects. The dependent variable, CPS, is the ratio of CEO total compensation to the sum of all top five executives’ total compensation. The sample is limited to 1996-2004 due to IRRC data limitations. Board committee variables are only available for 1998-2004. We create a dummy variable equal to one if the committee value is missing. The description of the variables is contained in Tables 2 and 3. *, ** indicates significance at 5%, and 1% level, respectively. Absolute values of t-statistics are in parentheses. Year dummies and a constant are included. To save space, only board variables are reported. Dependent Variable: CPS Industry Industry Firm Firm CEO CEO (1) (2) (3) (4) (5) (6) CeoChair dum 1.117 1.079 -0.214 -0.206 -0.563 -0.557 (3.19)** (3.08)** (0.45) (0.44) (1.02) (1.01) Numb of other top5 exec -1.361 -1.327 -1.330 -1.316 -0.943 -0.925 directors (7.44)** (7.24)** (5.38)** (5.32)** (3.43)** (3.37)** Board size -0.693 -0.768 -0.633 -0.611 -0.745 -0.710 (3.32)** (3.65)** (2.20)* (2.12)* (2.45)* (2.33)* Boardsize2 0.017 0.019 0.011 0.010 0.017 0.016 (1.97)* (2.23)* (1.07) (1.00) (1.66) (1.57) Independent Board dum -0.237 -0.598 -0.541 -0.704 -0.188 -0.325 (0.57) (1.36) (1.01) (1.29) (0.33) (0.56) Indep compensation com 1.162 0.629 0.599 (1.29) (0.60) (0.56) Indep nominating com 0.586 0.080 -0.143 (0.85) (0.11) (0.18) Indep compensation com -5.226 -5.214 -6.458 missing dum (2.91)** (2.25)* (2.75)** Indep nominating com -0.033 -0.316 -0.014 missing dum (0.04) (0.36) (0.02) CEO is nominating dum 0.334 -0.236 -0.421 (0.62) (0.39) (0.65) Other Bd seats CEO 0.198 0.187 0.241 0.224 0.122 0.111 (1.14) (1.08) (1.07) (1.00) (0.47) (0.43) Busy Board dum 1.018 0.976 0.875 0.847 0.757 0.779 (1.59) (1.53) (1.19) (1.15) (0.95) (0.97) Observations 6,683 6,683 6,683 6,683 6,683 6,683 Number of sic2 63 63 Number of firm fixed effects 1,755 1,755 Number of CEO fixed effects 2,303 2,303 R-squared 0.07 0.07 0.06 0.06 0.03 0.04
31
TABLE 6: TIME TREND OF CPS The dependent variable is CPS. Regressions 1, 2, 5, and 6 include industry fixed effect. Regressions 3, 4, 7, and 8 include firm fixed effect. ‘Year’ is the year of the observation as a continuous variable and ’Year>=2000’ is dummy equal to one if the observation is in the year 2000 or later. To save space, only the ‘Year’ and the ‘Year>=2000’ variables are reported, each for two specifications: (1) corresponding to column 1 of Table 3, and (2) to column 4 (that includes many CEO and firm characteristics). ** indicates significance at 1% level. Dependent Variable: CPS Fixed Effects: Industry Firm Industry Firm (1) (2) (3) (4) (5) (6) (7) (8) Year 0.211 0.277 0.372 0.424 (5.49)** (5.99)** (6.91)** (6.54)** Year>=2000 dum 1.298 1.472 1.448 1.593 (5.29)** (5.21)** (5.15)** (4.87)** Observations 12,197 8,716 12,197 8,716 12,197 8,716 12,197 8,716 Number of ind f. ef. 65 65 65 65 Number of firm fixed effects 2,059 1,918 2,059 1,918 R-squared 0.03 0.05 0.04 0.05 0.03 0.05 0.04 0.04
32
TABLE 7: TOTAL COMPENSATION, EQUITY AND NON-EQUITY-BASED COMPENSATION
CPS is the ratio of CEO to the sum of all top executives’ compensation. ‘CPS total comp’ is based on total compensation as measured by data item TDC1 from ExecuComp containing salary, bonus, other annual compensation, total value of restricted stock granted, Black-Scholes value of stock options granted, long-term incentive payouts, and all other total incentive compensation. Equity-based CPS is based only on restricted shares granted and the Black-Scholes value of options granted. Non-Equity-based CPS is computed using total compensation minus equity-based compensation. Panel A contains a correlation table between the variables. Panel B reports coefficients from an industry fixed effects regression with year dummies (year dummies are omitted for brevity). ** indicates significance at 10%, 5%, and 1% level, respectively. Panel A: Correlations CPS total comp CPS Equity-based comp CPS Equity based comp 0.7432 CPS Non-equity based comp 0.6660 0.2168 (all correlation coefficients are significant at the 0.1% level) Panel B: Regression Result Dependent Variable: CPS total comp Independent Variables: CPS equity based comp 0.382 (186.52)** CPS non-equity based comp 0.611 (156.88)** Observations 16,905 R-squared 0.82
33
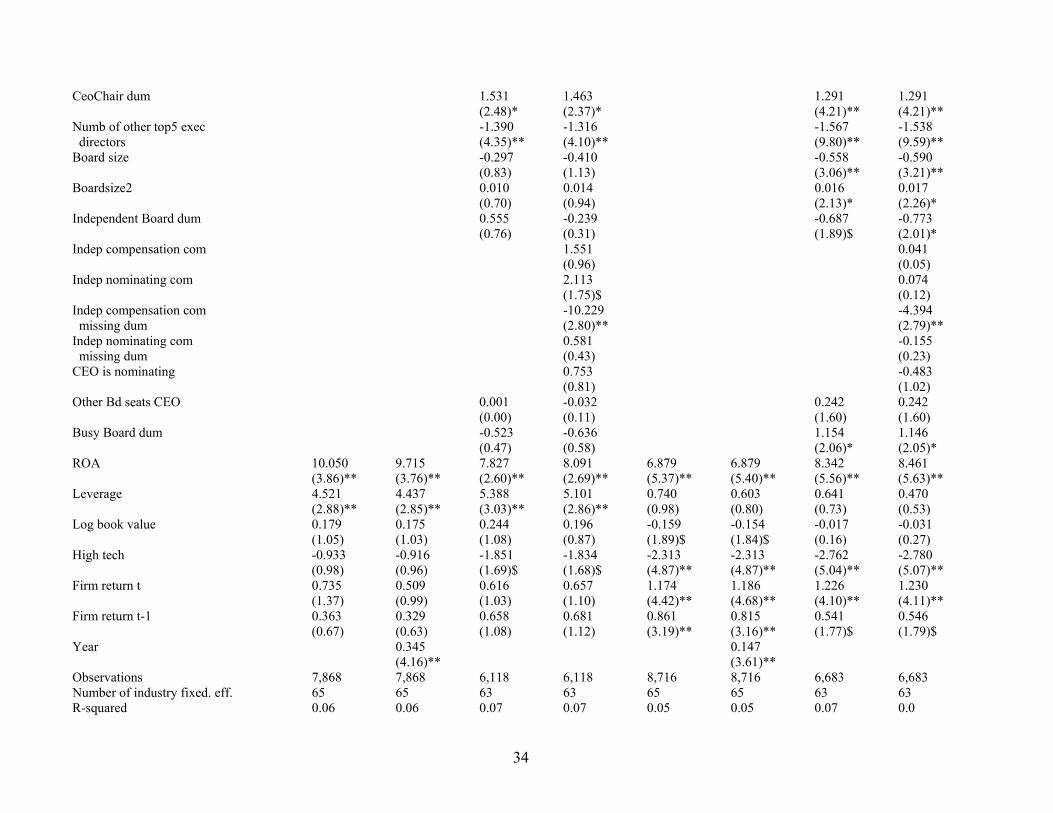
TABLE 8: DETERMINANTS OF EQUITY AND NON-EQUITY CPS Equity-based CPS is based on restricted shares granted and the Black-Scholes value of options granted. Non-Equity-based compensation is computed as total compensation minus equity-based compensation. All regressions include industry fixed effects. Column 1 is based on Table 3, column 4. Column 2 is based on Table 7, column 2 (time trend). Columns 3 and 4 are based on Table 5, columns 1 and 2. Equivalently for columns 5-8. See Tables 2 and 3 for variable descriptions. Year dummies are omitted for brevity. $, *, ** indicates significance at 10%, 5%, and 1% level, respectively. Dependent Variable: Equity-based CPS (1-4) Non-Equity-based CPS (5-8) (1) (2) (3) (4) (5) (6) (7) (8)
Tenure -0.139 -0.142 -0.144 -0.155 0.156 0.158 0.117 0.116 (1.70)$ (1.74)$ (1.49) (1.61) (3.89)** (3.95)** (2.48)* (2.45)* Tenure2 0.002 0.002 0.002 0.003 0.000 0.000 0.002 0.002 (0.80) (0.83) (0.66) (0.90) (0.28) (0.22) (1.14) (1.28) CEO age<50 0.164 0.162 1.138 1.187 -1.159 -1.166 -0.930 -0.903 (0.22) (0.22) (1.40) (1.47) (3.11)** (3.14)** (2.30)* (2.23)* CEO age >65 -5.412 -5.431 -5.538 -5.341 -1.582 -1.559 -1.457 -1.375 (3.91)** (3.93)** (3.82)** (3.68)** (2.40)* (2.36)* (2.09)* (1.97)* CEO age missing -4.146 -4.235 -4.245 -4.339 0.134 0.095 0.327 0.311 (7.43)** (7.65)** (7.01)** (7.17)** (0.48) (0.34) (1.07) (1.02) CEO from outside -0.874 -0.890 -1.063 -1.014 0.649 0.650 0.324 0.329 (1.45) (1.48) (1.58) (1.50) (2.17)* (2.17)* (0.96) (0.98) Founder CEO 0.210 0.227 0.955 0.952 -1.128 -1.118 -1.008 -1.065 (0.31) (0.34) (1.22) (1.21) (3.39)** (3.37)** (2.59)** (2.73)** CEO ownership 0-5% -89.519 -90.174 -77.771 -72.107 -8.365 -8.942 -25.948 -24.609 (4.15)** (4.19)** (3.16)** (2.92)** (0.80) (0.86) (2.16)* (2.04)* CEO ownership 5-25% -27.410 -27.400 -26.309 -30.388 -18.324 -18.242 -11.981 -12.839 (2.43)* (2.43)* (2.03)* (2.34)* (3.47)** (3.46)** (1.97)* (2.11)* CEO ownership >25% 114.875 114.337 85.849 113.933 53.567 53.119 39.573 55.273 (2.63)** (2.62)** (1.74)$ (2.29)* (2.72)** (2.70)** (1.76)$ (2.40)* Other insider ownership 0-5% -111.227 -110.584 -94.062 -91.466 -98.688 -98.698 -72.307 -72.050 (5.05)** (5.02)** (3.74)** (3.64)** (9.35)** (9.36)** (5.94)** (5.92)** Other insider ownership 5-25% -19.731 -19.872 -29.752 -28.998 0.345 0.330 5.671 6.070 (1.42) (1.43) (1.90)$ (1.85)$ (0.05) (0.05) (0.76) (0.82) Other insider ownership >25% 21.319 21.608 25.645 19.112 7.823 7.815 -17.657 -20.595 (0.40) (0.41) (0.45) (0.33) (0.32) (0.32) (0.67) (0.78) Eindex 0.570 0.579 0.484 0.426 0.382 0.389 0.463 0.452 (3.25)** (3.31)** (2.40)* (2.11)* (4.43)** (4.51)** (4.59)** (4.46)** Fraction Blockholders -0.023 -0.027 -0.019 -0.017 -0.013 -0.011 -0.012 -0.014 (0.72) (0.93) (0.51) (0.45) (0.83) (0.76) (0.65) (0.74) Abnormal total compensation 0.704 0.734 1.087 1.021 -0.701 -0.690 -0.486 -0.534 (2.04)* (2.14)* (2.79)** (2.62)** (4.34)** (4.29)** (2.64)** (2.89)**
34
CeoChair dum 1.531 1.463 1.291 1.291 (2.48)* (2.37)* (4.21)** (4.21)** Numb of other top5 exec -1.390 -1.316 -1.567 -1.538 directors (4.35)** (4.10)** (9.80)** (9.59)** Board size -0.297 -0.410 -0.558 -0.590 (0.83) (1.13) (3.06)** (3.21)** Boardsize2 0.010 0.014 0.016 0.017 (0.70) (0.94) (2.13)* (2.26)* Independent Board dum 0.555 -0.239 -0.687 -0.773 (0.76) (0.31) (1.89)$ (2.01)* Indep compensation com 1.551 0.041 (0.96) (0.05) Indep nominating com 2.113 0.074 (1.75)$ (0.12) Indep compensation com -10.229 -4.394 missing dum (2.80)** (2.79)** Indep nominating com 0.581 -0.155 missing dum (0.43) (0.23) CEO is nominating 0.753 -0.483 (0.81) (1.02) Other Bd seats CEO 0.001 -0.032 0.242 0.242 (0.00) (0.11) (1.60) (1.60) Busy Board dum -0.523 -0.636 1.154 1.146 (0.47) (0.58) (2.06)* (2.05)* ROA 10.050 9.715 7.827 8.091 6.879 6.879 8.342 8.461 (3.86)** (3.76)** (2.60)** (2.69)** (5.37)** (5.40)** (5.56)** (5.63)** Leverage 4.521 4.437 5.388 5.101 0.740 0.603 0.641 0.470 (2.88)** (2.85)** (3.03)** (2.86)** (0.98) (0.80) (0.73) (0.53) Log book value 0.179 0.175 0.244 0.196 -0.159 -0.154 -0.017 -0.031 (1.05) (1.03) (1.08) (0.87) (1.89)$ (1.84)$ (0.16) (0.27) High tech -0.933 -0.916 -1.851 -1.834 -2.313 -2.313 -2.762 -2.780 (0.98) (0.96) (1.69)$ (1.68)$ (4.87)** (4.87)** (5.04)** (5.07)** Firm return t 0.735 0.509 0.616 0.657 1.174 1.186 1.226 1.230 (1.37) (0.99) (1.03) (1.10) (4.42)** (4.68)** (4.10)** (4.11)** Firm return t-1 0.363 0.329 0.658 0.681 0.861 0.815 0.541 0.546 (0.67) (0.63) (1.08) (1.12) (3.19)** (3.16)** (1.77)$ (1.79)$ Year 0.345 0.147 (4.16)** (3.61)** Observations 7,868 7,868 6,118 6,118 8,716 8,716 6,683 6,683 Number of industry fixed. eff. 65 65 63 63 65 65 63 63 R-squared 0.06 0.06 0.07 0.07 0.05 0.05 0.07 0.0