Embed Size (px)
Citation preview

Six Sigma
Todd PawlickiUniversity of California, San Diego
Dept of Radiation Medicine & Applied Sciences
Disclosures
• Founding partner of TreatSafely, LLC– www.treatsafely.org– i.treatsafely.org
• Founding partner of Oncology Owl, LLC– SPC‐based QA software
• Royalties from textbook– Quality and Safety in Radiotherapy

Six Sigma Demystified
• The scientific process applied to quality improvement
Not quite...also includes many new tools, issues of change management and sustaining change.

What is Six Sigma?
• An accessible structured approach to data‐based quality improvement using a wide variety of tools and techniques that is tied to the goals of management including overall time and/or cost savings for the institution.

Bill Smith
• Creator of Six Sigma– TQM spinoff; a better mousetrap
• 1952 Naval Academy graduate – 35 years engineering and QA
• Joined Motorola in 1987– Using 6 , Motorola was the 1988 Baldrige winner
• Died at work of a heart attack in 1994

Six Sigma Excellence
• Defective parts per million (ppm) opportunitiesLimits in
sigma around the mean
Probability of having aproduct outside the limits(Centered distribution)
Probability of having aproduct outside the limits
(distribution shifted by 1.5 )3 sigma 2700 ppm 66,810 ppm4 sigma 63.4 ppm 6,210 ppm5 sigma 0.34 ppm 233 ppm6 sigma 2 ppb 3.4 ppm

DMAIC• Define – Measure – Analyze – Improve – Control
DefineWhat problem to solve?
MeasureWhat is the process capability?
AnalyzeWhen & where do defects occur?
ImproveGo after root causes.
ControlControl process to sustain gains.
Redesign
Optimization

Six Sigma Training
• Support obtained ($20k)– May 2010
• June – December 2010• 5 members / 5 projects
– Clin Ops Manager, Physics, IT, Dosimetry, Therapy– Example
• Reduce the time for patients to start SRS treatment
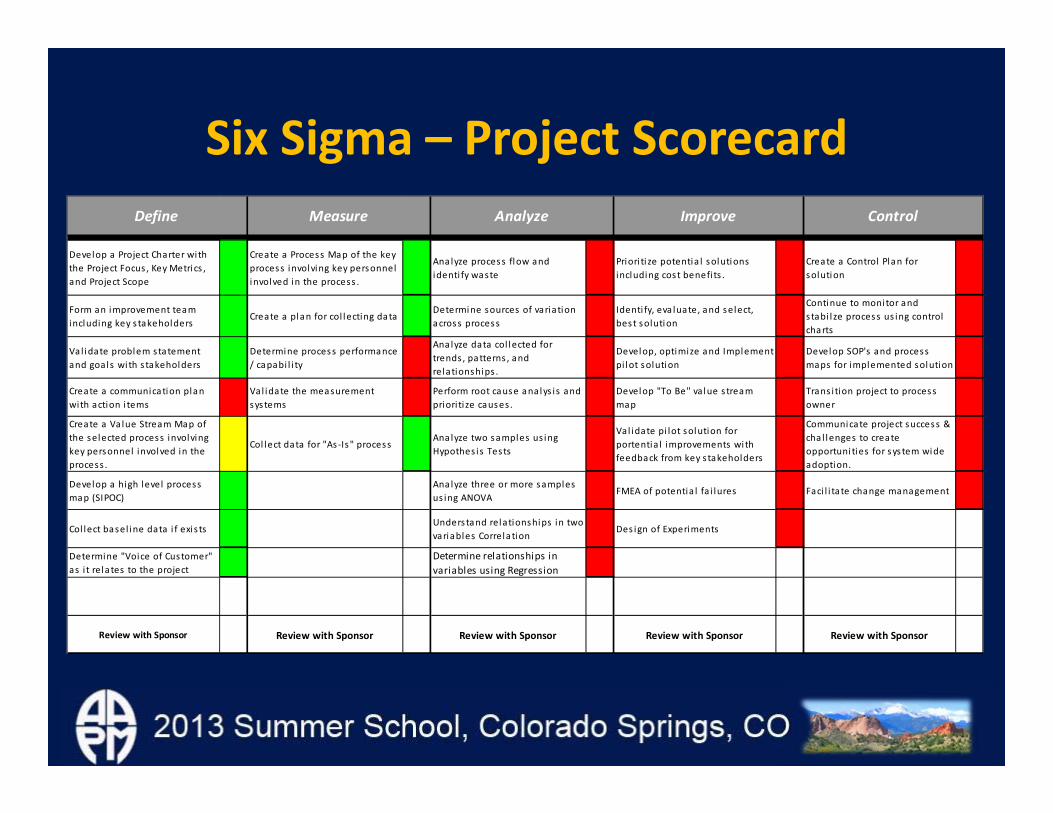
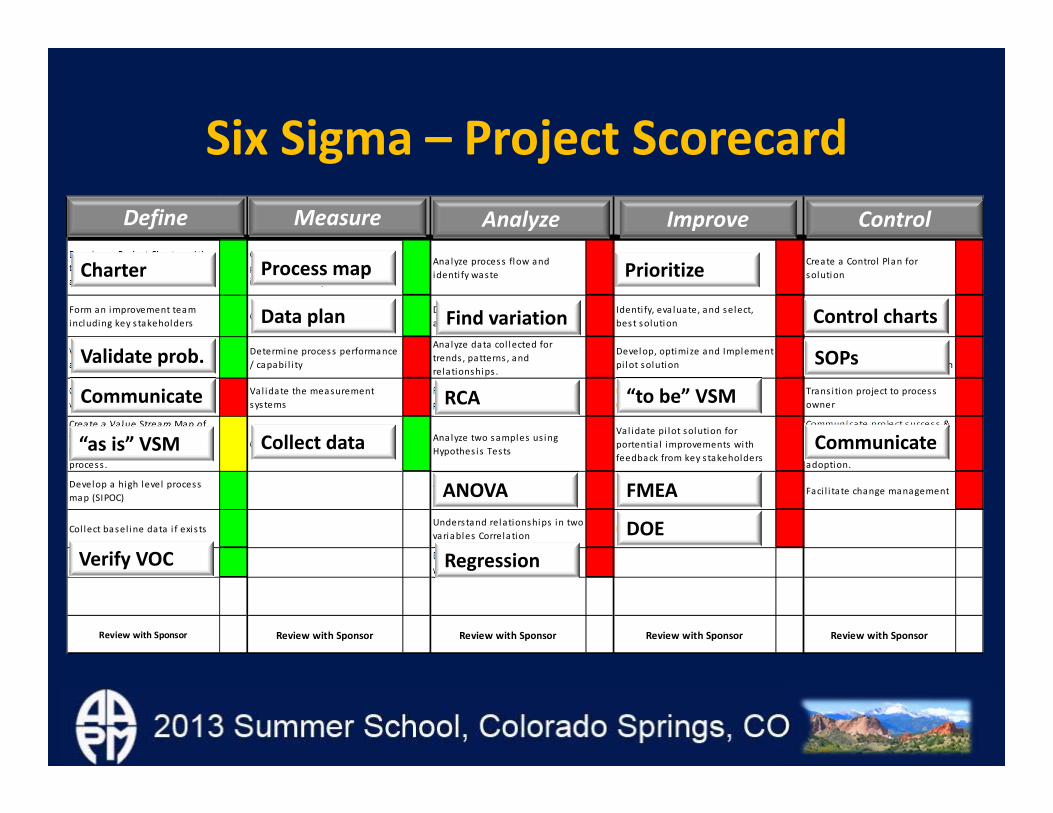
Six Sigma – Project Scorecard
Develop a Project Charter with the Project Focus , Key Metrics , and Project Scope
Create a Process Map of the key process involving key personnel involved in the process .
Ana lyze process flow and identi fy waste
Priori ti ze potentia l solutions including cost benefi ts .
Create a Control Plan for solution
Form an improvement team including key s takeholders
Create a plan for col lecting data Determine sources of variation across process
Identi fy, eva luate, and select, best solution
Continue to monitor and s tabi l ze process us ing control charts
Va l idate problem s tatement and goals with s takeholders
Determine process performance / capabi l i ty
Ana lyze data col lected for trends, patterns , and relationships .
Develop, optimize and Implement pi lot solution
Develop SOP's and process maps for implemented solution
Create a communication plan with action i tems
Val idate the measurement sys tems
Perform root cause analys is and priori tize causes .
Develop "To Be" value s tream map
Trans ition project to process owner
Create a Value Stream Map of the selected process involving key personnel involved in the process .
Col lect data for "As ‐Is " processAna lyze two samples us ing Hypothes is Tests
Val idate pi lot solution for portentia l improvements with feedback from key s takeholders
Communicate project success & cha l lenges to create opportuni ties for sys tem wide adoption.
Develop a high level process map (SIPOC)
Analyze three or more samples us ing ANOVA
FMEA of potentia l fa i lures Faci l i ta te change management
Col lect basel ine data i f exis tsUnderstand relationships in two variables Correlation
Des ign of Experiments
Determine "Voice of Customer" as i t relates to the project
Determine relationships in variables using Regression
Review with Sponsor Review with Sponsor Review with Sponsor Review with Sponsor Review with Sponsor
Define Measure Analyze Improve Control
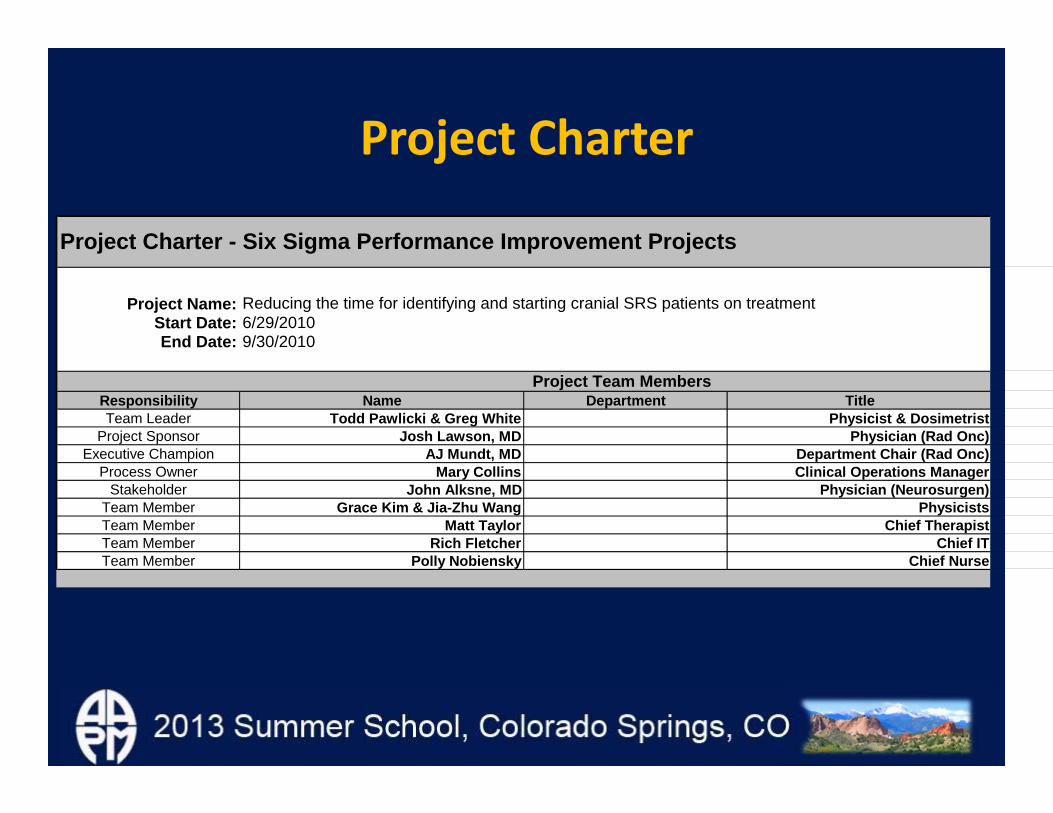
Project Charter
Project Name:Start Date: 6/29/2010End Date: 9/30/2010
Responsibility Name Department TitleTeam Leader Todd Pawlicki & Greg White Physicist & Dosimetrist
Project Sponsor Josh Lawson, MD Physician (Rad Onc)Executive Champion AJ Mundt, MD Department Chair (Rad Onc)
Process Owner Mary Collins Clinical Operations ManagerStakeholder John Alksne, MD Physician (Neurosurgen)
Team Member Grace Kim & Jia-Zhu Wang PhysicistsTeam Member Matt Taylor Chief TherapistTeam Member Rich Fletcher Chief ITTeam Member Polly Nobiensky Chief Nurse
Project Charter - Six Sigma Performance Improvement Projects
Reducing the time for identifying and starting cranial SRS patients on treatment
Project Team Members

Problem Statement and Scope
ScopeStarts after consult is completed and ends when the patient's first fraction begins.
Currently, it takes 16.3 work days to get a cranial SRS patient on treatment. This results in stress for the patients in waiting for their treatment as well as deviations from high-quality care, in some cases due to medical conflicts with chemotherapy, for example.
Problem Statement
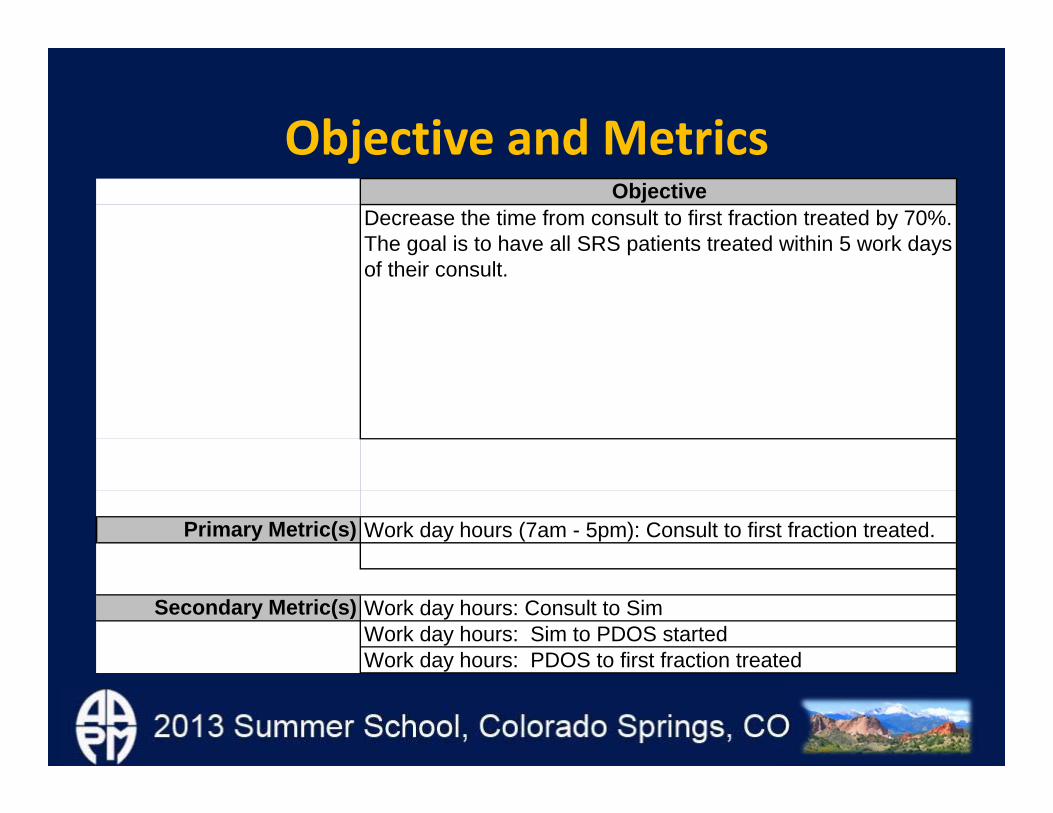
Objective and Metrics
Primary Metric(s)
Secondary Metric(s)
Work day hours (7am - 5pm): Consult to first fraction treated.
Work day hours: Consult to SimWork day hours: Sim to PDOS startedWork day hours: PDOS to first fraction treated
Decrease the time from consult to first fraction treated by 70%. The goal is to have all SRS patients treated within 5 work days of their consult.
Objective
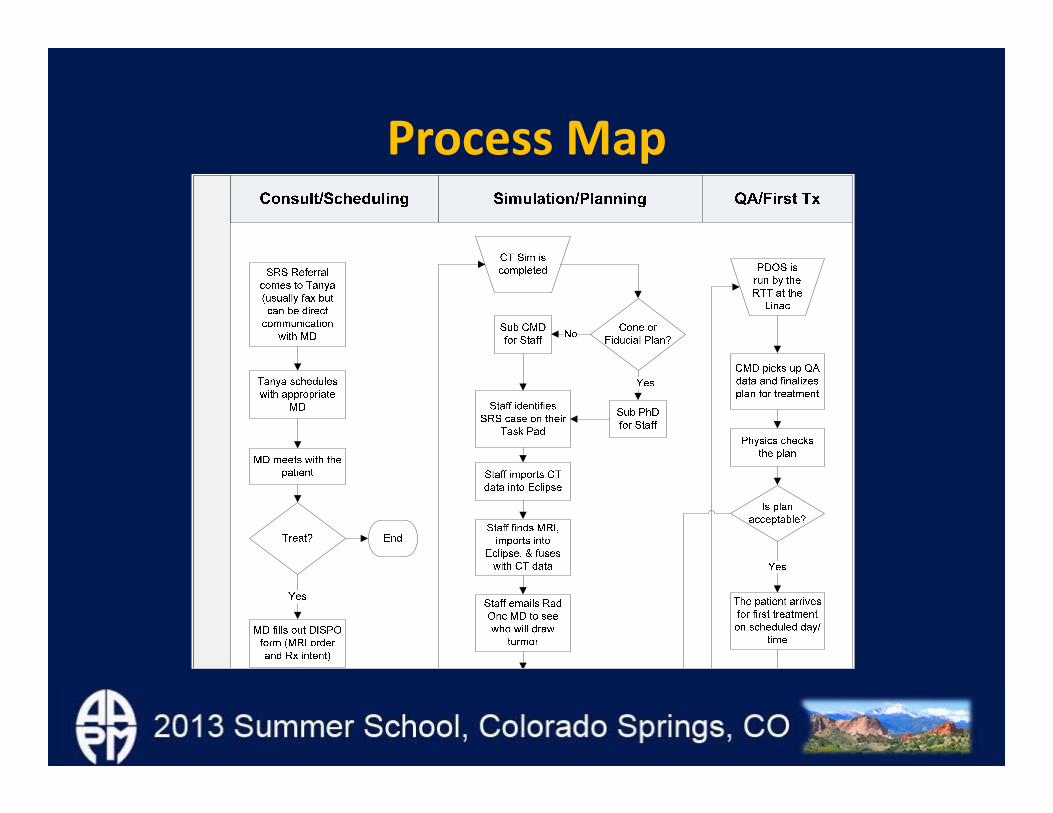
Process Map

Data Collection Plan

Descriptive Statistics of Baseline Data
Raw Data Outlier Removed
Mean 19.6 16.3
Standard deviation 11.9 6.5
Minimum 8.3 8.3
Maximum 48.7 28.1
Consult to First Treatment (workdays, 7am ‐ 5pm)

Fishbone Diagram

Correlation Analysis
R2 = 0.1951
0.0
5.0
10.0
15.0
20.0
25.0
30.0
35.0
40.0
45.0
0.0 1.0 2.0 3.0 4.0 5.0 6.0 7.0 8.0
PDOS to First Tx (workdays)
Cons
ult t
o Fi
rst T
reat
men
t (w
orkd
ays)
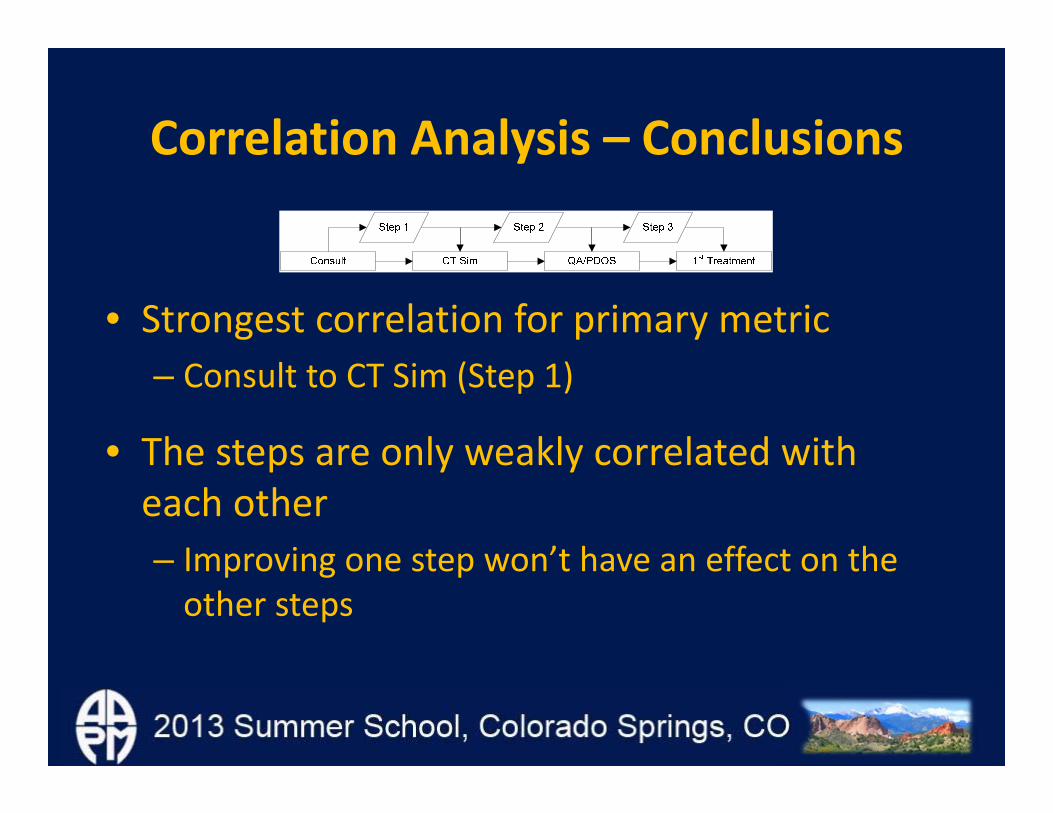
Correlation Analysis – Conclusions
• Strongest correlation for primary metric– Consult to CT Sim (Step 1)
• The steps are only weakly correlated with each other– Improving one step won’t have an effect on the other steps
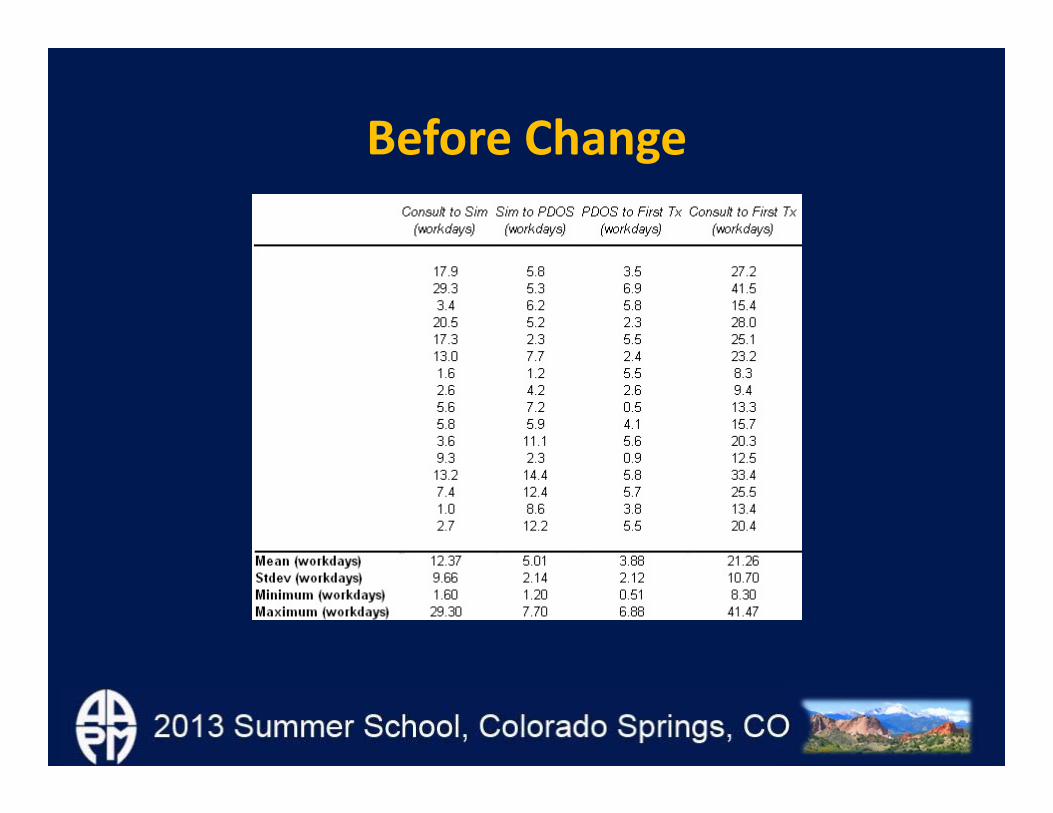
Before Change

Classifi-cation INPUTS (x's)
Input Spec / Settings PROCESS STEP OUTPUTS (y's)
Output Specs / Measurment Levels
(For all "C" & "K" Classifications)
(If applicable)
C
Process BlockStart Off Page
ConnectorRework
YES NO
Preparation or Data Delay
InventoryDecision
BlockData Entry
Warm up the oven before starts shift for 1 hour
Tune all process parameters at the oven
Oven starts with wire form dipping into silicone tank
Pre-heat wire form
Wire form dipping into plastisol tank
- Pre-Heat temp 600-700- Cycle time 65-80- Travel tank speed 20-35- Cure Temp 400-500- Dip time 12-17
Align Wire form
Wires in Good shape
Replace wires
C - Pre-Heat Temperature 600-700C - Thermocouples CalibratedN - Top Zone heaters 400-500C - Vents Open/Close
C - Silicone concentration 2.5-3.5 ratioC - Silicone recirculationN - Silicone TemperatureC - Silicone remove xx psi
C - Dip time 12-17K - Plastisol Temperat < 80 F C - Travelup tank speed 8-15 secK - Traveldown tank speed 25-35 sec N - Buil up surface N - Insulation from oven
Process Map: “To‐Be” Process
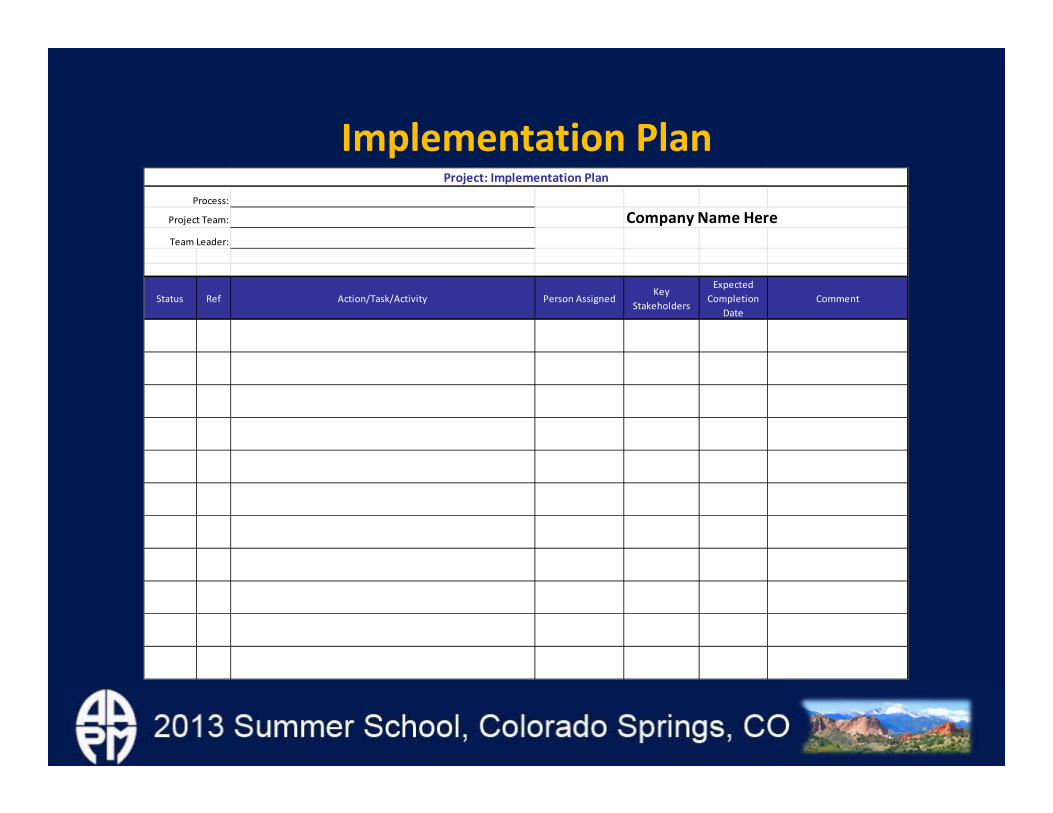
Implementation PlanProcess:
Project Team: Company Name HereTeam Leader:
Status Ref Action/Task/Activity Person AssignedKey
Stakeholders
Expected Completion
DateComment
Project: Implementation Plan
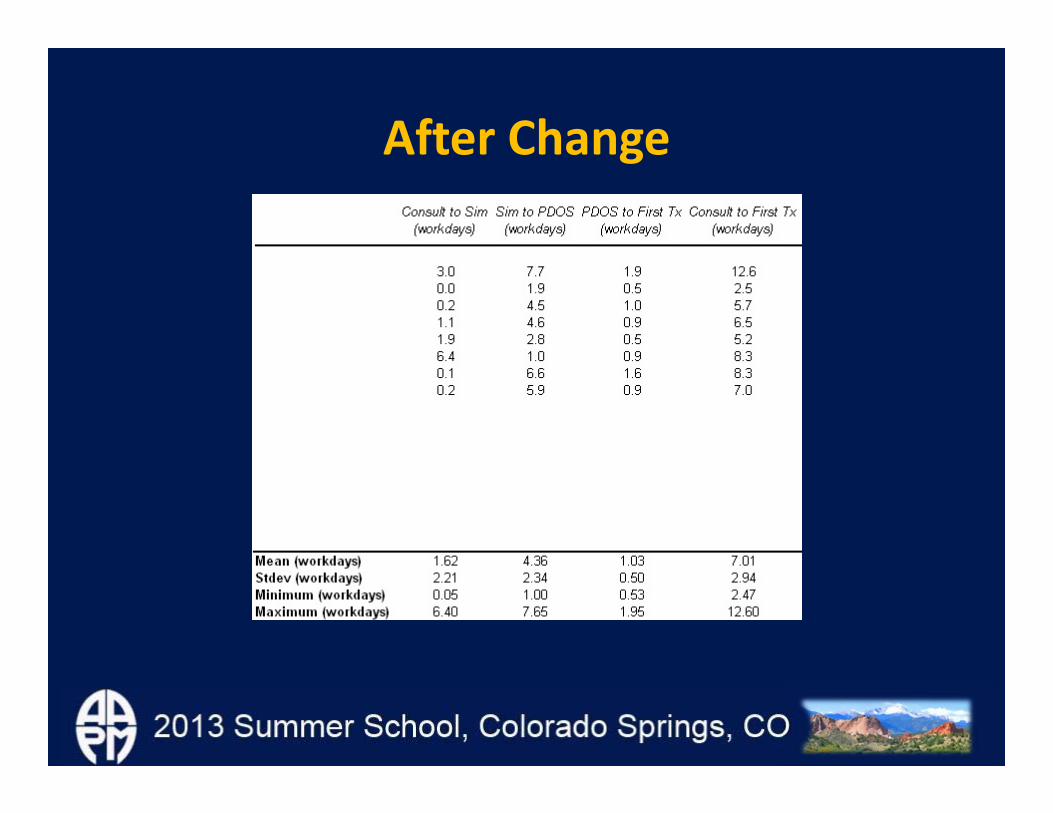
After Change

Cost Benefit AnalysisProcess:
Project Team:
Team Leader:
Description Unit Cost
-$
Description Unit Savings
-$
Projected Project Savings -$
Cost Benefit Analysis
Expected Costs
Benefits
Estimated Procurement Savings
Expected Costs
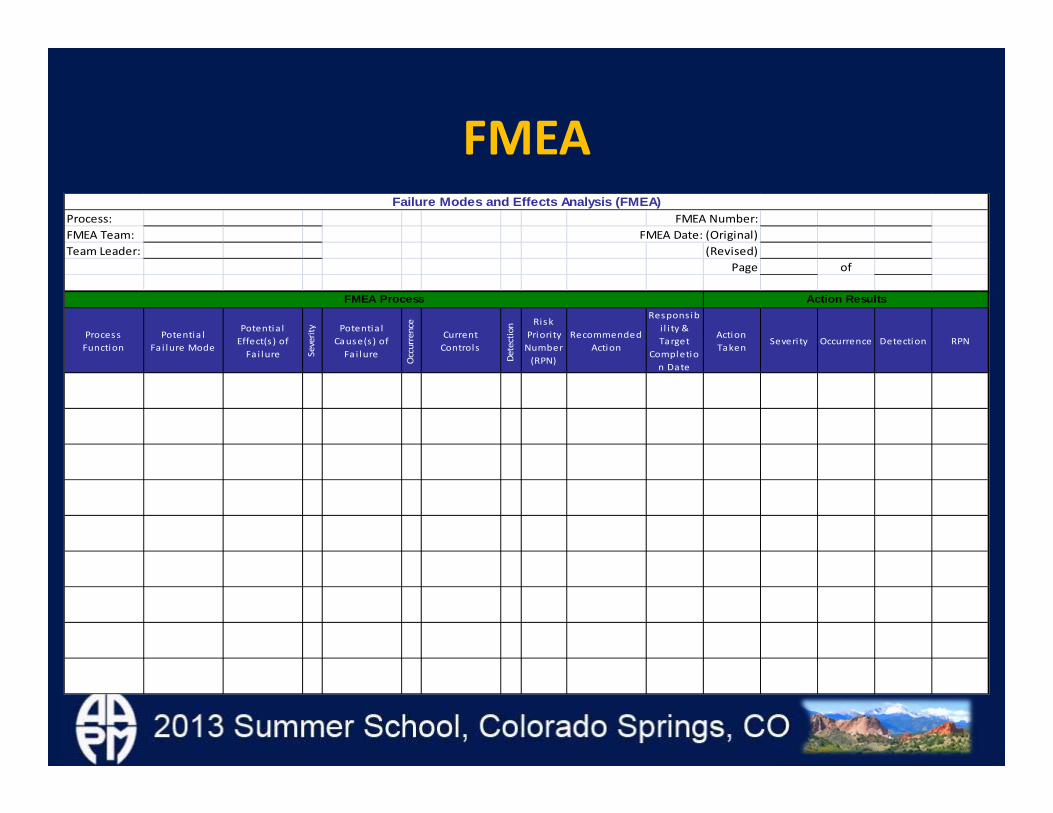
FMEAProcess: FMEA Number:FMEA Team: FMEA Date: (Original)Team Leader: (Revised)
Page of
Process Function
Potentia l Fai lure Mode
Potentia l Effect(s ) of Fai lure Se
verity Potentia l
Cause(s ) of Fa i lure
Occurrence
Current Controls
Detection Ri sk
Priori ty Number (RPN)
Recommended Action
Respons ibi l i ty & Target
Completion Date
ActionTaken
Severi ty Occurrence Detection RPN
Failure Modes and Effects Analysis (FMEA)
FMEA Process Action Results
Six Sigma – Project Scorecard
Develop a Project Charter with the Project Focus , Key Metrics , and Project Scope
Create a Process Map of the key process involving key personnel involved in the process .
Ana lyze process flow and identi fy waste
Priori ti ze potentia l solutions including cost benefi ts .
Create a Control Plan for solution
Form an improvement team including key s takeholders
Create a plan for col lecting data Determine sources of variation across process
Identi fy, eva luate, and select, best solution
Continue to monitor and s tabi l ze process us ing control charts
Va l idate problem s tatement and goals with s takeholders
Determine process performance / capabi l i ty
Ana lyze data col lected for trends, patterns , and relationships .
Develop, optimize and Implement pi lot solution
Develop SOP's and process maps for implemented solution
Create a communication plan with action i tems
Val idate the measurement sys tems
Perform root cause analys is and priori tize causes .
Develop "To Be" value s tream map
Trans ition project to process owner
Create a Value Stream Map of the selected process involving key personnel involved in the process .
Col lect data for "As ‐Is " processAna lyze two samples us ing Hypothes is Tests
Val idate pi lot solution for portentia l improvements with feedback from key s takeholders
Communicate project success & cha l lenges to create opportuni ties for sys tem wide adoption.
Develop a high level process map (SIPOC)
Analyze three or more samples us ing ANOVA
FMEA of potentia l fa i lures Faci l i ta te change management
Col lect basel ine data i f exis tsUnderstand relationships in two variables Correlation
Des ign of Experiments
Determine "Voice of Customer" as i t relates to the project
Determine relationships in variables using Regression
Review with Sponsor Review with Sponsor Review with Sponsor Review with Sponsor Review with Sponsor
Define Measure Analyze Improve Control
Verify VOC
Define Measure Analyze Improve Control
Charter
“as is” VSM
Validate prob.
Process map
Collect data
Data plan
RCA
Find variation
Regression
Prioritize
FMEA
“to be” VSM
DOE
ANOVA
Control charts
SOPs
Communicate
Communicate
Six Sigma Lessons Learned
• Requirements– Direct line of accountability to senior management
• Key to success– Need protected time for participants – Make use the guided problem solving
• Most difficult part– Data collection and analysis