Embed Size (px)
Citation preview

Colorado Department of Transportation
2017 Pavement Design Manual
427
PAVEMENT TYPE SELECTION AND LIFE CYCLE COST
ANALYSIS
13.1 Introduction
Some of the principal factors to be considered in choosing a pavement type are soil characteristics,
traffic volume and types, climate, life cycle costs, and construction considerations. All of the
above factors should be considered in any pavement design, whether it is for new construction or
rehabilitation.
Life cycle cost comparisons must be made between properly designed structural sections that
would be approved for construction. The various costs of the design alternatives over a selected
analysis period are the major consideration in selecting the preferred alternative. A Life Cycle
Cost Analysis (LCCA) includes costs of initial design and construction, future maintenance,
rehabilitation, and user costs. The Colorado Department of Transportation (CDOT) uses the
AASHTOWare™ DARWin™ M-E software program for designing flexible and rigid pavements.
Federal Highway Administration (FHWA) RealCost software is to be used for probabilistic LCCA.
It is imperative that careful attention be given to the calculations involved and the data used in the
calculations to ensure the most realistic and factual comparison between pavement types and
rehabilitation strategies.
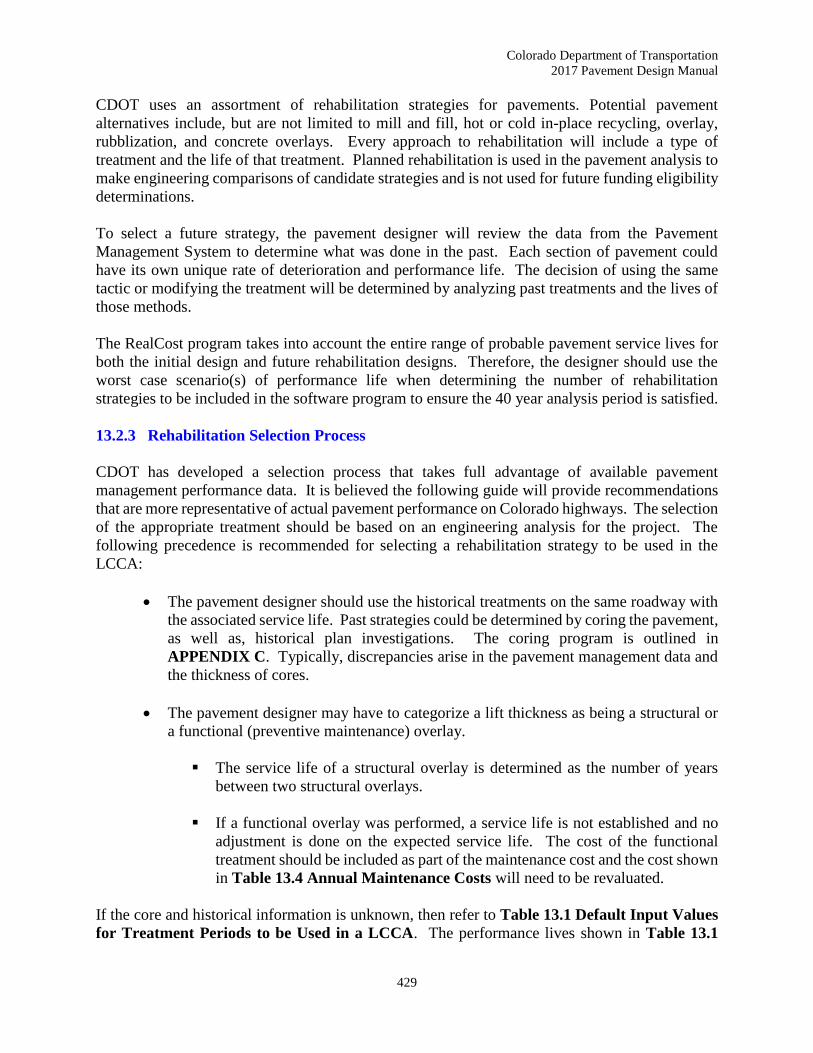
Several design variations are possible within each rehabilitation strategy. A suggested flowchart
illustrating the selection process for new pavement construction is shown in Figure 13.1
Pavement Selection Process Flow Chart.
Figure 13.1 Pavement Selection Process Flow Chart
YES
NO
YES
NO
Develop preliminary design for
typical section
Perform life cycle cost analysis of typical
sections. Is one type clearly superior?
(greater than 10%) Evaluate
secondary factors by
Pavement Type Selection
Committee (PTSC)
Select preliminary pavement
type
Select final pavement type and
applicable thickness
Is detailed design reasonably close to
typical section design used in the analysis?
Perform detailed
pavement design
Colorado Department of Transportation
2017 Pavement Design Manual
428
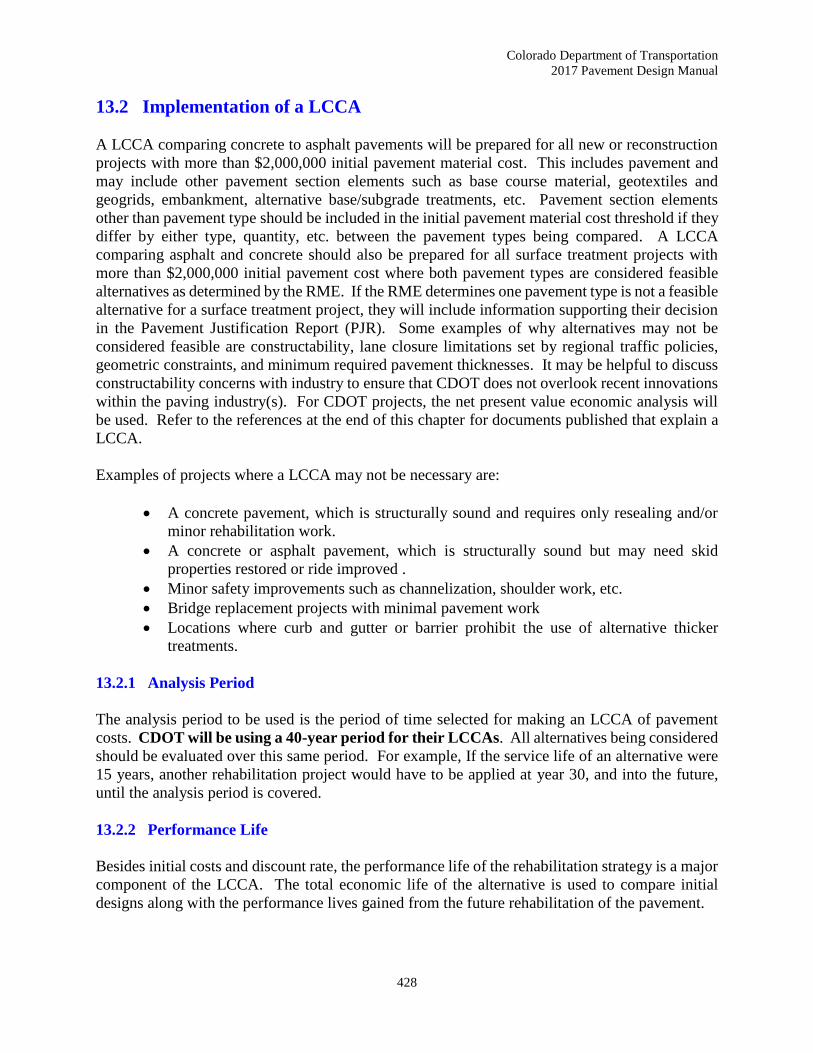
13.2 Implementation of a LCCA
A LCCA comparing concrete to asphalt pavements will be prepared for all new or reconstruction
projects with more than $2,000,000 initial pavement material cost. This includes pavement and
may include other pavement section elements such as base course material, geotextiles and
geogrids, embankment, alternative base/subgrade treatments, etc. Pavement section elements
other than pavement type should be included in the initial pavement material cost threshold if they
differ by either type, quantity, etc. between the pavement types being compared. A LCCA
comparing asphalt and concrete should also be prepared for all surface treatment projects with
more than $2,000,000 initial pavement cost where both pavement types are considered feasible
alternatives as determined by the RME. If the RME determines one pavement type is not a feasible
alternative for a surface treatment project, they will include information supporting their decision
in the Pavement Justification Report (PJR). Some examples of why alternatives may not be
considered feasible are constructability, lane closure limitations set by regional traffic policies,
geometric constraints, and minimum required pavement thicknesses. It may be helpful to discuss
constructability concerns with industry to ensure that CDOT does not overlook recent innovations
within the paving industry(s). For CDOT projects, the net present value economic analysis will
be used. Refer to the references at the end of this chapter for documents published that explain a
LCCA.
Examples of projects where a LCCA may not be necessary are:
A concrete pavement, which is structurally sound and requires only resealing and/or
minor rehabilitation work.
A concrete or asphalt pavement, which is structurally sound but may need skid
properties restored or ride improved .
Minor safety improvements such as channelization, shoulder work, etc.
Bridge replacement projects with minimal pavement work
Locations where curb and gutter or barrier prohibit the use of alternative thicker
treatments.
13.2.1 Analysis Period
The analysis period to be used is the period of time selected for making an LCCA of pavement
costs. CDOT will be using a 40-year period for their LCCAs. All alternatives being considered
should be evaluated over this same period. For example, If the service life of an alternative were
15 years, another rehabilitation project would have to be applied at year 30, and into the future,
until the analysis period is covered.
13.2.2 Performance Life
Besides initial costs and discount rate, the performance life of the rehabilitation strategy is a major
component of the LCCA. The total economic life of the alternative is used to compare initial
designs along with the performance lives gained from the future rehabilitation of the pavement.
Colorado Department of Transportation
2017 Pavement Design Manual
429
CDOT uses an assortment of rehabilitation strategies for pavements. Potential pavement
alternatives include, but are not limited to mill and fill, hot or cold in-place recycling, overlay,
rubblization, and concrete overlays. Every approach to rehabilitation will include a type of
treatment and the life of that treatment. Planned rehabilitation is used in the pavement analysis to
make engineering comparisons of candidate strategies and is not used for future funding eligibility
determinations.
To select a future strategy, the pavement designer will review the data from the Pavement
Management System to determine what was done in the past. Each section of pavement could
have its own unique rate of deterioration and performance life. The decision of using the same
tactic or modifying the treatment will be determined by analyzing past treatments and the lives of
those methods.
The RealCost program takes into account the entire range of probable pavement service lives for
both the initial design and future rehabilitation designs. Therefore, the designer should use the
worst case scenario(s) of performance life when determining the number of rehabilitation
strategies to be included in the software program to ensure the 40 year analysis period is satisfied.
13.2.3 Rehabilitation Selection Process
CDOT has developed a selection process that takes full advantage of available pavement
management performance data. It is believed the following guide will provide recommendations
that are more representative of actual pavement performance on Colorado highways. The selection
of the appropriate treatment should be based on an engineering analysis for the project. The
following precedence is recommended for selecting a rehabilitation strategy to be used in the
LCCA:
The pavement designer should use the historical treatments on the same roadway with
the associated service life. Past strategies could be determined by coring the pavement,
as well as, historical plan investigations. The coring program is outlined in
APPENDIX C. Typically, discrepancies arise in the pavement management data and
the thickness of cores.
The pavement designer may have to categorize a lift thickness as being a structural or
a functional (preventive maintenance) overlay.
The service life of a structural overlay is determined as the number of years
between two structural overlays.
If a functional overlay was performed, a service life is not established and no
adjustment is done on the expected service life. The cost of the functional
treatment should be included as part of the maintenance cost and the cost shown
in Table 13.4 Annual Maintenance Costs will need to be revaluated.
If the core and historical information is unknown, then refer to Table 13.1 Default Input Values
for Treatment Periods to be Used in a LCCA. The performance lives shown in Table 13.1
Colorado Department of Transportation
2017 Pavement Design Manual
430
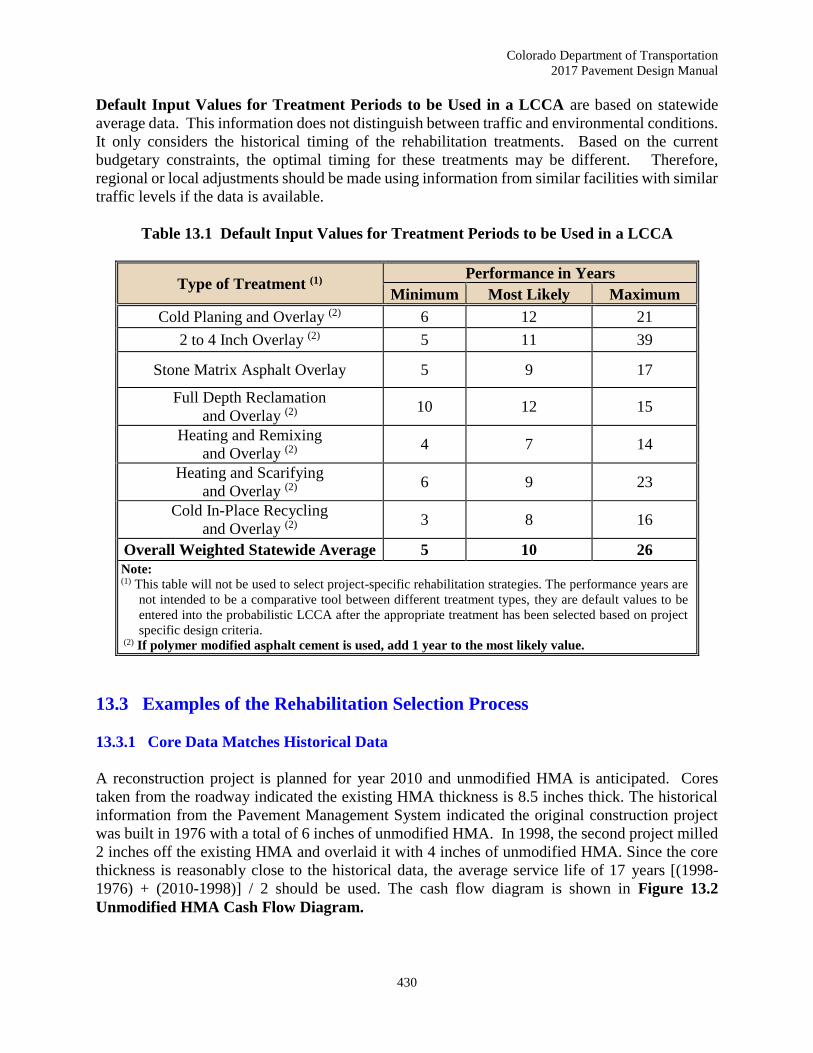
Default Input Values for Treatment Periods to be Used in a LCCA are based on statewide
average data. This information does not distinguish between traffic and environmental conditions.
It only considers the historical timing of the rehabilitation treatments. Based on the current
budgetary constraints, the optimal timing for these treatments may be different. Therefore,
regional or local adjustments should be made using information from similar facilities with similar
traffic levels if the data is available.
Table 13.1 Default Input Values for Treatment Periods to be Used in a LCCA
Type of Treatment (1) Performance in Years
Minimum Most Likely Maximum
Cold Planing and Overlay (2) 6 12 21
2 to 4 Inch Overlay (2) 5 11 39
Stone Matrix Asphalt Overlay 5 9 17
Full Depth Reclamation
and Overlay (2) 10 12 15
Heating and Remixing
and Overlay (2) 4 7 14
Heating and Scarifying
and Overlay (2) 6 9 23
Cold In-Place Recycling
and Overlay (2) 3 8 16
Overall Weighted Statewide Average 5 10 26
Note: (1) This table will not be used to select project-specific rehabilitation strategies. The performance years are
not intended to be a comparative tool between different treatment types, they are default values to be
entered into the probabilistic LCCA after the appropriate treatment has been selected based on project
specific design criteria. (2) If polymer modified asphalt cement is used, add 1 year to the most likely value.
13.3 Examples of the Rehabilitation Selection Process
13.3.1 Core Data Matches Historical Data
A reconstruction project is planned for year 2010 and unmodified HMA is anticipated. Cores
taken from the roadway indicated the existing HMA thickness is 8.5 inches thick. The historical
information from the Pavement Management System indicated the original construction project
was built in 1976 with a total of 6 inches of unmodified HMA. In 1998, the second project milled
2 inches off the existing HMA and overlaid it with 4 inches of unmodified HMA. Since the core
thickness is reasonably close to the historical data, the average service life of 17 years [(1998-
1976) + (2010-1998)] / 2 should be used. The cash flow diagram is shown in Figure 13.2
Unmodified HMA Cash Flow Diagram.

Colorado Department of Transportation
2017 Pavement Design Manual
431
Figure 13.2 Unmodified HMA Cash Flow Diagram
13.3.2 No Core Data and No Historical Data
A reconstruction project is planned for year 2010 and modified HMA is anticipated. Discernable
lifts of HMA could not be found in the roadway cores and no historical information is available
for this area. Since a curb and gutter will be constructed, future rehabilitation work will require
cold planing and overlays. Based on Table 13.1 Default Input Values for Treatment Periods to
be Used in a LCCA, the most likely life expectancy for this rehabilitation strategy is 13 years (12
+ 1 year for modified HMA). The cash flow diagram is shown in Figure 13.3 Cold Plaining and
Overlay with Polymer Modified HMA Cash Flow Diagram.
Figure 13.3 Cold Plaining and Overlay with Polymer Modified HMA Cash Flow Diagram
Colorado Department of Transportation
2017 Pavement Design Manual
432
13.3.3 Portland Cement Concrete Pavement
The LCCA of a PCCP may be analyzed with either a 20 or 30-year initial design period and a 40
year analysis period. Note: The designer should add ¼ inch to thickness for future diamond
grinding.
Rehabilitation: When available, the designer should use regional or local performance data of
similar facilities and traffic levels. If no local data is available, the default years to the first
rehabilitation cycle for PCCP is a triangular distribution with a minimum value of 16 years
the most likely value of 27 years and the maximum value of 40 years. This information is
based on statewide average data. It does not distinguish between traffic levels or environmental
conditions, it only considers the historical timing. Due to budgetary constraint, the optimal timing
may be different. Therefore, these values should only be used in the absence of any other
information.
PCCP with dowel and tie bars will require ½ percent slab replacement in the travel
lanes, full width diamond grinding with longitudinal, and transverse joint resealing.
PCCP without dowel or tie bars will require 1 percent slab replacement in the travel
lanes, full width diamond grinding with longitudinal and transverse joint resealing.
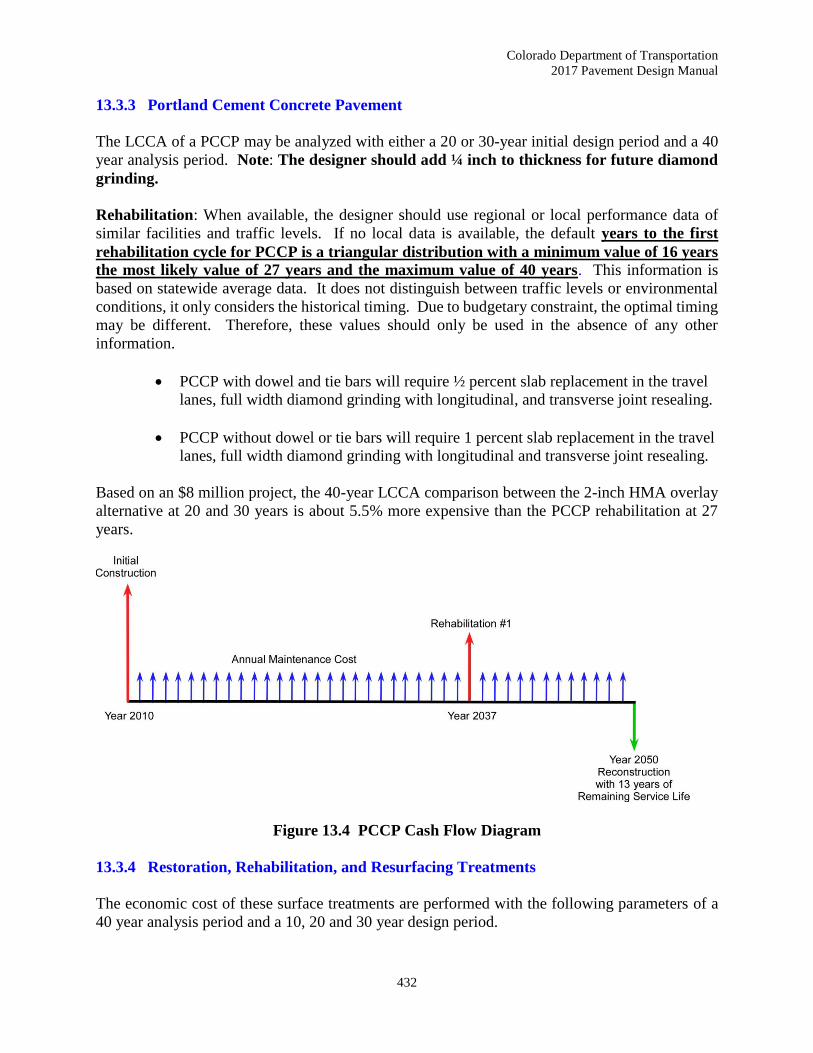
Based on an $8 million project, the 40-year LCCA comparison between the 2-inch HMA overlay
alternative at 20 and 30 years is about 5.5% more expensive than the PCCP rehabilitation at 27
years.
Figure 13.4 PCCP Cash Flow Diagram
13.3.4 Restoration, Rehabilitation, and Resurfacing Treatments
The economic cost of these surface treatments are performed with the following parameters of a
40 year analysis period and a 10, 20 and 30 year design period.
Colorado Department of Transportation
2017 Pavement Design Manual
433
13.4 Discount Rate
All future costs are adjusted according to a discount rate prorated to a present worth. Costs
incurred at any time into the future can be combined with initial construction costs to give a total
cost over the life cycle. See Table 13.2 Present Worth Factors for Discount Rates for a uniform
series of deposits, Sn. The current discount rate is 2.22 percent with a standard deviation 0.38
percent (6).
The discount rate and standard deviation will be calculated annually. If the new 10-year average
discount rate varies by more than two standard deviations from the original discount rate used at
the time of the design, in this case 0.75 percent resulting in a discount rate range of 1.47 to 2.97
percent, a new LCCA should be performed. Thus, all projects that have been shelved prior to 2011
and/or not been awarded should have a new LCCA performed. The designer is responsible for
checking previous pavement designs to ensure an appropriate discount rate was used and the
pavement choice is still valid.
The discounting factors are listed in Table 13.3 Discount Factors for Discrete Compounding in
symbolic and formula form and a brief interpretation of the notation. Normally, it will not be
necessary to calculate factors from these formulas. For intermediate values, computing the factors
from the formulas may be necessary, or linear interpolation can be used as an approximation.
The single payment present worth P = F(P/F, i %, n) notation is interpreted as, “Find P, given F,
using an interest rate of i % over n years”. Thus, an annuity is a series of equal payments, A, made
over a period of time. In the case of an annuity that starts at the end of the first year and continues
for n years, the purchase price, P, would be P = A × (P/A, i %, n). See Table 13.2 Present Worth
Factors for Discount Rates.

Colorado Department of Transportation
2017 Pavement Design Manual
434
Table 13.2 Present Worth Factors for Discount Rates
n
(years)
Discount Rate
2.22%
PWFn Sn
5 0.8960 4.6835
6 0.8766 5.5601
7 0.8575 6.4176
8 0.8389 7.2565
9 0.8207 8.0772
10 0.8029 8.8801
11 0.7854 9.6655
12 0.7684 10.4339
13 0.7517 11.1855
14 0.7354 11.9209
15 0.7194 12.6403
16 0.7038 13.3440
17 0.6885 14/0325
18 0.6735 14.7060
19 0.6589 15.3649
20 0.6446 16.0095
21 0.6306 16.6401
22 0.6169 17.2570
23 0.6035 17.8605
24 0.5904 18.4509
25 0.5776 19.0285
30 0.5175 21.7335
35 0.4637 25.1573
40 0.4155 26.3291
Note: PWFn = present worth factor
Sn = uniform series of deposits

Colorado Department of Transportation
2017 Pavement Design Manual
435
Table 13.3 Discount Factors for Discrete Compounding
Factor Name Converts Symbol Formula Interpretation of
Notation
Single
Payment
Present Worth
F to P (future single payment
to present worth)
(P/F, i%, n)
(1 + 𝑖)−𝑛
Find P, given F, using
an interest rate of i%
over n years
Uniform
Series Present
Worth
A to P (annual payment to
present worth)
(P/A, i%, n)
(1 + 𝑖)𝑛 − 1
𝑖(1 + 𝑖)𝑛
Find P, given A,
using an interest rate
of i% over n years
Note: P = the single payment present worth; F = future single payment; i % = the interest rate percent, and n
= number of years.
13.5 Life Cycle Cost Factors
Cost factors are values associated with the LCCA which cover the full cycle from initial design to
the end of the analysis period. Any item that impacts the initial cost should be analyzed, as well
as, a determination made as to whether it should be included in the cost analysis. Such items would
include shoulder construction, major utility considerations, mobilization, temporary access, traffic
crossovers, etc. Some of the factors the designer should consider are described in the following
sections.
13.5.1 Initial Construction Costs
Pavement construction costs are the expenses incurred to build a section of pavement in accordance
with plans and specifications. The pavement construction cost is one of the most important factors
in the LCCA and should be as accurate as possible. Initial cost of PCCP and HMA should be
based on the best available information. The current version of CDOT’s Cost Data Manual should
be used unless up-to-date bid prices are available for similar work in the same general area. The
designer should take into consideration project specific information, such as special mixes, fast
track mixes, pavement constructability, special binders, construction phasing, project location, and
other pertinent information. These project details may alter the unit costs shown in the figures.
The designer should exercise good judgment in the application of the PCCP and HMA unit costs.
If there is a wide range of prices for a certain item, it is best to run a sensitivity analysis to determine
the effect of cost variation on the end result. Computing the initial cost of a design alternative
involves not only the material quantity calculations, but also the other direct costs associated with
the pavement alternative being considered. Difference in grading quantities required by different
pavement alternatives should be considered where appropriate. For example, the comparison of a
thick overlay alternative versus a removal and replacement alternative should include the required
shoulder quantity for the overlay. If traffic control costs vary from one alternative to another, the
cost should be estimated and included as an initial cost. The different construction techniques,
curing time, and duration of lane closures associated with PCCP or HMA have a significant impact
on the user costs. For example, a HMA overlay could involve the closure of one lane of traffic at
a time, while a concrete pavement overlay might necessitate complete roadway closure and
construction detours. This will impact traffic control and user costs. The designer should utilize
Colorado Department of Transportation
2017 Pavement Design Manual
436
the resources of the Engineering Estimates Unit as necessary to supplement information used in
the calculation of the unit cost. The supporting information and any worksheets for the unit cost
should be included in the Pavement Justification Report.
13.5.2 Asphalt Cement Adjustment
Included in the unit cost of HMA should be an adjustment for the Force Account Item. This item
revises the Contactor’s bid price of HMA found in the Cost Data book based on the price of crude
oil at the time of construction. The data varies from year to year, Region to Region, and by the
various binders used by CDOT. In 2009, the average was an increase of $3.30 per ton of HMA.
In 2013, the average was an increase of $4.24. The weighted average of over 8.9 million tons of
HMA is an increase of $0.67 per ton. Therefore, we recommend a triangular distribution with the
minimum value of -$2.56, a most likely value of $0.67 and a maximum value of $4.24 per ton of
mix. The unit cost modification is based on data from projects that were awarded from 01/01/2009
through 12/31/2015.
13.5.3 Maintenance Cost
The designer should exercise good judgment in the application of maintenance costs.
Inappropriate selection can adversely influence the selection of alternatives to be constructed.
Maintenance costs should be based on the best available information. The CDOT Maintenance
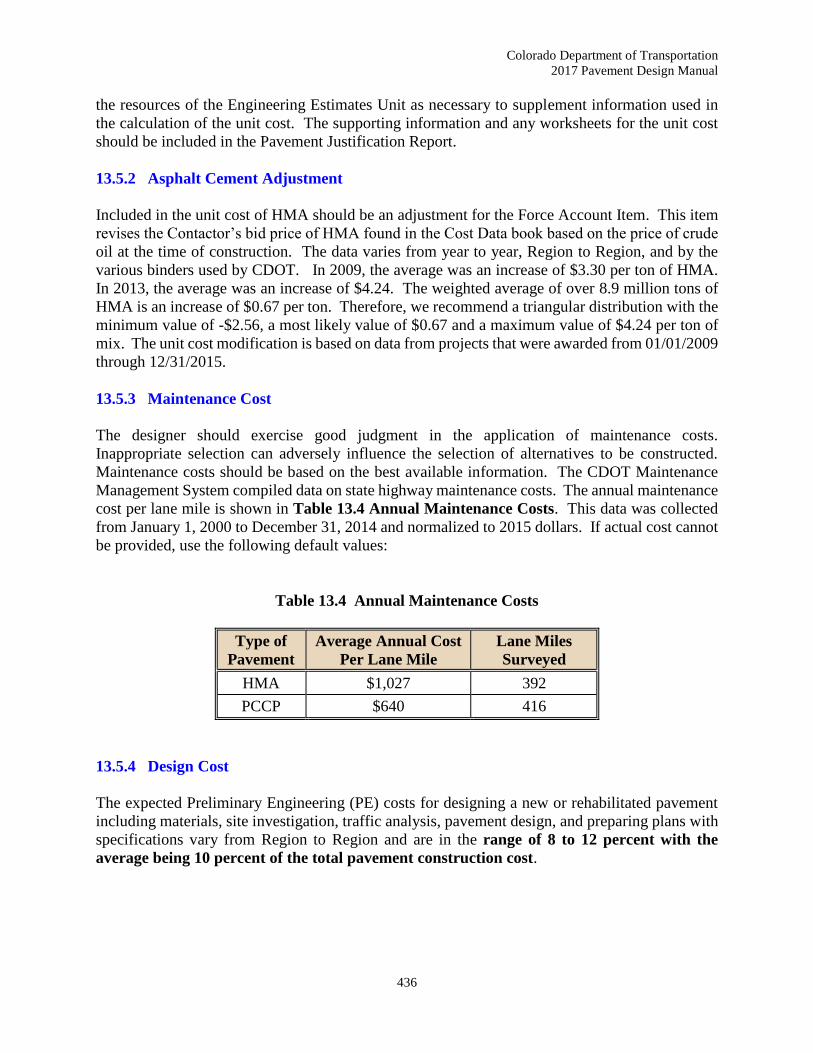
Management System compiled data on state highway maintenance costs. The annual maintenance
cost per lane mile is shown in Table 13.4 Annual Maintenance Costs. This data was collected
from January 1, 2000 to December 31, 2014 and normalized to 2015 dollars. If actual cost cannot
be provided, use the following default values:
Table 13.4 Annual Maintenance Costs
Type of
Pavement
Average Annual Cost
Per Lane Mile
Lane Miles
Surveyed
HMA $1,027 392
PCCP $640 416
13.5.4 Design Cost
The expected Preliminary Engineering (PE) costs for designing a new or rehabilitated pavement
including materials, site investigation, traffic analysis, pavement design, and preparing plans with
specifications vary from Region to Region and are in the range of 8 to 12 percent with the
average being 10 percent of the total pavement construction cost.

Colorado Department of Transportation
2017 Pavement Design Manual
437
13.5.5 Pavement Construction Engineering Costs
Included in the pavement construction cost should be the Cost of Engineering (CE). The CE and
indirect costs can be found at the Site Manager Construction website.
13.5.6 Traffic Control Costs
Traffic control costs is the cost to place and maintain signs, signals, and markings and devices
placed on the roadway to regulate, warn, or guide traffic. Traffic control costs vary from Region
to Region and from day to night. The range is from 10 to 18 percent with the average being 15
percent of the total pavement construction cost. In some designs, the construction traffic
control costs may be the same for both alternatives and excluded from the LCCA.
13.5.7 Serviceable Life
The serviceable life represents the value of an investment alternative at the end of the analysis
period. The method CDOT uses to account for serviceable life is prorated based on the cost of the
final rehabilitation activity, design life of the rehabilitation strategy, and the time since the last
rehabilitation. For example, over a 40-year analysis, Alternative A requires a 10-year design life
rehabilitation to be placed at year 31. In this case, Alternative A will have 1 year of serviceable
life remaining at the end of the analysis (40-31=9 years of design life consumed and 10-9=1 year
of serviceable life). The serviceable life is 1/10 of the rehabilitation cost, as shown in equation
Eq. 13.1.
SL = (1 - (LA/LE)) * C Eq. 13.1
Where:
SL = serviceable life
LA = the portion of the design life consumed
LE = the design life of the rehabilitation
C = the cost of the rehabilitation
13.5.8 User Costs
These costs are considered to be indirect “soft” costs accumulated by the facility user in the work
zone as they relate to roadway condition, maintenance activity, and rehabilitation work over the
analysis period. These costs include user travel time, increased vehicle operating costs (VOC),
and crashes. Though these “soft” costs are not part of the actual spending for CDOT, they are
costs borne by the road user and should be included in the LCCA. Due to the lack of crash cost
data for certain types of work zone activities, CDOT will not consider the costs due to crashes.
Colorado Department of Transportation
2017 Pavement Design Manual
438
User Cost Program
13.5.8.1 Introduction
The User Cost website is a tool used to calculate the user cost associated with work zones for a
LCCA. The program allows the engineer to start a new file or import a file from a previous edition
of the program. Updates from the previous version include new cost data, pilot car operations, a
larger number of types of work, cross over alternative, and printing capabilities.
13.5.8.2 Using the User Cost Software
Project Data
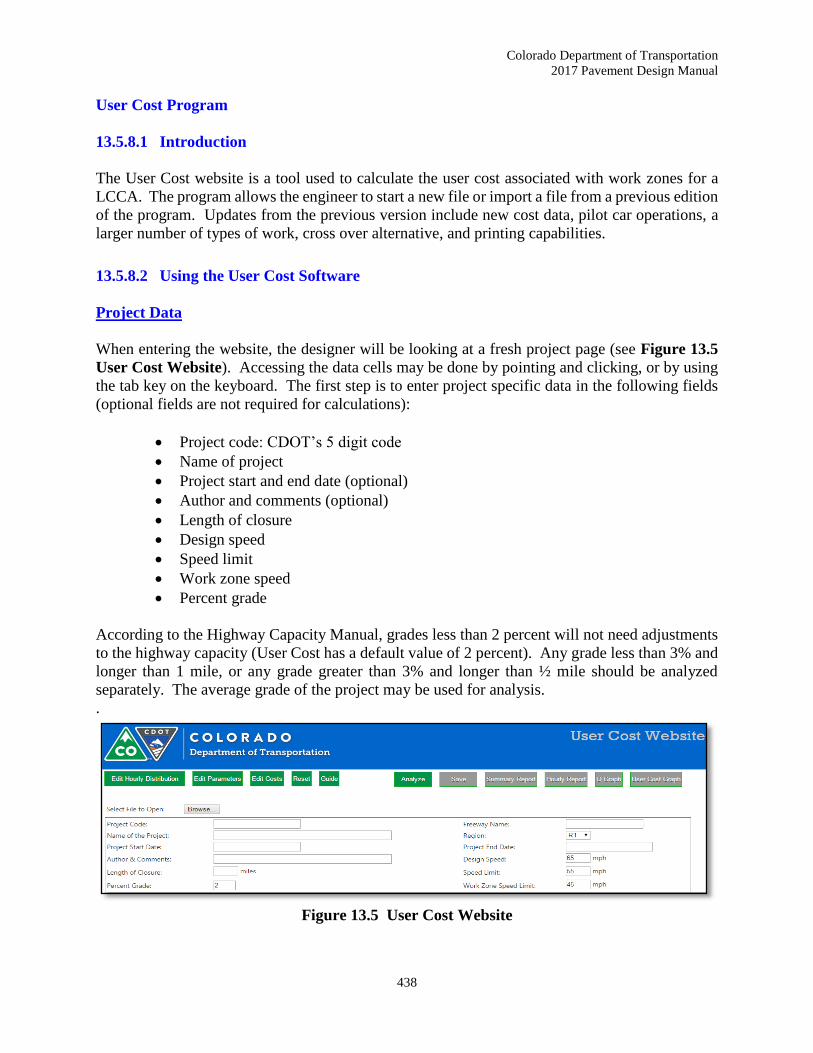
When entering the website, the designer will be looking at a fresh project page (see Figure 13.5
User Cost Website). Accessing the data cells may be done by pointing and clicking, or by using
the tab key on the keyboard. The first step is to enter project specific data in the following fields
(optional fields are not required for calculations):
Project code: CDOT’s 5 digit code
Name of project
Project start and end date (optional)
Author and comments (optional)
Length of closure
Design speed
Speed limit
Work zone speed
Percent grade
According to the Highway Capacity Manual, grades less than 2 percent will not need adjustments
to the highway capacity (User Cost has a default value of 2 percent). Any grade less than 3% and
longer than 1 mile, or any grade greater than 3% and longer than ½ mile should be analyzed
separately. The average grade of the project may be used for analysis.
.
Figure 13.5 User Cost Website
Colorado Department of Transportation
2017 Pavement Design Manual
439
Lane Closures
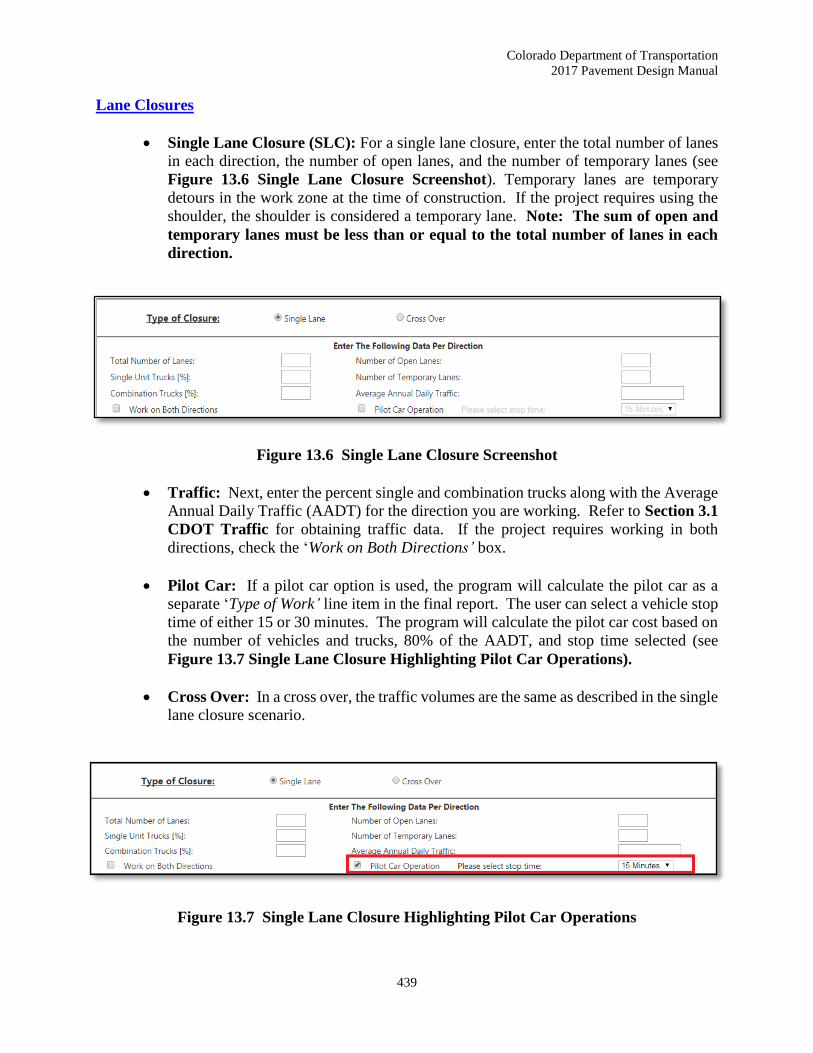
Single Lane Closure (SLC): For a single lane closure, enter the total number of lanes
in each direction, the number of open lanes, and the number of temporary lanes (see
Figure 13.6 Single Lane Closure Screenshot). Temporary lanes are temporary
detours in the work zone at the time of construction. If the project requires using the
shoulder, the shoulder is considered a temporary lane. Note: The sum of open and
temporary lanes must be less than or equal to the total number of lanes in each
direction.
Figure 13.6 Single Lane Closure Screenshot
Traffic: Next, enter the percent single and combination trucks along with the Average
Annual Daily Traffic (AADT) for the direction you are working. Refer to Section 3.1
CDOT Traffic for obtaining traffic data. If the project requires working in both
directions, check the ‘Work on Both Directions’ box.
Pilot Car: If a pilot car option is used, the program will calculate the pilot car as a
separate ‘Type of Work’ line item in the final report. The user can select a vehicle stop
time of either 15 or 30 minutes. The program will calculate the pilot car cost based on
the number of vehicles and trucks, 80% of the AADT, and stop time selected (see
Figure 13.7 Single Lane Closure Highlighting Pilot Car Operations).
Cross Over: In a cross over, the traffic volumes are the same as described in the single
lane closure scenario.
Figure 13.7 Single Lane Closure Highlighting Pilot Car Operations

Colorado Department of Transportation
2017 Pavement Design Manual
440
Example: I-70, a divided 4-lane interstate (2 primary lanes and 2 secondary
lanes) will be reconstructed using a cross over. The phasing is such that the
secondary direction is closed first (see Figure 13.8 Example of Input for a
Cross Over). The input is as follows:
Secondary Direction Total Number of Lanes = 2
Number of Open Lanes = 1
Number of Temporary Lanes = 0
Primary Direction Total Number of Lanes = 2
Number of Open Lanes = 1
Number of Temporary Lanes = 0
Figure 13.8 Example of Input for a Cross Over
Type of Work
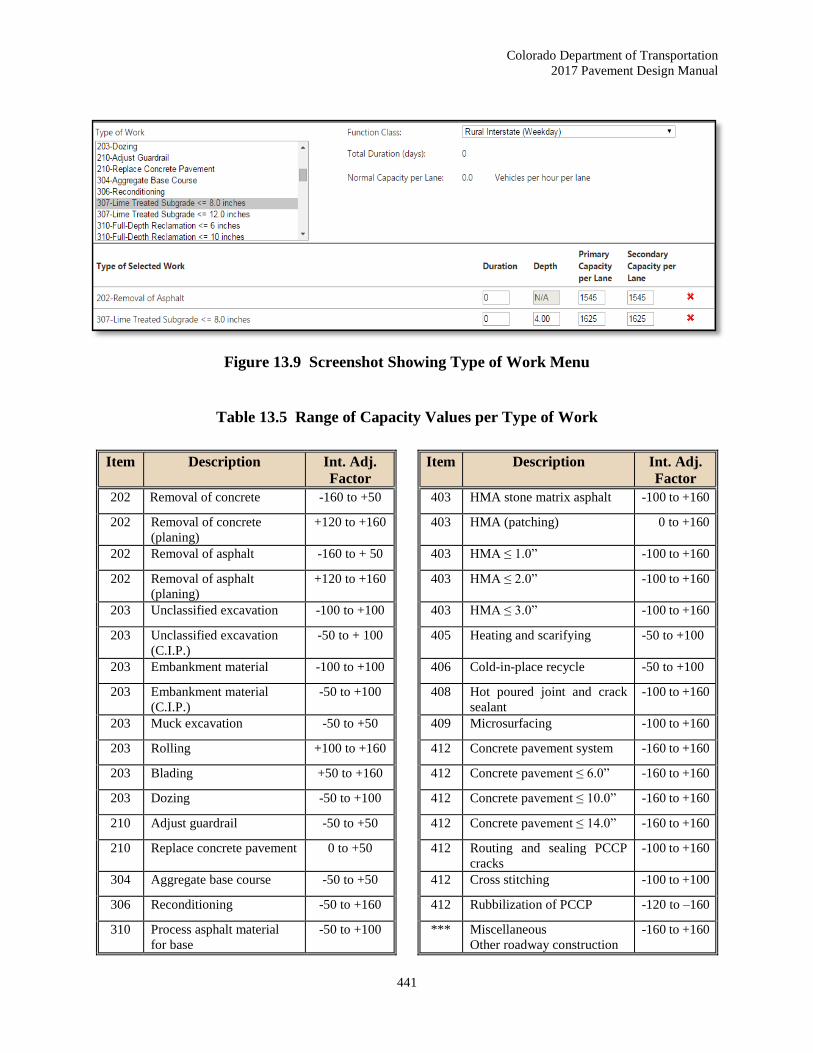
The program has a list of 52 different types of work that may be selected for a project (see Figure
13.9 Screenshot Showing Type of Work Menu). To select a ‘Type of Work’ from the list, point
and single click on the item. To view additional items, use the arrows located on the right side of
the menu to scroll down the list. Once you point and click on an item, the type of work moves
into the ‘Type of Selected Work’ area. To remove an item after it has been selected, single click
on the red ‘X’ to the right of the line item. It is suggested to pick the major item of the work to be
constructed followed by minor work items and not to have more than five items selected. The
program will allow one to select up to 25 types of work.
Once a ‘Type of Work’ is selected, default values assigned to each item for calculating the duration
of the work and the lane capacity will be used for calculations. If project specifics require a
different duration or capacity, click the box for ‘Duration, Depth, or Capacity’ and type a new
value.
Note: The capacity adjustment factor has a set default value based on data from the Highway
Capacity Manual, thus, if you have equipment in close proximity to the travelling public, you
should input a value lower than the default value. Table 13.5 Range of Capacity Values per
Type of Work shows the range in capacity that one may use to modify a particular type of
construction or activity.
Colorado Department of Transportation
2017 Pavement Design Manual
441
Figure 13.9 Screenshot Showing Type of Work Menu
Table 13.5 Range of Capacity Values per Type of Work
Item Description Int. Adj.
Factor Item Description Int. Adj.
Factor
202 Removal of concrete -160 to +50
403 HMA stone matrix asphalt -100 to +160
202 Removal of concrete
(planing)
+120 to +160
403 HMA (patching) 0 to +160
202 Removal of asphalt -160 to + 50
403 HMA ≤ 1.0” -100 to +160
202 Removal of asphalt
(planing)
+120 to +160
403 HMA ≤ 2.0” -100 to +160
203 Unclassified excavation -100 to +100
403 HMA ≤ 3.0” -100 to +160
203 Unclassified excavation
(C.I.P.)
-50 to + 100
405 Heating and scarifying -50 to +100
203 Embankment material -100 to +100
406 Cold-in-place recycle -50 to +100
203 Embankment material
(C.I.P.)
-50 to +100
408 Hot poured joint and crack
sealant
-100 to +160
203 Muck excavation -50 to +50
409 Microsurfacing -100 to +160
203 Rolling +100 to +160
412 Concrete pavement system -160 to +160
203 Blading +50 to +160
412 Concrete pavement ≤ 6.0” -160 to +160
203 Dozing -50 to +100
412 Concrete pavement ≤ 10.0” -160 to +160
210 Adjust guardrail -50 to +50
412 Concrete pavement ≤ 14.0” -160 to +160
210 Replace concrete pavement 0 to +50
412 Routing and sealing PCCP
cracks
-100 to +160
304 Aggregate base course -50 to +50
412 Cross stitching -100 to +100
306 Reconditioning -50 to +160
412 Rubbilization of PCCP -120 to –160
310 Process asphalt material
for base
-50 to +100
*** Miscellaneous
Other roadway construction
-160 to +160
Colorado Department of Transportation
2017 Pavement Design Manual
442
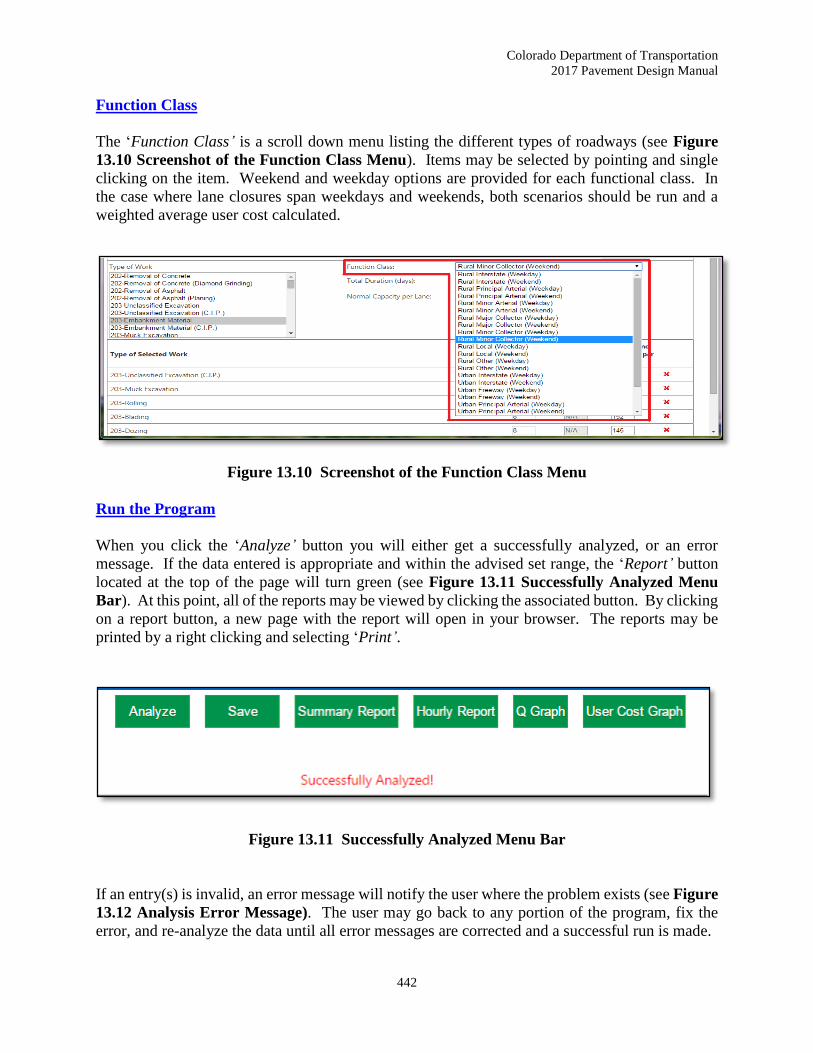
Function Class
The ‘Function Class’ is a scroll down menu listing the different types of roadways (see Figure
13.10 Screenshot of the Function Class Menu). Items may be selected by pointing and single
clicking on the item. Weekend and weekday options are provided for each functional class. In
the case where lane closures span weekdays and weekends, both scenarios should be run and a
weighted average user cost calculated.
Figure 13.10 Screenshot of the Function Class Menu
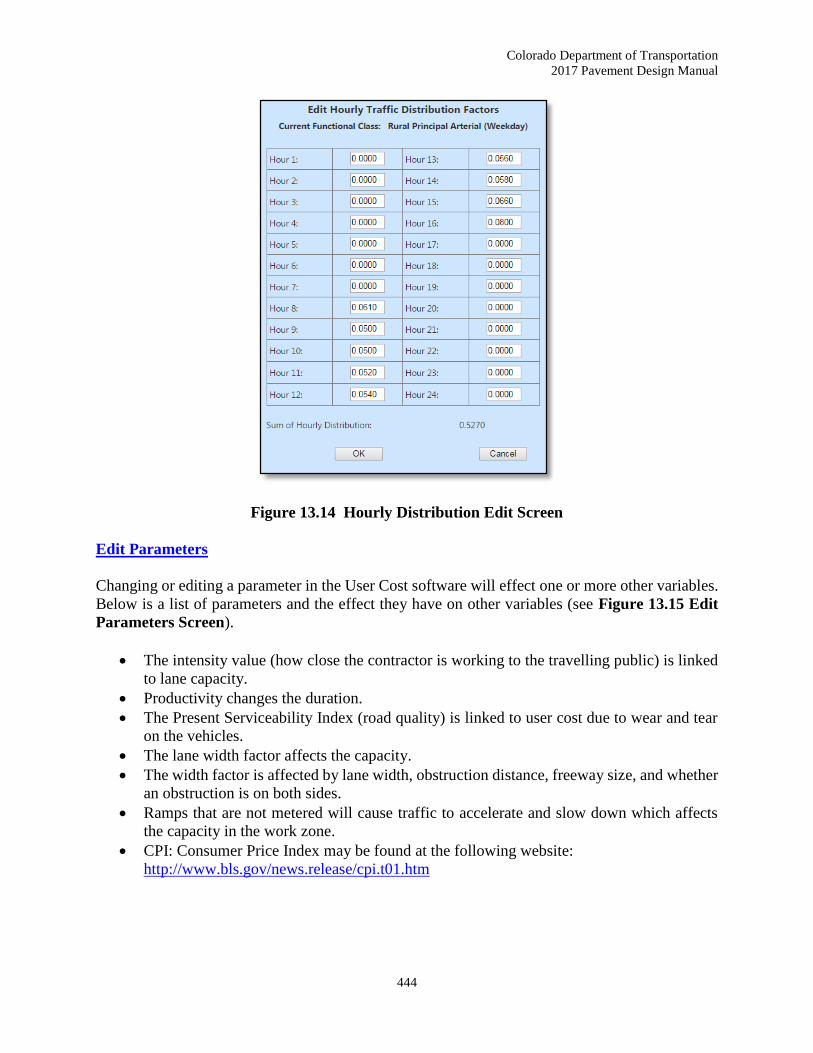
Run the Program
When you click the ‘Analyze’ button you will either get a successfully analyzed, or an error
message. If the data entered is appropriate and within the advised set range, the ‘Report’ button
located at the top of the page will turn green (see Figure 13.11 Successfully Analyzed Menu
Bar). At this point, all of the reports may be viewed by clicking the associated button. By clicking
on a report button, a new page with the report will open in your browser. The reports may be
printed by a right clicking and selecting ‘Print’.
Figure 13.11 Successfully Analyzed Menu Bar
If an entry(s) is invalid, an error message will notify the user where the problem exists (see Figure
13.12 Analysis Error Message). The user may go back to any portion of the program, fix the
error, and re-analyze the data until all error messages are corrected and a successful run is made.

Colorado Department of Transportation
2017 Pavement Design Manual
443
Figure 13.12 Analysis Error Message
Editing Default Inputs
Buttons that will allow you to customize construction information and parameters are available on
the left side of the top row (see Figure 13.13 Editing Input Buttons). Note: If any information
or parameters are changed, one must save them by selecting ‘OK’ to close the edit; if you click on
‘Cancel’ to close the box, it will not save any changes.
Figure 13.13 Editing Input Buttons
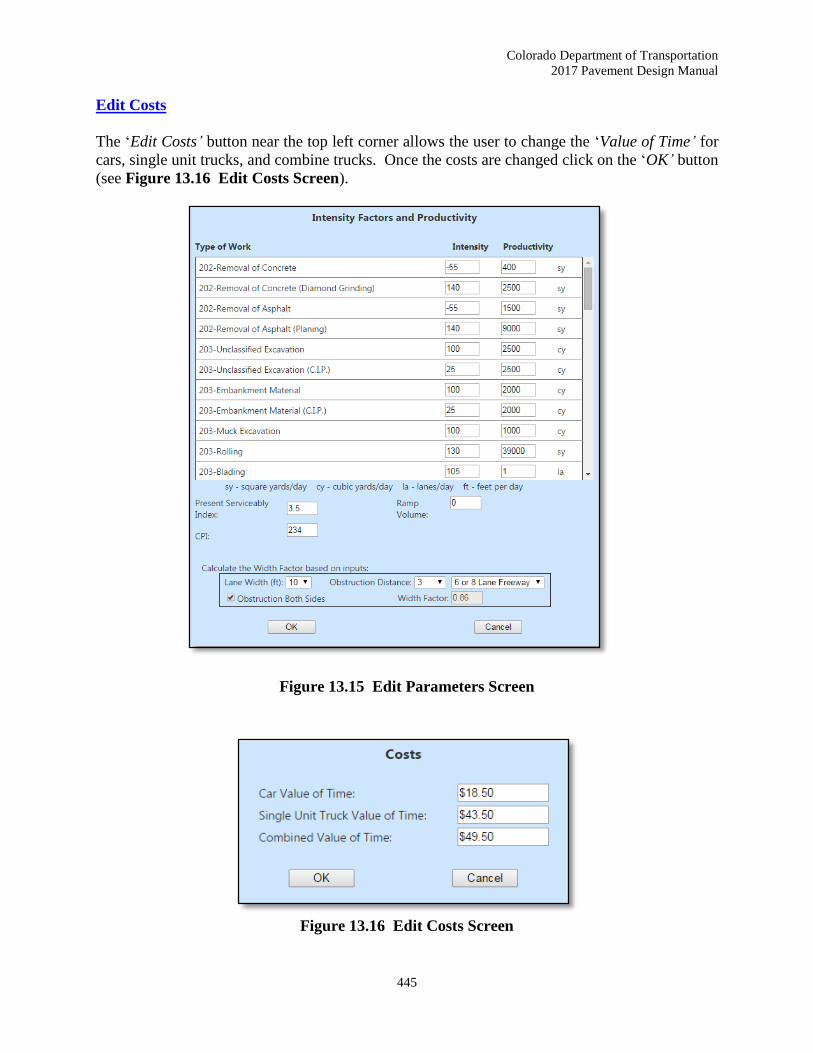
Edit Hourly Distribution
This screen allows you to change the hourly traffic distribution values for your project. Staff traffic
has an internal web site (http://internal/App_DTD_DataAccess/index.cfm with a tab for traffic
counts), however not all traffic data is available in all areas of the state at this time. The total sum
of distribution factors cannot exceed 1.0 (see Figure 13.14 Hourly Distribution Edit Screen).
Note: A queue greater than 5 miles or a delay greater than ½ hour should not be allowed to form.
The program calculates the user cost when a work zone is in place. For example, if the contractor
only works from 9:00 a.m. to 5:00 p.m. on a single lane closure, then all the hourly traffic
distribution values outside the working time should be changed to zero (0).
Colorado Department of Transportation
2017 Pavement Design Manual
444
Figure 13.14 Hourly Distribution Edit Screen
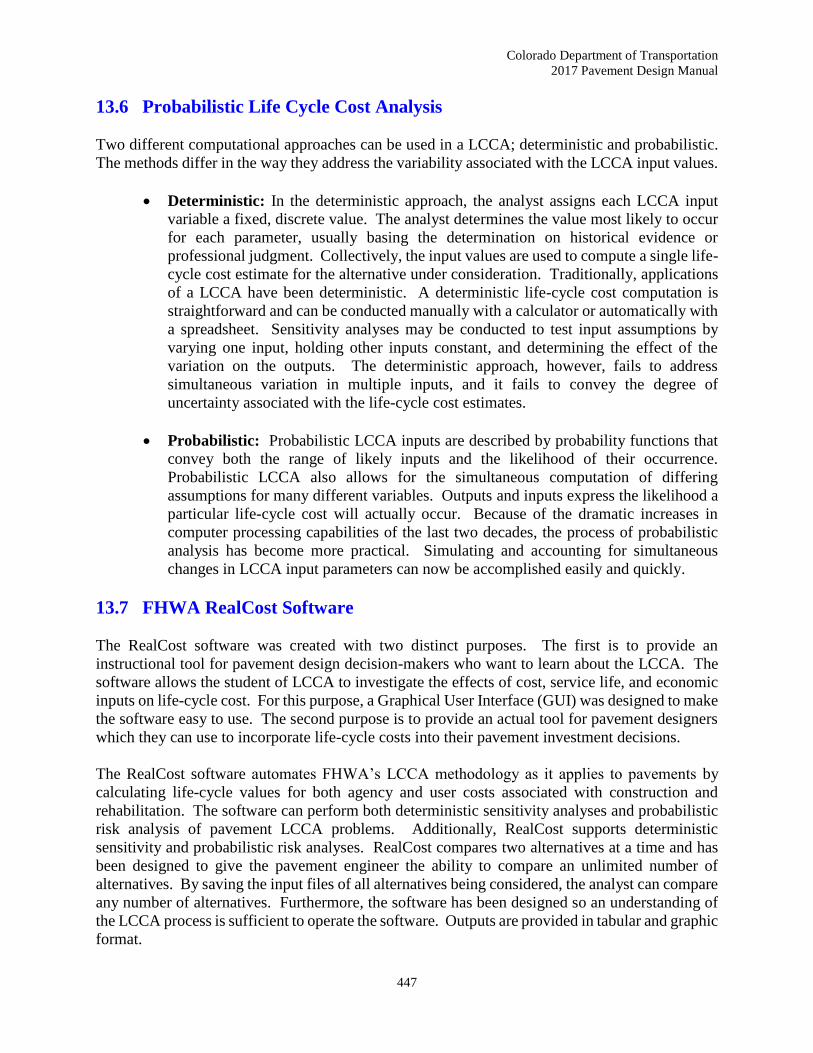
Edit Parameters
Changing or editing a parameter in the User Cost software will effect one or more other variables.
Below is a list of parameters and the effect they have on other variables (see Figure 13.15 Edit
Parameters Screen).
The intensity value (how close the contractor is working to the travelling public) is linked
to lane capacity.
Productivity changes the duration.
The Present Serviceability Index (road quality) is linked to user cost due to wear and tear
on the vehicles.
The lane width factor affects the capacity.
The width factor is affected by lane width, obstruction distance, freeway size, and whether
an obstruction is on both sides.
Ramps that are not metered will cause traffic to accelerate and slow down which affects
the capacity in the work zone.
CPI: Consumer Price Index may be found at the following website:
http://www.bls.gov/news.release/cpi.t01.htm
Colorado Department of Transportation
2017 Pavement Design Manual
445
Edit Costs
The ‘Edit Costs’ button near the top left corner allows the user to change the ‘Value of Time’ for
cars, single unit trucks, and combine trucks. Once the costs are changed click on the ‘OK’ button
(see Figure 13.16 Edit Costs Screen).
Figure 13.15 Edit Parameters Screen
Figure 13.16 Edit Costs Screen

Colorado Department of Transportation
2017 Pavement Design Manual
446
Saving Projects
The ‘Save’ button is located near the center of the row of buttons. This button will save all inputs,
including any changes to the hourly distribution, parameters, and costs, as well as, time stamp the
file so the user will know when the file was last modified. After clicking ‘Save’, the file will
appear in the bottom left of the web window (see Figure 13.17 Saving a File).
If the file does not appear at the bottom, it may be because your computer is blocking pop-ups.
The user can allow the pop-ups only for this site by clicking the red ‘X ‘on the top navigation bar
of the web browser when the program tries to download the file. Next, click on the file and select
‘Open’. A text file will open. From the notebook text editor, select ‘File’, then ‘Save’, to save
the file onto your computer. Next time the user opens the program, the file can be opened from
the ‘Browse’ button at the top of the screen.
Reset
The ‘Reset’ button will clear the page and reset all the default values.
Figure 13.17 Saving a File
Colorado Department of Transportation
2017 Pavement Design Manual
447
13.6 Probabilistic Life Cycle Cost Analysis
Two different computational approaches can be used in a LCCA; deterministic and probabilistic.
The methods differ in the way they address the variability associated with the LCCA input values.
Deterministic: In the deterministic approach, the analyst assigns each LCCA input
variable a fixed, discrete value. The analyst determines the value most likely to occur
for each parameter, usually basing the determination on historical evidence or
professional judgment. Collectively, the input values are used to compute a single life-
cycle cost estimate for the alternative under consideration. Traditionally, applications
of a LCCA have been deterministic. A deterministic life-cycle cost computation is
straightforward and can be conducted manually with a calculator or automatically with
a spreadsheet. Sensitivity analyses may be conducted to test input assumptions by
varying one input, holding other inputs constant, and determining the effect of the
variation on the outputs. The deterministic approach, however, fails to address
simultaneous variation in multiple inputs, and it fails to convey the degree of
uncertainty associated with the life-cycle cost estimates.
Probabilistic: Probabilistic LCCA inputs are described by probability functions that
convey both the range of likely inputs and the likelihood of their occurrence.
Probabilistic LCCA also allows for the simultaneous computation of differing
assumptions for many different variables. Outputs and inputs express the likelihood a
particular life-cycle cost will actually occur. Because of the dramatic increases in
computer processing capabilities of the last two decades, the process of probabilistic
analysis has become more practical. Simulating and accounting for simultaneous
changes in LCCA input parameters can now be accomplished easily and quickly.
13.7 FHWA RealCost Software
The RealCost software was created with two distinct purposes. The first is to provide an
instructional tool for pavement design decision-makers who want to learn about the LCCA. The
software allows the student of LCCA to investigate the effects of cost, service life, and economic
inputs on life-cycle cost. For this purpose, a Graphical User Interface (GUI) was designed to make
the software easy to use. The second purpose is to provide an actual tool for pavement designers
which they can use to incorporate life-cycle costs into their pavement investment decisions.
The RealCost software automates FHWA’s LCCA methodology as it applies to pavements by
calculating life-cycle values for both agency and user costs associated with construction and
rehabilitation. The software can perform both deterministic sensitivity analyses and probabilistic
risk analysis of pavement LCCA problems. Additionally, RealCost supports deterministic
sensitivity and probabilistic risk analyses. RealCost compares two alternatives at a time and has
been designed to give the pavement engineer the ability to compare an unlimited number of
alternatives. By saving the input files of all alternatives being considered, the analyst can compare
any number of alternatives. Furthermore, the software has been designed so an understanding of
the LCCA process is sufficient to operate the software. Outputs are provided in tabular and graphic
format.
Colorado Department of Transportation
2017 Pavement Design Manual
448
The software automates FHWA’s work zone user cost calculation method. This method for
calculating user costs compares traffic demand to roadway capacity on an hour-by-hour basis,
revealing the resulting traffic conditions. The method is computation intensive and ideally suited
to a spreadsheet application. The software does not calculate agency costs or service lives for
individual construction or rehabilitation activities. These values must be input by the analyst and
should reflect the construction and rehabilitation practices of the agency. While RealCost
compares the agency and user life-cycle costs of alternatives, its analysis outputs alone do not
identify which alternative is the best choice for implementing a project. The lowest life-cycle cost
option may not be implemented when other considerations such as risk, available budgets, and
political and environmental concerns are taken into account. As with any economic tool, LCCA
provides critical information to the overall decision-making process, but not the answer itself.
FHWA's RealCost software may be obtained at:
http://www.fhwa.dot.gov/infrastructure/asstmgmt/lcca.cfm
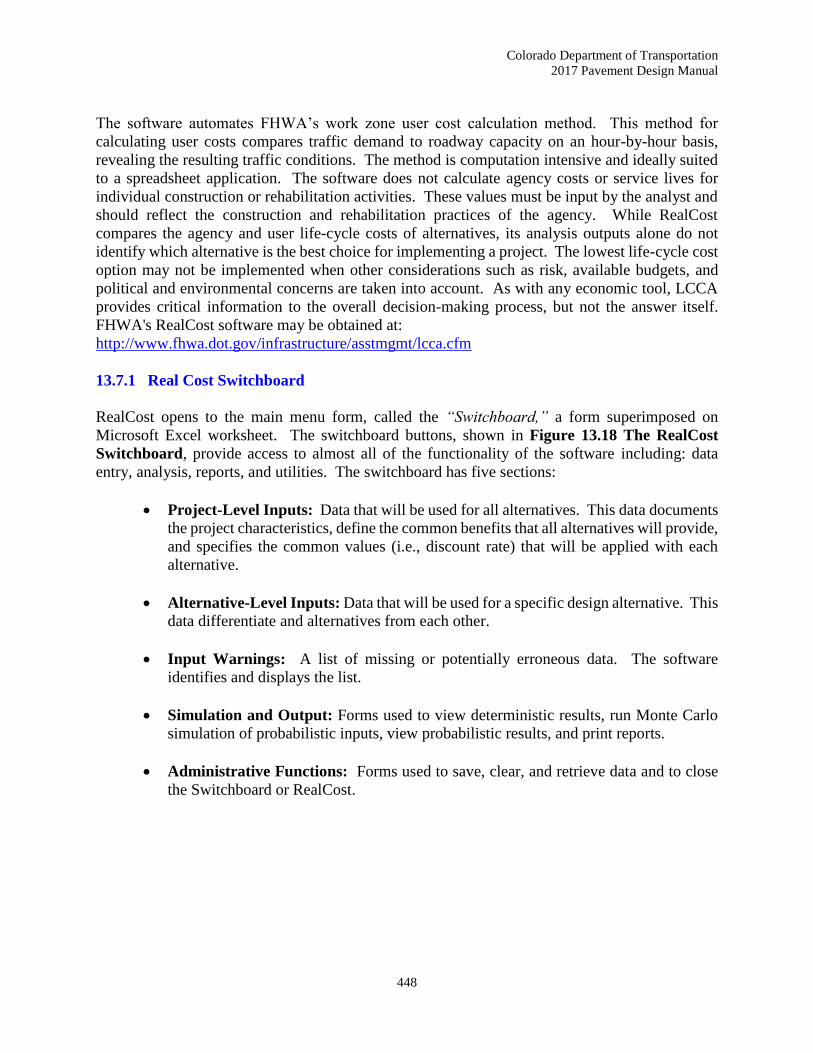
13.7.1 Real Cost Switchboard
RealCost opens to the main menu form, called the “Switchboard,” a form superimposed on
Microsoft Excel worksheet. The switchboard buttons, shown in Figure 13.18 The RealCost
Switchboard, provide access to almost all of the functionality of the software including: data
entry, analysis, reports, and utilities. The switchboard has five sections:
Project-Level Inputs: Data that will be used for all alternatives. This data documents
the project characteristics, define the common benefits that all alternatives will provide,
and specifies the common values (i.e., discount rate) that will be applied with each
alternative.
Alternative-Level Inputs: Data that will be used for a specific design alternative. This
data differentiate and alternatives from each other.
Input Warnings: A list of missing or potentially erroneous data. The software
identifies and displays the list.
Simulation and Output: Forms used to view deterministic results, run Monte Carlo
simulation of probabilistic inputs, view probabilistic results, and print reports.
Administrative Functions: Forms used to save, clear, and retrieve data and to close
the Switchboard or RealCost.
Colorado Department of Transportation
2017 Pavement Design Manual
449
Figure 13.18 The Real Cost Switchboard
13.7.2 Real Word Example Using the RealCost Software
Compare 9 inches of HMA to 12 inches PCCP on a 4-lane section of I-70 (2-lanes per direction)
near Bethune Colorado from MP 417 to MP 427, which is located in Region 1 (prior to 7/1/2013).
HMA (9 inches): It is estimated the HMA alternative will take 54 construction days
working from 8:00 a.m. to 5:00 p.m. with a single lane closure per direction. Each of
HMA rehabilitation cycle will take approximately 20 construction days.
PCCP (12 inches): The alternative will take 100 construction days per direction using
a cross over. PCCP rehabilitation will take approximately 30 construction days (8:00
a.m. to 5:00 p.m.).
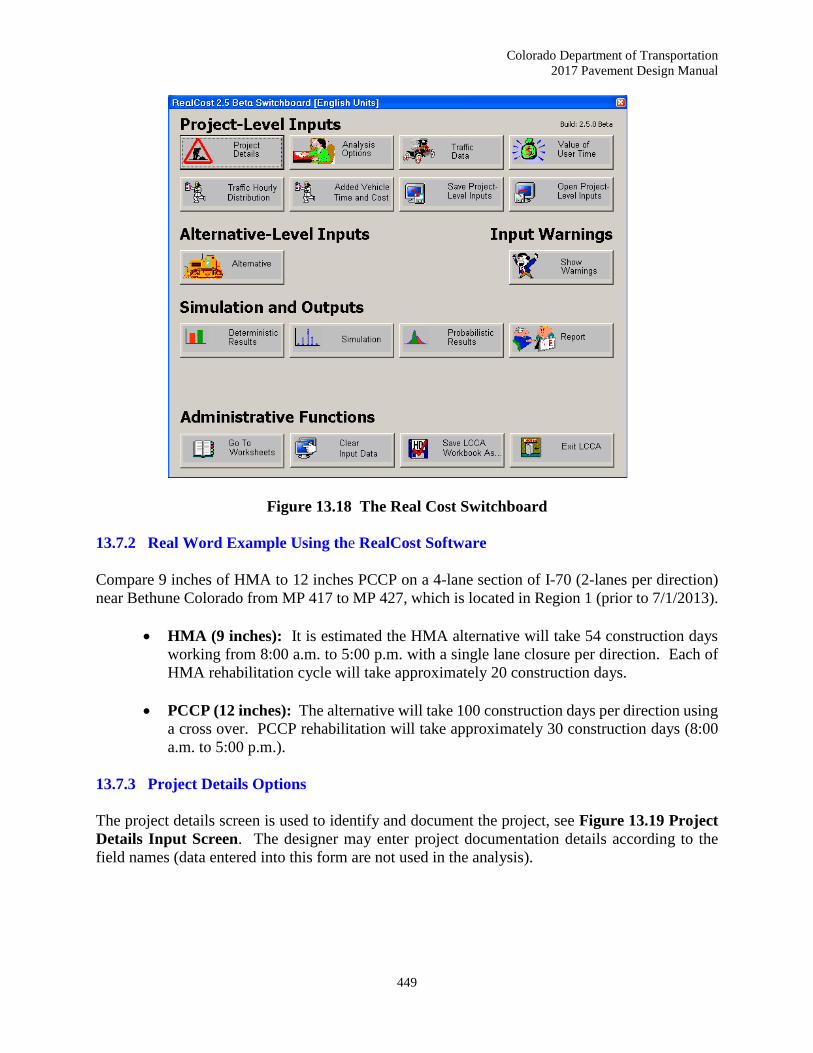
13.7.3 Project Details Options
The project details screen is used to identify and document the project, see Figure 13.19 Project
Details Input Screen. The designer may enter project documentation details according to the
field names (data entered into this form are not used in the analysis).

Colorado Department of Transportation
2017 Pavement Design Manual
450
Figure 13.19 Project Details Input Screen
13.7.4 Analysis Options
Generally, analysis options are decided by agency policy rather than the pavement designer.
Options defined in the Analysis Options form include the analysis period, discount rate, beginning
year, inclusion of residual service life, and the treatment of user costs in the LCCA, see Figure
13.20 Analysis Option Screen. The data inputs and analysis options available on this form are
discussed in Table 13.6 Analysis Data Inputs and Analysis Options, with CDOT and FHWA’s
recommendations. A checked box equals “Yes,” and unchecked box equals “No”.

Colorado Department of Transportation
2017 Pavement Design Manual
451
Table 13.6 Analysis Data Inputs and Analysis Options
Variable Name
Probability
Distribution
(CDOT Default)
Value
(CDOT
Default)
Source
Analysis Units Select option English CDOT
Analysis Period (Years) User specified 40 Sections 13.3.1, 13.3.2, and
13.3.3
Discount Rate
(%) Log normal
Mean and
standard
deviation
Section 13.4
T-bill, inflation rate, and
10-year moving average
Beginning of Analysis Period User specified Date (year) Project start date
Included Agency Cost
Remaining Service Life Value Select option Yes
Section 13.5
(serviceable life)
Include User Costs in Analysis Select option Yes Section 13.5.7
User Cost Computation
Method
Select option
(specified/calculated) Specified
Section 13.5.7 Use user
costs from CDOT
WorkZone software*
Traffic Direction Select option
(both/inbound/outbound) Both Site specific
Include User Cost RSL Select option Yes Section 13.5.7
Note: * When "Specified" is selected the manual calculated user cost from the WorkZone program will be used in
the RealCost program.
Figure 13.20 Analysis Option Screen
Colorado Department of Transportation
2017 Pavement Design Manual
452
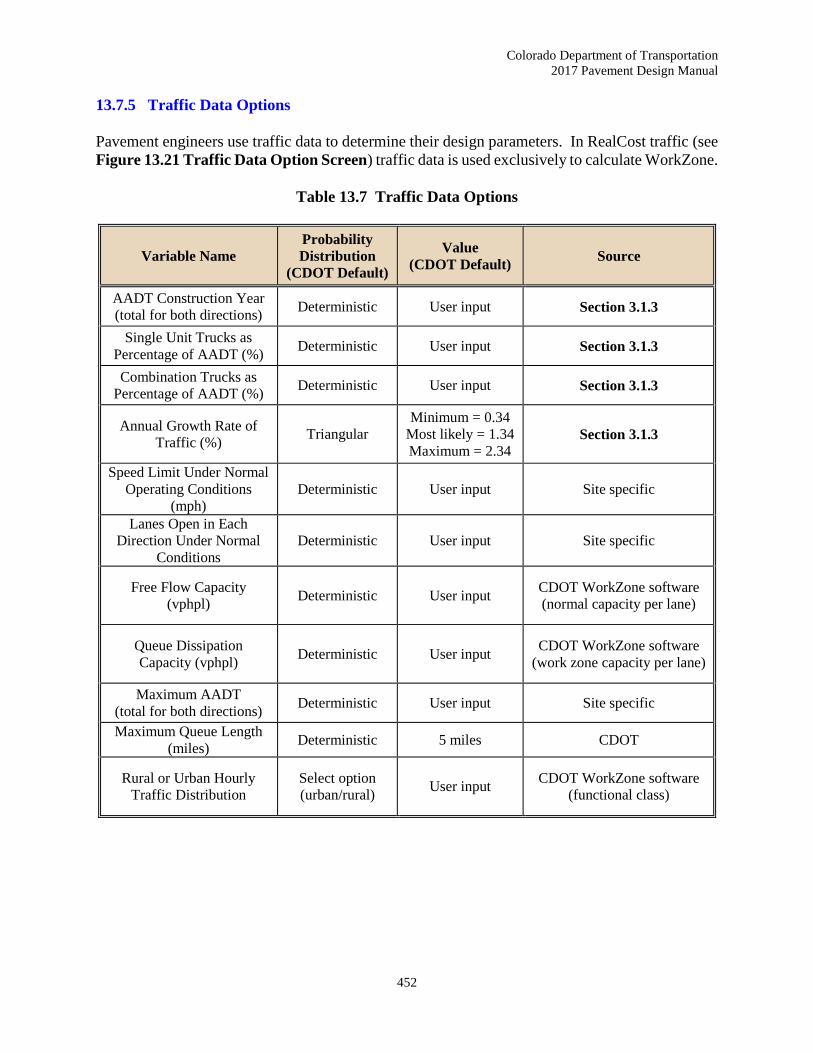
13.7.5 Traffic Data Options
Pavement engineers use traffic data to determine their design parameters. In RealCost traffic (see
Figure 13.21 Traffic Data Option Screen) traffic data is used exclusively to calculate WorkZone.
Table 13.7 Traffic Data Options
Variable Name
Probability
Distribution
(CDOT Default)
Value
(CDOT Default) Source
AADT Construction Year
(total for both directions) Deterministic User input Section 3.1.3
Single Unit Trucks as
Percentage of AADT (%) Deterministic User input Section 3.1.3
Combination Trucks as
Percentage of AADT (%) Deterministic User input Section 3.1.3
Annual Growth Rate of
Traffic (%) Triangular
Minimum = 0.34
Most likely = 1.34
Maximum = 2.34 Section 3.1.3
Speed Limit Under Normal
Operating Conditions
(mph)
Deterministic User input Site specific
Lanes Open in Each
Direction Under Normal
Conditions
Deterministic User input Site specific
Free Flow Capacity
(vphpl) Deterministic User input
CDOT WorkZone software
(normal capacity per lane)
Queue Dissipation
Capacity (vphpl) Deterministic User input
CDOT WorkZone software
(work zone capacity per lane)
Maximum AADT
(total for both directions) Deterministic User input Site specific
Maximum Queue Length
(miles) Deterministic 5 miles CDOT
Rural or Urban Hourly
Traffic Distribution
Select option
(urban/rural) User input
CDOT WorkZone software
(functional class)

Colorado Department of Transportation
2017 Pavement Design Manual
453
Figure 13.21 Traffic Data Option Screen
The Free Flow Capacity (FFC or vphpl): Obtained from CDOT WorkZone software
and is labeled ‘Normal Capacity Per Lane’ on the input screen.
Queue Dissipation Capacity (QDC or vphpl): Must be equal to or greater than the
largest value of work zone capacity per lane under the alternatives input screen(s);
otherwise an error is detected under the input error warnings check. The QDC is on a
roadway when there is no work zone. The traffic comes to a either a complete or near
complete stop and then starts and dissipates; similar vehicles at a traffic light or if an
object is in the roadway. Thus, the QDC is how much traffic the roadway will carry
under these conditions. This is different than free flow capacity and during a work
zone’s normal traffic flow where normal traffic slows down but does not come to a
complete stop or near stop. Therefore, the QDC must be larger for the same roadway
to be able to disperse more volume of traffic than a work zone condition.

Colorado Department of Transportation
2017 Pavement Design Manual
454
Only a deterministic value is needed for the maximum AADT (both direction). The Highway
Capacity Manual (2000) lists various volumes of freeways with 4, 6, and 8 lanes and a 4 lane
arterial. It is fortunate that Denver, Colorado is listed in the tables and exhibits.
Exhibit 8-13 – Reported maximum directional volumes on selected urban streets in the Highway
Capacity Manual (2000) is shown as:
Colorado State Highway 2
6 Lanes: 3,435 vehicles/hour
Therefore: 3,435 vehicles/hour * 2 directions = 6,870 vehicles/hour both directions
6,870 vehicles/hour both directions * 24 hours = 164,880 maximum AADT
both directions
Exhibit 8-19 – Reported maximum hourly one-way volumes on selected freeways in the Highway
Capacity Manual (2000) lists various volumes of freeways with 4, 6, and 8 lanes.
Colorado State Highway I-225
4-lane: 4,672 vehicles/hour
Therefore: 4,672 vehicles/hour * 2 directions = 9,344 vehicles/hour both directions
9,344 vehicles/hour both directions * 24 hours = 224,256 maximum AADT
both directions
Colorado State Highway 6
6-lane: 7,378 vehicles/hour
Therefore: 7,378 vehicles/hour * 2 directions = 14,756 vehicles/hour both directions
14,756 vehicles/hour both directions * 24 hours = 354,144 maximum AADT
both directions
Interstate Highway I-25
8-lane: 8,702 vehicles/hour
Therefore: 8,702 vehicles/hour * 2 directions = 17,404 vehicles/hour both directions
17,404 vehicles/hour both directions * 24 hours = 417,696 maximum AADT
both directions
The pavement designer may select a reasonable maximum AADT. If need be, an interpolation
may be in order to fit the project specifics. An alternate method is to use the Free Flow Capacity
(vphpl) multiplied by the number of lanes, multiplied by the 2 directions, and multiplied by 24
hours.
13.7.6 Value of User Time
The ‘Value of User Time’ form, shown in Figure 13.22 Value of User Option Screen, allows
editing of the values applied to an hour of user time. The dollar value of user time is different for
each vehicle type and used to calculate user costs associated with delay during work zone
operations.

Colorado Department of Transportation
2017 Pavement Design Manual
455
Table 13.8 Value of User Time Data Options
Variable Name
Probability
Distribution
(CDOT Default)
Value
(CDOT Default) Source
Value of Time for
Passenger Cars
($/hour)
Deterministic 18.50
CDOT Work Zone
software
Section 13.5.7
Value of Time for
Single Unit Trucks
($/hours)
Deterministic 43.50
CDOT Work Zone
software
Section 13.5.7
Value of Time for
Combination Trucks
($/hour)
Deterministic 49.50
CDOT Work Zone
software
Section 13.5.7
Figure 13.22 Value of User Option Screen
13.7.7 Traffic Hourly Distribution
To transform Annual Average Daily Traffic (AADT) to an hourly traffic distribution use the
default Rural and Urban Traffic hourly distributions from MicroBENCOST provided with the
RealCost software. The ‘Traffic Hourly Distribution’ (see Figure 13.23 Traffic Hourly
Distribution Screen) form is used to adjust (or restore) these settings. Distributions are required
to sum to 100 percent.

Colorado Department of Transportation
2017 Pavement Design Manual
456
Table 13.9 Traffic Hourly Distribution Data Options
Variable Name
(percent)
Probability
Distribution
(CDOT Default)
Value
(CDOT Default) Source
AADT Rural Real Cost default Real Cost default Real Cost software
Inbound Rural Real Cost default Real Cost default Real Cost software
AADT Urban Real Cost default Real Cost default Real Cost software
Inbound Urban Real Cost default Real Cost default Real Cost software
Figure 13.23 Traffic Hourly Distribution Screen
Colorado Department of Transportation
2017 Pavement Design Manual
457
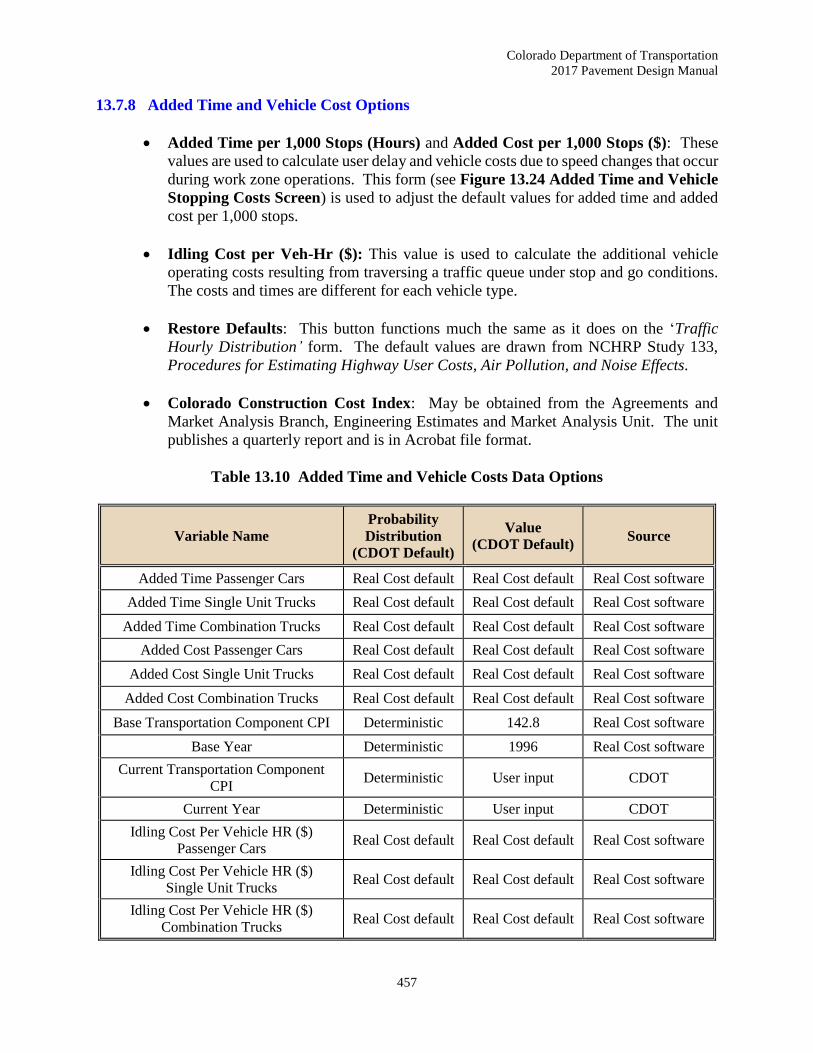
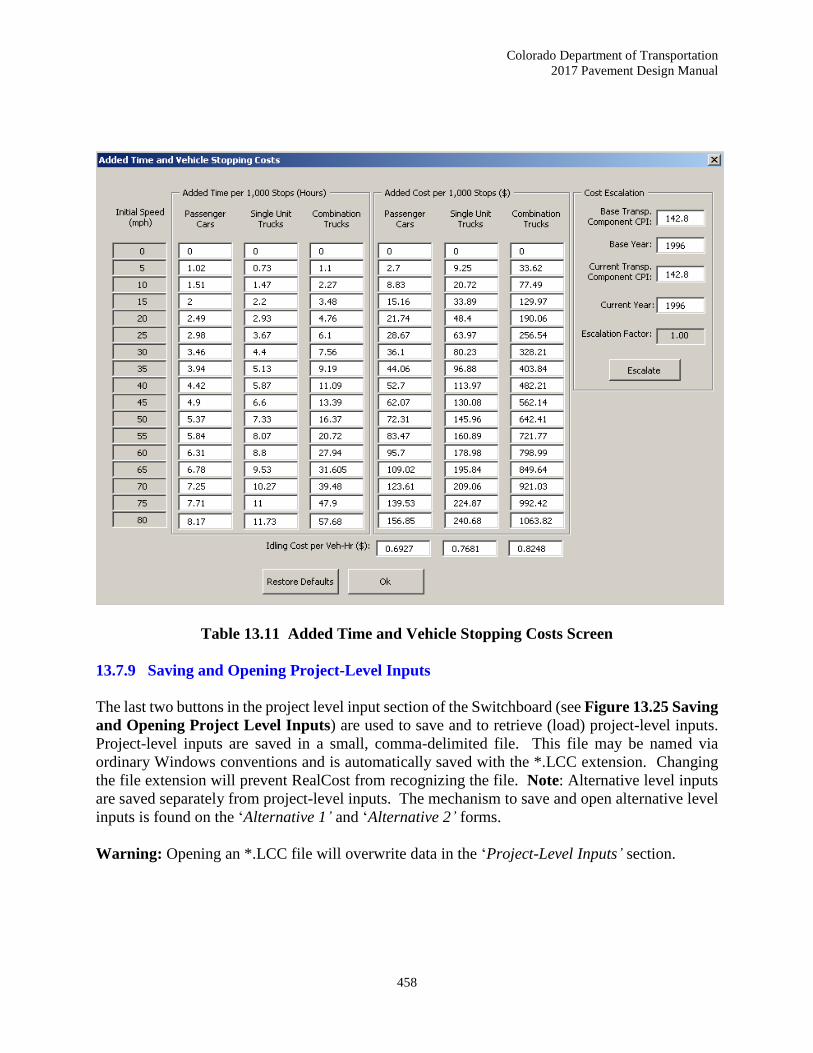
13.7.8 Added Time and Vehicle Cost Options
Added Time per 1,000 Stops (Hours) and Added Cost per 1,000 Stops ($): These
values are used to calculate user delay and vehicle costs due to speed changes that occur
during work zone operations. This form (see Figure 13.24 Added Time and Vehicle
Stopping Costs Screen) is used to adjust the default values for added time and added
cost per 1,000 stops.
Idling Cost per Veh-Hr ($): This value is used to calculate the additional vehicle
operating costs resulting from traversing a traffic queue under stop and go conditions.
The costs and times are different for each vehicle type.
Restore Defaults: This button functions much the same as it does on the ‘Traffic
Hourly Distribution’ form. The default values are drawn from NCHRP Study 133,
Procedures for Estimating Highway User Costs, Air Pollution, and Noise Effects.
Colorado Construction Cost Index: May be obtained from the Agreements and
Market Analysis Branch, Engineering Estimates and Market Analysis Unit. The unit
publishes a quarterly report and is in Acrobat file format.
Table 13.10 Added Time and Vehicle Costs Data Options
Variable Name
Probability
Distribution
(CDOT Default)
Value
(CDOT Default) Source
Added Time Passenger Cars Real Cost default Real Cost default Real Cost software
Added Time Single Unit Trucks Real Cost default Real Cost default Real Cost software
Added Time Combination Trucks Real Cost default Real Cost default Real Cost software
Added Cost Passenger Cars Real Cost default Real Cost default Real Cost software
Added Cost Single Unit Trucks Real Cost default Real Cost default Real Cost software
Added Cost Combination Trucks Real Cost default Real Cost default Real Cost software
Base Transportation Component CPI Deterministic 142.8 Real Cost software
Base Year Deterministic 1996 Real Cost software
Current Transportation Component
CPI Deterministic User input CDOT
Current Year Deterministic User input CDOT
Idling Cost Per Vehicle HR ($)
Passenger Cars Real Cost default Real Cost default Real Cost software
Idling Cost Per Vehicle HR ($)
Single Unit Trucks Real Cost default Real Cost default Real Cost software
Idling Cost Per Vehicle HR ($)
Combination Trucks Real Cost default Real Cost default Real Cost software
Colorado Department of Transportation
2017 Pavement Design Manual
458
Table 13.11 Added Time and Vehicle Stopping Costs Screen
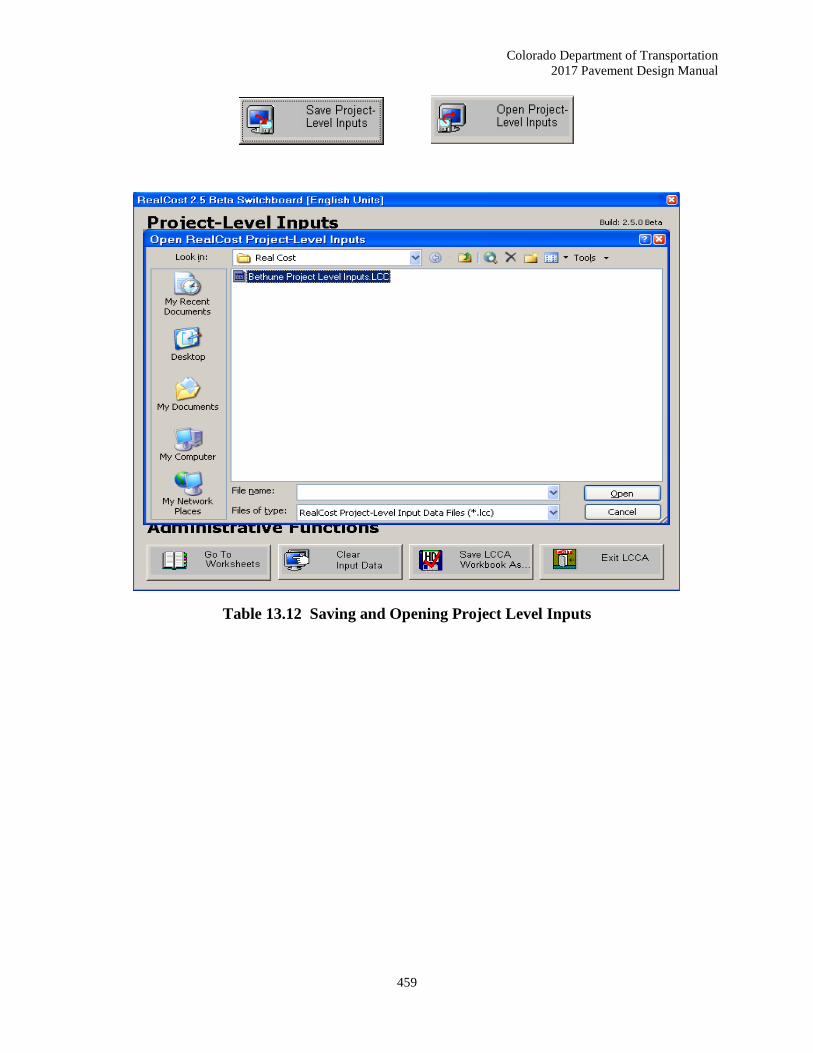
13.7.9 Saving and Opening Project-Level Inputs
The last two buttons in the project level input section of the Switchboard (see Figure 13.25 Saving
and Opening Project Level Inputs) are used to save and to retrieve (load) project-level inputs.
Project-level inputs are saved in a small, comma-delimited file. This file may be named via
ordinary Windows conventions and is automatically saved with the *.LCC extension. Changing
the file extension will prevent RealCost from recognizing the file. Note: Alternative level inputs
are saved separately from project-level inputs. The mechanism to save and open alternative level
inputs is found on the ‘Alternative 1’ and ‘Alternative 2’ forms.
Warning: Opening an *.LCC file will overwrite data in the ‘Project-Level Inputs’ section.
Colorado Department of Transportation
2017 Pavement Design Manual
459
Table 13.12 Saving and Opening Project Level Inputs

Colorado Department of Transportation
2017 Pavement Design Manual
460
Table 13.13 Number of Projects in the Study
Rehabilitation Technique Components Number of
Projects
Heater Remixing Process Mat 49
Rejuvenating Agent 45
Hydrating Lime 30
Heater Scarifying Process Mat 19
Rejuvenating Agent 17
Full Depth Reclamation (FDR) - 54
Hot Mix Asphalt Overlay
< 10,000 tons
All projects 84
SX(100) PG 64-28 22
SX(100) PG 64-22 34
SX(100) PG 58-28 7
SX(100) PG 76-28 7
Furnish HMA 7
Hot Mix Asphalt Overlay
> 10,000 tons
All projects 121
SX(100) PG 64-22 36
SX(100) PG 76-28 11
SX(100) PG 58-28 11
SX(100) PG 64-28 8
SX(75) 21
Hot Mix Asphalt Mill and Fill
< 10,000 tons
All projects 51
SX(100) PG 64-22 15
SX(100) PG 76-28 17
SX(75) PG 58-28 7
Hot Mix Asphalt Mill and Fill
> 10,000 tons
All projects 63
SX(100) PG 64-22 10
SX(75) PG 58-28 20
SX(100) PG 64-28 5
SX(100) PG 58-34 4
SMA 13
Portland Cement Concrete Pavement
< 10,000 square yards
All projects 184
Portland Cement Concrete Pavement
> 10,000 square yards
All projects 67
Total 692
Colorado Department of Transportation
2017 Pavement Design Manual
461
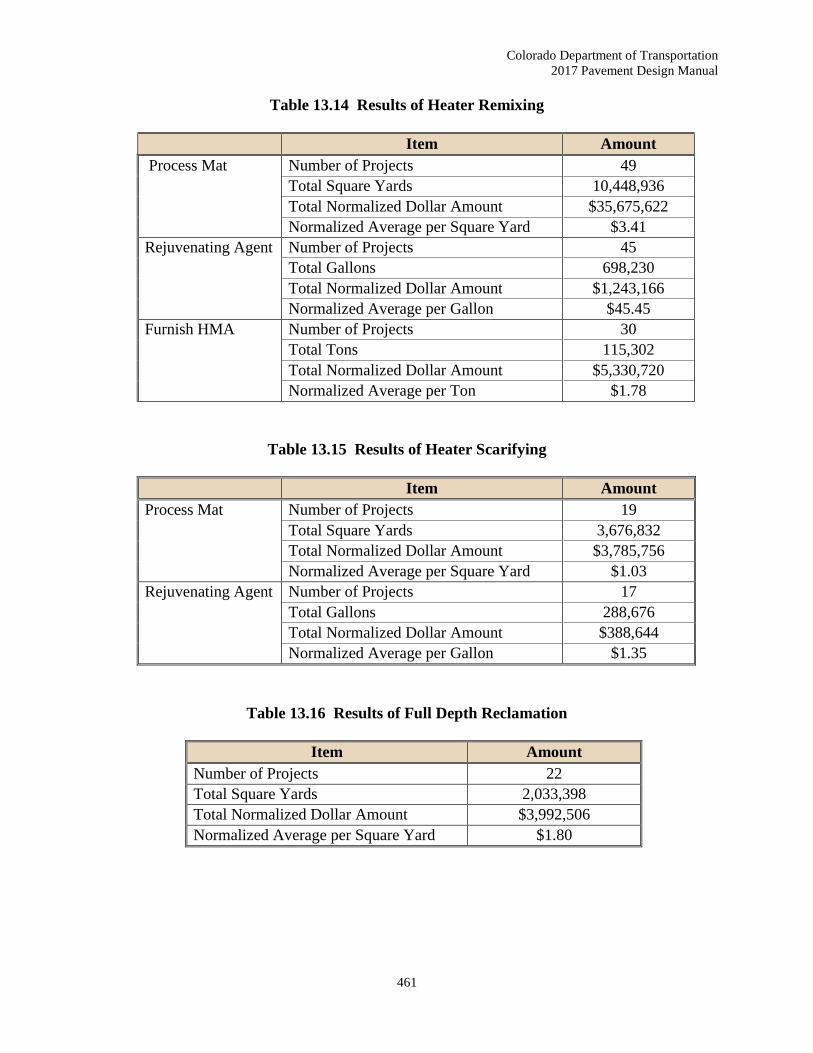
Table 13.14 Results of Heater Remixing
Item Amount
Process Mat Number of Projects 49
Total Square Yards 10,448,936
Total Normalized Dollar Amount $35,675,622
Normalized Average per Square Yard $3.41
Rejuvenating Agent Number of Projects 45
Total Gallons 698,230
Total Normalized Dollar Amount $1,243,166
Normalized Average per Gallon $45.45
Furnish HMA Number of Projects 30
Total Tons 115,302
Total Normalized Dollar Amount $5,330,720
Normalized Average per Ton $1.78
Table 13.15 Results of Heater Scarifying
Item Amount
Process Mat Number of Projects 19
Total Square Yards 3,676,832
Total Normalized Dollar Amount $3,785,756
Normalized Average per Square Yard $1.03
Rejuvenating Agent Number of Projects 17
Total Gallons 288,676
Total Normalized Dollar Amount $388,644
Normalized Average per Gallon $1.35
Table 13.16 Results of Full Depth Reclamation
Item Amount
Number of Projects 22
Total Square Yards 2,033,398
Total Normalized Dollar Amount $3,992,506
Normalized Average per Square Yard $1.80
Colorado Department of Transportation
2017 Pavement Design Manual
462
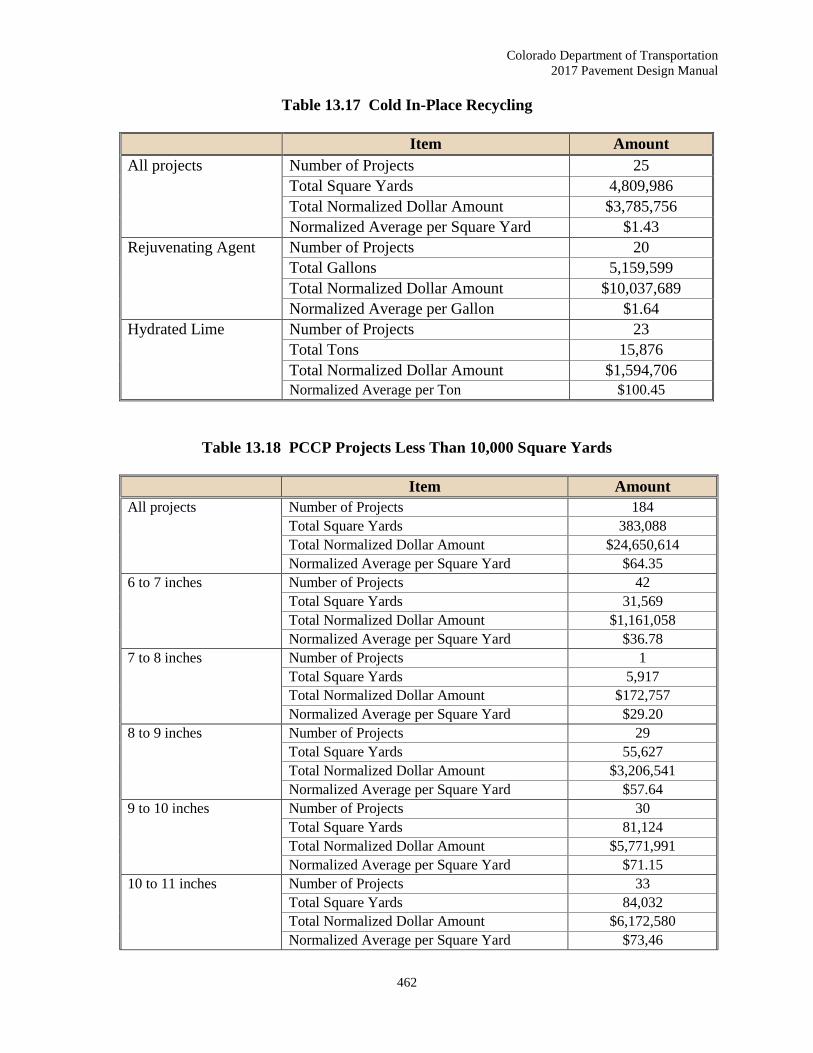
Table 13.17 Cold In-Place Recycling
Item Amount
All projects Number of Projects 25
Total Square Yards 4,809,986
Total Normalized Dollar Amount $3,785,756
Normalized Average per Square Yard $1.43
Rejuvenating Agent Number of Projects 20
Total Gallons 5,159,599
Total Normalized Dollar Amount $10,037,689
Normalized Average per Gallon $1.64
Hydrated Lime Number of Projects 23
Total Tons 15,876
Total Normalized Dollar Amount $1,594,706
Normalized Average per Ton $100.45
Table 13.18 PCCP Projects Less Than 10,000 Square Yards
Item Amount
All projects Number of Projects 184
Total Square Yards 383,088
Total Normalized Dollar Amount $24,650,614
Normalized Average per Square Yard $64.35
6 to 7 inches Number of Projects 42
Total Square Yards 31,569
Total Normalized Dollar Amount $1,161,058
Normalized Average per Square Yard $36.78
7 to 8 inches Number of Projects 1
Total Square Yards 5,917
Total Normalized Dollar Amount $172,757
Normalized Average per Square Yard $29.20
8 to 9 inches Number of Projects 29
Total Square Yards 55,627
Total Normalized Dollar Amount $3,206,541
Normalized Average per Square Yard $57.64
9 to 10 inches Number of Projects 30
Total Square Yards 81,124
Total Normalized Dollar Amount $5,771,991
Normalized Average per Square Yard $71.15
10 to 11 inches Number of Projects 33
Total Square Yards 84,032
Total Normalized Dollar Amount $6,172,580
Normalized Average per Square Yard $73,46

Colorado Department of Transportation
2017 Pavement Design Manual
463
11 to 12 inches Number of Projects 24
Total Square Yards 58,018
Total Normalized Dollar Amount $4,330,870
Normalized Average per Square Yard $74.65
12 or greater inches Number of Projects 19
Total Square Yards 55,623
Total Normalized Dollar Amount 2,895,314
Normalized Average per Square Yard $52.04
Table 13.19 PCCP Projects Greater Than 10,000 Square Yards
Item Amount
All projects Number of Projects 67
Total Square Yards 3,599,664
Total Normalized Dollar Amount $131,056,876
Normalized Average per Square Yard $36.41
4 to 7 inches Number of Projects 3
Total Square Yards 300,164
Total Normalized Dollar Amount $6,576,434
Normalized Average per Square Yard $21.91
8 to 9 inches Number of Projects 10
Total Square Yards 253,232
Total Normalized Dollar Amount $11,911,473
Normalized Average per Square Yard $47.04
9 to 10 inches Number of Projects 17
Total Square Yards 487,941
Total Normalized Dollar Amount $22,002,017
Normalized Average per Square Yard $45.09
10 to 11 inches Number of Projects 10
Total Square Yards 359,992
Total Normalized Dollar Amount $12,380,592
Normalized Average per Square Yard $34.39
11 to 12 inches Number of Projects 7
Total Square Yards 482,129
Total Normalized Dollar Amount $18,558,033
Normalized Average per Square Yard $38.49
12 or greater inches Number of Projects 13
Total Square Yards 978,159
Total Normalized Dollar Amount $37,517,776
Normalized Average per Square Yard $38.36

Colorado Department of Transportation
2017 Pavement Design Manual
464
Table 13.20 HMA Overlay Projects Less Than 10,000 Tons
Item Amount
All projects Number of Projects 84
Total Tons 328,045
Total Normalized Dollar Amount $26,368,555
Normalized Average per Ton $79.79
SX(100) PG 64-28 Number of Projects 22
Total Tons 65,638
Total Normalized Dollar Amount $5,736,291
Normalized Average per Ton $87.39
SX(100) PG 64-22 Number of Projects 34
Total Tons 169,785
Total Normalized Dollar Amount $12,741,234
Normalized Average per Ton $82.66
SX(100) PG 58-28 Number of Projects 7
Total Tons 37,083
Total Normalized Dollar Amount $2,477,618
Normalized Average per Ton $66.81
SX(100) PG 76-28 Number of Projects 7
Total Tons 32,173
Total Normalized Dollar Amount $2,330,107
Normalized Average per Ton $72.42
Furnish HMA Number of Projects 7
Total Tons 23,435
Total Normalized Dollar Amount $1,496,769
Normalized Average per Ton $63.87
Table 13.21 HMA Overlay Projects Greater Than 10,000 Tons
Item Amount
All projects Number of Projects 121
Total Tons 4,282,222
Total Normalized Dollar Amount $248,255,441
Normalized Average per Ton $57.97
SX(100) PG 64-28 Number of Projects 9
Total Tons 196,537
Total Normalized Dollar Amount $10,871,686
Normalized Average per Ton $55.32
SX(100) PG 64-22 Number of Projects 36
Total Tons 1,210,798
Total Normalized Dollar Amount $68,523,424
Normalized Average per Ton $56.59

Colorado Department of Transportation
2017 Pavement Design Manual
465
SX(100) PG 58-28 Number of Projects 11
Total Tons 416,493
Total Normalized Dollar Amount $30,887,680
Normalized Average per Ton $74.16
SX(100) PG 76-28 Number of Projects 11
Total Tons 416,493
Total Normalized Dollar Amount $30,887,680
Normalized Average per Ton $79.73
SX (75) Number of Projects 21
Total Tons 719,034
Total Normalized Dollar Amount $23,675,171
Normalized Average per Ton $32.93
Table 13.22 HMA Mill and Fill for Projects Greater Than 10,000 Tons
Item Amount
All projects Number of Projects 51
Total Tons 212,732
Total Normalized Dollar Amount $16,296,645
Normalized Average per Ton $76.61
SX(100) PG 64-22 Number of Projects 15
Total Tons 28,333
Total Normalized Dollar Amount $2,418,438
Normalized Average per Ton $85.36
SX(100) PG 58-28 Number of Projects 7
Total Tons 21,216
Total Normalized Dollar Amount 2,730,082
Normalized Average per Ton $128.68
SX(100) PG 76-28 Number of Projects 17
Total Tons 110,791
Total Normalized Dollar Amount $7,000,071
Normalized Average per Ton $63.18

Colorado Department of Transportation
2017 Pavement Design Manual
466
Table 13.23 HMA Mill and Fill for Projects Greater Than 10,000 Tons
Item Amount
All projects Number of Projects 63
Total Tons 1,751,060
Total Normalized Dollar Amount $127,667,932
Normalized Average per Ton $72.56
SX(100) PG 58-34 Number of Projects 4
Total Tons 95,697
Total Normalized Dollar Amount $8,251,056
Normalized Average per Ton $86.22
SX(100) PG 64-22 Number of Projects 5
Total Tons 136,753
Total Normalized Dollar Amount $9,562,261
Normalized Average per Ton $69.92
SX(100) PG 58-28 Number of Projects 21
Total Tons 688,657
Total Normalized Dollar Amount $48,738,394
Normalized Average per Ton $70.77
SX(100) PG 76-28 Number of Projects 10
Total Tons 207,138
Total Normalized Dollar Amount $12,558,276
Normalized Average per Ton $60.63
SMA Number of Projects 13
Total Tons 345,467
Total Normalized Dollar Amount $30,229,383
Normalized Average per Ton $87.50
Colorado Department of Transportation
2017 Pavement Design Manual
467
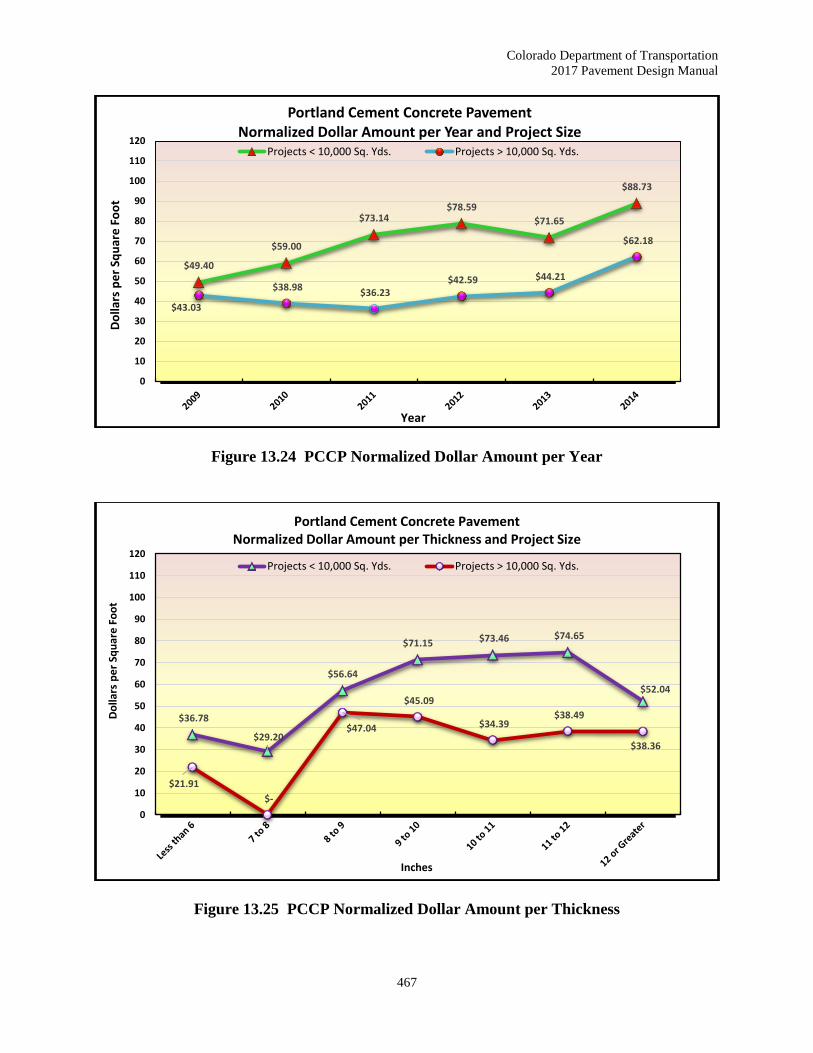
Figure 13.24 PCCP Normalized Dollar Amount per Year
Figure 13.25 PCCP Normalized Dollar Amount per Thickness
$49.40
$59.00
$73.14$78.59
$71.65
$88.73
$43.03
$38.98 $36.23
$42.59 $44.21
$62.18
0
10
20
30
40
50
60
70
80
90
100
110
120
Do
llars
pe
r Sq
uar
e F
oo
t
Year
Portland Cement Concrete Pavement Normalized Dollar Amount per Year and Project Size
Projects < 10,000 Sq. Yds. Projects > 10,000 Sq. Yds.
$36.78
$29.20
$56.64
$71.15 $73.46 $74.65
$52.04
$21.91
$-
$47.04
$45.09
$34.39 $38.49
$38.36
0
10
20
30
40
50
60
70
80
90
100
110
120
Do
llars
pe
r Sq
uar
e F
oo
t
Inches
Portland Cement Concrete Pavement Normalized Dollar Amount per Thickness and Project Size
Projects < 10,000 Sq. Yds. Projects > 10,000 Sq. Yds.
Colorado Department of Transportation
2017 Pavement Design Manual
468
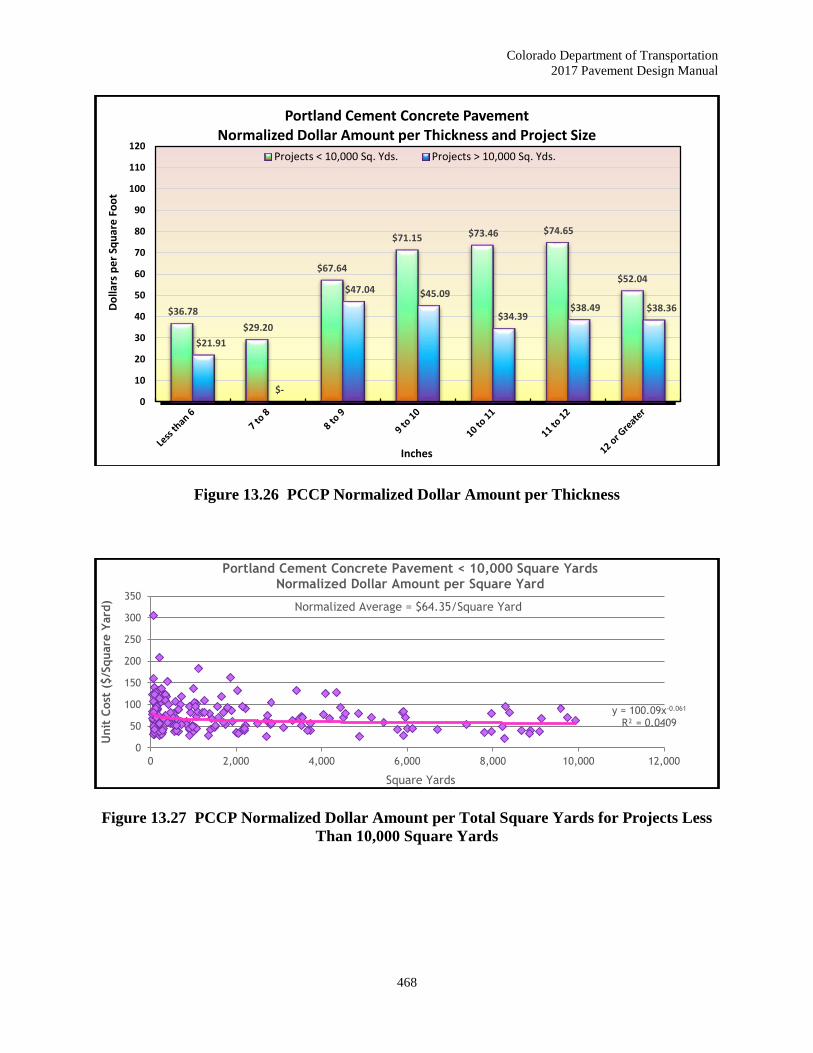
Figure 13.26 PCCP Normalized Dollar Amount per Thickness
Figure 13.27 PCCP Normalized Dollar Amount per Total Square Yards for Projects Less
Than 10,000 Square Yards
$36.78
$29.20
$67.64
$71.15 $73.46 $74.65
$52.04
$21.91
$-
$47.04 $45.09
$34.39 $38.49 $38.36
0
10
20
30
40
50
60
70
80
90
100
110
120
Do
llars
pe
r Sq
uar
e F
oo
t
Inches
Portland Cement Concrete Pavement Normalized Dollar Amount per Thickness and Project Size
Projects < 10,000 Sq. Yds. Projects > 10,000 Sq. Yds.
y = 100.09x-0.061
R² = 0.0409
0
50
100
150
200
250
300
350
0 2,000 4,000 6,000 8,000 10,000 12,000
Unit
Cost
($/S
quare
Yard
)
Square Yards
Portland Cement Concrete Pavement < 10,000 Square YardsNormalized Dollar Amount per Square Yard
Normalized Average = $64.35/Square Yard

Colorado Department of Transportation
2017 Pavement Design Manual
469
Figure 13.28 PCCP Normalized Dollar Amount for Projects of 6 Inches or Less in
Thickness and Less Than 10,000 Square Yards in Size
Figure 13.29 Normalized Dollar Amount for Projects of 8 to 9 Inches in Thickness and
Less Than 10,000 Square Yards in Size
Figure 13.30 Normalized Dollar Amount for Projects of 9 to 10 Inches in Thickness and
Less Than 10,000 Square Yards in Size
y = 149.19x-0.19
R² = 0.3407
0
30
60
90
120
150
0 1,000 2,000 3,000 4,000 5,000 6,000 7,000 8,000 9,000
Unit
Cost
($/Square
Yard
)
Square Yards
Portland Cement Concrete Pavement < 10,000 Square Yards6 Inches or Less
Normalized Dollar Amount per Square Yard
Normalized Average = $36.78/Square Yard
y = 88.499x-0.052
R² = 0.0469
0
30
60
90
120
150
0 1,000 2,000 3,000 4,000 5,000 6,000 7,000 8,000 9,000 10,000Unit
Cost
($/Square
Yard
)
Square Yards
Portland Cement Concrete Pavement < 10,000 Square Yards8 to 9 Inches
Normalized Dollar Amount per Square Yard
Normalized Average = $57.64/Square Yard
y = 125.58x-0.073
R² = 0.0362
0
30
60
90
120
150
180
210
0 1,000 2,000 3,000 4,000 5,000 6,000 7,000 8,000 9,000Unit
Cost
($/Square
Yard
)
Square Yards
Portland Cement Concrete Pavement < 10,000 Square Yards9 to 10 Inches
Normalized Dollar Amount per Square YardNormalized Average = $71.15/Square Yard
Colorado Department of Transportation
2017 Pavement Design Manual
470
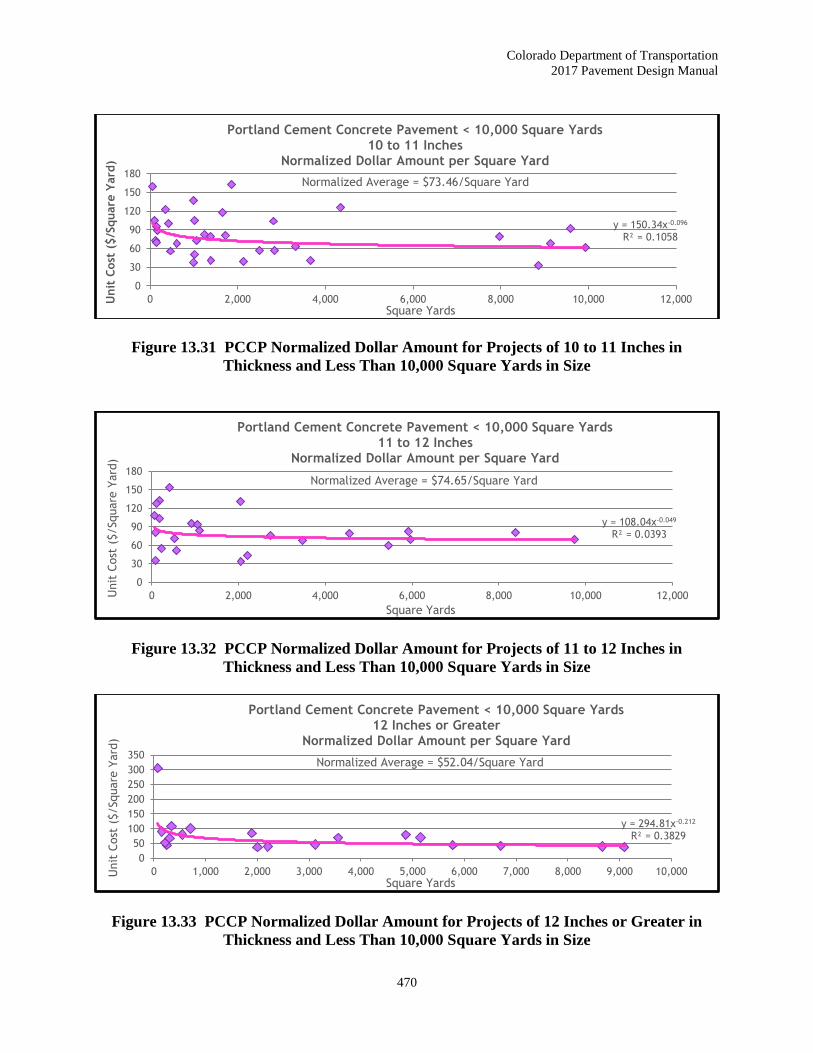
Figure 13.31 PCCP Normalized Dollar Amount for Projects of 10 to 11 Inches in
Thickness and Less Than 10,000 Square Yards in Size
Figure 13.32 PCCP Normalized Dollar Amount for Projects of 11 to 12 Inches in
Thickness and Less Than 10,000 Square Yards in Size
Figure 13.33 PCCP Normalized Dollar Amount for Projects of 12 Inches or Greater in
Thickness and Less Than 10,000 Square Yards in Size
y = 150.34x-0.096
R² = 0.1058
0
30
60
90
120
150
180
0 2,000 4,000 6,000 8,000 10,000 12,000Unit
Cost
($/S
quare
Yard
)
Square Yards
Portland Cement Concrete Pavement < 10,000 Square Yards10 to 11 Inches
Normalized Dollar Amount per Square Yard
Normalized Average = $73.46/Square Yard
y = 108.04x-0.049
R² = 0.0393
0
30
60
90
120
150
180
0 2,000 4,000 6,000 8,000 10,000 12,000Unit
Cost
($/Square
Yard
)
Square Yards
Portland Cement Concrete Pavement < 10,000 Square Yards11 to 12 Inches
Normalized Dollar Amount per Square Yard
Normalized Average = $74.65/Square Yard
y = 294.81x-0.212
R² = 0.3829
0
50
100
150
200
250
300
350
0 1,000 2,000 3,000 4,000 5,000 6,000 7,000 8,000 9,000 10,000Unit
Cost
($/Square
Yard
)
Square Yards
Portland Cement Concrete Pavement < 10,000 Square Yards12 Inches or Greater
Normalized Dollar Amount per Square Yard
Normalized Average = $52.04/Square Yard
Colorado Department of Transportation
2017 Pavement Design Manual
471
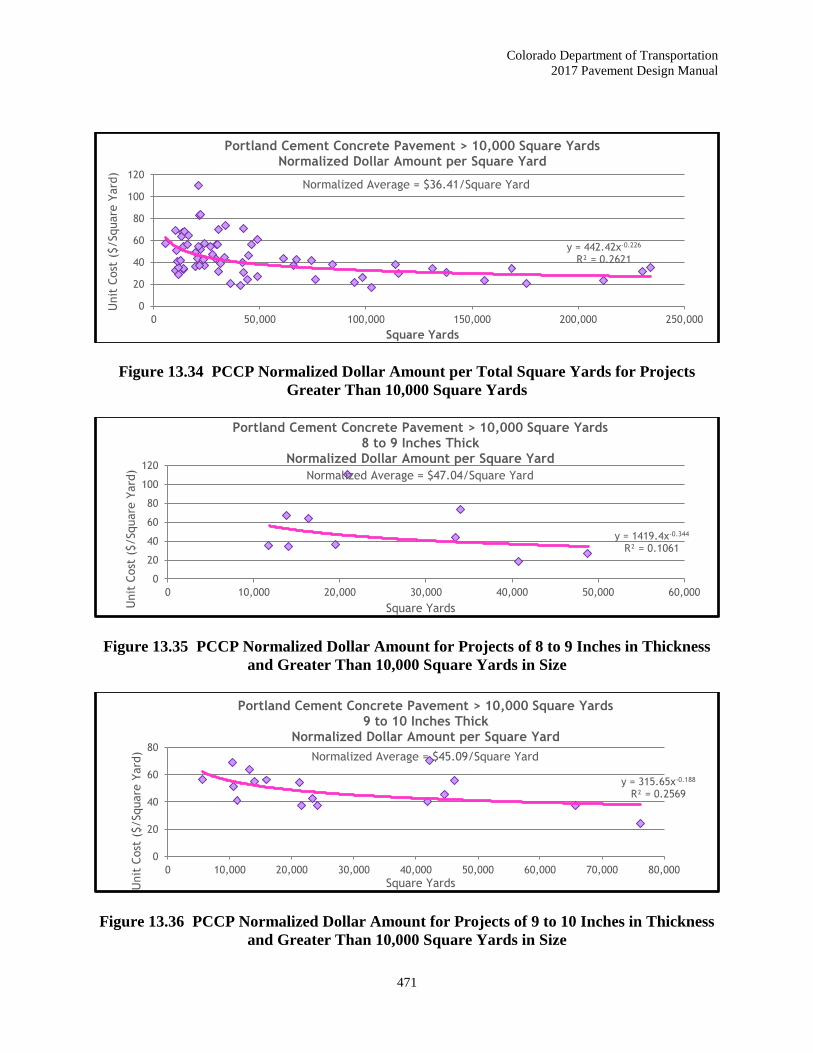
Figure 13.34 PCCP Normalized Dollar Amount per Total Square Yards for Projects
Greater Than 10,000 Square Yards
Figure 13.35 PCCP Normalized Dollar Amount for Projects of 8 to 9 Inches in Thickness
and Greater Than 10,000 Square Yards in Size
Figure 13.36 PCCP Normalized Dollar Amount for Projects of 9 to 10 Inches in Thickness
and Greater Than 10,000 Square Yards in Size
y = 442.42x-0.226
R² = 0.2621
0
20
40
60
80
100
120
0 50,000 100,000 150,000 200,000 250,000
Unit
Cost
($/Square
Yard
)
Square Yards
Portland Cement Concrete Pavement > 10,000 Square YardsNormalized Dollar Amount per Square Yard
Normalized Average = $36.41/Square Yard
y = 1419.4x-0.344
R² = 0.1061
0
20
40
60
80
100
120
0 10,000 20,000 30,000 40,000 50,000 60,000
Unit
Cost
($/Square
Yard
)
Square Yards
Portland Cement Concrete Pavement > 10,000 Square Yards8 to 9 Inches Thick
Normalized Dollar Amount per Square Yard
Normalized Average = $47.04/Square Yard
y = 315.65x-0.188
R² = 0.2569
0
20
40
60
80
0 10,000 20,000 30,000 40,000 50,000 60,000 70,000 80,000
Unit
Cost
($/Square
Yard
)
Square Yards
Portland Cement Concrete Pavement > 10,000 Square Yards9 to 10 Inches Thick
Normalized Dollar Amount per Square Yard
Normalized Average = $45.09/Square Yard
Colorado Department of Transportation
2017 Pavement Design Manual
472
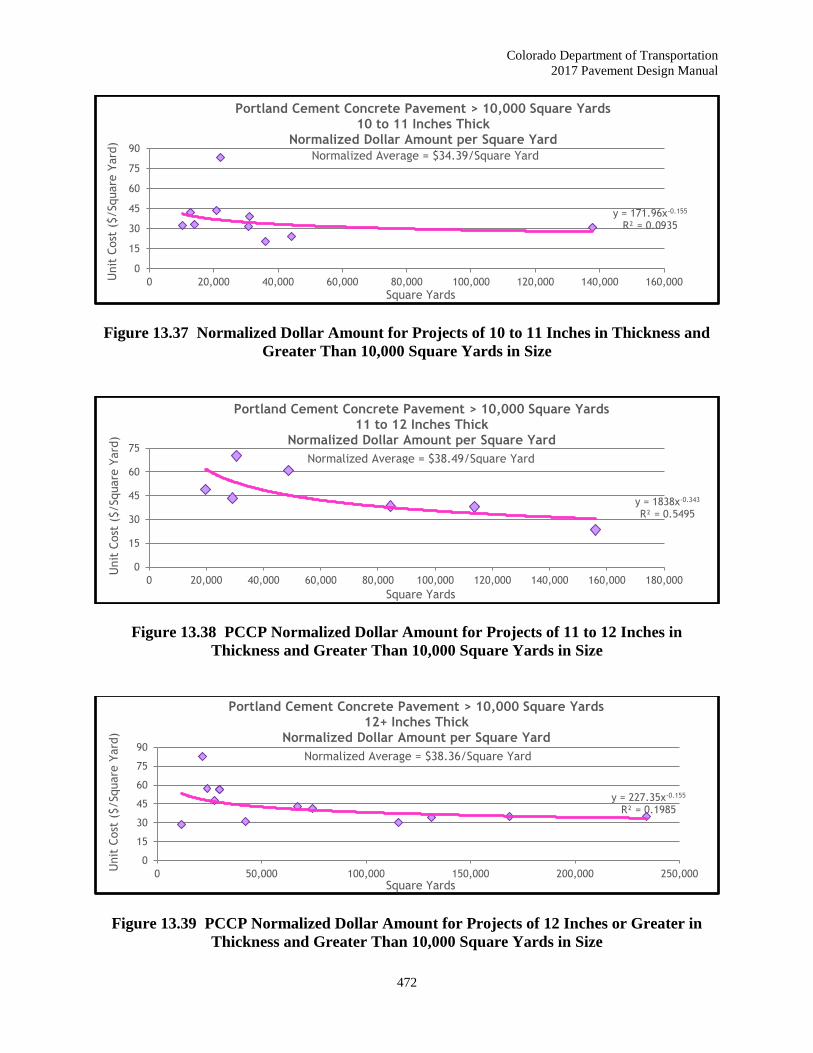
Figure 13.37 Normalized Dollar Amount for Projects of 10 to 11 Inches in Thickness and
Greater Than 10,000 Square Yards in Size
Figure 13.38 PCCP Normalized Dollar Amount for Projects of 11 to 12 Inches in
Thickness and Greater Than 10,000 Square Yards in Size
Figure 13.39 PCCP Normalized Dollar Amount for Projects of 12 Inches or Greater in
Thickness and Greater Than 10,000 Square Yards in Size
y = 171.96x-0.155
R² = 0.0935
0
15
30
45
60
75
90
0 20,000 40,000 60,000 80,000 100,000 120,000 140,000 160,000Unit
Cost
($/Square
Yard
)
Square Yards
Portland Cement Concrete Pavement > 10,000 Square Yards10 to 11 Inches Thick
Normalized Dollar Amount per Square Yard
Normalized Average = $34.39/Square Yard
y = 1838x-0.343
R² = 0.5495
0
15
30
45
60
75
0 20,000 40,000 60,000 80,000 100,000 120,000 140,000 160,000 180,000
Unit
Cost
($/Square
Yard
)
Square Yards
Portland Cement Concrete Pavement > 10,000 Square Yards11 to 12 Inches Thick
Normalized Dollar Amount per Square Yard
Normalized Average = $38.49/Square Yard
y = 227.35x-0.155
R² = 0.1985
0
15
30
45
60
75
90
0 50,000 100,000 150,000 200,000 250,000
Unit
Cost
($/Square
Yard
)
Square Yards
Portland Cement Concrete Pavement > 10,000 Square Yards12+ Inches Thick
Normalized Dollar Amount per Square Yard
Normalized Average = $38.36/Square Yard

Colorado Department of Transportation
2017 Pavement Design Manual
473
Figure 13.40 HMA Overlay Normalized Dollar per Year and Project Size
Figure 13.41 HMA Overlay Normalized Dollar per Product Type and Project Size
$76.16
$59.39
$80.25
$88.60 $88.65
$105.17
$48.76
$41.97 $43.11
$56.34
$70.19
$82.17
20
30
40
50
60
70
80
90
100
110
120
130
Do
llars
per
To
n
Year
Hot Mix Asphalt OverlayNormalized Dollar Amount per Year and Project Size
Projects < 10,000 Tons Projects > 10,000 Tons
$82.66
$72.42 $66.81
$87.39
$-
$63.87
$56.59
$79.73 $74.16
$55.32 $32.93
$-
0
10
20
30
40
50
60
70
80
90
100
110
120
Do
llars
pe
r To
n
Type
Hot Mix Asphalt OverlayNormalized Dollar Amount per Type and Project Size
Projects < 10,000 Tons Projects > 10,000 Tons

Colorado Department of Transportation
2017 Pavement Design Manual
474
Figure 13.42 HMA Overlay Normalized Dollar per Product Type and Project Size
Figure 13.43 HMA Overlay Normalized Dollar Amount for Projects Less Than 10,000
Tons
$82.66
$72.42
$66.81
$87.39
$63.87
$56.59
$79.73
$74.16
$55.32
$32.93
20
30
40
50
60
70
80
90
100
110
SX(100) PG 64-22 SX(100) PG 76-28 SX (75)PG 58-28 SX(100) PG 64-28 SX(75) Furnish HMA
Do
llars
pe
r To
n
Type
Hot Mix Asphalt OverlayNormalized Dollar Amount per Type and Project Size
Projects < 10,000 Tons Projects > 10,000 Tons
y = 205.06x-0.125
R² = 0.0105
0
30
60
90
120
150
180
210
0 1,000 2,000 3,000 4,000 5,000 6,000 7,000 8,000 9,000 10,000
Unit
Cost
($/T
on)
Tons
Hot Mix Asphalt Overlay for Projects < 10,000 TonsNormalized Dollar Amount per Ton
Normalized Average = $79.79/Ton

Colorado Department of Transportation
2017 Pavement Design Manual
475
Figure 13.44 HMA Overlay Normalized Unit Costs for SX(100) PG 64-28 on Projects Less
Than 10,000 Tons
Figure 13.45 HMA Overlay Normalized Unit Costs for SX(100) PG 64-22 on Projects Less
Than 10,000 Tons
Figure 13.46 HMA Overlay Normalized Unit Costs for SX(100) PG 58-28 on Projects Less
Than 10,000 Tons
y = 604.51x-0.243
R² = 0.2271
0
30
60
90
120
150
180
0 1,000 2,000 3,000 4,000 5,000 6,000 7,000 8,000 9,000
Unit
Cost
($/T
on)
Tons
Hot Mix Asphalt Overlay for Projects < 10,000 TonsHMA SX(100) PG 64-28
Normalized Dollar Amount per TonNormalized Average = $87.39/Ton
y = 267.81x-0.144
R² = 0.1106
0
20
40
60
80
100
120
140
160
0 1,000 2,000 3,000 4,000 5,000 6,000 7,000 8,000 9,000 10,000
Unit
Cost
($/T
on)
Tons
Hot Mix Asphalt Overlay for Projects < 10,000 TonsHMA SX(100) PG 64-22
Normalized Dollar Amount per TonNormalized Average = $82.66/Ton
y = 305.41x-0.185
R² = 0.1511
0
20
40
60
80
100
120
0 1,000 2,000 3,000 4,000 5,000 6,000 7,000 8,000 9,000 10,000
Unit
Cost
($/T
on)
Tons
Hot Mix Asphalt Overlay for Projects < 10,000 TonsHMA SX(100) PG 58-28
Normalized Dollar Amount per Ton
Normalized Average = $66.81/Ton

Colorado Department of Transportation
2017 Pavement Design Manual
476
Figure 13.47 HMA Overlay Normalized Unit Costs for SX(100) PG 76-28 on Projects Less
Than 10,000 Tons
Figure 13.48 HMA Overlay Normalized Unit Costs for Furnish HMA on Projects Less
Than 10,000 Tons
Figure 13.49 HMA Overlay Normalized Unit Costs for Projects with Greater Than 10,000
Tons
y = 1298.1x-0.342
R² = 0.4725
0
30
60
90
120
150
0 1,000 2,000 3,000 4,000 5,000 6,000 7,000 8,000 9,000 10,000
Unit
Cost
($/T
on)
Tons
Hot Mix Asphalt Overlay for Projects < 10,000 TonsHMA SX(100) PG 76-28
Normalized Dollar Amount per Ton
Normalized Average = $72.42/Ton
y = 1298.1x-0.342
R² = 0.4725
0
30
60
90
120
150
0 1,000 2,000 3,000 4,000 5,000 6,000 7,000 8,000 9,000 10,000
Unit
Cost
($/T
on)
Tons
Hot Mix Asphalt Overlay for Projects < 10,000 TonsFurnish Hot Mix Asphalt
Normalized Dollar Amount per Ton
Normalized Average = $63.87/Ton
y = 429.52x-0.199
R² = 0.0685
0
30
60
90
120
150
0 20,000 40,000 60,000 80,000 100,000 120,000
Unit
Cost
($/T
on)
Tons
Hot Mix Asphalt Overlay for Projects > 10,000 TonsNormalized Dollar Amount per Ton
Normalized Average = $57.97/Ton
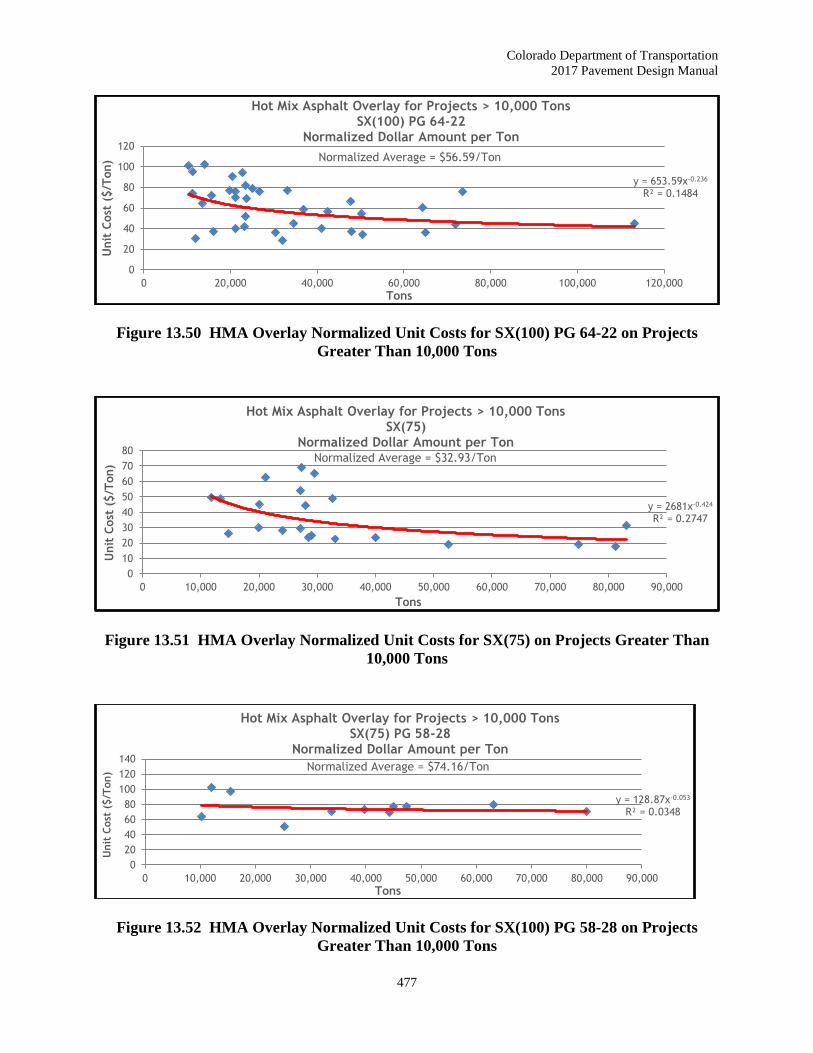
Colorado Department of Transportation
2017 Pavement Design Manual
477
Figure 13.50 HMA Overlay Normalized Unit Costs for SX(100) PG 64-22 on Projects
Greater Than 10,000 Tons
Figure 13.51 HMA Overlay Normalized Unit Costs for SX(75) on Projects Greater Than
10,000 Tons
Figure 13.52 HMA Overlay Normalized Unit Costs for SX(100) PG 58-28 on Projects
Greater Than 10,000 Tons
y = 653.59x-0.236
R² = 0.1484
0
20
40
60
80
100
120
0 20,000 40,000 60,000 80,000 100,000 120,000
Unit
Cost
($/T
on)
Tons
Hot Mix Asphalt Overlay for Projects > 10,000 TonsSX(100) PG 64-22
Normalized Dollar Amount per Ton
Normalized Average = $56.59/Ton
y = 2681x-0.424
R² = 0.2747
0
10
20
30
40
50
60
70
80
0 10,000 20,000 30,000 40,000 50,000 60,000 70,000 80,000 90,000
Unit
Cost
($/T
on)
Tons
Hot Mix Asphalt Overlay for Projects > 10,000 TonsSX(75)
Normalized Dollar Amount per TonNormalized Average = $32.93/Ton
y = 128.87x-0.053
R² = 0.0348
0
20
40
60
80
100
120
140
0 10,000 20,000 30,000 40,000 50,000 60,000 70,000 80,000 90,000
Unit
Cost
($/T
on)
Tons
Hot Mix Asphalt Overlay for Projects > 10,000 TonsSX(75) PG 58-28
Normalized Dollar Amount per Ton
Normalized Average = $74.16/Ton
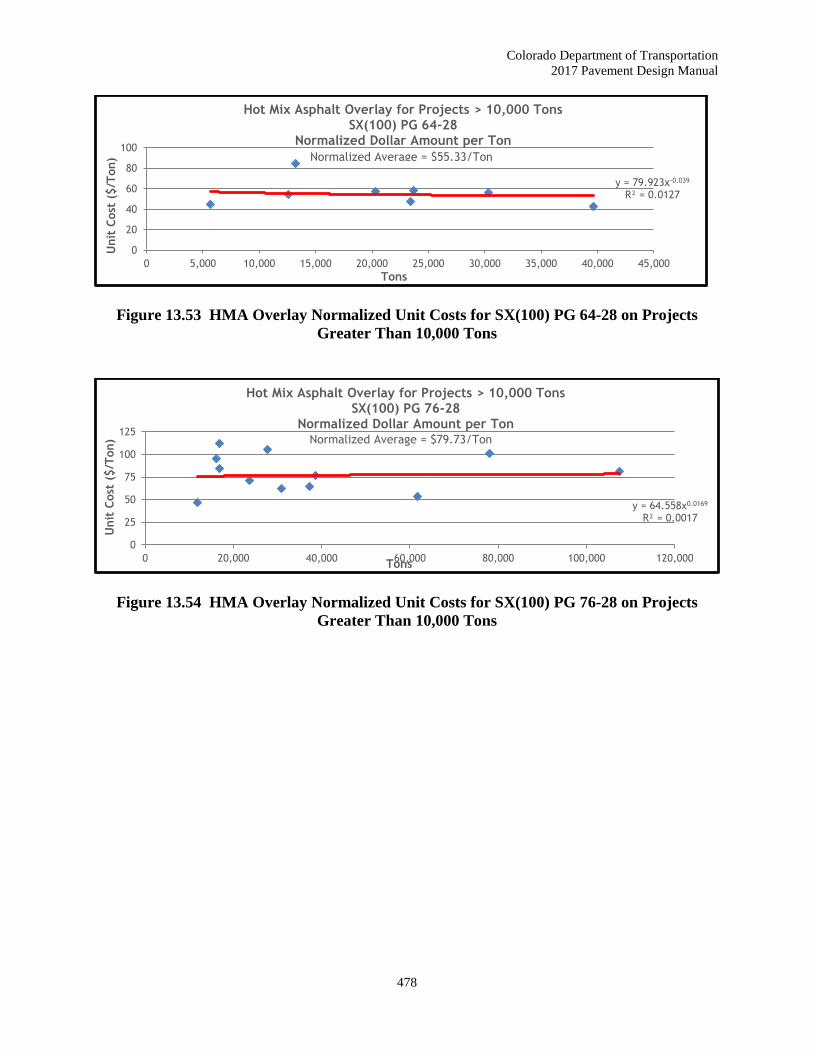
Colorado Department of Transportation
2017 Pavement Design Manual
478
Figure 13.53 HMA Overlay Normalized Unit Costs for SX(100) PG 64-28 on Projects
Greater Than 10,000 Tons
Figure 13.54 HMA Overlay Normalized Unit Costs for SX(100) PG 76-28 on Projects
Greater Than 10,000 Tons
y = 79.923x-0.039
R² = 0.0127
0
20
40
60
80
100
0 5,000 10,000 15,000 20,000 25,000 30,000 35,000 40,000 45,000
Unit
Cost
($/T
on)
Tons
Hot Mix Asphalt Overlay for Projects > 10,000 TonsSX(100) PG 64-28
Normalized Dollar Amount per Ton
Normalized Average = $55.33/Ton
y = 64.558x0.0169
R² = 0.0017
0
25
50
75
100
125
0 20,000 40,000 60,000 80,000 100,000 120,000
Unit
Cost
($/T
on)
Tons
Hot Mix Asphalt Overlay for Projects > 10,000 TonsSX(100) PG 76-28
Normalized Dollar Amount per TonNormalized Average = $79.73/Ton
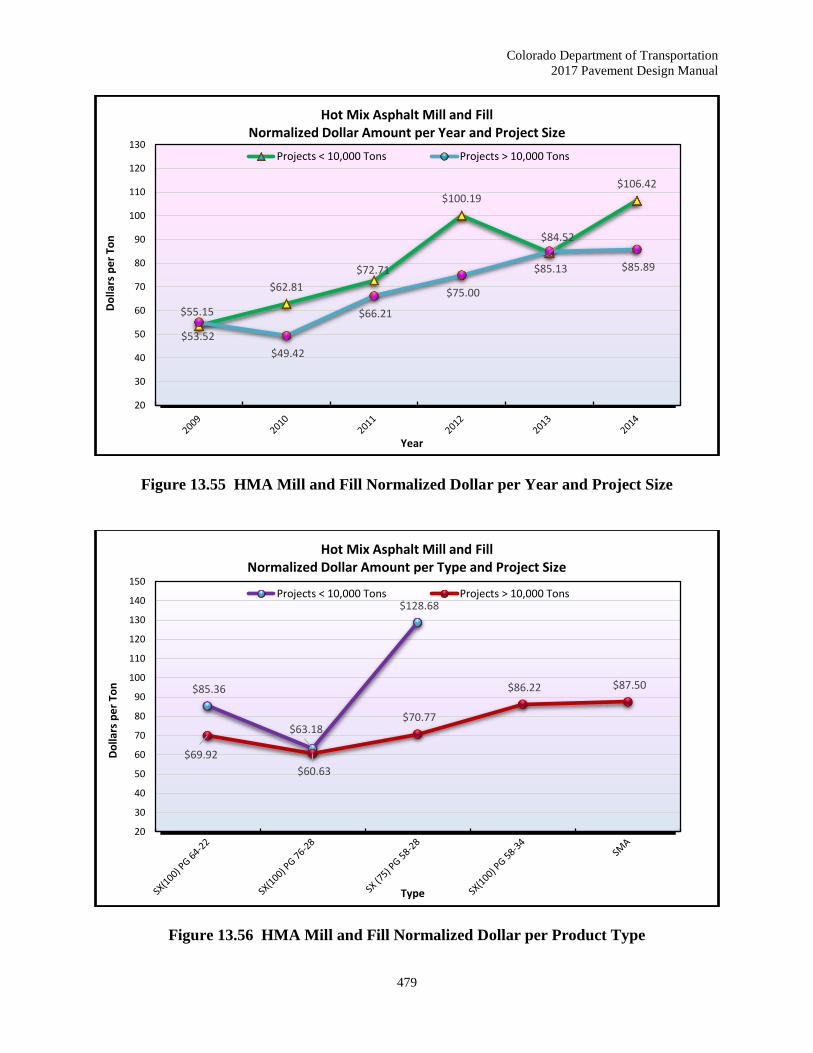
Colorado Department of Transportation
2017 Pavement Design Manual
479
Figure 13.55 HMA Mill and Fill Normalized Dollar per Year and Project Size
Figure 13.56 HMA Mill and Fill Normalized Dollar per Product Type
$53.52
$62.81
$72.71
$100.19
$84.52
$106.42
$55.15
$49.42
$66.21
$75.00
$85.13 $85.89
20
30
40
50
60
70
80
90
100
110
120
130
Do
llars
pe
r To
n
Year
Hot Mix Asphalt Mill and FillNormalized Dollar Amount per Year and Project Size
Projects < 10,000 Tons Projects > 10,000 Tons
$85.36
$63.18
$128.68
$69.92
$60.63
$70.77
$86.22 $87.50
20
30
40
50
60
70
80
90
100
110
120
130
140
150
Do
llars
pe
r To
n
Type
Hot Mix Asphalt Mill and FillNormalized Dollar Amount per Type and Project Size
Projects < 10,000 Tons Projects > 10,000 Tons
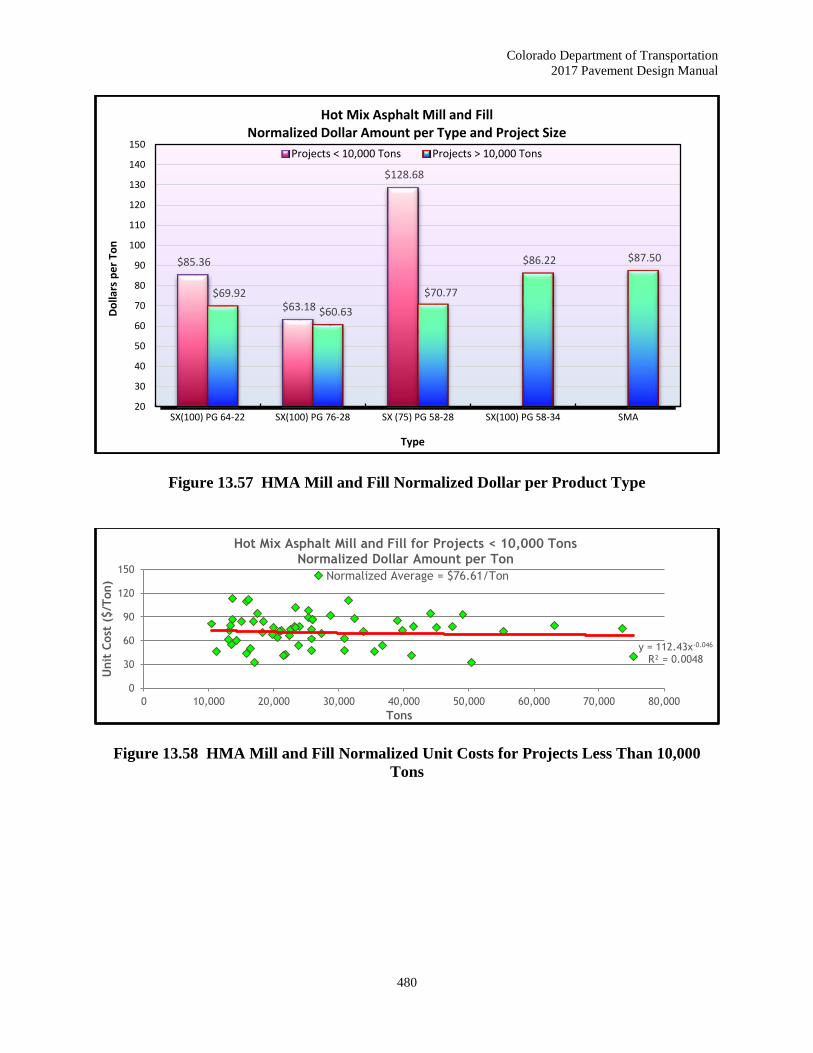
Colorado Department of Transportation
2017 Pavement Design Manual
480
Figure 13.57 HMA Mill and Fill Normalized Dollar per Product Type
Figure 13.58 HMA Mill and Fill Normalized Unit Costs for Projects Less Than 10,000
Tons
$85.36
$63.18
$128.68
$69.92
$60.63
$70.77
$86.22 $87.50
20
30
40
50
60
70
80
90
100
110
120
130
140
150
SX(100) PG 64-22 SX(100) PG 76-28 SX (75) PG 58-28 SX(100) PG 58-34 SMA
Do
llars
pe
r To
n
Type
Hot Mix Asphalt Mill and FillNormalized Dollar Amount per Type and Project Size
Projects < 10,000 Tons Projects > 10,000 Tons
y = 112.43x-0.046
R² = 0.0048
0
30
60
90
120
150
0 10,000 20,000 30,000 40,000 50,000 60,000 70,000 80,000
Unit
Cost
($/T
on)
Tons
Hot Mix Asphalt Mill and Fill for Projects < 10,000 TonsNormalized Dollar Amount per Ton
Normalized Average = $76.61/Ton
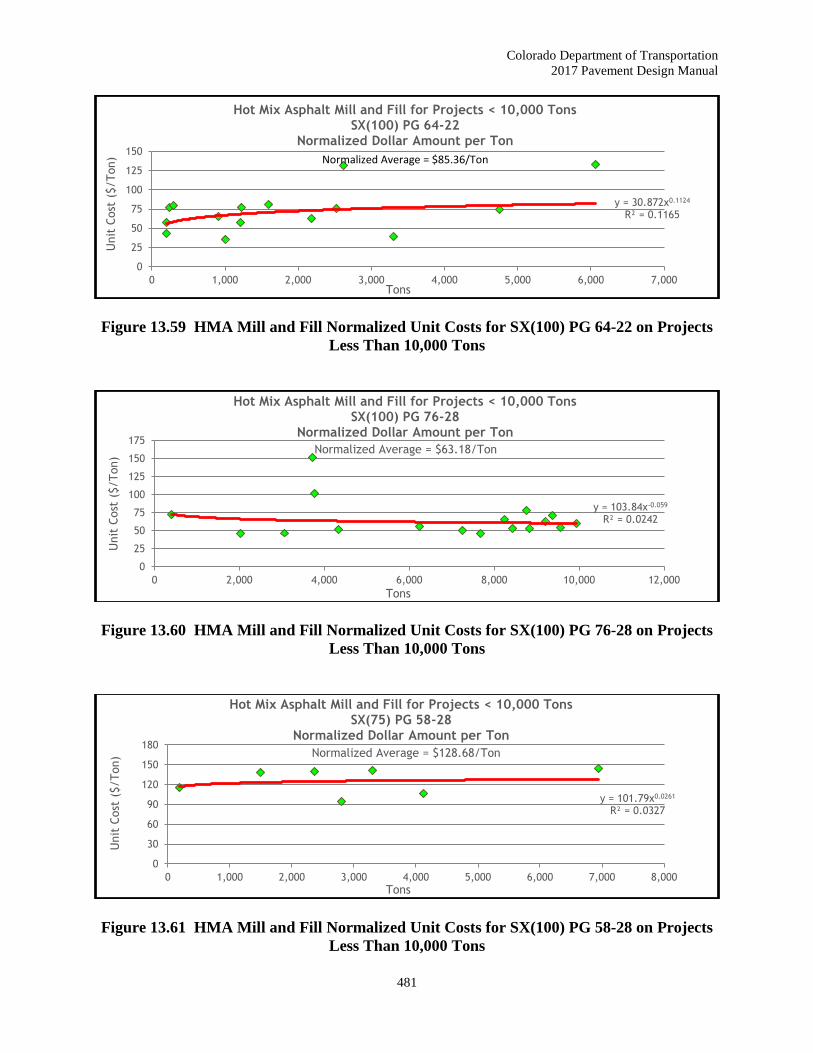
Colorado Department of Transportation
2017 Pavement Design Manual
481
Figure 13.59 HMA Mill and Fill Normalized Unit Costs for SX(100) PG 64-22 on Projects
Less Than 10,000 Tons
Figure 13.60 HMA Mill and Fill Normalized Unit Costs for SX(100) PG 76-28 on Projects
Less Than 10,000 Tons
Figure 13.61 HMA Mill and Fill Normalized Unit Costs for SX(100) PG 58-28 on Projects
Less Than 10,000 Tons
y = 30.872x0.1124
R² = 0.1165
0
25
50
75
100
125
150
0 1,000 2,000 3,000 4,000 5,000 6,000 7,000
Unit
Cost
($/Ton)
Tons
Hot Mix Asphalt Mill and Fill for Projects < 10,000 TonsSX(100) PG 64-22
Normalized Dollar Amount per Ton
Normalized Average = $85.36/Ton
y = 103.84x-0.059
R² = 0.0242
0
25
50
75
100
125
150
175
0 2,000 4,000 6,000 8,000 10,000 12,000
Unit
Cost
($/Ton)
Tons
Hot Mix Asphalt Mill and Fill for Projects < 10,000 TonsSX(100) PG 76-28
Normalized Dollar Amount per Ton
Normalized Average = $63.18/Ton
y = 101.79x0.0261
R² = 0.0327
0
30
60
90
120
150
180
0 1,000 2,000 3,000 4,000 5,000 6,000 7,000 8,000
Unit
Cost
($/Ton)
Tons
Hot Mix Asphalt Mill and Fill for Projects < 10,000 TonsSX(75) PG 58-28
Normalized Dollar Amount per Ton
Normalized Average = $128.68/Ton
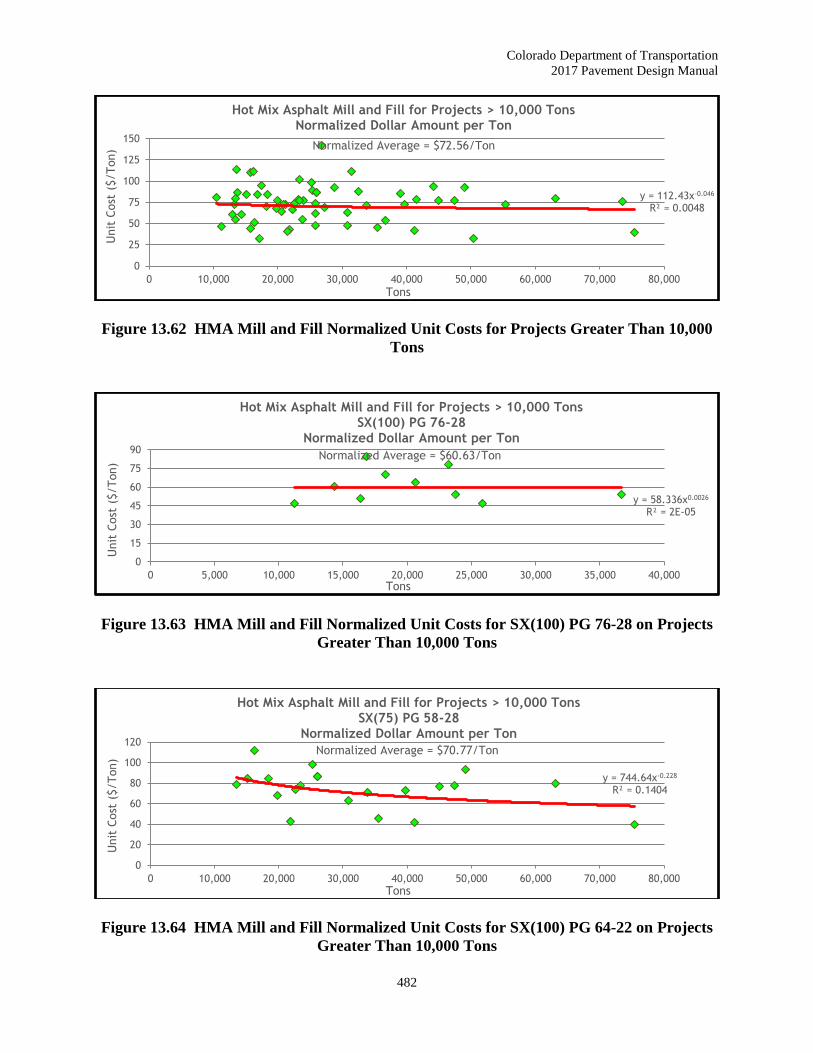
Colorado Department of Transportation
2017 Pavement Design Manual
482
Figure 13.62 HMA Mill and Fill Normalized Unit Costs for Projects Greater Than 10,000
Tons
Figure 13.63 HMA Mill and Fill Normalized Unit Costs for SX(100) PG 76-28 on Projects
Greater Than 10,000 Tons
Figure 13.64 HMA Mill and Fill Normalized Unit Costs for SX(100) PG 64-22 on Projects
Greater Than 10,000 Tons
y = 112.43x-0.046
R² = 0.0048
0
25
50
75
100
125
150
0 10,000 20,000 30,000 40,000 50,000 60,000 70,000 80,000
Unit
Cost
($/Ton)
Tons
Hot Mix Asphalt Mill and Fill for Projects > 10,000 TonsNormalized Dollar Amount per Ton
Normalized Average = $72.56/Ton
y = 58.336x0.0026
R² = 2E-05
0
15
30
45
60
75
90
0 5,000 10,000 15,000 20,000 25,000 30,000 35,000 40,000
Unit
Cost
($/Ton)
Tons
Hot Mix Asphalt Mill and Fill for Projects > 10,000 TonsSX(100) PG 76-28
Normalized Dollar Amount per Ton
Normalized Average = $60.63/Ton
y = 744.64x-0.228
R² = 0.1404
0
20
40
60
80
100
120
0 10,000 20,000 30,000 40,000 50,000 60,000 70,000 80,000
Unit
Cost
($/Ton)
Tons
Hot Mix Asphalt Mill and Fill for Projects > 10,000 TonsSX(75) PG 58-28
Normalized Dollar Amount per Ton
Normalized Average = $70.77/Ton

Colorado Department of Transportation
2017 Pavement Design Manual
483
Figure 13.65 HMA Mill and Fill Normalized Unit Costs for SMA on Projects Greater
Than 10,000 Tons
Figure 13.66 HMA Mill and Fill Normalized Unit Costs for SX(100) PG 64-22 on Projects
Greater Than 10,000 Tons
Figure 13.67 HMA Mill and Fill Normalized Unit Costs for SX(100) PG 58-34 on Projects
Greater Than 10,000 Tons
y = 95.024x-0.01
R² = 0.0004
0
25
50
75
100
125
150
0 10,000 20,000 30,000 40,000 50,000 60,000
Unit
Cost
($/Ton)
Tons
Hot Mix Asphalt Mill and Fill for Projects > 10,000 TonsSMA
Normalized Dollar Amount per Ton
Normalized Average = $87.50/Ton
y = 17.037x0.1331
R² = 0.1845
0
15
30
45
60
75
90
105
0 10,000 20,000 30,000 40,000 50,000 60,000 70,000 80,000
Unit
Cost
($/Ton)
Tons
Hot Mix Asphalt Mill and Fill for Projects > 10,000 TonsSX(100) PG 64-22
Normalized Dollar Amount per Ton
Normalized Average = $69.92/Ton
y = 16573x-0.522
R² = 0.3376
0
20
40
60
80
100
120
140
0 5,000 10,000 15,000 20,000 25,000 30,000 35,000
Unit
Cost
($/Ton)
Tons
Hot Mix Asphalt Mill and Fill for Projects > 10,000 TonsSX(100) PG 58-34
Normalized Dollar Amount per Ton
Normalized Average = $86.22/Ton
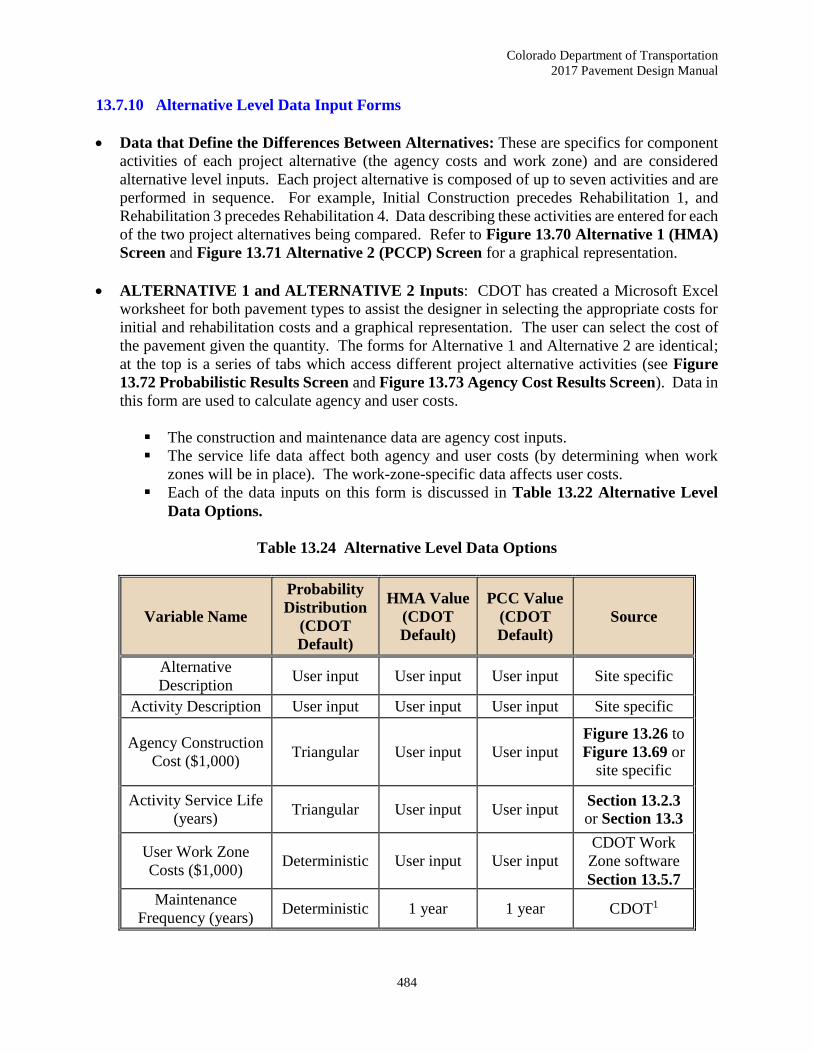
Colorado Department of Transportation
2017 Pavement Design Manual
484
13.7.10 Alternative Level Data Input Forms
Data that Define the Differences Between Alternatives: These are specifics for component
activities of each project alternative (the agency costs and work zone) and are considered
alternative level inputs. Each project alternative is composed of up to seven activities and are
performed in sequence. For example, Initial Construction precedes Rehabilitation 1, and
Rehabilitation 3 precedes Rehabilitation 4. Data describing these activities are entered for each
of the two project alternatives being compared. Refer to Figure 13.70 Alternative 1 (HMA)
Screen and Figure 13.71 Alternative 2 (PCCP) Screen for a graphical representation.
ALTERNATIVE 1 and ALTERNATIVE 2 Inputs: CDOT has created a Microsoft Excel
worksheet for both pavement types to assist the designer in selecting the appropriate costs for
initial and rehabilitation costs and a graphical representation. The user can select the cost of
the pavement given the quantity. The forms for Alternative 1 and Alternative 2 are identical;
at the top is a series of tabs which access different project alternative activities (see Figure
13.72 Probabilistic Results Screen and Figure 13.73 Agency Cost Results Screen). Data in
this form are used to calculate agency and user costs.
The construction and maintenance data are agency cost inputs.
The service life data affect both agency and user costs (by determining when work
zones will be in place). The work-zone-specific data affects user costs.
Each of the data inputs on this form is discussed in Table 13.22 Alternative Level
Data Options.
Table 13.24 Alternative Level Data Options
Variable Name
Probability
Distribution
(CDOT
Default)
HMA Value
(CDOT
Default)
PCC Value
(CDOT
Default)
Source
Alternative
Description User input User input User input Site specific
Activity Description User input User input User input Site specific
Agency Construction
Cost ($1,000) Triangular User input User input
Figure 13.26 to
Figure 13.69 or
site specific
Activity Service Life
(years) Triangular User input User input
Section 13.2.3 or Section 13.3
User Work Zone
Costs ($1,000) Deterministic User input User input
CDOT Work
Zone software
Section 13.5.7
Maintenance
Frequency (years) Deterministic 1 year 1 year CDOT1
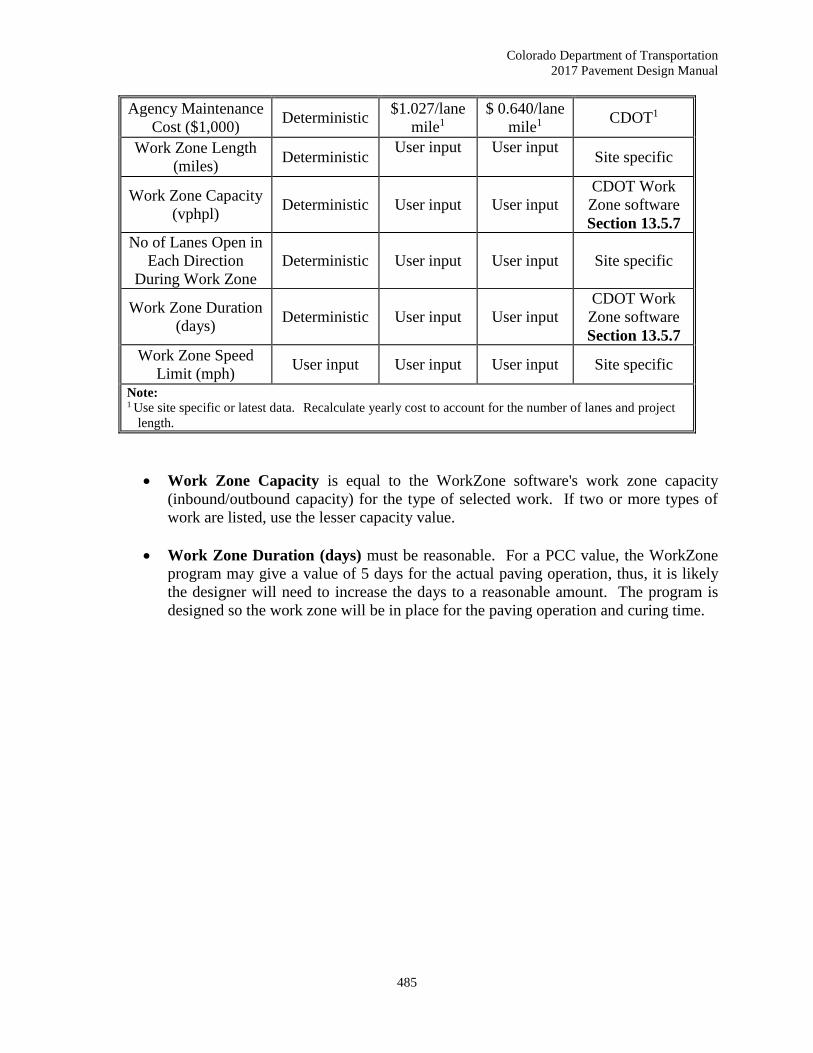
Colorado Department of Transportation
2017 Pavement Design Manual
485
Agency Maintenance
Cost ($1,000) Deterministic
$1.027/lane
mile1
$ 0.640/lane
mile1 CDOT1
Work Zone Length
(miles) Deterministic
User input User input Site specific
Work Zone Capacity
(vphpl) Deterministic User input User input
CDOT Work
Zone software
Section 13.5.7
No of Lanes Open in
Each Direction
During Work Zone
Deterministic User input User input Site specific
Work Zone Duration
(days) Deterministic User input User input
CDOT Work
Zone software
Section 13.5.7
Work Zone Speed
Limit (mph) User input User input User input Site specific
Note: 1 Use site specific or latest data. Recalculate yearly cost to account for the number of lanes and project
length.
Work Zone Capacity is equal to the WorkZone software's work zone capacity
(inbound/outbound capacity) for the type of selected work. If two or more types of
work are listed, use the lesser capacity value.
Work Zone Duration (days) must be reasonable. For a PCC value, the WorkZone
program may give a value of 5 days for the actual paving operation, thus, it is likely
the designer will need to increase the days to a reasonable amount. The program is
designed so the work zone will be in place for the paving operation and curing time.
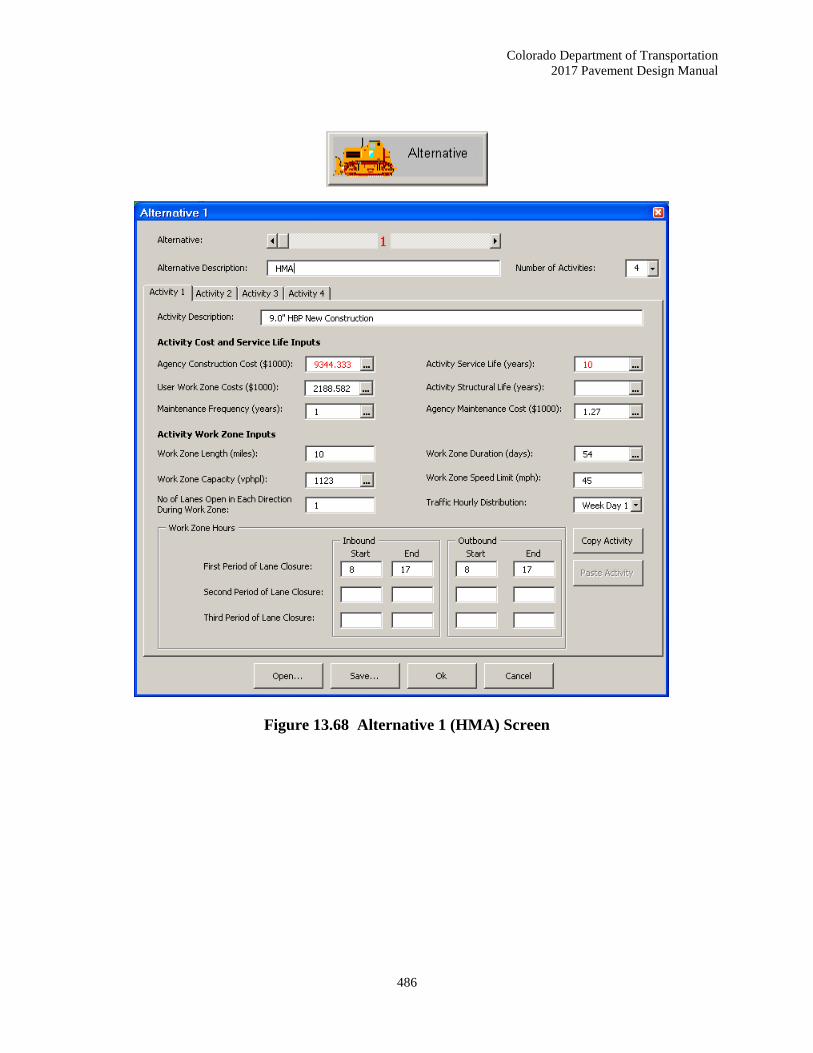
Colorado Department of Transportation
2017 Pavement Design Manual
486
Figure 13.68 Alternative 1 (HMA) Screen
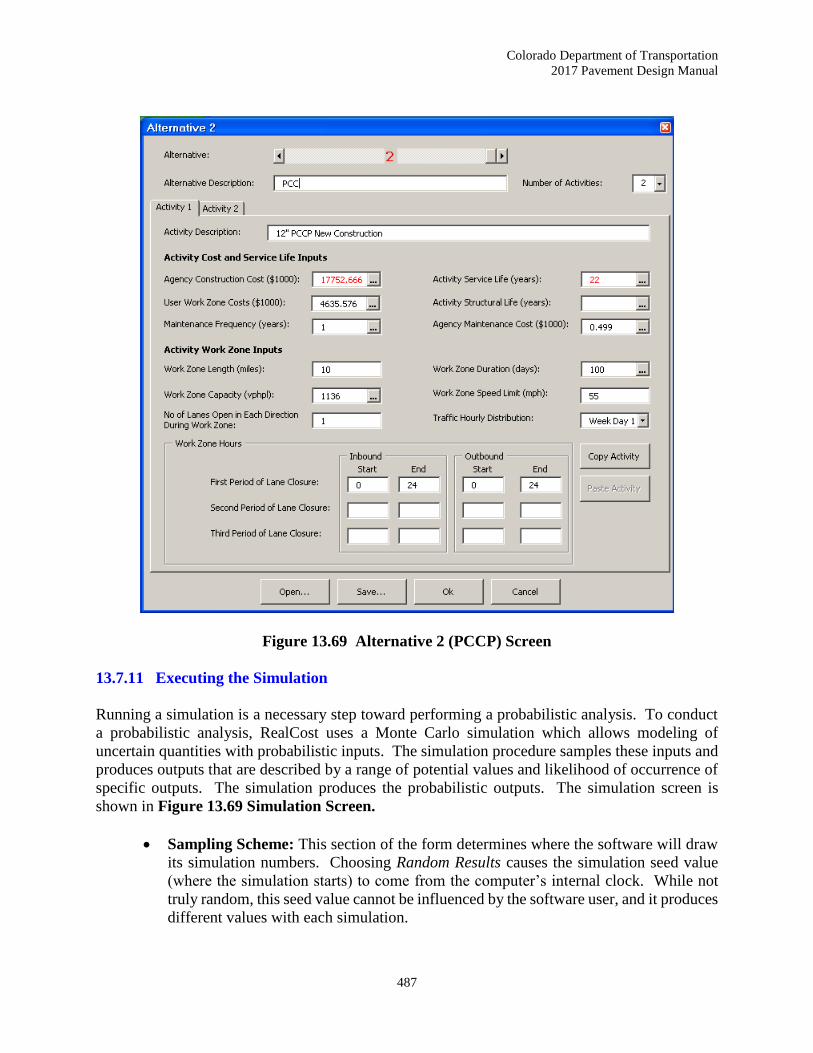
Colorado Department of Transportation
2017 Pavement Design Manual
487
Figure 13.69 Alternative 2 (PCCP) Screen
13.7.11 Executing the Simulation
Running a simulation is a necessary step toward performing a probabilistic analysis. To conduct
a probabilistic analysis, RealCost uses a Monte Carlo simulation which allows modeling of
uncertain quantities with probabilistic inputs. The simulation procedure samples these inputs and
produces outputs that are described by a range of potential values and likelihood of occurrence of
specific outputs. The simulation produces the probabilistic outputs. The simulation screen is
shown in Figure 13.69 Simulation Screen.
Sampling Scheme: This section of the form determines where the software will draw
its simulation numbers. Choosing Random Results causes the simulation seed value
(where the simulation starts) to come from the computer’s internal clock. While not
truly random, this seed value cannot be influenced by the software user, and it produces
different values with each simulation.

Colorado Department of Transportation
2017 Pavement Design Manual
488
Table 13.25 Simulation Data Options
Variable Name Probability Distribution
(CDOT Default)
Value
(CDOT Default) Source
Random Results De-select no RealCost Manual
Reproducible Results Select yes RealCost Manual
Seed Value Deterministic 2,000 RealCost Manual
Number of Iterations Deterministic 2,000 RealCost Manual
Monitor Convergence Select yes RealCost Manual
Monitoring Frequency
(Number of Iterations) Deterministic 50 RealCost Manual
Convergence Tolerance (%) Deterministic 2.5 RealCost Manual
Tail Analysis Percentiles See below RealCost Manual
Percentile 1 Deterministic 5 RealCost Manual
Percentile 2 Deterministic 10 RealCost Manual
Percentile 3 Deterministic 75 CDOT
Percentile 4 Deterministic 95 RealCost Manual
Figure 13.70 Simulation Screen

Colorado Department of Transportation
2017 Pavement Design Manual
489
13.7.12 Analyzing Probabilistic Results
After a simulation run, probabilistic results are available for analysis. A simulation must be run
prior to viewing probabilistic results. Figure 13.72 Probabilistic Results Screen shows the
results of a probabilistic simulation.
Figure 13.71 Probabilistic Results Screen
13.7.13 Analyzing Probabilistic Agency Costs
Agency Costs are critical to an insightful LCCA and are good estimates of the various agency cost
items associated with initial construction, periodic maintenance and rehabilitation activities.
Construction costs pertain to putting the asset into initial service. Data on construction costs are
obtained from historical records, current bids, and engineering judgment (particularly when new
materials and techniques are employed). Refer to Figure 13.73 Agency Cost Results Screen for
a graphical representation of agency costs. Similarly, costs must be attached to the maintenance
and rehabilitation activities identified in the previous steps to maintain the asset above
predetermined conditions, performance, and safety levels. These costs include preventive
activities planned to extend the life of the asset, day-to-day routine maintenance intended to
address safety and operational concerns, and rehabilitation or restoration activities. Another
consideration affecting the total agency cost is the value of the alternative at the end of the analysis
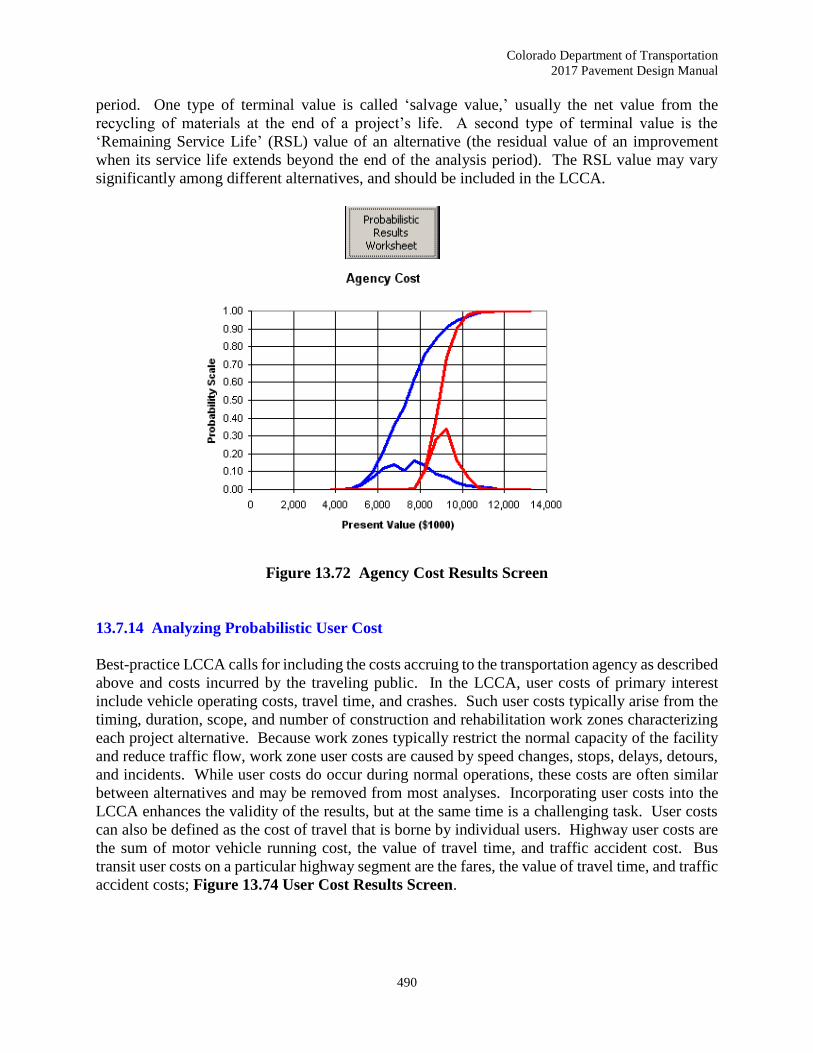
Colorado Department of Transportation
2017 Pavement Design Manual
490
period. One type of terminal value is called ‘salvage value,’ usually the net value from the
recycling of materials at the end of a project’s life. A second type of terminal value is the
‘Remaining Service Life’ (RSL) value of an alternative (the residual value of an improvement
when its service life extends beyond the end of the analysis period). The RSL value may vary
significantly among different alternatives, and should be included in the LCCA.
Figure 13.72 Agency Cost Results Screen
13.7.14 Analyzing Probabilistic User Cost
Best-practice LCCA calls for including the costs accruing to the transportation agency as described
above and costs incurred by the traveling public. In the LCCA, user costs of primary interest
include vehicle operating costs, travel time, and crashes. Such user costs typically arise from the
timing, duration, scope, and number of construction and rehabilitation work zones characterizing
each project alternative. Because work zones typically restrict the normal capacity of the facility
and reduce traffic flow, work zone user costs are caused by speed changes, stops, delays, detours,
and incidents. While user costs do occur during normal operations, these costs are often similar
between alternatives and may be removed from most analyses. Incorporating user costs into the
LCCA enhances the validity of the results, but at the same time is a challenging task. User costs
can also be defined as the cost of travel that is borne by individual users. Highway user costs are
the sum of motor vehicle running cost, the value of travel time, and traffic accident cost. Bus
transit user costs on a particular highway segment are the fares, the value of travel time, and traffic
accident costs; Figure 13.74 User Cost Results Screen.

Colorado Department of Transportation
2017 Pavement Design Manual
491
Figure 13.73 User Cost Results Screen
13.8 Comparing Probabilistic Results
To calculate agency and user cost, the designer must select values that cross both agency and user
cost lines at the 75 percent probability scale. Once the designer has determined both values, a total
of both probabilistic values can be calculated. For example:
Agency Cost
Blue: PCCP Lines 75% PV $13,000,000
Red: HMA Lines 75% PV $18,000,000
User Cost
Blue: PCCP Lines 75% PV $2,000,000
Red: HMA Lines 75% PV $2,000,000
Therefore:
PCCP Present Value at 75% Probability = $13,000,000 + $2,000,000 = $15,000,000
HMA Present Value at 75% Probability = $18,000,000 + $2,000,000 = $20,000.000
Refer to Figure 13.75 Agency-User Cost Results Screens for a graphical representation of the
probability versus agency and user costs.
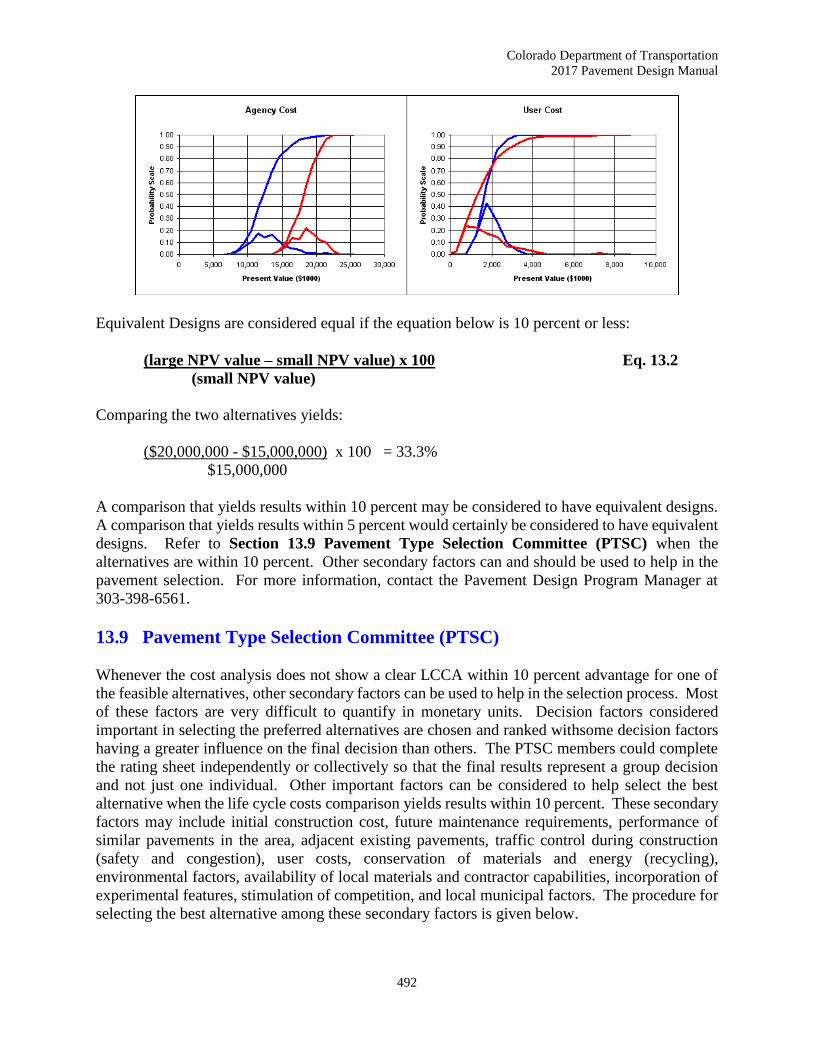
Colorado Department of Transportation
2017 Pavement Design Manual
492
Equivalent Designs are considered equal if the equation below is 10 percent or less:
(large NPV value – small NPV value) x 100 Eq. 13.2
(small NPV value)
Comparing the two alternatives yields:
($20,000,000 - $15,000,000) x 100 = 33.3%
$15,000,000
A comparison that yields results within 10 percent may be considered to have equivalent designs.
A comparison that yields results within 5 percent would certainly be considered to have equivalent
designs. Refer to Section 13.9 Pavement Type Selection Committee (PTSC) when the
alternatives are within 10 percent. Other secondary factors can and should be used to help in the
pavement selection. For more information, contact the Pavement Design Program Manager at
303-398-6561.
13.9 Pavement Type Selection Committee (PTSC)
Whenever the cost analysis does not show a clear LCCA within 10 percent advantage for one of
the feasible alternatives, other secondary factors can be used to help in the selection process. Most
of these factors are very difficult to quantify in monetary units. Decision factors considered
important in selecting the preferred alternatives are chosen and ranked withsome decision factors
having a greater influence on the final decision than others. The PTSC members could complete
the rating sheet independently or collectively so that the final results represent a group decision
and not just one individual. Other important factors can be considered to help select the best
alternative when the life cycle costs comparison yields results within 10 percent. These secondary
factors may include initial construction cost, future maintenance requirements, performance of
similar pavements in the area, adjacent existing pavements, traffic control during construction
(safety and congestion), user costs, conservation of materials and energy (recycling),
environmental factors, availability of local materials and contractor capabilities, incorporation of
experimental features, stimulation of competition, and local municipal factors. The procedure for
selecting the best alternative among these secondary factors is given below.
Colorado Department of Transportation
2017 Pavement Design Manual
493
13.9.1 Purpose
The purpose of the Committee will be to:
Ensure the decision for the pavement type is in alignment with the unique goals of the
project and statewide consistency of decision making.
Provide industry with the opportunity to review the life cycle cost analysis (LCCA)
document.
Formalize the decision process of the Region’s pavement type selection.
Create accountability of the decision of pavement type at the level of Chief Engineer.
Improve credibility of the decision by following a documented process and clearly
communicating the reasons for the decision.
13.9.2 Scope
Reconstruction or new construction of corridor projects with large quantities of pavement where
the initial life cycle cost analysis (LCCA) results indicate the pavement types are within 10 percent
of each other, the percentage difference will be calculated in such a manner that the alternative
with lower the LCCA will be the basis, and therefore will be the LCCA value in the denominator.
13.9.3 Membership
The membership in the PTSC should include all of the following individuals:
Region Materials Engineer and Resident Engineer
Headquarters Pavement Design Program Manager
Region Program Engineer(s) and Transportation Director
Region Maintenance Superintendent
Headquarters Materials and Geotechnical Branch Manager
Headquarters Project Development Branch Manager
Federal Highway Administration’s Pavement and Materials Engineer
13.9.4 Roles of Membership
The following outlines the individual’s roles in the PTSC:
The Region Materials Engineer, Resident Engineer, Region Maintenance
Superintendent and Headquarters Pavement Design Manager and Program Engineer
will be responsible for the technical details including pavement design, costs, truck
traffic, construction timing and sequencing, and the LCCA.
The Program Engineer and Transportation Director will be responsible for identifying
the project goals and the corresponding importance of the elements within the LCCA
to match the project goals.
The Branch Managers will ensure the statewide uniformity of the process and prepare
the documentation of the recommendation that will be forwarded to the Chief Engineer.

Colorado Department of Transportation
2017 Pavement Design Manual
494
The Chief Engineer will make the final decision on the pavement type.
The PTSC will:
Conduct a critical and independent review of the LCCA.
Allow industry a period of 2 weeks to review the committee supported LCCA and
provide written comments regarding the input assumptions.
Review written comments from industry to ensure that they are adequately addressed.
Adjust the LCCA as appropriate. Proceed to the next step if the revised LCCA indicates
the pavement alternatives are within 10 percent.
Create a list of elements that correlate to the corridor project goals. The following
possible elements along with a brief description are shown in Table 13.24 Possible
Elements for Pavement Type Selection Process.
Apply a rating scale, from the most to least important for each element to match the
project goals.
Determine the alternative that the element favors.
Sum the most important elements for each alternative to establish if there is a clear
advantage. If the alternatives have an equal amount of most important goals, run this
step again for the secondary goals, then for the least important if necessary.
Make a recommendation for pavement type to the Chief Engineer.
Table 13.26 Possible Elements for Pavement Type Selection Process
Element Description
Total LCCA Overall cost of the alternative
Initial cost Availability of current funds to construct the corridor project
User cost during construction Adverse effects to the traveling public during the construction phase
User cost during maintenance Future traffic volume may adversely affect the traveling public
Future rehabilitation efforts Feasibility of maintenance funds required for future work
Conservation of materials Recycling the existing materials into the corridor project
Impact to local businesses Access to stores may affect the revenue of the business
Constructability Required construction techniques
Intersections Design issues to ensure structural adequacy
Warranty Benefit of the experimental feature
Evaluation of new technology Advances in technologies may benefit CDOT or the public
Traffic control If multiple phases are anticipated or the closure of one lane versus a
detour
The above process should be completed by the time of the field inspection review meeting.
After the Chief Engineer has concurred with the preferred alternative for the corridor, no changes
to the pavement type will be made unless directed by the Chief Engineer.

Colorado Department of Transportation
2017 Pavement Design Manual
495
References
1. Goldbaum, Jay, Life Cycle Cost Analysis State-of-the-Practice, Final Report, Report No.
CDOT-R1-R-00-3, Colorado Department of Transportation, March 2000.
2. Demos, George Paul, Life Cycle Cost Analysis and Discount Rate on Pavements for the
Colorado Department of Transportation, Final Report, Report No. CDOT-2006-17,
Colorado Department of Transportation, October 2006.
3. Life-Cycle Cost Analysis Primer, Report FHWA IF-02-047, Office of Asset Management,
U.S. Department of Transportation, Federal Highway Administration, 400 7th Street, SW,
Room 3211, Washington, DC 20590, August 2002.
4. Life-Cycle Cost Analysis in Pavement Design - In Search of Better Investment Decisions,
Pavement Division Interim Technical Bulletin, Publication No. FHWA-SA-98-079, U.S.
Department of Transportation, Federal Highway Administration, 400 7th Street, SW,
Washington, DC 20590, September 1998.
5. Economic Analysis Primer, Publication No. FHWA IF-03-032, U.S. Department of
Transportation, Federal Highway Administration, Office of Asset Management, 400 7th
Street, SW, Room 3211, Washington, DC 20590, August 2002.
6. Harris, Scott, Colorado Department for Transportation's Current Procedure for Life Cycle
Cost Analysis and Discount Rate Calculations, Final Report, Report No. CDOT-2009-2,
Colorado Department of Transportation, January 2009.
7. Shuler, Scott and Schmidt, Christopher, Performance Evaluation of Various HMA
Rehabilitation Strategies, Final Report, Report No. CDOT-2008-9, Colorado Department
of Transportation, December 2008.