Embed Size (px)
Citation preview

International Research Journal of Engineering and Technology (IRJET) e-ISSN: 2395-0056
Volume: 05 Issue: 06 | June-2018 www.irjet.net p-ISSN: 2395-0072
© 2018, IRJET | Impact Factor value: 7.211 | ISO 9001:2008 Certified Journal | Page 2983
PAVEMENT MAINTENANCE AND MANAGEMENT OF URBAN
ROADS BY USING HDM-4
Vinod Mashyal1, Saraswati Tirlapur2
1MTECH student, Civil Engineering Dept. Jain College of Engineering, Karnataka, India. 2Prof. Dept. of Civil engineering, Jain College of Engineering, Belagavi, Karnataka, India.
---------------------------------------------------------------------***---------------------------------------------------------------------Abstract - Sustainable development of any country depends upon the type and quantum of road transportation infrastructure provided. Day by day transportation planning in urban and rural is becoming more and more difficult due to the enormous increase in traffic. In our present study, we have taken a stretch of 2.6 km state highway road, mentioned as Belgaum city. The following survey has been carried out: Traffic volume study and Geometrical study of the road for the purpose of collection of data & for the further proceedings the selected road length was subdivided in to 3 stretches of length 1 km, 0.65 km, & 0.95 km, respectively. Traffic volume study was carried out to know the number of vehicles plying on the road. The geometrical study of road was carried out to know the rise and fall and horizontal curvature. The data collected is used to provide the maintenance required for the different road networks using HDM 4 software. Different alternative strategies are evaluated, and the optimum maintenance strategy required for the design life is suggested for implementation.
Key Words: HDM, AADT, MORTH, PMMS, PCU etc.
1. INTRODUCTION
The “Pavement/asphalt Life Cycle” a categorical depiction of how an asphalt interacts with encompassing systems throughout its life which includes several steps like, material production, pavement design, construction, maintenance and preservation and end of life. The pavement maintenance management system (PMMS) is an effective method for assessment and rating the asphalt condition in chosen sections. The system to perform a cost-effectiveness examination of different maintenance and restoration procedures. At last, the system prioritizes and prescribes asphalt restoration and maintenance to maximize results within a given estimated cost. The system implements illustration or computerized field inspection and evaluation of each street section which is then enter into a database. The information is analyzing using software, and gives recommendation and project future circumstances. The pavement management method generates a wear and tear curve for each section based on input then applied the most cost-effective preservation strategy based on circumstance, outer surface type and functional classification, and available fund.
2. LITERATURE REVIEW
Various methods and journal are followed to get proper procedure to execute the case study, most among them are Das Aswathy obtained the accuracy of calibration and how the model represents in realistic condition in HDM-4 software and the results obtained are 25% acceptable for validation. Externalities such as the variation in vehicle emission are also evaluated but are not incorporated in the benefit-cost ratio. Variation in emissions related with increment vehicle delay is normally lower [Mathew J. Korvel ]
3. METHODOLOGY
Sustainable development of any road is mainly depends upon proper infrastructure development. HDM-4 is a software deals with the geometrical study to know rise and fall of road and horizontal curvature. A proper method or quality of work is to be maintained to get better output results. The following are the steps followed in the project work.
The road network which I have selected for project work is having higher traffic volume at which connects to major street networks. The overall selected length of the road for project work is 2.6KM, and geometrical sections are taken. Accordingly speed limit of vehicles is taken from the road users.
Study area
Data collection
Analysis of
volume count
Analysis
Conclusion
Results

International Research Journal of Engineering and Technology (IRJET) e-ISSN: 2395-0056
Volume: 05 Issue: 06 | June-2018 www.irjet.net p-ISSN: 2395-0072
© 2018, IRJET | Impact Factor value: 7.211 | ISO 9001:2008 Certified Journal | Page 2984
A traffic survey is carried out to get the geometrical values classifying as follows
Sections 1 (RTO to CHENNAMMA)- 1KM Section 2 (CHENNAMMA to RLS) – 0.6KM Section 3 (RLS to BOGARWAYS)- 0.95KM
4. DATA COLLECTION
Belgaum city road is selected for my project. i.e. maintenance and management. The entire stretch is around 2.6 km. the overall extent is separated into 3 areas i.e., segment 1 from RTO to Chennamma, segment, 2 from Chennamma to RLS, and segment 3 from RLS to Bogarways as appeared in figures 4.1-4.3 individually. The street profiles like ebb and flow, rise and fall and height are gotten from Google earth.
Fig 4.1 Section 1- RTO to Chennamma
Fig 4.2- Chennamma to RLS
Fig 4.3 RLS to Bogarways
4.1 Mid block traffic survey
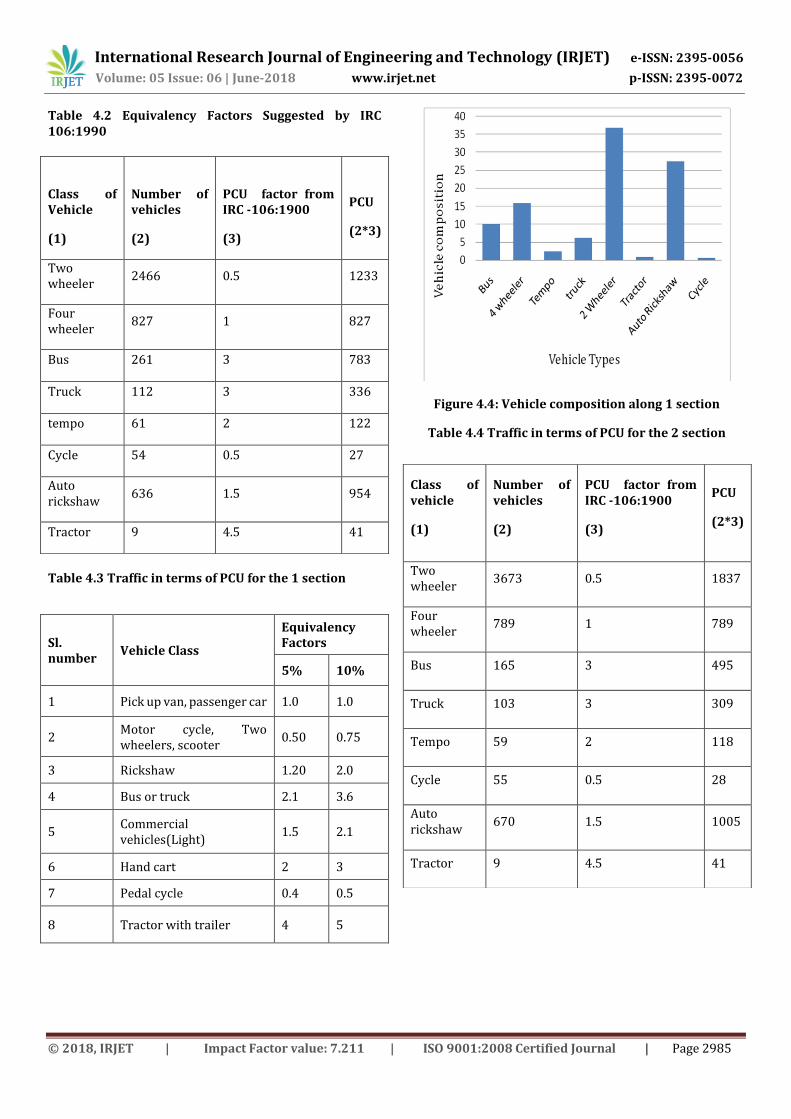
A traffic study is conducted on the chosen street on chosen weekdays i.e. Monday, Tuesday, Wednesday, Thursday for peak hours i.e. from morning 8-12 and evening 4-8. The activity volume is calculated for the chosen areas independently. We have considered 7 sorts of vehicles car, bus, tempo, cycle, truck, tractor, two wheeler, auto rickshaw. PCU (passenger car unit) is calculated for the street utilizing the equivalency components given within the IRC 106:1990 as appeared in table 4.2
International Research Journal of Engineering and Technology (IRJET) e-ISSN: 2395-0056
Volume: 05 Issue: 06 | June-2018 www.irjet.net p-ISSN: 2395-0072
© 2018, IRJET | Impact Factor value: 7.211 | ISO 9001:2008 Certified Journal | Page 2985
Table 4.2 Equivalency Factors Suggested by IRC 106:1990
Table 4.3 Traffic in terms of PCU for the 1 section
Sl. number
Vehicle Class
Equivalency Factors
5% 10%
1 Pick up van, passenger car 1.0 1.0
2 Motor cycle, Two wheelers, scooter
0.50 0.75
3 Rickshaw 1.20 2.0
4 Bus or truck 2.1 3.6
5 Commercial vehicles(Light)
1.5 2.1
6 Hand cart 2 3
7 Pedal cycle 0.4 0.5
8 Tractor with trailer 4 5
Figure 4.4: Vehicle composition along 1 section
Table 4.4 Traffic in terms of PCU for the 2 section
Class of Vehicle
(1)
Number of vehicles
(2)
PCU factor from IRC -106:1900
(3)
PCU
(2*3)
Two wheeler
2466 0.5 1233
Four wheeler
827 1 827
Bus 261 3 783
Truck 112 3 336
tempo 61 2 122
Cycle 54 0.5 27
Auto rickshaw
636 1.5 954
Tractor 9 4.5 41
Class of vehicle
(1)
Number of vehicles
(2)
PCU factor from IRC -106:1900
(3)
PCU
(2*3)
Two wheeler
3673 0.5 1837
Four wheeler
789 1 789
Bus 165 3 495
Truck 103 3 309
Tempo 59 2 118
Cycle 55 0.5 28
Auto rickshaw
670 1.5 1005
Tractor 9 4.5 41

International Research Journal of Engineering and Technology (IRJET) e-ISSN: 2395-0056
Volume: 05 Issue: 06 | June-2018 www.irjet.net p-ISSN: 2395-0072
© 2018, IRJET | Impact Factor value: 7.211 | ISO 9001:2008 Certified Journal | Page 2986
Figure 4.5: Vehicle composition along 2 sections
Table 4.5 Traffic in terms of PCU for the 3 section
Class of vehicle
(1)
Number of vehicles
(2)
PCU factor from IRC -106:1900
(3)
PCU
(2*3)
Two wheeler 3813 0.5 1907
Four wheeler 765 1 765
Bus 157 3 471
Truck 101 3 303
Tempo 51 2 102
Cycle 38 0.5 19
Auto rickshaw 653 1.5 980
Tractor 6 4.5 27
Figure 4.6 Vehicle compositions along 3 sections
5. DATA ANALYSIS
Road system gives the essential, requirements for connecting the different characteristics of street areas. This permits consumer to define different road networks, atria network and to define street/road areas, and it is mainly considered as basic unit of investigation this information organization supported by road system and the details of section selected for project work are detailed in study area.
HDM APPLICATION INCLUDES FOLLOWING STEPS
Creating road network
Creating vehicle fleet
Creating vehicle fleet attributes
IMPORTING AND EXPORTING DATA
Creating new project
Defining various sections
Normal traffic details
Section attributes details
RESULTS
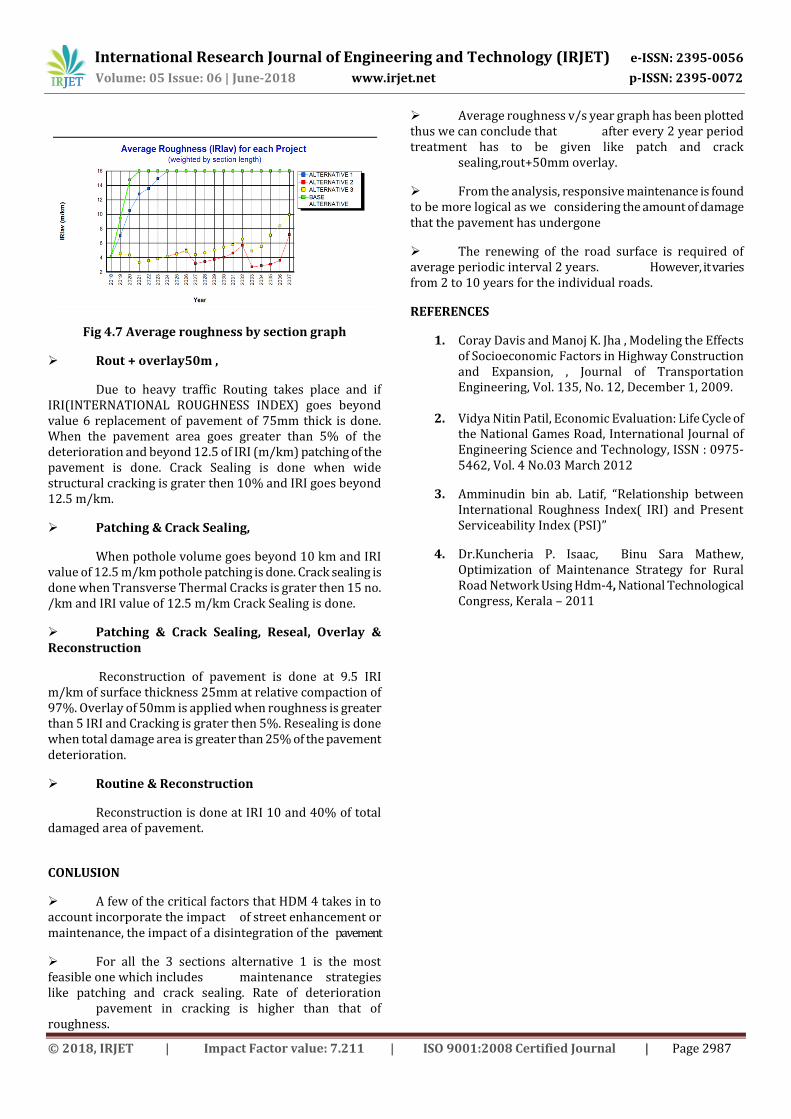
Project analysis is carried out to obtain the results as shown in figures 4.7 respectively. A graph of average roughness v/s time (in years) is obtained. Life cycle analysis is performed and various maintenance and improvements are evaluated and are assigned for the road during the design period of the road also the economic evaluation is done.
International Research Journal of Engineering and Technology (IRJET) e-ISSN: 2395-0056
Volume: 05 Issue: 06 | June-2018 www.irjet.net p-ISSN: 2395-0072
© 2018, IRJET | Impact Factor value: 7.211 | ISO 9001:2008 Certified Journal | Page 2987
Fig 4.7 Average roughness by section graph
Rout + overlay50m ,
Due to heavy traffic Routing takes place and if IRI(INTERNATIONAL ROUGHNESS INDEX) goes beyond value 6 replacement of pavement of 75mm thick is done. When the pavement area goes greater than 5% of the deterioration and beyond 12.5 of IRI (m/km) patching of the pavement is done. Crack Sealing is done when wide structural cracking is grater then 10% and IRI goes beyond 12.5 m/km.
Patching & Crack Sealing,
When pothole volume goes beyond 10 km and IRI value of 12.5 m/km pothole patching is done. Crack sealing is done when Transverse Thermal Cracks is grater then 15 no. /km and IRI value of 12.5 m/km Crack Sealing is done.
Patching & Crack Sealing, Reseal, Overlay & Reconstruction
Reconstruction of pavement is done at 9.5 IRI m/km of surface thickness 25mm at relative compaction of 97%. Overlay of 50mm is applied when roughness is greater than 5 IRI and Cracking is grater then 5%. Resealing is done when total damage area is greater than 25% of the pavement deterioration.
Routine & Reconstruction
Reconstruction is done at IRI 10 and 40% of total damaged area of pavement.
CONLUSION
A few of the critical factors that HDM 4 takes in to account incorporate the impact of street enhancement or maintenance, the impact of a disintegration of the pavement
For all the 3 sections alternative 1 is the most feasible one which includes maintenance strategies like patching and crack sealing. Rate of deterioration pavement in cracking is higher than that of roughness.
Average roughness v/s year graph has been plotted thus we can conclude that after every 2 year period treatment has to be given like patch and crack sealing,rout+50mm overlay.
From the analysis, responsive maintenance is found to be more logical as we considering the amount of damage that the pavement has undergone
The renewing of the road surface is required of average periodic interval 2 years. However, it varies from 2 to 10 years for the individual roads.
REFERENCES
1. Coray Davis and Manoj K. Jha , Modeling the Effects of Socioeconomic Factors in Highway Construction and Expansion, , Journal of Transportation Engineering, Vol. 135, No. 12, December 1, 2009.
2. Vidya Nitin Patil, Economic Evaluation: Life Cycle of the National Games Road, International Journal of Engineering Science and Technology, ISSN : 0975-5462, Vol. 4 No.03 March 2012
3. Amminudin bin ab. Latif, “Relationship between International Roughness Index( IRI) and Present Serviceability Index (PSI)”
4. Dr.Kuncheria P. Isaac, Binu Sara Mathew, Optimization of Maintenance Strategy for Rural Road Network Using Hdm-4, National Technological Congress, Kerala – 2011


![[3673]-101 - unipune.ac.in](https://img.pdfslide.us/doc/110x75/6185e4c4e0fce93d14122ac2/3673-101-.jpg)