Embed Size (px)
Citation preview

Paul Shapshak · Seetharaman Balaji Pandjassarame Kangueane Francesco Chiappelli · Charurut Somboonwit Lynette J. Menezes · John T. Sinnott Editors
Global Virology III: Virology in the 21st Century

Global Virology III: Virology in the 21st Century

Paul Shapshak • Seetharaman Balaji Pandjassarame Kangueane • Francesco Chiappelli Charurut Somboonwit • Lynette J. Menezes John T. SinnottEditors
Global Virology III: Virology in the 21st Century
ISBN 978-3-030-29021-4 ISBN 978-3-030-29022-1 (eBook)https://doi.org/10.1007/978-3-030-29022-1
© Springer Nature Switzerland AG 2019This work is subject to copyright. All rights are reserved by the Publisher, whether the whole or part of the material is concerned, specifically the rights of translation, reprinting, reuse of illustrations, recitation, broadcasting, reproduction on microfilms or in any other physical way, and transmission or information storage and retrieval, electronic adaptation, computer software, or by similar or dissimilar methodology now known or hereafter developed.The use of general descriptive names, registered names, trademarks, service marks, etc. in this publication does not imply, even in the absence of a specific statement, that such names are exempt from the relevant protective laws and regulations and therefore free for general use.The publisher, the authors, and the editors are safe to assume that the advice and information in this book are believed to be true and accurate at the date of publication. Neither the publisher nor the authors or the editors give a warranty, express or implied, with respect to the material contained herein or for any errors or omissions that may have been made. The publisher remains neutral with regard to jurisdictional claims in published maps and institutional affiliations.
This Springer imprint is published by the registered company Springer Nature Switzerland AGThe registered company address is: Gewerbestrasse 11, 6330 Cham, Switzerland
EditorsPaul ShapshakDepartment of Internal MedicineUniversity of South FloridaTampa, FL, USA
Pandjassarame KangueaneBiomedical Informatics 17, Irulan Sandy AnnexPondicherry, Pondicherry, India
Charurut SomboonwitDepartment of Internal MedicineUniversity of South FloridaTampa, FL, USA
John T. SinnottDepartment of Internal MedicineUniversity of South FloridaTampa, FL, USA
Seetharaman BalajiDepartment of BiotechnologyManipal Institute of Technology, Manipal Academy of Higher EducationManipal, Karnataka, India
Francesco ChiappelliOral Biology and Medicine, CHS 63-090UCLA School of Dentistry Oral Biology and Medicine, CHS 63-090Los Angeles, CA, USA
Lynette J. MenezesDepartment of Internal MedicineUniversity of South FloridaTampa, FL, USA
v
Preface
Viral diseases persist and develop with global increased risks for morbidity and mortality, in addition to social and financial disruption. Envelopment by viral dis-ease spread due to global warming is a well-established contributor to these dire straits through increased vector range with multiple viral/microbial spread in addi-tion to social disharmony and concomitant reduction of standards of living.
Answering the need for enhanced methods of study assists research establish-ments to accelerate scientific progress. This book provides readers with snapshots of where various fields are, so that they may be assisted as need be, to join this progress into the twenty-first century. The book is hopefully of help for profession-als, students, and faculty, as well as for the interested reader.
We acknowledge and thank Alison Ball and Deepak Ravi of Springer Publishers for their help and guidance through the steps leading to the production of this book.
Tampa, FL, USA Paul ShapshakManipal, Karnataka, India Seetharaman BalajiPondicherry, Pondicherry, India Pandjassarame KangueaneLos Angeles, CA, USA Francesco ChiappelliTampa, FL, USA Charurut SomboonwitTampa, FL, USA Lynette J. MenezesTampa, FL, USA John T. Sinnott
vii
Introduction
Since the publication of Global Virology Volumes I and II, the need for Global Virology III became apparent because of the increased use and need of novel and forward-looking methods and techniques to accelerate virology research achieve-ments around the globe [1–3].
The use of advanced methods for virology are accomplished, ab initio, as well as by using techniques agglomerated from many different fields, and are thereby used to accelerate application of what is relevant and useful for virology and human health [4–6].
This book provides views of work that has been undertaken and is planned in several fields of virology and is meant to promote current and future work, research, and health. Various fields and methods include virology, immunology, space research, astrovirology/astrobiology, plasmids, swarm intelligence, bioinformatics, data min-ing, machine learning, neural networks, critical equations, and advances in biohazard biocontainment. The use of novel and forward-looking methods, techniques, and approaches in research and development is promoted in this new book.
References
1. Shapshak P, Somboonwit C, Kuhn J, Sinnott JT, editors. Global virology I. Identifying and investigating viral diseases. New York: Springer; 2015.
2. Shapshak P, Levine AJ, Somboonwit C, Foley BT, Singer E, Chiappelli F, Sinnott JT, editors. Global virology II. HIV and NeuroAIDS. New York: Springer; 2017.
3. Shapshak P, Balaji S, Kangueane P, Somboonwit C, Menezes L, Sinnott JT, Chiappelli F, editors. Global virology III. Virology in the 21st century. New York: Springer; 2019.
4. Girimonte D, Izzo D. Chapter 12: Artificial intelligence for space applications. In: Schuster AJ, editor. Intelligent computing everywhere. London: Springer; 2007. p. 235–53.
5. https://www.esa.int/gsp/ACT/doc/AI/pub/ACT-RPR-AI-2007-ArtificialIntelligenceForSpaceApplications.pdf.
6. Narayanan A, Keedwell EC, Olsson B. Artificial intelligence techniques for bioinformatics. Appl Bioinform. 2002. https://pdfs.semanticscholar.org/bf9b/799a81e51a5cfa683f446cc5bcab59e02d1e.pdf.
ix
Contents
Applications of Artificial Intelligence and Machine Learning in Viral Biology . . . . . . . . . . . . . . . . . . . . . . . . . . . . . . . . . . . . . . . . . . . . . . . . 1Sonal Modak, Deepak Sehgal, and Jayaraman Valadi
Non-immune Modulators of Cellular Immune Surveillance to HIV-1 and Other Retroviruses: Future Artificial Intelligence- Driven Goals and Directions . . . . . . . . . . . . . . . . . . . . . . . . . . . 41Francesco Chiappelli, Allen Khakshooy, and Nicole Balenton
Emerging Technologies for Antiviral Drug Discovery . . . . . . . . . . . . . . . . . 59Badireddi Subathra Lakshmi, Mohan Latha Abillasha, and Pandjassarame Kangueane
Wavelet-based Multifractal Spectrum Estimation in Hepatitis Virus Classification Models by Using Artificial Neural Network Approach . . . . 73Yeliz Karaca
Computational Coarse Protein Modeling of HIV-1 Sequences Using Evolutionary Search Algorithm . . . . . . . . . . . . . . . . . . . . . . . . . . . . . 97Sandhya Parasnath Dubey and Seetharaman Balaji
Drug Development for Hepatitis C Virus Infection: Machine Learning Applications . . . . . . . . . . . . . . . . . . . . . . . . . . . . . . . . . . . . . . . . . . . 117Sajitha Lulu Sudhakaran, Deepa Madathil, Mohanapriya Arumugam, and Vino Sundararajan
Modern Developments in Short Peptide Viral Vaccine Design . . . . . . . . . . 131Christina Nilofer, Mohanapriya Arumugam, and Pandjassarame Kangueane
Artificial Life and Therapeutic Vaccines Against Cancers that Originate in Viruses . . . . . . . . . . . . . . . . . . . . . . . . . . . . . . . . . . . . . . . . 149María Elena Escobar-Ospina and Jonatan Gómez
x
Mystery of HIV Drug Resistance: A Machine Learning Perspective . . . . . 307Mohanapriya Arumugam, Nirmaladevi Ponnusamy, Sajitha Lulu Sudhakaran, Vino Sundararajan, and Pandjassarame Kangueane
Swarm Intelligence in Cell Entry Exclusion Phenomena in Viruses and Plasmids: How to Exploit Intelligent Gene Vector Self- Scattering in Therapeutic Gene Delivery . . . . . . . . . . . . . . . . . . . . . . . . . . . . . . . . . . . . 325Oleg E. Tolmachov
A Combinatorial Computational Approach for Drug Discovery Against AIDS: Machine Learning and Proteochemometrics . . . . . . . . . . . 345Sofia D’souza, Prema K. V., and Seetharaman Balaji
Application of Support Vector Machines in Viral Biology . . . . . . . . . . . . . 361Sonal Modak, Swati Mehta, Deepak Sehgal, and Jayaraman Valadi
Eliminating Cervical Cancer: A Role for Artificial Intelligence . . . . . . . . . 405Lynette J. Menezes, Lianet Vazquez, Chilukuri K. Mohan, and Charurut Somboonwit
HIV and Injection Drug Use: New Approaches to HIV Prevention . . . . . . 423Charurut Somboonwit, Lianet Vazquez, and Lynette J. Menezes
Innovative Technologies for Advancement of WHO Risk Group 4 Pathogens Research . . . . . . . . . . . . . . . . . . . . . . . . . . . . . . . . . . . . . 437James Logue, Jeffrey Solomon, Brian F. Niemeyer, Kambez H. Benam, Aaron E. Lin, Zach Bjornson, Sizun Jiang, David R. McIlwain, Garry P. Nolan, Gustavo Palacios, and Jens H. Kuhn
Space Exploration and Travel, Future Technologies for Inflight Monitoring and Diagnostics . . . . . . . . . . . . . . . . . . . . . . . . . . . . . . . . . . . . . . 471Jean-Pol Frippiat
Futuristic Methods in Virus Genome Evolution Using the Third-Generation DNA Sequencing and Artificial Neural Networks . . . . . . . . . . . . . . . . . . . . . . . . . . . . . . . . . . . . . . . . . . . . . . . 485Hyunjin Shim
Futuristic Methods for Treatment of HIV in the Nervous System . . . . . . . 515Allison Navis and Jessica Robinson-Papp
Tuberculosis: Advances in Diagnostics and Treatment . . . . . . . . . . . . . . . . 529Ju Hee Katzman, Mindy Sampson, and Beata Casañas
Astrovirology, Astrobiology, Artificial Intelligence: Extra-Solar System Investigations . . . . . . . . . . . . . . . . . . . . . . . . . . . . . . . . . . . . . . . . . . . 541Paul Shapshak
Contents

xi
Climate Crisis Impact on AIDS, IRIS and Neuro-AIDS . . . . . . . . . . . . . . . 575Francesco Chiappelli, Emma Reyes, and Ruth Toruño
21 st Century Virology: Critical Steps . . . . . . . . . . . . . . . . . . . . . . . . . . . . . . 605Paul Shapshak
Futuristic Methods for Determining HIV Co-receptor Use . . . . . . . . . . . . 625Jacqueline K. Flynn, Matthew Gartner, Annamarie Laumaea, and Paul R. Gorry
Index . . . . . . . . . . . . . . . . . . . . . . . . . . . . . . . . . . . . . . . . . . . . . . . . . . . . . . . . . 665
Contents
1© Springer Nature Switzerland AG 2019P. Shapshak et al. (eds.), Global Virology III: Virology in the 21st Century, https://doi.org/10.1007/978-3-030-29022-1_1
Applications of Artificial Intelligence and Machine Learning in Viral Biology
Sonal Modak, Deepak Sehgal, and Jayaraman Valadi
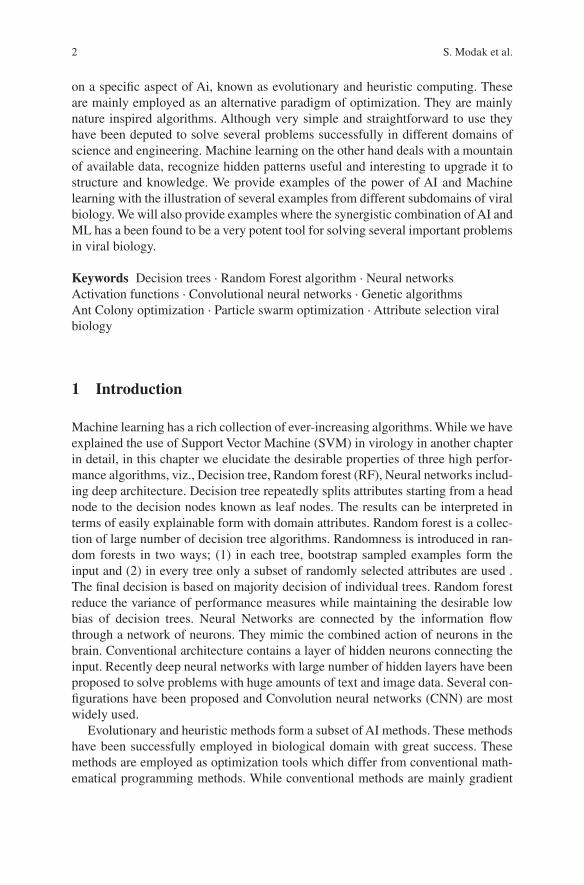
Abstract Present research efforts coupled with improved experimental techniques have provided voluminous genomic data. To convert this data into useful knowl-edge, novel tools for phenomenological and data driven modelling approaches are needed. This need has spurred initiation of a lot of rigorous efforts and has resulted in development of robust artificial intelligence (AI) and machine learning (ML) based models. While these paradigms individually and in synergistic combinations have been employed in various bioinformatics applications, the viral biology disci-pline has particularly benefitted most. These methodologies can efficiently handle single dimensional sequence to higher dimensional protein structures, microarray data, image and text data, experimental data emanating from spectroscopy, etc. Our analysis deals with ML tools like support vector machines (SVM), neural networks, deep neural networks, random forest, and decision tree. Analysis and interpretations are provided along with ample illustrations of their relevance to real-life appli-cations. AI and evolutionary computing based tools like Genetic Algorithms, Ant Colony optimization, Particle swarm optimization and their applicability to viral biology problems are also discussed. Hybrid combination of these tools with ML techniques have resulted in simultaneous selection of informative attributes and high performance classification. This hybrid methodology has been discussed in detail.
In this chapter we describe the applications artificial intelligence and machine learning in virology. While there are AI has a multitude of tools, the focus would be
S. Modak Life Sciences and Healthcare Unit, Persistent Systems Inc., Santa Clara, California, United States
D. Sehgal Life Sciences Department, School of Natural Sciences (SoNS), Shiv Nadar University, Greater Noida, Uttar Pradesh, Indiae-mail: [email protected]
J. Valadi (*) Center for Informatics, School of Natural Sciences (SoNS), Shiv Nadar University, Gautham Buddha Nagar, Uttar Pradesh, India
Centre for Modelling and Simulation, Savitri Bai Phule Pune University, Pune, Indiae-mail: [email protected]; [email protected]
2
on a specific aspect of Ai, known as evolutionary and heuristic computing. These are mainly employed as an alternative paradigm of optimization. They are mainly nature inspired algorithms. Although very simple and straightforward to use they have been deputed to solve several problems successfully in different domains of science and engineering. Machine learning on the other hand deals with a mountain of available data, recognize hidden patterns useful and interesting to upgrade it to structure and knowledge. We provide examples of the power of AI and Machine learning with the illustration of several examples from different subdomains of viral biology. We will also provide examples where the synergistic combination of AI and ML has a been found to be a very potent tool for solving several important problems in viral biology.
Keywords Decision trees · Random Forest algorithm · Neural networks Activation functions · Convolutional neural networks · Genetic algorithms Ant Colony optimization · Particle swarm optimization · Attribute selection viral biology
1 Introduction
Machine learning has a rich collection of ever-increasing algorithms. While we have explained the use of Support Vector Machine (SVM) in virology in another chapter in detail, in this chapter we elucidate the desirable properties of three high perfor-mance algorithms, viz., Decision tree, Random forest (RF), Neural networks includ-ing deep architecture. Decision tree repeatedly splits attributes starting from a head node to the decision nodes known as leaf nodes. The results can be interpreted in terms of easily explainable form with domain attributes. Random forest is a collec-tion of large number of decision tree algorithms. Randomness is introduced in ran-dom forests in two ways; (1) in each tree, bootstrap sampled examples form the input and (2) in every tree only a subset of randomly selected attributes are used . The final decision is based on majority decision of individual trees. Random forest reduce the variance of performance measures while maintaining the desirable low bias of decision trees. Neural Networks are connected by the information flow through a network of neurons. They mimic the combined action of neurons in the brain. Conventional architecture contains a layer of hidden neurons connecting the input. Recently deep neural networks with large number of hidden layers have been proposed to solve problems with huge amounts of text and image data. Several con-figurations have been proposed and Convolution neural networks (CNN) are most widely used.
Evolutionary and heuristic methods form a subset of AI methods. These methods have been successfully employed in biological domain with great success. These methods are employed as optimization tools which differ from conventional math-ematical programming methods. While conventional methods are mainly gradient
S. Modak et al.
3
based methods, evolutionary and heuristic computational methods do not require the evaluation of derivatives. They are simple to use but have rigorous basis and produce reasonably good solutions without having to formulate difficult model equations. In this work we have described mainly three methods, viz., genetic algo-rithms, Ant Colony Optimization and particle swarm optimization. All these meth-ods are population based and provide several equally good solutions and allow the user to choose the solutions most useful. GA is inspired by natural evolution and uses the selection, crossover and mutation mechanisms to iteratively update and arrive at the best possible solution(s). Ant colony optimization is inspired by the cooperative search behaviour of real life ants. Almost blind ants are able to coopera-tively carry out several tasks including optimizing their route to food source and back is due to their capabilities to deposit a chemical known as pheromone . They also get attracted to the pheromone rich trail and enhance the shortest trail in an auto catalytic feedback manner. The swarm behaviour is differently portrayed in Particle swarm optimization where the artificial swarm particles mimic the way in which the real life birds cooperatively synergise their movement adjusting their speed with the swarm. We have elaborated the algorithms of each method, both machine learning and Artificial Intelligence. We have also provided examples to illustrate the use of these algorithms in biology.
2 Decision Tree Algorithm
Decision trees are a class of learning algorithms employed for classification and regression [1, 2]. Starting with a given data set it breaks the set into smaller and smaller subsets simultaneously growing the decision tree. The final tree consists of a head node, intermediate decision nodes and leaf nodes. The leaf nodes provide final outputs and for a classification problem it is the predicted class of any given example. Each example is sent through a tree starting from the head node until the final leaf node following the appropriate branch as per the condition satisfied. For regression problem it is the predicted real value for any given example A two way split of a node results in two children nodes while a three-way split result in three children nodes. Multiway splits are also possible. Leaf node represents a classifica-tion or decision. The topmost decision node in a tree which corresponds to the best predictor attribute is called the root node. Decision trees can handle both categorical and numerical data.
Decision Trees repeatedly split attributes starting from the head node until a leaf node is obtained. For the head node the most informative attribute and the split posi-tion is obtained by using different performance measures like Gini index, mutual information and misclassification error. For example, if attribute values lie between 0–10 the attribute is split at different split points 2, 4, 6 and 8 one by one. Using appropriate logical conditions the goodness of splits are evaluated using different performance measures and the split point with best performance measure and best informative attribute is used to split the head node. At every intermediate node posi-
AI Viral Biology
4
tion the split point and most informative attribute are found in a similar fashion. The leaf node and stopping of splitting are ascertained by different stopping conditions. For example, if all the attributes have similar values or number of examples coming to particular node is less than predetermined value, then splitting is stopped. In this way a decision tree is built.
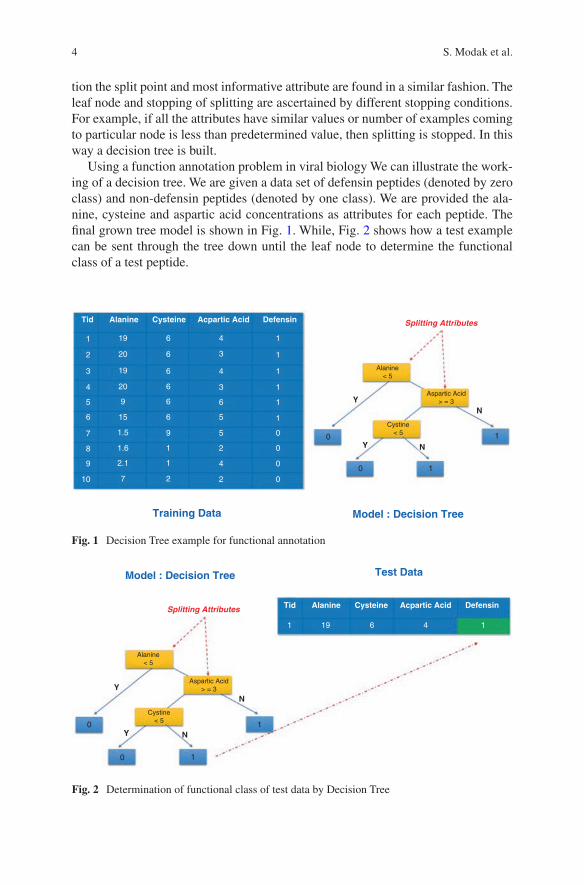
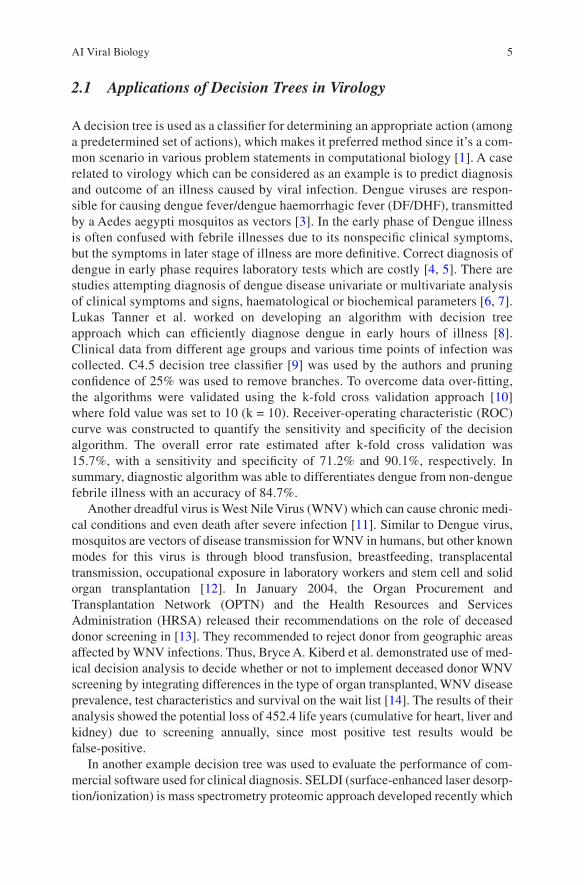
Using a function annotation problem in viral biology We can illustrate the work-ing of a decision tree. We are given a data set of defensin peptides (denoted by zero class) and non-defensin peptides (denoted by one class). We are provided the ala-nine, cysteine and aspartic acid concentrations as attributes for each peptide. The final grown tree model is shown in Fig. 1. While, Fig. 2 shows how a test example can be sent through the tree down until the leaf node to determine the functional class of a test peptide.
Tid Alanine Cysteine Acpartic Acid Defensin
1
2
3
4
5
6
7
8
9
10
19
20
19
20
9
15
1.5
1.6
2.1
7
6
6
6
6
6
6
9
1
1
2
3
3
4
4
6
5
5
2
4
2
1
1
1
1
1
1
0
0
0
0
Splitting Attributes
Alanine< 5
Aspartic Acid> = 3
0
0 1
1N
N
Y
Y
Training Data Model : Decision Tree
Cystine< 5
Fig. 1 Decision Tree example for functional annotation
Splitting Attributes
Model : Decision Tree Test Data
Alanine< 5
Aspartic Acid> = 3
Cystine< 5
Y
Y N
N
1
1
0
0
Tid
1 19 6 4 1
Alanine Cysteine Acpartic Acid Defensin
Fig. 2 Determination of functional class of test data by Decision Tree
S. Modak et al.
5
2.1 Applications of Decision Trees in Virology
A decision tree is used as a classifier for determining an appropriate action (among a predetermined set of actions), which makes it preferred method since it’s a com-mon scenario in various problem statements in computational biology [1]. A case related to virology which can be considered as an example is to predict diagnosis and outcome of an illness caused by viral infection. Dengue viruses are respon-sible for causing dengue fever/dengue haemorrhagic fever (DF/DHF), transmitted by a Aedes aegypti mosquitos as vectors [3]. In the early phase of Dengue illness is often confused with febrile illnesses due to its nonspecific clinical symptoms, but the symptoms in later stage of illness are more definitive. Correct diagnosis of dengue in early phase requires laboratory tests which are costly [4, 5]. There are studies attempting diagnosis of dengue disease univariate or multivariate analysis of clinical symptoms and signs, haematological or biochemical parameters [6, 7]. Lukas Tanner et al. worked on developing an algorithm with decision tree approach which can efficiently diagnose dengue in early hours of illness [8]. Clinical data from different age groups and various time points of infection was collected. C4.5 decision tree classifier [9] was used by the authors and pruning confidence of 25% was used to remove branches. To overcome data over-fitting, the algorithms were validated using the k-fold cross validation approach [10] where fold value was set to 10 (k = 10). Receiver-operating characteristic (ROC) curve was constructed to quantify the sensitivity and specificity of the decision algorithm. The overall error rate estimated after k-fold cross validation was 15.7%, with a sensitivity and specificity of 71.2% and 90.1%, respectively. In summary, diagnostic algorithm was able to differentiates dengue from non-dengue febrile illness with an accuracy of 84.7%.
Another dreadful virus is West Nile Virus (WNV) which can cause chronic medi-cal conditions and even death after severe infection [11]. Similar to Dengue virus, mosquitos are vectors of disease transmission for WNV in humans, but other known modes for this virus is through blood transfusion, breastfeeding, transplacental transmission, occupational exposure in laboratory workers and stem cell and solid organ transplantation [12]. In January 2004, the Organ Procurement and Transplantation Network (OPTN) and the Health Resources and Services Administration (HRSA) released their recommendations on the role of deceased donor screening in [13]. They recommended to reject donor from geographic areas affected by WNV infections. Thus, Bryce A. Kiberd et al. demonstrated use of med-ical decision analysis to decide whether or not to implement deceased donor WNV screening by integrating differences in the type of organ transplanted, WNV disease prevalence, test characteristics and survival on the wait list [14]. The results of their analysis showed the potential loss of 452.4 life years (cumulative for heart, liver and kidney) due to screening annually, since most positive test results would be false-positive.
In another example decision tree was used to evaluate the performance of com-mercial software used for clinical diagnosis. SELDI (surface-enhanced laser desorp-tion/ionization) is mass spectrometry proteomic approach developed recently which
AI Viral Biology
6
potentially can help in biomarker discovery [15, 16]. Attempts have been made for associating such biomarkers with various types of cancers [17–20]. Recent in many studies SELDI data has been used along with machine learning algorithms in iden-tifying protein fingerprints specific for particular cancer which can be effectively used to accurately differentiate cancer from the noncancer groups [21–24]. Antonia Vlahou et al. attempted to evaluate the classification algorithm called biomarker pattern software [BPS], which is commercially available for analysis of the SELDI serum protein profiling data [25]. Total 139 serum sample, 124 were considered for this study out of which 85 were controls and 39 were cancer samples. Randomly set of 15 was selected as learning set out of which 10 were controls and 5 were cancers to form test set for the algorithm. Decision tree that was generated from the learning set to classify the two groups. For evaluation the accuracy of the algorithm in pre-dicting ovarian cancer, ten-fold cross-validation analysis was performed. It yielded 80% of specificity and 84.6% of sensitivity. When test set was processed by the algorithm, 80% of sensitivity and specificity was obtained. In conclusion, this study highlighted some advantages of BPS software and also pointed out some drawbacks like it is prone to data overfitting.
As in many other areas, decisions play an important role also in medicine, espe-cially in medical diagnostic processes. Decision support systems helping physicians are becoming a very important part in medical decision making, particularly in those situations where decision must be made effectively and reliably. Since con-ceptual simple decision making models with the possibility of automatic learning should be considered for performing such tasks, decision trees are a very suitable candidate. They have been already successfully used for many decision-making purposes. As in many other areas, decisions play an important role also in medicine, especially in medical diagnostic processes. Decision support systems helping physi-cians are becoming a very important part in medical decision making, particularly in those situations where decision must be made effectively and reliably. Since con-ceptual simple decision making models with the possibility of automatic learning should be considered for performing such tasks, decision trees are a very suitable candidate. They have been already successfully used for many decision making purposes.
3 Random Forest Algorithm
Random Forest (RF) is an ensemble of randomly constructed independent (and unpruned i.e. fully grown) decision trees [26–28]. It uses bootstrap sampling tech-nique, which is an improved version of bagging. Each tree differs from all others owing to the randomness introduced in RF algorithm in two ways: one in the sample dataset for growing the tree and the other in the choice of the subset of attributes for node splitting while growing each tree. Such a RF is grown in the following manner:
1. From the training data of n examples, draw a bootstrap sample (i.e., randomly sample, with replacement, ‘n’ examples).
S. Modak et al.
7
2. For each bootstrap sample, grow a regression tree with the following modifica-tion: at each node, choose the best split among a randomly selected subset of m (rather than all) features. Each tree is grown to the maximum size.
3. Repeat the above steps until (a sufficiently large number) N such trees are grown.
For each tree, a bootstrap sample (with replacement) is drawn from the original training data set, i.e. a sample is taken from the training data set and is then replaced again in the data set before drawing the next sample. Likewise, ‘n’ numbers of samples are taken to form ‘In-Bag’ data for a particular tree, where ‘n’ is the size of the training data set. The main advantage of bootstrap sampling is to avoid over fit-ting the training data. In each of the Bootstrap training sets, about one-third of the instances are unused for making the ‘In Bag’ data on an average and these are called the Out-Of-Bag (OOB) data for that particular tree. The decision tree is induced using this ‘In-Bag’ data using the CART (Classification and Regression Trees) algo-rithm [2].
Pruning is not necessary in RF, since bootstrap sampling takes care of the over fitting problem. This further reduces the computational load of the RF algorithm. There is no need for a separate test data in RF for checking the overall accuracy of the forest. It uses the OOB data for cross validation. After all the trees are grown, the kth tree classifies the instances that are OOB for that tree (left out by the kth tree). In this manner, each case is classified by about one third of the trees. A majority voting strategy is then employed to decide on the class affiliation of each case. The proportion of times that the voted class is not equal to the true class of case-‘n’, averaged over all the cases in the training data set is called as the OOB error esti-mate. Now after growing the forest, if an unseen validation test dataset is given for regression, each tree in the Random Forest contributes a unit vote. The output of the classifier is determined by a majority vote of the trees. The prediction error rate of the forest, depends on the strength of each tree and the correlation between any two trees in the forest. The key to higher prediction accuracy is to keep low bias and low correlation among the trees. This may be done by adjusting the number of variables randomly selected for each tree (mtry). If the value of ‘mtry’ is decreased, the strength of each tree decreases, but with increase in ‘mtry’ the correlation among the trees increases and the computational load may also increase. The default value of ‘mtry’ is chosen as M/3 for regression problems and M for classification prob-lems, where ‘M’ is the total number of attributes.
The important features of Random Forests are that they can handle most high dimensional and multi-class data easily and the threshold noise limit is more for Random Forest compared to the other algorithms. It can be used even if the number of attributes is more than the number of examples.
3.1 Variable Selection Using Random Forests
Random Forest can also be used to get an estimate of the variables that are less important for prediction. All the cases that are OOB for a particular tree are put down the tree to get a prediction with some votes. Now to get an estimate of vari-
AI Viral Biology
8
able importance, the value of each of the attributes is randomly permuted in the OOB cases of a particular tree and the decrease in the number of votes for the majority voted class is calculated. This decrease in the number of votes, when averaged over all the trees in the forest, gives the raw importance score for that variable. So, higher the raw importance score, greater is the importance of that variable in classification. Thus the raw importance score can be employed for feature ranking.
3.2 Applications of Random Forests in Virology
With the knowledge of all aspects of Random Forest technique, it can effectively use as a tool to construct prediction models for problems in virology domain. One of the most notorious viral strains in influenza A, responsible for at least one major episode of global health threat in a decade. It occasionally breaks the restriction barrier of the primary host, which is mostly animal populations, and infect humans leading to potential pandemic.
Host tropism is a property of viruses which defines its infection specificity to particular hosts and host tissues. Thus, it explains why viruses are only capable of infecting a limited range of host organisms. To greater extent the species bar-rier restricts influenza strains to infect other hosts since new viral stains needs to overcome host range restriction to adapt to a new host. Most important determi-nant of tropism is hemagglutinin protein (HA) receptor specificity on host cells. Studies have already revealed the preference of stains affecting humans recog-nizes a2,6- sialic acid linkage while avian strains preferentially bind receptors of a2,3-sialic acid linkages [29–31]. The second most crucial determinant is PB2 subunit of viral polymerase complex. Host range of influenza viruses can be effi-ciently determined by the amino acid residue residing at position 627 in PB2 [32–34]. Apart from these important factors, comparison of genomic signatures of the hosts [35] and position specific mutations might be explored to evaluate the capability of avian stains infecting humans. Christine LP Eng et al. studied host tropism of influenza A virus proteins using random forest [36]. A combined prediction model was trained using 3272 positive human samples and 3923 nega-tive avian samples, while 799 positive samples and 989 negative samples used as external testing dataset. These proteins sequences were transformed into feature vectors extraction their physicochemical properties. Twenty feature vectors were derived from composition of each of the 20 standard amino acids. The next step of transformation was performed using a method developed by Dubchak et al., in which three descriptors: composition, transition, and distribution, were calcu-lated to globally describe amino acid properties [37, 38]. Training of Random Forest prediction models were conducted using ten- fold cross-validation, where entire dataset is divided into 9 training subsets and 1 testing subset. Grid search approach was employed to fine tune the parameters for best performance. In this comparative study, Random Forest outperformed over Naïve Bayes, k-Nearest
S. Modak et al.
9
Neighbours algorithm (kNN), SVM and Artificial Neural Network (ANN) clas-sifiers, yielding 98.58% prediction accuracy (AUC = 0.996; MCC = 0.972), and hence was chosen as the classifier to train the remaining prediction models for individual proteins.
In another study Yu Wei et al. demonstrated effective use of Random Forest tech-nique in discovery of novel potent targets for developing new drugs to block virus infection [39]. The viral specie targeted for this study was hepatitis C virus (HCV), because its chronic infection can result in chronic liver disease, progressing to cir-rhosis and hepatocellular carcinoma [40]. There is urgent need to develop new anti- HCV drugs because of several critical issues with current HCV therapies, which includes side effects and drug resistances [41]. HCV NS5B polymerase is an RNA- dependent RNA polymerase which plays an important role in replication process of genomic RNA of HCV [42, 43]. Current studies based on X-ray structures of inhibitor- bound HCV NS5B polymerase [44, 45] is proving extremely informative in discovering and developing of new structure-based NS5B polymerase inhibitors. Authors developed a virtual screening workflow that includes random forest, e-pharmacophore, and molecular docking methods to discover a series of novel small molecule NS5B polymerase inhibitor leads. Random Forest method was first used to build the predictive models of the NS5B polymerase inhibitors. Sixteen descriptors were selected, and the overall classification accuracy of the model was 84.4%. The outcome of this study was 5 compounds which showed inhibitory potency against NS5B polymerase with IC50 value of 2.01–23.84 μM. Furthermore these compounds further optimized and developed to be potent and highly active NS5B polymerase inhibitors.
Some studies corelated the increase in incidences of hepatocellular carcinoma (HCC) with increased prevalence of HCV infection [46–48]. The significance of HCV viral infection in the pathogenesis of HCC can be validated by understanding the transition of liver tissues from benign to malignant. Valeria R Mas et al. studied the gene expression patterns of 108 liver tissue samples at different stages, includ-ing normal, cirrhosis, and different HCC stages [49]. For 58 HCV cirrhotic tissues, 863 differentially expressed probe sets were yielded by comparing cirrhotic tissues with (n = 17) and without (n = 41) HCC. There was a need of a classifier to predict whether the HCV cirrhotic tissue was from a patient without HCC versus cirrhotic tissue with HCC. Fifteen probe sets were consistently identified among the random forest classifiers, which helped authors to identify gene signatures that distinguish the pathological stages of HCC and potential molecular markers for early HCC diagnosis in high risk cirrhotic HCV patients.
The predictive power of Random Forest method can also be employed in devel-opment of time series models in disease prediction. A comparative analysis of viral outbreak data was performed by Michael J Kane et al. between an autoregressive integrated moving average (ARIMA) model and Random Forests model [50]. Time series models of both the methods was applied to outbreaks incidence data of avian influenza (H5N1) virus in Egypt. Authors not only found Random Forest model outperforming the ARIMA model in predictive ability, but also inferred that it effec-tive for predicting outbreaks of H5N1 in Egypt.
AI Viral Biology
10
4 Neural Network Algorithm
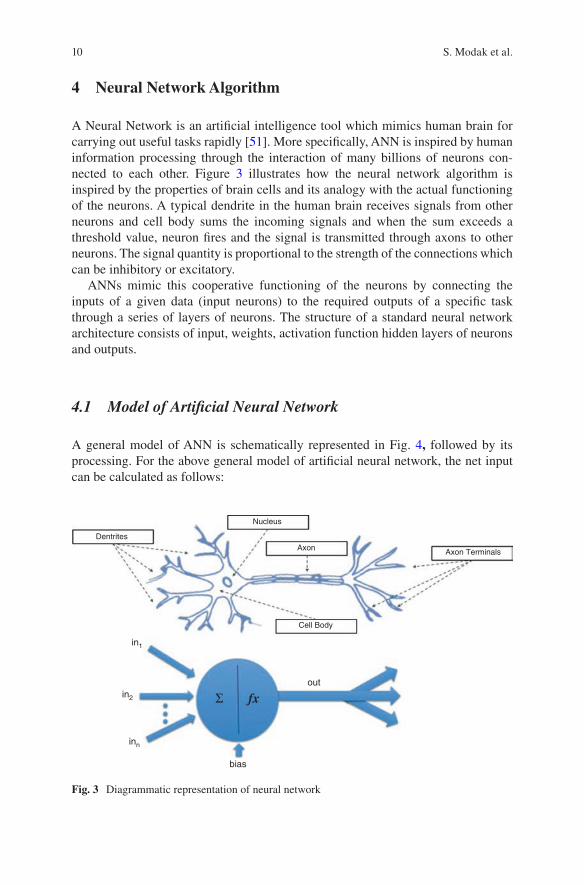
A Neural Network is an artificial intelligence tool which mimics human brain for carrying out useful tasks rapidly [51]. More specifically, ANN is inspired by human information processing through the interaction of many billions of neurons con-nected to each other. Figure 3 illustrates how the neural network algorithm is inspired by the properties of brain cells and its analogy with the actual functioning of the neurons. A typical dendrite in the human brain receives signals from other neurons and cell body sums the incoming signals and when the sum exceeds a threshold value, neuron fires and the signal is transmitted through axons to other neurons. The signal quantity is proportional to the strength of the connections which can be inhibitory or excitatory.
ANNs mimic this cooperative functioning of the neurons by connecting the inputs of a given data (input neurons) to the required outputs of a specific task through a series of layers of neurons. The structure of a standard neural network architecture consists of input, weights, activation function hidden layers of neurons and outputs.
4.1 Model of Artificial Neural Network
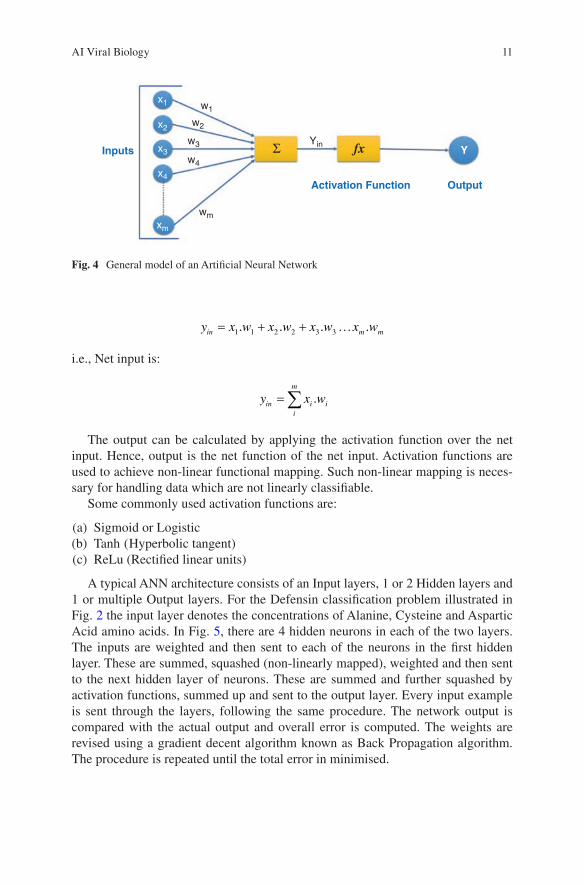
A general model of ANN is schematically represented in Fig. 4, followed by its processing. For the above general model of artificial neural network, the net input can be calculated as follows:
Dentrites
Nucleus
Axon
Cell Body
out
Axon Terminals
bias
in1
in2
inn
Σ fx
Fig. 3 Diagrammatic representation of neural network
S. Modak et al.
11
y x w x w x w x win m m= + + …1 1 2 2 3 3. . . .
i.e., Net input is:
y x win
i
m
i i= ∑ .
The output can be calculated by applying the activation function over the net input. Hence, output is the net function of the net input. Activation functions are used to achieve non-linear functional mapping. Such non-linear mapping is neces-sary for handling data which are not linearly classifiable.
Some commonly used activation functions are:
(a) Sigmoid or Logistic (b) Tanh ( Hyperbolic tangent) (c) ReLu (Rectified linear units)
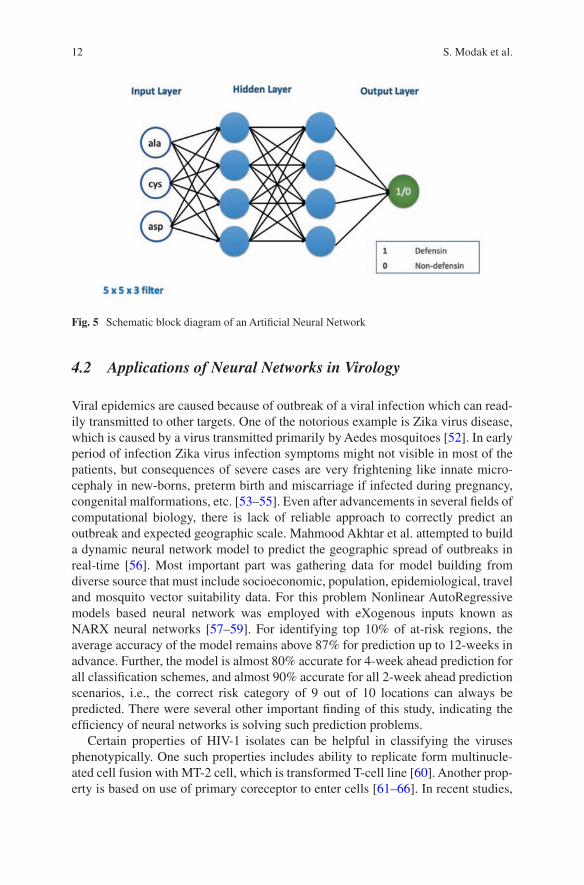
A typical ANN architecture consists of an Input layers, 1 or 2 Hidden layers and 1 or multiple Output layers. For the Defensin classification problem illustrated in Fig. 2 the input layer denotes the concentrations of Alanine, Cysteine and Aspartic Acid amino acids. In Fig. 5, there are 4 hidden neurons in each of the two layers. The inputs are weighted and then sent to each of the neurons in the first hidden layer. These are summed, squashed (non-linearly mapped), weighted and then sent to the next hidden layer of neurons. These are summed and further squashed by activation functions, summed up and sent to the output layer. Every input example is sent through the layers, following the same procedure. The network output is compared with the actual output and overall error is computed. The weights are revised using a gradient decent algorithm known as Back Propagation algorithm. The procedure is repeated until the total error in minimised.
Inputs
Activation Function Output
x1 w1
w2
w3
w4
wm
x2
x3
x4
xm
YinΣ fx Y
Fig. 4 General model of an Artificial Neural Network
AI Viral Biology
12
4.2 Applications of Neural Networks in Virology
Viral epidemics are caused because of outbreak of a viral infection which can read-ily transmitted to other targets. One of the notorious example is Zika virus disease, which is caused by a virus transmitted primarily by Aedes mosquitoes [52]. In early period of infection Zika virus infection symptoms might not visible in most of the patients, but consequences of severe cases are very frightening like innate micro-cephaly in new-borns, preterm birth and miscarriage if infected during pregnancy, congenital malformations, etc. [53–55]. Even after advancements in several fields of computational biology, there is lack of reliable approach to correctly predict an outbreak and expected geographic scale. Mahmood Akhtar et al. attempted to build a dynamic neural network model to predict the geographic spread of outbreaks in real-time [56]. Most important part was gathering data for model building from diverse source that must include socioeconomic, population, epidemiological, travel and mosquito vector suitability data. For this problem Nonlinear AutoRegressive models based neural network was employed with eXogenous inputs known as NARX neural networks [57–59]. For identifying top 10% of at-risk regions, the average accuracy of the model remains above 87% for prediction up to 12-weeks in advance. Further, the model is almost 80% accurate for 4-week ahead prediction for all classification schemes, and almost 90% accurate for all 2-week ahead prediction scenarios, i.e., the correct risk category of 9 out of 10 locations can always be predicted. There were several other important finding of this study, indicating the efficiency of neural networks is solving such prediction problems.
Certain properties of HIV-1 isolates can be helpful in classifying the viruses phenotypically. One such properties includes ability to replicate form multinucle-ated cell fusion with MT-2 cell, which is transformed T-cell line [60]. Another prop-erty is based on use of primary coreceptor to enter cells [61–66]. In recent studies,
Fig. 5 Schematic block diagram of an Artificial Neural Network
S. Modak et al.
13
the V3 region of HIV-1 envelope protein has been identified as a major determinant of coreceptor usage [67–70]. Wolfgang Resch et al. generated neural networks to predict coreceptor usage or MT-2 cell tropism from the amino acid sequence using a subset of positions in V3 [71]. For evaluating exiting methods and by implement-ing neural network, set of MT-2 cell tropism (NSI/SI set), and set of known corecep-tor usage (R5/X4 set) was assembled. Additional features included in this set was the epidemiologic relatedness, which was never considered before in sequence sets used in earlier studies. Neural networks were fully connected feed-forward net-works with 16 sigmoidal input nodes, three hidden sigmoidal nodes, and one linear output node. Amino acids and gaps were encoded numerically by consecutive num-bers from 1 to 21. Training was done using a Bayesian regulation modification of backpropagation and started with random weights [72]. The training target used values of 0 for R5/NSI and 1 for X4/SI. In summary, The mean reliability for X4 prediction of the R5/X4 neural network was 0.69 for 100 subsets of unrelated sequences, a considerable improvement over the reliability of 0.48 achieved by method.
5 Deep Neural Networks
Deep-learning networks differ from conventional neural networks by their depth. Most of the earlier versions were shallow consisting of one input and one output layer, and at most one hidden layer in between. Deep neural networks on the other hand consist of several hidden layers between input and output. Additionally, in deep-learning networks, each layer of nodes trains on a distinct set of features based on the previous layer’s output. With further advancement in layers nodes recognize higher level features. As the further you advance into the neural net, the more com-plex the features your nodes can recognize, since they aggregate and recombine features from the previous layer. CNNs, like conventional neural networks, consists of layers of neurons which receive input data, take a weighted sum and propagates through an activation function. The outputs received from the last layer of hidden neurons is compared with the actual output and the weights are corrected using back propagation algorithm.
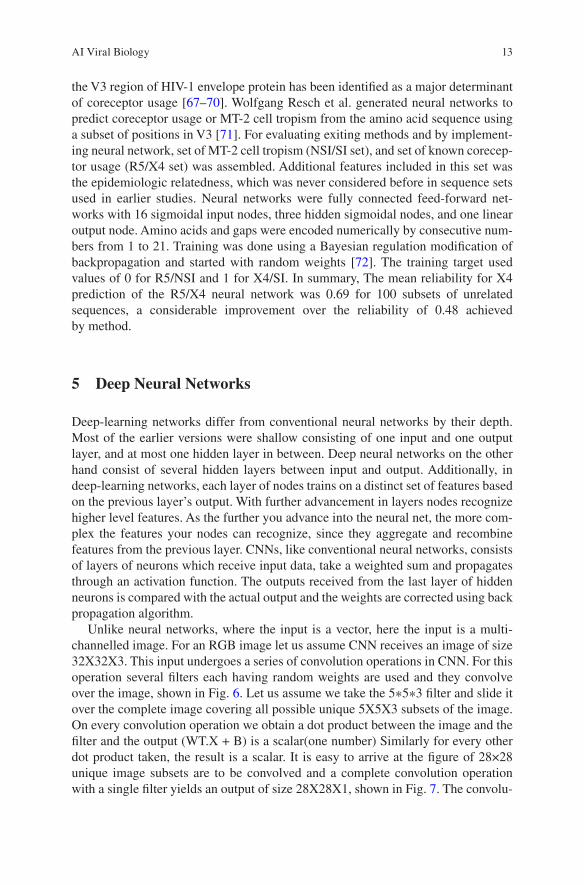
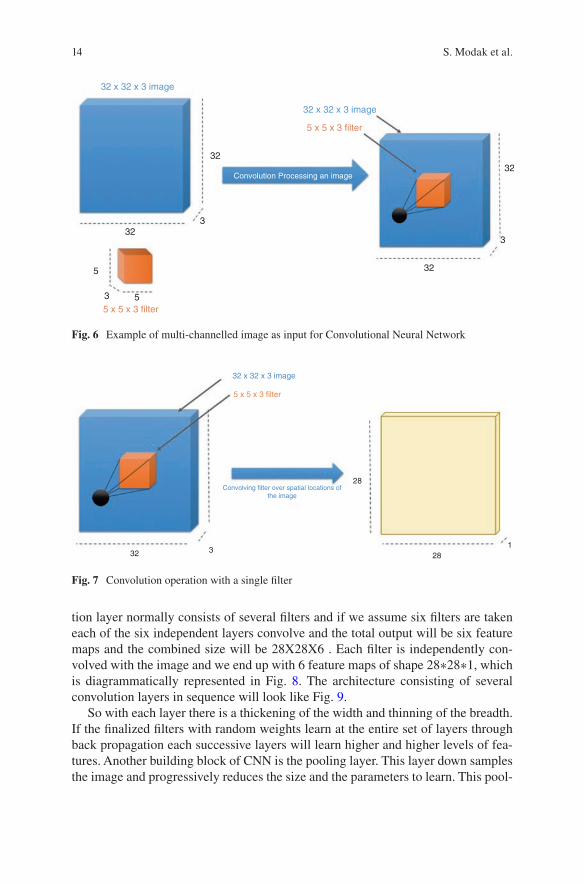
Unlike neural networks, where the input is a vector, here the input is a multi- channelled image. For an RGB image let us assume CNN receives an image of size 32X32X3. This input undergoes a series of convolution operations in CNN. For this operation several filters each having random weights are used and they convolve over the image, shown in Fig. 6. Let us assume we take the 5∗5∗3 filter and slide it over the complete image covering all possible unique 5X5X3 subsets of the image. On every convolution operation we obtain a dot product between the image and the filter and the output (WT.X + B) is a scalar(one number) Similarly for every other dot product taken, the result is a scalar. It is easy to arrive at the figure of 28×28 unique image subsets are to be convolved and a complete convolution operation with a single filter yields an output of size 28X28X1, shown in Fig. 7. The convolu-
AI Viral Biology
14
32 x 32 x 3 image
32 x 32 x 3 image
32
32
32
32
3
5
55 x 5 x 3 filter
5 x 5 x 3 filter
3
3
Convolution Processing an image
Fig. 6 Example of multi-channelled image as input for Convolutional Neural Network
32 x 32 x 3 image
5 x 5 x 3 filter
32 3
28
281
Convolving filter over spatial locations ofthe image
Fig. 7 Convolution operation with a single filter
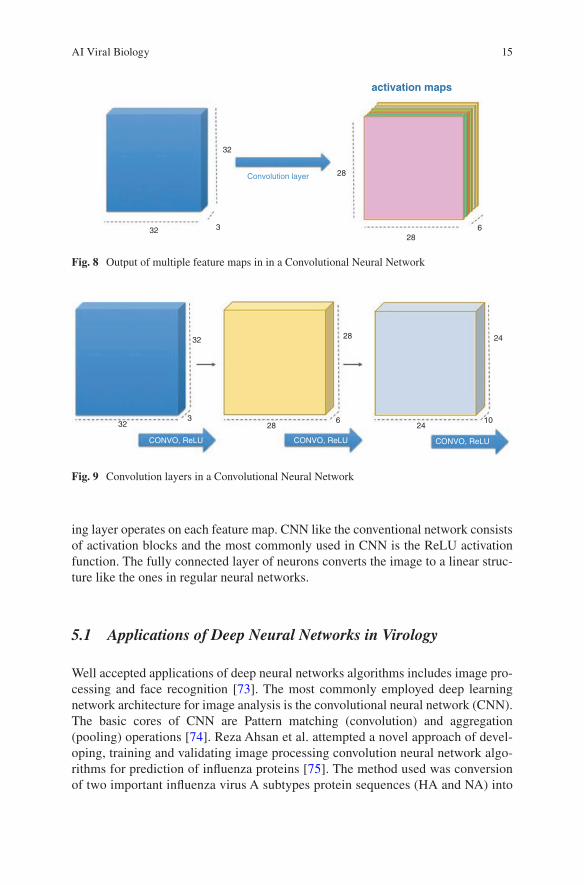
tion layer normally consists of several filters and if we assume six filters are taken each of the six independent layers convolve and the total output will be six feature maps and the combined size will be 28X28X6 . Each filter is independently con-volved with the image and we end up with 6 feature maps of shape 28∗28∗1, which is diagrammatically represented in Fig. 8. The architecture consisting of several convolution layers in sequence will look like Fig. 9.
So with each layer there is a thickening of the width and thinning of the breadth. If the finalized filters with random weights learn at the entire set of layers through back propagation each successive layers will learn higher and higher levels of fea-tures. Another building block of CNN is the pooling layer. This layer down samples the image and progressively reduces the size and the parameters to learn. This pool-
S. Modak et al.
15
activation maps
Convolution layer
32
32 3
28
286
Fig. 8 Output of multiple feature maps in in a Convolutional Neural Network
32
323
286
28
2410
24
CONVO, ReLU CONVO, ReLU CONVO, ReLU
Fig. 9 Convolution layers in a Convolutional Neural Network
ing layer operates on each feature map. CNN like the conventional network consists of activation blocks and the most commonly used in CNN is the ReLU activation function. The fully connected layer of neurons converts the image to a linear struc-ture like the ones in regular neural networks.
5.1 Applications of Deep Neural Networks in Virology
Well accepted applications of deep neural networks algorithms includes image pro-cessing and face recognition [73]. The most commonly employed deep learning network architecture for image analysis is the convolutional neural network (CNN). The basic cores of CNN are Pattern matching (convolution) and aggregation (pooling) operations [74]. Reza Ahsan et al. attempted a novel approach of devel-oping, training and validating image processing convolution neural network algo-rithms for prediction of influenza proteins [75]. The method used was conversion of two important influenza virus A subtypes protein sequences (HA and NA) into
AI Viral Biology
16
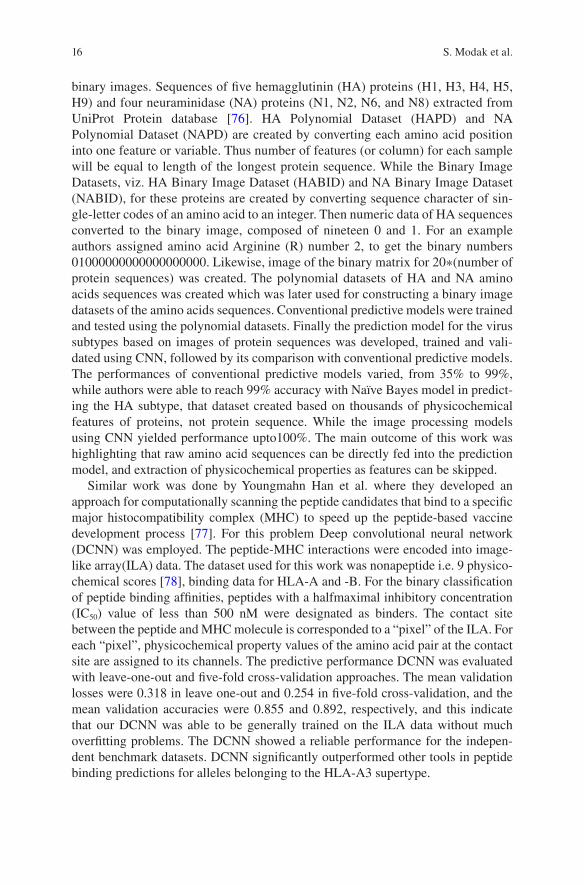
binary images. Sequences of five hemagglutinin (HA) proteins (H1, H3, H4, H5, H9) and four neuraminidase (NA) proteins (N1, N2, N6, and N8) extracted from UniProt Protein database [76]. HA Polynomial Dataset (HAPD) and NA Polynomial Dataset (NAPD) are created by converting each amino acid position into one feature or variable. Thus number of features (or column) for each sample will be equal to length of the longest protein sequence. While the Binary Image Datasets, viz. HA Binary Image Dataset (HABID) and NA Binary Image Dataset (NABID), for these proteins are created by converting sequence character of sin-gle-letter codes of an amino acid to an integer. Then numeric data of HA sequences converted to the binary image, composed of nineteen 0 and 1. For an example authors assigned amino acid Arginine (R) number 2, to get the binary numbers 01000000000000000000. Likewise, image of the binary matrix for 20∗(number of protein sequences) was created. The polynomial datasets of HA and NA amino acids sequences was created which was later used for constructing a binary image datasets of the amino acids sequences. Conventional predictive models were trained and tested using the polynomial datasets. Finally the prediction model for the virus subtypes based on images of protein sequences was developed, trained and vali-dated using CNN, followed by its comparison with conventional predictive models. The performances of conventional predictive models varied, from 35% to 99%, while authors were able to reach 99% accuracy with Naïve Bayes model in predict-ing the HA subtype, that dataset created based on thousands of physicochemical features of proteins, not protein sequence. While the image processing models using CNN yielded performance upto100%. The main outcome of this work was highlighting that raw amino acid sequences can be directly fed into the prediction model, and extraction of physicochemical properties as features can be skipped.
Similar work was done by Youngmahn Han et al. where they developed an approach for computationally scanning the peptide candidates that bind to a specific major histocompatibility complex (MHC) to speed up the peptide-based vaccine development process [77]. For this problem Deep convolutional neural network (DCNN) was employed. The peptide-MHC interactions were encoded into image- like array(ILA) data. The dataset used for this work was nonapeptide i.e. 9 physico-chemical scores [78], binding data for HLA-A and -B. For the binary classification of peptide binding affinities, peptides with a halfmaximal inhibitory concentration (IC50) value of less than 500 nM were designated as binders. The contact site between the peptide and MHC molecule is corresponded to a “pixel” of the ILA. For each “pixel”, physicochemical property values of the amino acid pair at the contact site are assigned to its channels. The predictive performance DCNN was evaluated with leave-one-out and five-fold cross-validation approaches. The mean validation losses were 0.318 in leave one-out and 0.254 in five-fold cross-validation, and the mean validation accuracies were 0.855 and 0.892, respectively, and this indicate that our DCNN was able to be generally trained on the ILA data without much overfitting problems. The DCNN showed a reliable performance for the indepen-dent benchmark datasets. DCNN significantly outperformed other tools in peptide binding predictions for alleles belonging to the HLA-A3 supertype.
S. Modak et al.
17
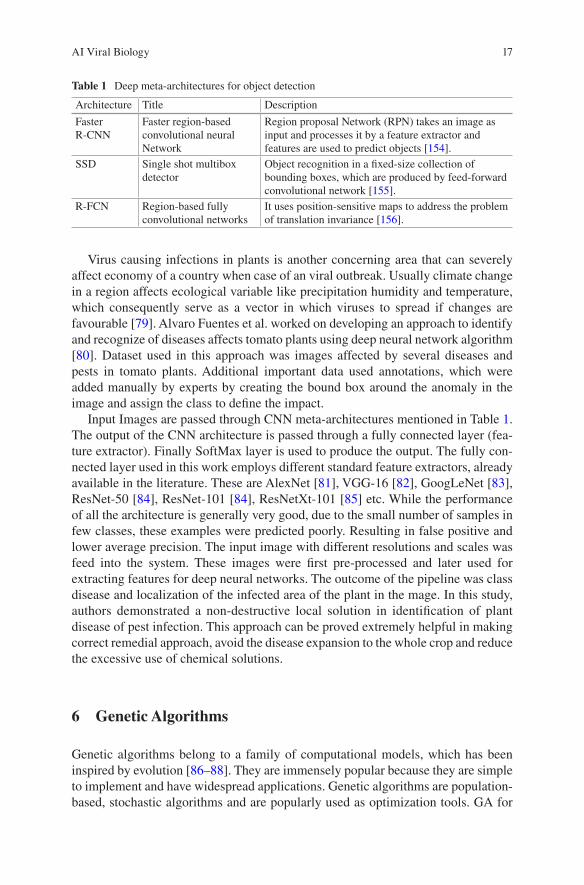
Virus causing infections in plants is another concerning area that can severely affect economy of a country when case of an viral outbreak. Usually climate change in a region affects ecological variable like precipitation humidity and temperature, which consequently serve as a vector in which viruses to spread if changes are favourable [79]. Alvaro Fuentes et al. worked on developing an approach to identify and recognize of diseases affects tomato plants using deep neural network algorithm [80]. Dataset used in this approach was images affected by several diseases and pests in tomato plants. Additional important data used annotations, which were added manually by experts by creating the bound box around the anomaly in the image and assign the class to define the impact.
Input Images are passed through CNN meta-architectures mentioned in Table 1. The output of the CNN architecture is passed through a fully connected layer (fea-ture extractor). Finally SoftMax layer is used to produce the output. The fully con-nected layer used in this work employs different standard feature extractors, already available in the literature. These are AlexNet [81], VGG-16 [82], GoogLeNet [83], ResNet-50 [84], ResNet-101 [84], ResNetXt-101 [85] etc. While the performance of all the architecture is generally very good, due to the small number of samples in few classes, these examples were predicted poorly. Resulting in false positive and lower average precision. The input image with different resolutions and scales was feed into the system. These images were first pre-processed and later used for extracting features for deep neural networks. The outcome of the pipeline was class disease and localization of the infected area of the plant in the mage. In this study, authors demonstrated a non-destructive local solution in identification of plant disease of pest infection. This approach can be proved extremely helpful in making correct remedial approach, avoid the disease expansion to the whole crop and reduce the excessive use of chemical solutions.
6 Genetic Algorithms
Genetic algorithms belong to a family of computational models, which has been inspired by evolution [86–88]. They are immensely popular because they are simple to implement and have widespread applications. Genetic algorithms are population- based, stochastic algorithms and are popularly used as optimization tools. GA for
Table 1 Deep meta-architectures for object detection
Architecture Title Description
Faster R-CNN
Faster region-based convolutional neural Network
Region proposal Network (RPN) takes an image as input and processes it by a feature extractor and features are used to predict objects [154].
SSD Single shot multibox detector
Object recognition in a fixed-size collection of bounding boxes, which are produced by feed-forward convolutional network [155].
R-FCN Region-based fully convolutional networks
It uses position-sensitive maps to address the problem of translation invariance [156].
AI Viral Biology
18
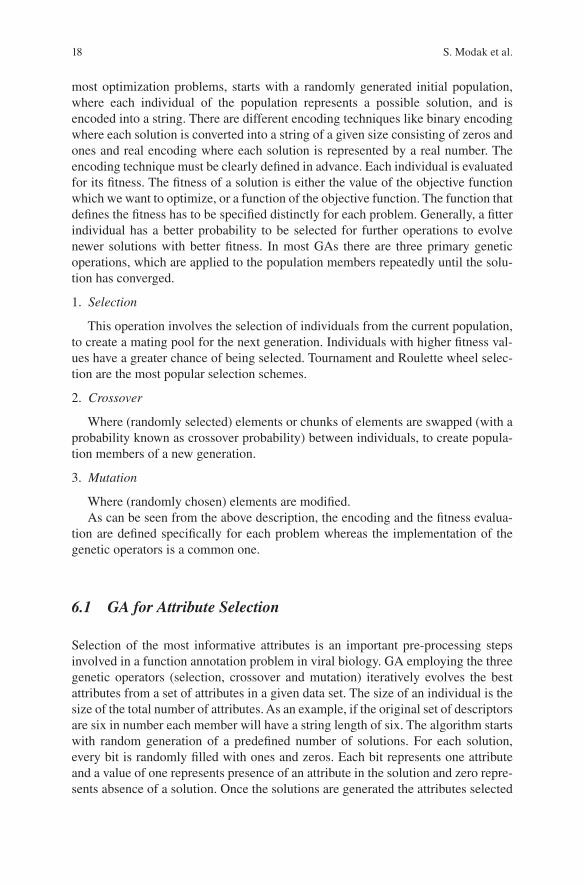
most optimization problems, starts with a randomly generated initial population, where each individual of the population represents a possible solution, and is encoded into a string. There are different encoding techniques like binary encoding where each solution is converted into a string of a given size consisting of zeros and ones and real encoding where each solution is represented by a real number. The encoding technique must be clearly defined in advance. Each individual is evaluated for its fitness. The fitness of a solution is either the value of the objective function which we want to optimize, or a function of the objective function. The function that defines the fitness has to be specified distinctly for each problem. Generally, a fitter individual has a better probability to be selected for further operations to evolve newer solutions with better fitness. In most GAs there are three primary genetic operations, which are applied to the population members repeatedly until the solu-tion has converged.
1. Selection
This operation involves the selection of individuals from the current population, to create a mating pool for the next generation. Individuals with higher fitness val-ues have a greater chance of being selected. Tournament and Roulette wheel selec-tion are the most popular selection schemes.
2. Crossover
Where (randomly selected) elements or chunks of elements are swapped (with a probability known as crossover probability) between individuals, to create popula-tion members of a new generation.
3. Mutation
Where (randomly chosen) elements are modified.As can be seen from the above description, the encoding and the fitness evalua-
tion are defined specifically for each problem whereas the implementation of the genetic operators is a common one.
6.1 GA for Attribute Selection
Selection of the most informative attributes is an important pre-processing steps involved in a function annotation problem in viral biology. GA employing the three genetic operators (selection, crossover and mutation) iteratively evolves the best attributes from a set of attributes in a given data set. The size of an individual is the size of the total number of attributes. As an example, if the original set of descriptors are six in number each member will have a string length of six. The algorithm starts with random generation of a predefined number of solutions. For each solution, every bit is randomly filled with ones and zeros. Each bit represents one attribute and a value of one represents presence of an attribute in the solution and zero repre-sents absence of a solution. Once the solutions are generated the attributes selected
S. Modak et al.
19
in each solution are input to a classifier and the performance is measured in terms of suitable performance measures like Cross Validation (CV) accuracy. After evalua-tion the fitter solutions are selected by a selection process like tournament selection and the crossover process is carried out with a crossover probability on the selected solutions . After this the mutation step is conducted in which each of the bit is flipped (ones to zero and zero to one). This completes one generation and the next and subsequent generations the process of selection, crossover and mutation are conducted . This process is repeated until convergence and the best solution pro-vides the most informative subset of descriptors.
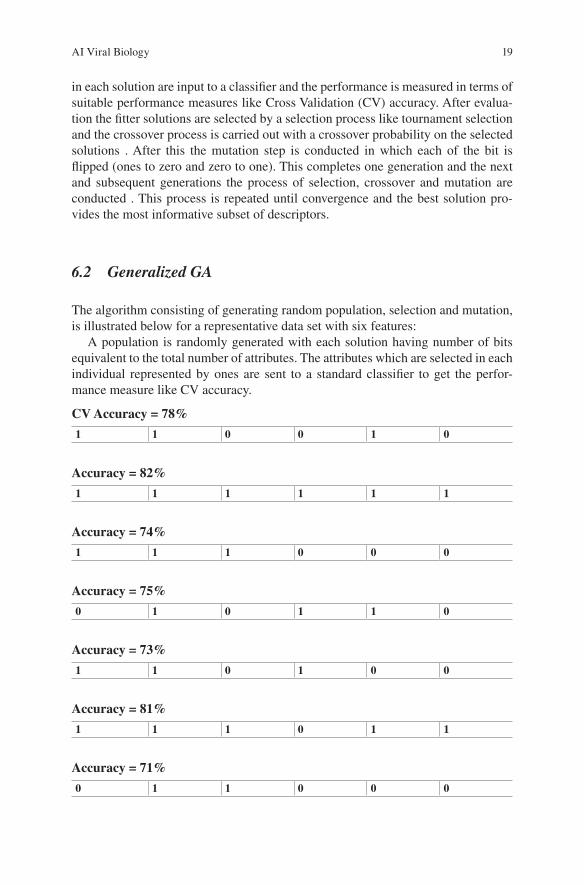
6.2 Generalized GA
The algorithm consisting of generating random population, selection and mutation, is illustrated below for a representative data set with six features:
A population is randomly generated with each solution having number of bits equivalent to the total number of attributes. The attributes which are selected in each individual represented by ones are sent to a standard classifier to get the perfor-mance measure like CV accuracy.
CV Accuracy = 78%
1 1 0 0 1 0
Accuracy = 82%
1 1 1 1 1 1
Accuracy = 74%
1 1 1 0 0 0
Accuracy = 75%
0 1 0 1 1 0
Accuracy = 73%
1 1 0 1 0 0
Accuracy = 81%
1 1 1 0 1 1
Accuracy = 71%
0 1 1 0 0 0
AI Viral Biology
20
Accuracy = 72%
1 0 1 1 0 1
Accuracy = 78%
0 1 1 0 0 1
Accuracy = 74.5%
1 1 0 0 0 1
6.2.1 Selection
Accuracy is directly used as fitness measure and in the selection step solutions are selected based on the selection mechanism. Here we illustrate the process with tour-nament selection process.
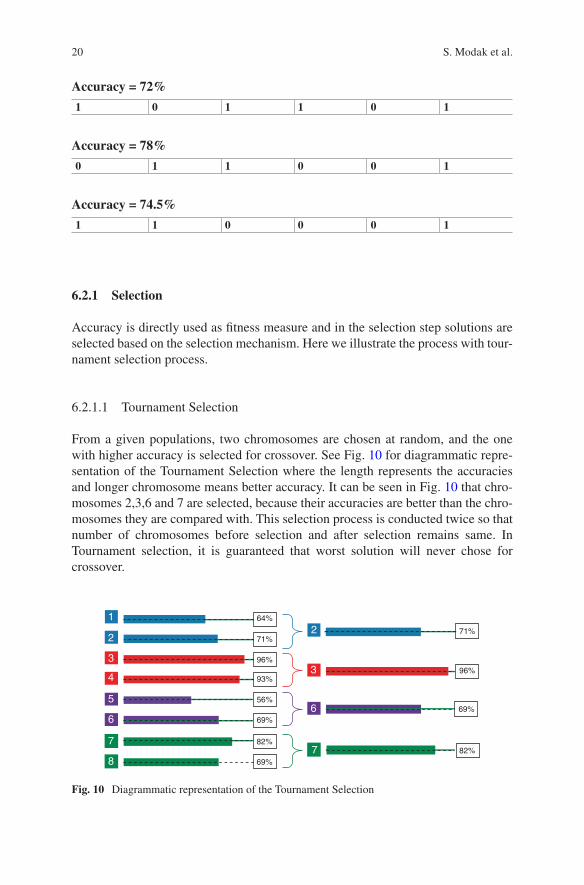
6.2.1.1 Tournament Selection
From a given populations, two chromosomes are chosen at random, and the one with higher accuracy is selected for crossover. See Fig. 10 for diagrammatic repre-sentation of the Tournament Selection where the length represents the accuracies and longer chromosome means better accuracy. It can be seen in Fig. 10 that chro-mosomes 2,3,6 and 7 are selected, because their accuracies are better than the chro-mosomes they are compared with. This selection process is conducted twice so that number of chromosomes before selection and after selection remains same. In Tournament selection, it is guaranteed that worst solution will never chose for crossover.
1
2
3
4
5
6
7
8
64%
71%
96%
93%
56%
69%
82%
69%
2
3
6
7
71%
96%
69%
82%
Fig. 10 Diagrammatic representation of the Tournament Selection
S. Modak et al.
21
6.2.2 Crossover
In the crossover process new solutions are generated from an existing population stochastically. Solutions are chosen at random from population with a crossover probability. There are different types of crossover and the following three are most popular:
1. Single point crossover 2. Multi point crossover 3. Uniform Crossover
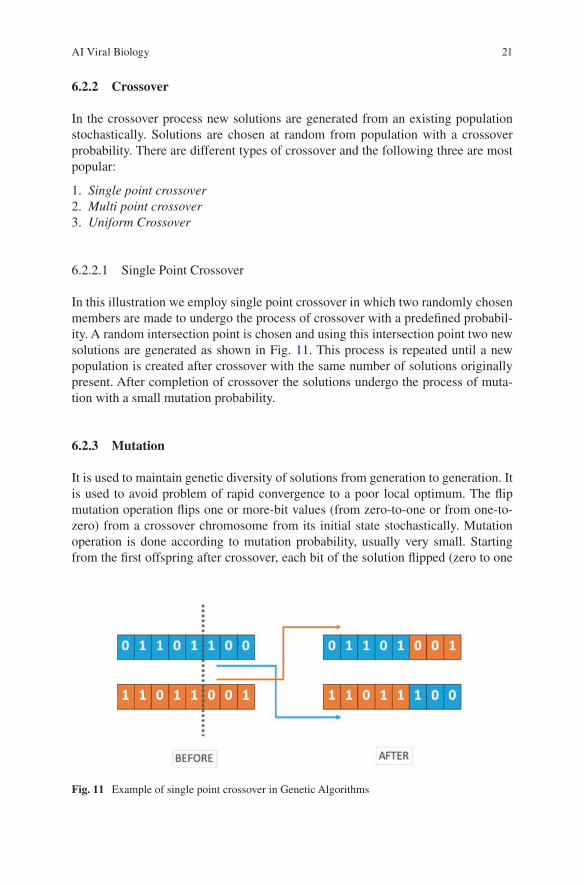
6.2.2.1 Single Point Crossover
In this illustration we employ single point crossover in which two randomly chosen members are made to undergo the process of crossover with a predefined probabil-ity. A random intersection point is chosen and using this intersection point two new solutions are generated as shown in Fig. 11. This process is repeated until a new population is created after crossover with the same number of solutions originally present. After completion of crossover the solutions undergo the process of muta-tion with a small mutation probability.
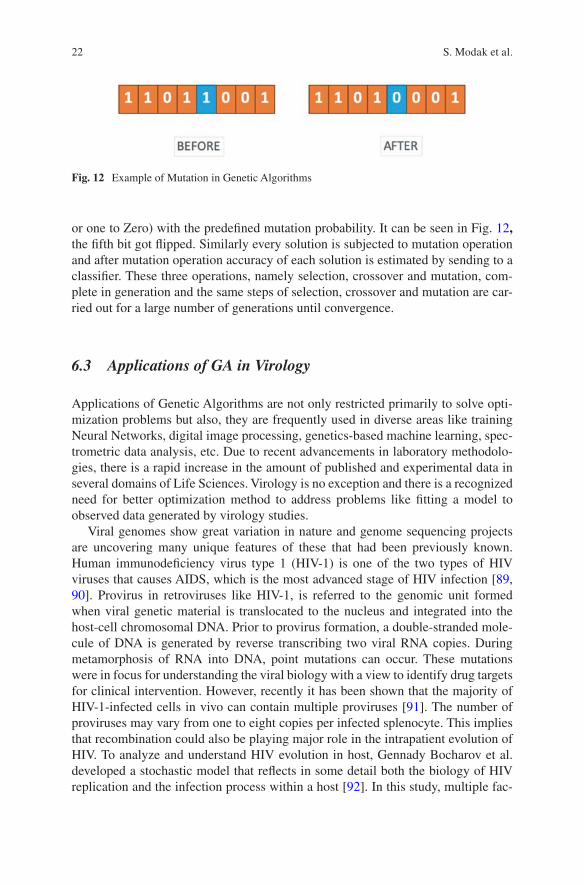
6.2.3 Mutation
It is used to maintain genetic diversity of solutions from generation to generation. It is used to avoid problem of rapid convergence to a poor local optimum. The flip mutation operation flips one or more-bit values (from zero-to-one or from one-to- zero) from a crossover chromosome from its initial state stochastically. Mutation operation is done according to mutation probability, usually very small. Starting from the first offspring after crossover, each bit of the solution flipped (zero to one
Fig. 11 Example of single point crossover in Genetic Algorithms
AI Viral Biology
22
or one to Zero) with the predefined mutation probability. It can be seen in Fig. 12, the fifth bit got flipped. Similarly every solution is subjected to mutation operation and after mutation operation accuracy of each solution is estimated by sending to a classifier. These three operations, namely selection, crossover and mutation, com-plete in generation and the same steps of selection, crossover and mutation are car-ried out for a large number of generations until convergence.
6.3 Applications of GA in Virology
Applications of Genetic Algorithms are not only restricted primarily to solve opti-mization problems but also, they are frequently used in diverse areas like training Neural Networks, digital image processing, genetics-based machine learning, spec-trometric data analysis, etc. Due to recent advancements in laboratory methodolo-gies, there is a rapid increase in the amount of published and experimental data in several domains of Life Sciences. Virology is no exception and there is a recognized need for better optimization method to address problems like fitting a model to observed data generated by virology studies.
Viral genomes show great variation in nature and genome sequencing projects are uncovering many unique features of these that had been previously known. Human immunodeficiency virus type 1 (HIV-1) is one of the two types of HIV viruses that causes AIDS, which is the most advanced stage of HIV infection [89, 90]. Provirus in retroviruses like HIV-1, is referred to the genomic unit formed when viral genetic material is translocated to the nucleus and integrated into the host-cell chromosomal DNA. Prior to provirus formation, a double-stranded mole-cule of DNA is generated by reverse transcribing two viral RNA copies. During metamorphosis of RNA into DNA, point mutations can occur. These mutations were in focus for understanding the viral biology with a view to identify drug targets for clinical intervention. However, recently it has been shown that the majority of HIV-1-infected cells in vivo can contain multiple proviruses [91]. The number of proviruses may vary from one to eight copies per infected splenocyte. This implies that recombination could also be playing major role in the intrapatient evolution of HIV. To analyze and understand HIV evolution in host, Gennady Bocharov et al. developed a stochastic model that reflects in some detail both the biology of HIV replication and the infection process within a host [92]. In this study, multiple fac-
Fig. 12 Example of Mutation in Genetic Algorithms
S. Modak et al.
23
tors impacting the viral evolution has to be considered to mimic real HIV infection. These factors include the extent of virus expansion and degradation, selection pro-cesses and the multiplicity of infected cells. Thus, genetic algorithms fits perfectly here to take into account all factors as variation operators and simulate viral evolu-tion. Genetic algorithms proved effective in segregating the contribution of the inherently linked processes of multi-infection and recombination. The model devel-oped by the authors in this work, provides a versatile platform for predicting the response of HIV towards therapeutic interventions.
Genomics studies have revealed the sequence of molecular events in the replica-tion cycle of the HIV [93], including the following seven steps:
(i) viral entry (ii) reverse transcription (iii) integration (iv) gene expression (v) assembly (vi) budding (vii) and maturation
To design strategies to inhibit the HIV replication or develop effective antiviral agents, each individual step within the HIV life cycle may be used as a potential target. Antiviral chemotherapy is effective in some extent to supress the infection, but it comes with deleterious side effects. Styrylquinoline derivatives are class of compounds, which at non-toxic concentrations shown to inhibit integration activity in vitro and to block viral replication [94]. Nasser Goudarzi et al. used genetic lgo-rithms for descriptor selection in quantitative structure–activity relationships (QSAR) based study to understand the pharmacophore properties of styrylquinoline derivatives and to design inhibitors of HIV-1 integrase [95]. Two factors which gov-erns the predictive accuracy of QSAR models are: predictive model selected, and descriptor selection that sufficiently represent the structural information. Thus genetic algorithm–multiple linear regression (GA–MLR) was considered as best option for predicting the anti-HIV activity (pIC50) values of styrylquinoline deriva-tives. For this work pIC50 values of for 36 molecules of styrylquinoline derivatives from the literature [96] were taken. GA process first generated random feature sub-sets of the molecule, followed by subset-wise evaluation of selected descriptors for fitness to predict pIC50. Based on the fitness GA operators of selection, crossover and mutation were repeatedly applied to get better subsets of descriptors, as itera-tion proceeded. After convergence, GA narrowed down the search from 302 descrip-tors to 7 best descriptors by iterating 100 generation of simulation, on population size 64, mutation rate 0.005, and cross-over 0.6. The correlation coefficients (R2) GA–MLR model for training set was 0.9519 while for test set it was 0.7977. The results of this study provided enough information related to different molecular properties, which can participate in the physicochemical process that affected the HIV inhibition activity of styrylquinoline derivatives.
Similar work has been done by Yong Cong et al., where another variant of GA with Partial Least Square (GA–PLS) was employed to select best descriptor subset
AI Viral Biology
24
for QSAR modeling in a linear model to study influenza virus neuraminidase (H1N1) inhibitors [97]. In this work SVM (GA-SVM) was used to build regression model to evaluate structural and physicochemical features of compounds contribut-ing to the influenza virus NA inhibitory activity. Data used by this group was 108 compounds with carbocyclic and flavonoid scaffolds, which have clear inhibitory activity against influenza virus strain A/PR/8/34 (H1N1) reported in the literature [98–105]. Further, these compounds were separated into the training set (80 com-pounds) and test set (28 compounds) based on their similarity and distribution in the chemical space. The chemical space here denotes the used structural and chemical descriptors [106]. GA generated random population to subsets of descriptors and these descriptors were evaluated by GA-PLS to calculate the fitness, fitness operator described before. After large number of iterations of subsequent evaluation, best top 9 descriptors were found to give the highest performance. These selected 9 descrip-tors were used by GA-SVM to create regression models. Here GA was used to select best set of kernel parameters, to provide the highest correlation coefficient (R) of 0.9189 for the training set. While the correlation coefficient values achieved for testing set was 0.9415. for the testing set. Thus, authors demonstrated how com-binatory methods can be effectively used to address complex problems like investi-gating inhibitory activity of compounds against of viral proteins, which potentially can be used as base for receptor-based and ligand-based anti-influenza drug design.
There are other examples where GA was also used for applications which deals with handling genomic sequence data. Chunlin Wang et al. performed a benchmark-ing experiment where genetic algorithm was implemented in parallel mode to opti-mize multiple genomic sequence alignments initially generated by various alignment tools [107]. They developed a program, GenAlignRefine, which improves the over-all quality of global multiple sequence alignments (MSA) by using a genetic algo-rithm to improve alignments in local regions. Addressing such a problem statement was a challenge since MSA can provide only approximate solutions to alignments except for the smallest alignments. Already a number of novel heuristic algorithms have been proposed [108]. Deciding factors of the effectives are: (a) choice of an objective function (OF) that assesses the quality of an alignment, (b) algorithm design to optimize the score from that objective function. Sum-of-pair (SP) function is frequently used OF [109], which is an extension of the scoring method used in pair-wise alignments. Alternatively, COFFEE (Consistency based Objective Function For alignmEnt Evaluation) [110] function can be used which assesses the evenness between a multiple alignment and libraries of optimal pair-wise align-ments of the same sequences. Authors used the COFFEE OF as a measure of the optimization of the MSA, since other studies proved its robustness better align-ments [111]. Genetic algorithm was employed to optimize an alignment by attempt-ing to maximize its COFFEE score. The columns in an alignment that contain a gap adjacent to a gap-free region of at least 20 nucleotides as defined in this study as “fuzzy” regions. The starting point for the genetic algorithm in the method devel-oped was the initial alignment produced by T-Coffee [111] alignment on fuzzy regions. GenAlignRefine then optimizes the application of the genetic operators by using a combination of only 3 operators rather than the full set by pre-aligning each
S. Modak et al.
25
fuzzy region using T-Coffee, similar to studies done earlier [112]. Using these 3 genetic operators as genetic operators, authors effectively utilized genetic algo-rithms to efficiently improve MSA of whole genome sequences.
Totally other side of virology is the remedial approaches undertaken to either avoid, or reduce the dreadful consequences of viral infection. Worldwide, immu-nologists are working actively to develop preventive and therapeutic vaccines against cancer. There are several challenges related to this work, out of which most critical is translating positive immunoprevention from animal models to human situations. Thus, a successful experiment confirming effectiveness of vaccine on a particular cancer, seeks devising an optimal vaccination schedule that maximizes chances of demonstrating best effects. Cristiano Calonaci et al. [113] developed an agent-based model (ABM) [114] to summarize outcome of vaccination experiments for mammary carcinoma [115–119]. Genetic algorithms in this case was employed to deduce optimal vaccination schedule. To make this process more robust and effective, genetic algorithm was parallelized using Message Passing Interface (MPI), where a simulator was used as a fitness evaluator. The suggested schedule was then tested in vivo, giving good results. Thus, successful application of drug optimization using parallel computing was demonstrated by authors, leading to the development of a real virtual lab to analyze and optimize vaccine protocol administrations.
7 Ant Colony Optimization
The Ant System (AS) was initially proposed as a metaheuristic for optimization problems, by Marco Dorigo in 1992 [120]. It constitutes a class of algorithms in the area of Swarm Intelligence. The first problem studied in AS was that of searching for the most optimal path in a graph popularly known as the Traveling Salesman Problem (TSP) [121]. Over a period of time, the Ant System branched into several variations, sometimes to give better results for benchmark problems and sometimes varying as per the requirements of a domain problem. Thus, Ant Colony Optimization algorithm (ACO) is a probabilistic algorithm aimed at solving computationally intensive problems by drawing on random ant system behavior, towards incremen-tally finding better solutions.
In addition, ACO displays a reinforcement learning behavior which gives it a remarkable capability to learn while building its solutions. As a result, owing to multiple important properties of the ACO algorithm, a majority of published papers have reported ACO performing very well in many problem domains in comparison to other metaheuristics. One such class where ACO has been known to perform very well is in the area of combinatorial bioinformatics optimization problems. In this context, the attribute selection problem is of extreme importance. As an example, Microarray datasets are composed of a huge number of gene expression profiles. These profiles from a computational perspective are extremely noisy and redundant. A model (predictive or otherwise) when derived out of this data, will therefore also
AI Viral Biology
26
be inefficient and possibly misleading. As a result, pre-processing of these datasets is paramount. Collecting informative gene subsets, from this aspect, thus turns out to be very important. The reduced informative gene subsets thus obtained, help in building more expressive predictive models. At this time, popular classifiers like SVM, Random Forests etc. may take over. Sometimes, a feedback loop with the subset selection algorithm may help to improve the final model.
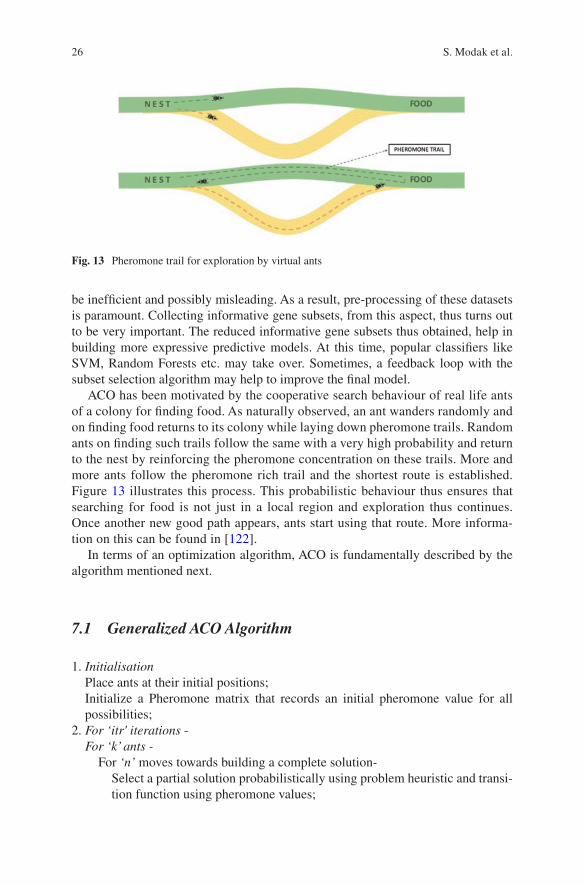
ACO has been motivated by the cooperative search behaviour of real life ants of a colony for finding food. As naturally observed, an ant wanders randomly and on finding food returns to its colony while laying down pheromone trails. Random ants on finding such trails follow the same with a very high probability and return to the nest by reinforcing the pheromone concentration on these trails. More and more ants follow the pheromone rich trail and the shortest route is established. Figure 13 illustrates this process. This probabilistic behaviour thus ensures that searching for food is not just in a local region and exploration thus continues. Once another new good path appears, ants start using that route. More informa-tion on this can be found in [122].
In terms of an optimization algorithm, ACO is fundamentally described by the algorithm mentioned next.
7.1 Generalized ACO Algorithm
1. Initialisation Place ants at their initial positions; Initialize a Pheromone matrix that records an initial pheromone value for all
possibilities;2. For ‘itr' iterations - For ‘k’ ants - For ‘n’ moves towards building a complete solution- Select a partial solution probabilistically using problem heuristic and transi-
tion function using pheromone values;
Fig. 13 Pheromone trail for exploration by virtual ants
S. Modak et al.
27
Evaluate the k-th ant’s solution and store it; Store and Select the best solution/s; Simulate reinforcement behaviour by increasing pheromone values for above selected solutions;
Simulate pheromone evaporation by decreasing other solution components not selected;
Repeat.3. Extract and report the final complete solution as the most optimal for the given parameters
While initialization of a generalized ACO, artificial ants may be placed on ran-dom positions (partial solution components). Next, in a pre-determined ‘itr’ set of iterations with a certain ‘k’ ants, a solution is explored considering there are ‘n’ partial components of the complete solution.
The problem heuristic is normally associated with the amount of information provided by the partial component of the complete solution.
In a later approach, Dorigo et al. [121] introduced the notions of exploration and exploitation to the ACO algorithm for the symmetric TSP problem. This process involved the generation of a random value called q, between 0 and 1, which was tested against a threshold q0 (user defined).An exploitation, where the best available partial solution component would be chosen (the shortest edge with maximum pher-omone concentration for TSP), constituted the next option if q was less than q0.Otherwise, exploration, where a random solution component according to a proba-bility distribution, would be selected. Elitism has also been used to improve results frequently. Such exploration and exploitation based search measures thus overcame many problems which normally a greedy algorithm would suffer from, for example the solution search being stuck in local optima.
The set of complete solutions for one iteration are then evaluated and the best are selected for updating pheromone concentration corresponding to a global update. Other solutions go through a local updation with pheromone evaporation.
7.2 Applications of ACO in Virology
Several viral diseases and outbreaks not only cause threats to humans, but also adversely affects the plant agriculture and animal husbandry in worst possible ways. One such example is shrimp aquaculture which has been severely affected by White spot disease (WSD) [123–125] resulting in a huge economic burden to the industry. Researchers have been working on developing approaches to find potential antiviral agents which will be used in docking analysis. These drug-like molecule obtained from the docking experiments would be used to optimize to a candidate drug. The objective is to find the inhibitors that blocks the binding of the viral protein to the receptor, thus averting the viral infections.
AI Viral Biology
28
Finding or developing new drug is a lengthy, complex, and costly process, with no assurance that the drug will actually be effective. There is a lack of validated diagnostic and therapeutic biomarkers to objectively detect and measure biological states. In-silico techniques have become important part of the drug discovery cycles because of their crucial role from hit identification to lead optimization. These methodologies are employed screen numerous molecules and narrow down the search to few potent candidates. One such widely used approach is ligand or struc-ture based virtual screening [126]. Protein-ligand docking problem (PLDP) involves the calculation of approximate binding free energy of the complex formation, based on which ligands are ranked. To address this problem Oliver Korb et al. proposed new algorithm based on ant colony optimization (ACO), called Protein–Ligand ANT System (PLANTS) for sampling the search space [127]. In conclusion, differ-ent parameter settings were evaluated in this study to assure high success rates in pose prediction for different timings. Default docking settings were able to repro-duce ligand geometries similar to the crystal geometry in about 72% of the cases at average docking times of 97 seconds.
HIV-1 and HIV-2 viral strains have different amino acid and nucleotide sequences. As discussed in genetic algorithm section, both of these viruses require a reverse transcriptase (RT) to convert viral RNA into proviral DNA that can then be inserted into the host DNA. Thus a lot of focus has been targeted on RT for drug discovery against HIV. 1-[(2-Hydroxyethoxy)methyl]-6-(phenylthio)-thymine (HEPT) acts as nonnucleoside inhibitor against HIV-1 [128, 129]. HEPT derivatives has been extensively exploited QSAR studies [130–142]. Vali Zare-Shahabadi et al. worked on developing QSAR model for a large set of HEPT derivatives to predict its anti- HIV1 activity, where ant colony system (ACS) was employed to select best descrip-tors [143]. Probability vectors were derived as colony of ants, where each ant is a bit string representation of all descriptors. That means that the elements in the bit string are set to zero for the nonselected descriptors, whereas the selected ones are set to one [144]. With randomly selected set of descriptors, a regression model was built, followed by assessment of each ant by fitness function, which in this case was cross-validation correlation coefficient. Outlier detection and regeneration of the linear model was employed to increase the quality of the linear model. The final model yielded RMSE values for the training and prediction sets 0.47 and 0.52, respec-tively. The R2 value for the training was 0.90 along with an F statistic value of 100.7. The RMSE values for the training and prediction sets were 0.56 (R2 = 0.86) and 0.58 (R2 = 0.85), respectively.
8 Particle Swarm Optimization
The particle swarm is a population-based stochastic algorithm for optimization which is based on social–psychological principles of bird flocking. The synchrony of flocking behaviour of a group of birds is believed to be a function of bird’s efforts to maintain an ideal separation among themselves and their neighbours. Birds change
S. Modak et al.
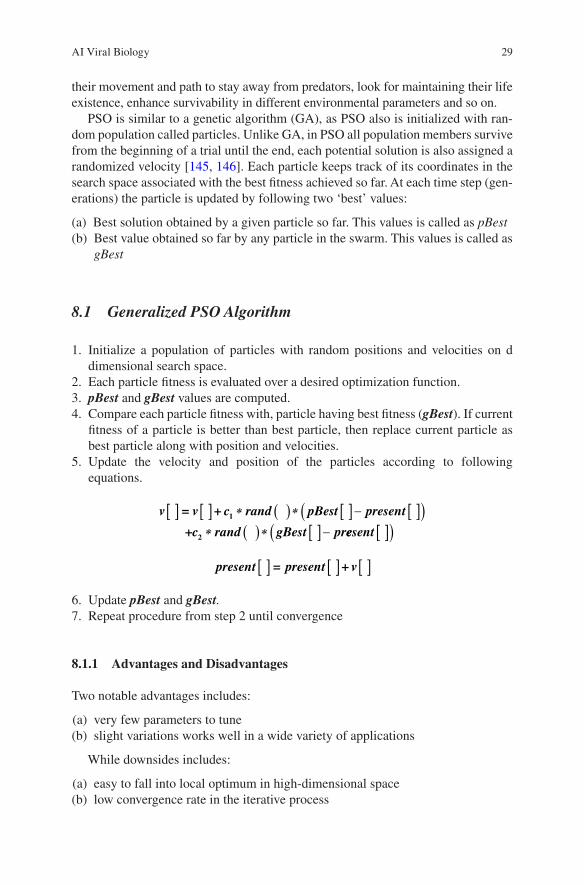
29
their movement and path to stay away from predators, look for maintaining their life existence, enhance survivability in different environmental parameters and so on.
PSO is similar to a genetic algorithm (GA), as PSO also is initialized with ran-dom population called particles. Unlike GA, in PSO all population members survive from the beginning of a trial until the end, each potential solution is also assigned a randomized velocity [145, 146]. Each particle keeps track of its coordinates in the search space associated with the best fitness achieved so far. At each time step (gen-erations) the particle is updated by following two ‘best’ values:
(a) Best solution obtained by a given particle so far. This values is called as pBest (b) Best value obtained so far by any particle in the swarm. This values is called as
gBest
8.1 Generalized PSO Algorithm
1. Initialize a population of particles with random positions and velocities on d dimensional search space.
2. Each particle fitness is evaluated over a desired optimization function. 3. pBest and gBest values are computed. 4. Compare each particle fitness with, particle having best fitness (gBest). If current
fitness of a particle is better than best particle, then replace current particle as best particle along with position and velocities.
5. Update the velocity and position of the particles according to following equations.
v = v + c rand pBest present
+c rand gBest pr
[ ] [ ] ( ) [ ] [ ]( )( ) [ ]
1
2
∗ ∗ −
∗ ∗ − eesent [ ]( )
present = present + v[ ] [ ] [ ]
6. Update pBest and gBest. 7. Repeat procedure from step 2 until convergence
8.1.1 Advantages and Disadvantages
Two notable advantages includes:
(a) very few parameters to tune (b) slight variations works well in a wide variety of applications
While downsides includes:
(a) easy to fall into local optimum in high-dimensional space (b) low convergence rate in the iterative process
AI Viral Biology
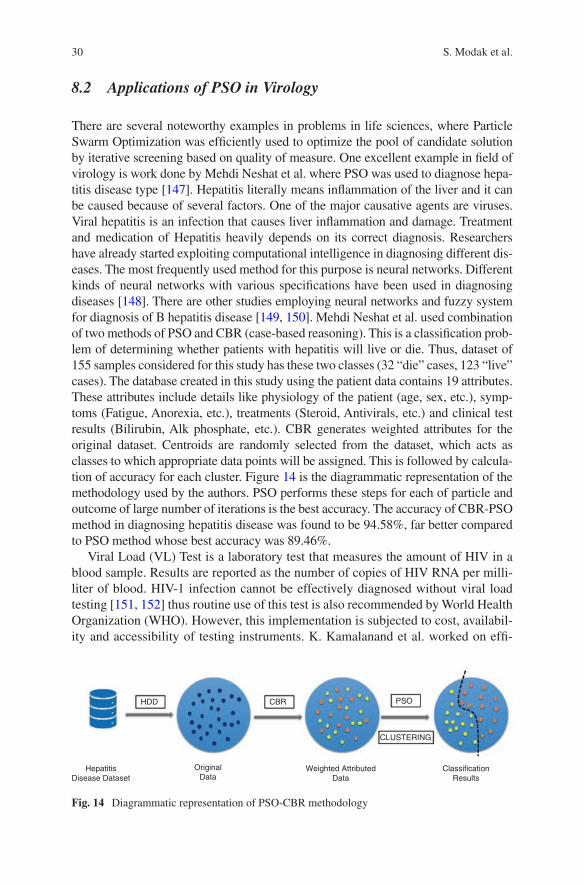
30
8.2 Applications of PSO in Virology
There are several noteworthy examples in problems in life sciences, where Particle Swarm Optimization was efficiently used to optimize the pool of candidate solution by iterative screening based on quality of measure. One excellent example in field of virology is work done by Mehdi Neshat et al. where PSO was used to diagnose hepa-titis disease type [147]. Hepatitis literally means inflammation of the liver and it can be caused because of several factors. One of the major causative agents are viruses. Viral hepatitis is an infection that causes liver inflammation and damage. Treatment and medication of Hepatitis heavily depends on its correct diagnosis. Researchers have already started exploiting computational intelligence in diagnosing different dis-eases. The most frequently used method for this purpose is neural networks. Different kinds of neural networks with various specifications have been used in diagnosing diseases [148]. There are other studies employing neural networks and fuzzy system for diagnosis of B hepatitis disease [149, 150]. Mehdi Neshat et al. used combination of two methods of PSO and CBR (case-based reasoning). This is a classification prob-lem of determining whether patients with hepatitis will live or die. Thus, dataset of 155 samples considered for this study has these two classes (32 “die” cases, 123 “live” cases). The database created in this study using the patient data contains 19 attributes. These attributes include details like physiology of the patient (age, sex, etc.), symp-toms (Fatigue, Anorexia, etc.), treatments (Steroid, Antivirals, etc.) and clinical test results (Bilirubin, Alk phosphate, etc.). CBR generates weighted attributes for the original dataset. Centroids are randomly selected from the dataset, which acts as classes to which appropriate data points will be assigned. This is followed by calcula-tion of accuracy for each cluster. Figure 14 is the diagrammatic representation of the methodology used by the authors. PSO performs these steps for each of particle and outcome of large number of iterations is the best accuracy. The accuracy of CBR-PSO method in diagnosing hepatitis disease was found to be 94.58%, far better compared to PSO method whose best accuracy was 89.46%.
Viral Load (VL) Test is a laboratory test that measures the amount of HIV in a blood sample. Results are reported as the number of copies of HIV RNA per milli-liter of blood. HIV-1 infection cannot be effectively diagnosed without viral load testing [151, 152] thus routine use of this test is also recommended by World Health Organization (WHO). However, this implementation is subjected to cost, availabil-ity and accessibility of testing instruments. K. Kamalanand et al. worked on effi-
HDD CBR PSO
CLUSTERING
HepatitisDisease Dataset
OriginalData
Weighted AttributedData
ClassificationResults
Fig. 14 Diagrammatic representation of PSO-CBR methodology
S. Modak et al.
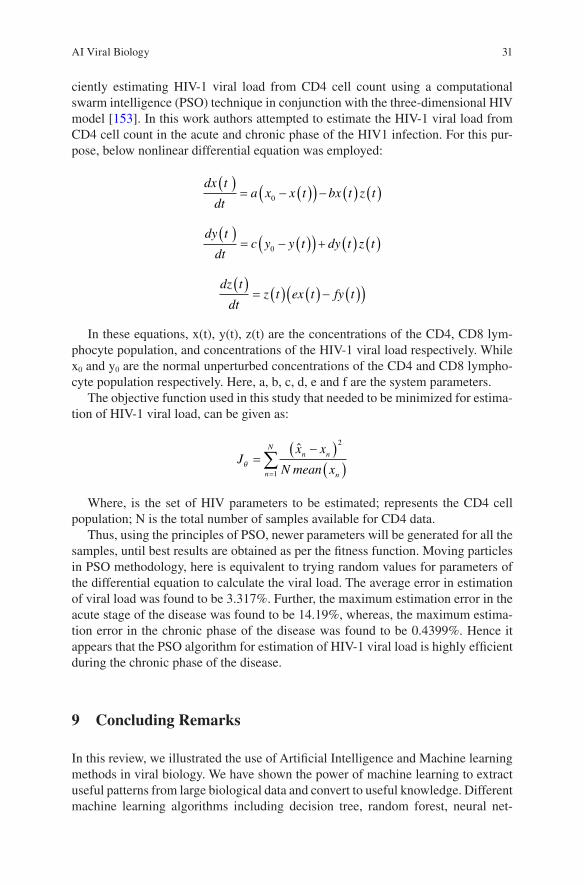
31
ciently estimating HIV-1 viral load from CD4 cell count using a computational swarm intelligence (PSO) technique in conjunction with the three-dimensional HIV model [153]. In this work authors attempted to estimate the HIV-1 viral load from CD4 cell count in the acute and chronic phase of the HIV1 infection. For this pur-pose, below nonlinear differential equation was employed:
dx t
dta x x t bx t z t
( )= − ( )( ) − ( ) ( )0
dy t
dtc y y t dy t z t
( )= − ( )( ) + ( ) ( )0
dz t
dtz t ex t fy t
( )= ( ) ( ) − ( )( )
In these equations, x(t), y(t), z(t) are the concentrations of the CD4, CD8 lym-phocyte population, and concentrations of the HIV-1 viral load respectively. While x0 and y0 are the normal unperturbed concentrations of the CD4 and CD8 lympho-cyte population respectively. Here, a, b, c, d, e and f are the system parameters.
The objective function used in this study that needed to be minimized for estima-tion of HIV-1 viral load, can be given as:
Jx x
N mean xn
Nn n
nθ =
−( )( )=
∑1
2ˆ
Where, is the set of HIV parameters to be estimated; represents the CD4 cell population; N is the total number of samples available for CD4 data.
Thus, using the principles of PSO, newer parameters will be generated for all the samples, until best results are obtained as per the fitness function. Moving particles in PSO methodology, here is equivalent to trying random values for parameters of the differential equation to calculate the viral load. The average error in estimation of viral load was found to be 3.317%. Further, the maximum estimation error in the acute stage of the disease was found to be 14.19%, whereas, the maximum estima-tion error in the chronic phase of the disease was found to be 0.4399%. Hence it appears that the PSO algorithm for estimation of HIV-1 viral load is highly efficient during the chronic phase of the disease.
9 Concluding Remarks
In this review, we illustrated the use of Artificial Intelligence and Machine learning methods in viral biology. We have shown the power of machine learning to extract useful patterns from large biological data and convert to useful knowledge. Different machine learning algorithms including decision tree, random forest, neural net-
AI Viral Biology
32
works and deep neural networks have been explained lucidly. We also dealt with the use of Artificial intelligence methods like genetic algorithms, ant colony optimiza-tion and particle swarm optimization methods in synergistic combination with machine learning methods to provide optimal solutions computationally faster and with increased accuracy and robustness. We have also listed large number of case studies and examples in different areas of viral biology where AI and ML tools have been beneficially employed for solving real life problems.
References
1. Sousa MS, Mattoso ML, Ebecken NF. Data mining: a database perspective. WIT Transactions on Information and Communication Technologies; 1970 Jan 1;22.
2. Steinberg D, Colla P. CART: classification and regression trees. In Wu X, Kumar V, editors. The top ten algorithms in data mining. Knowledge and information systems (Boca Raton, FL). 2008 Jan 1;14(1):1-37. p. 179–201.
3. Gubler DJ. Dengue and dengue hemorrhagic fever. Clin Microbiol Rev. 1998;11(3):480–96. 4. Vaughn DW, Green S, Kalayanarooj S, Innis BL, Nimmannitya S, Suntayakorn S, Rothman
AL, Ennis FA, Nisalak A. Dengue in the early febrile phase: viremia and antibody responses. J Infect Dis. 1997;176(2):322–30.
5. Halstead SB. Dengue. Lancet. 2007;370(9599):1644–52. 6. Kalayanarooj S, Vaughn DW, Nimmannitya S, Green S, Suntayakorn S, Kunentrasai N,
Viramitrachai W, Ratanachu-Eke S, Kiatpolpoj S, Innis BL, Rothman AL. Early clinical and laboratory indicators of acute dengue illness. J Infect Dis. 1997;176(2):313–21.
7. Chadwick D, Arch B, Wilder-Smith A, Paton N. Distinguishing dengue fever from other infections on the basis of simple clinical and laboratory features: application of logistic regression analysis. J Clin Virol. 2006;35(2):147–53.
8. Tanner L, Schreiber M, Low JG, Ong A, Tolfvenstam T, Lai YL, Ng LC, Leo YS, Puong LT, Vasudevan SG, Simmons CP. Decision tree algorithms predict the diagnosis and outcome of dengue fever in the early phase of illness. PLoS Negl Trop Dis. 2008;2(3):e196.
9. Quinlan JR. C4. 5: programs for machine learning. Elsevier (San Mateo, CA); 2014 Jun 28. 10. Kothari R, Dong M. Decision trees for classification: a review and some new results. In
Pattern recognition: from classical to modern approaches. World Scientific (Singapore). 2001. pp. 169–84.
11. Solomon T, Ooi MH, Beasley DW, Mallewa M. West Nile encephalitis. BMJ. 2003;326(7394):865–9.
12. Sampathkumar P. West Nile virus: epidemiology, clinical presentation, diagnosis, and pre-vention. In Mayo clinic proceedings 2003 Sep 1, vol. 78, no. 9, p. 1137–44, Elsevier.
13. Organ Procurement and Transplantation Network. http://www.optn.org/news/newsDetail.asp?id=303. Accessed on-line February 24, 2004.
14. Kiberd BA, Forward K. Screening for West Nile virus in organ transplantation: a medical decision analysis. Am J Transplant. 2004;4(8):1296–301.
15. Hutchens TW, Yip TT. New desorption strategies for the mass spectrometric analysis of mac-romolecules. Rapid Commun Mass Spectrom. 1993;7(7):576–80.
16. Merchant M, Weinberger SR. Recent advancements in surface-enhanced laser desorption/ionization-time of flight-mass spectrometry. Electrophoresis. 2000;21(6):1164–77.
17. Jones MB, Krutzsch H, Shu H, Zhao Y, Liotta LA, Kohn EC, Petricoin EF III. Proteomic analysis and identification of new biomarkers and therapeutic targets for invasive ovarian cancer. Proteomics. 2002;2(1):76–84.
S. Modak et al.
33
18. Bergman AC, Benjamin T, Alaiya A, Waltham M, Sakaguchi K, Franzén B, Linder S, Bergman T, Auer G, Appella E, Wirth PJ. Identification of gel-separated tumor marker pro-teins by mass spectrometry. Electrophoresis. 2000;21(3):679–86.
19. Alaiya AA, Franzén B, Fujioka K, Moberger B, Schedvins K, Silfversvärd C, Linder S, Auer G. Phenotypic analysis of ovarian carcinoma: polypeptide expression in benign, borderline and malignant tumors. Int J Cancer. 1997;73(5):678–82.
20. Thompson S, Turner GA. Elevated levels of abnormally-fucosylated haptoglobins in cancer sera. Br J Cancer. 1987;56(5):605–10.
21. Adam BL, Qu Y, Davis JW, Ward MD, Clements MA, Cazares LH, Semmes OJ, Schellhammer PF, Yasui Y, Feng Z, Wright GL. Serum protein fingerprinting coupled with a pattern- matching algorithm distinguishes prostate cancer from benign prostate hyperplasia and healthy men. Cancer Res. 2002;62(13):3609–14.
22. Qu Y, Adam BL, Yasui Y, Ward MD, Cazares LH, Schellhammer PF, Feng Z, Semmes OJ, Wright GL. Boosted decision tree analysis of surface-enhanced laser desorption/ionization mass spectral serum profiles discriminates prostate cancer from noncancer patients. Clin Chem. 2002;48(10):1835–43.
23. Petricoin EF III, Ardekani AM, Hitt BA, Levine PJ, Fusaro VA, Steinberg SM, Mills GB, Simone C, Fishman DA, Kohn EC, Liotta LA. Use of proteomic patterns in serum to identify ovarian cancer. Lancet. 2002;359(9306):572–7.
24. Li J, Zhang Z, Rosenzweig J, Wang YY, Chan DW. Proteomics and bioinformatics approaches for identification of serum biomarkers to detect breast cancer. Clin Chem. 2002;48(8):1296–304.
25. Vlahou A, Schorge JO, Gregory BW, Coleman RL. Diagnosis of ovarian cancer using deci-sion tree classification of mass spectral data. Biomed Res Int. 2003;2003(5):308–14.
26. Breiman L. Random forests. Mach Learn. 2001;45(1):5–32. 27. Liaw A, Wiener M. Classification and regression by random forest. R News. 2002;2(3):18–22. 28. Cutler DR, Edwards TC Jr, Beard KH, Cutler A, Hess KT, Gibson J, Lawler JJ. Random
forests for classification in ecology. Ecology. 2007;88(11):2783–92. 29. Matrosovich MN, Gambaryan AS, Teneberg S, Piskarev VE, Yamnikova SS, Lvov DK,
Robertson JS, Karlsson KA. Avian influenza A viruses differ from human viruses by rec-ognition of sialyloligosaccharides and gangliosides and by a higher conservation of the HA receptor-binding site. Virology. 1997;233(1):224–34.
30. Rogers GN, Paulson JC. Receptor determinants of human and animal influenza virus iso-lates: differences in receptor specificity of the H3 hemagglutinin based on species of origin. Virology. 1983;127(2):361–73.
31. Suzuki Y. Gangliosides as influenza virus receptors. Variation of influenza viruses and their recognition of the receptor sialo-sugar chains. Prog Lipid Res. 1994;33(4):429–57.
32. Li OT, Chan MC, Leung CS, Chan RW, Guan Y, Nicholls JM, Poon LL. Full factorial analysis of mammalian and avian influenza polymerase subunits suggests a role of an efficient poly-merase for virus adaptation. PLoS One. 2009;4(5):e5658.
33. Jagger BW, Memoli MJ, Sheng ZM, Qi L, Hrabal RJ, Allen GL, Dugan VG, Wang R, Digard P, Kash JC, Taubenberger JK. The PB2-E627K mutation attenuates viruses containing the 2009 H1N1 influenza pandemic polymerase. MBio. 2010;1(1):e00067–10.
34. Subbarao EK, London W, Murphy BR. A single amino acid in the PB2 gene of influenza A virus is a determinant of host range. J Virol. 1993;67(4):1761–4.
35. Chen GW, Chang SC, Mok CK, Lo YL, Kung YN, Huang JH, Shih YH, Wang JY, Chiang C, Chen CJ, Shih SR. Genomic signatures of human versus avian influenza A viruses. Emerg Infect Dis. 2006;12(9):1353–60.
36. Eng CL, Tong JC, Tan TW. Predicting host tropism of influenza A virus proteins using ran-dom forest. BMC Med Genet. 2014;7(3):S1.
37. Dubchak I, Muchnik I, Holbrook SR, Kim SH. Prediction of protein folding class using global description of amino acid sequence. Proc Natl Acad Sci. 1995;92(19):8700–4.
AI Viral Biology
34
38. Dubchak I, Muchnik I, Mayor C, Dralyuk I, Kim SH. Recognition of a protein fold in the context of the SCOP classification. Proteins Struct Function Bioinform. 1999;35(4):401–7.
39. Wei Y, Li J, Qing J, Huang M, Wu M, Gao F, Li D, Hong Z, Kong L, Huang W, Lin J. Discovery of novel hepatitis C virus NS5B polymerase inhibitors by combining random forest, multiple e-pharmacophore modeling and docking. PLoS One. 2016;11(2):e0148181.
40. Lavanchy D. The global burden of hepatitis C. Liver Int. 2009;29:74–81. 41. Sarrazin C, Zeuzem S. Resistance to direct antiviral agents in patients with hepatitis C virus
infection. Gastroenterology. 2010;138(2):447–62. 42. Behrens SE, Tomei L, De Francesco R. Identification and properties of the RNA-dependent
RNA polymerase of hepatitis C virus. EMBO J. 1996;15(1):12–22. 43. Moradpour D, Brass V, Bieck E, Friebe P, Gosert R, Blum HE, Bartenschlager R, Penin F,
Lohmann V. Membrane association of the RNA-dependent RNA polymerase is essential for hepatitis C virus RNA replication. J Virol. 2004;78(23):13278–84.
44. Ago H, Adachi T, Yoshida A, Yamamoto M, Habuka N, Yatsunami K, Miyano M. Crystal structure of the RNA-dependent RNA polymerase of hepatitis C virus. Structure. 1999;7(11):1417–26.
45. Lesburg CA, Cable MB, Ferrari E, Hong Z, Mannarino AF, Weber PC. Crystal structure of the RNA-dependent RNA polymerase from hepatitis C virus reveals a fully encircled active site. Nat Struct Mol Biol. 1999;6(10):937.
46. Tagger A, Donato F, Ribero ML, Chiesa R, Portera G, Gelatti U, Albertini A, Fasola M, Boffetta P, Nardi G. Case-control study on hepatitis C virus (HCV) as a risk factor for hepa-tocellular carcinoma: the role of HCV genotypes and the synergism with hepatitis B virus and alcohol. Int J Cancer. 1999;81(5):695–9.
47. Tsukuma H, Hiyama T, Tanaka S, Nakao M, Yabuuchi T, Kitamura T, Nakanishi K, Fujimoto I, Inoue A, Yamazaki H, Kawashima T. Risk factors for hepatocellular carcinoma among patients with chronic liver disease. N Engl J Med. 1993;328(25):1797–801.
48. El-Serag HB, Mason AC. Rising incidence of hepatocellular carcinoma in the United States. N Engl J Med. 1999;340(10):745–50.
49. Mas VR, Maluf DG, Archer KJ, Yanek K, Kong X, Kulik L, Freise CE, Olthoff KM, Ghobrial RM, McIver P, Fisher R. Genes involved in viral carcinogenesis and tumor initiation in hepa-titis C virus-induced hepatocellular carcinoma. Mol Med. 2009;15(3–4):85–94.
50. Kane MJ, Price N, Scotch M, Rabinowitz P. Comparison of ARIMA and Random Forest time series models for prediction of avian influenza H5N1 outbreaks. BMC Bioinform. 2014;15(1):276.
51. Zurada JM. Introduction to artificial neural systems. St. Paul: West Publishing Company; 1992.
52. Marcondes CB, Ximenes MD. Zika virus in Brazil and the danger of infestation by Aedes (Stegomyia) mosquitoes. Rev Soc Bras Med Trop. 2016;49(1):4–10.
53. Mlakar J, Korva M, Tul N, Popović M, Poljšak-Prijatelj M, Mraz J, Kolenc M, Resman Rus K, Vesnaver Vipotnik T, Fabjan Vodušek V, Vizjak A. Zika virus associated with microceph-aly. N Engl J Med. 2016;374(10):951–8.
54. Driggers RW, Ho CY, Korhonen EM, Kuivanen S, Jääskeläinen AJ, Smura T, Rosenberg A, Hill DA, DeBiasi RL, Vezina G, Timofeev J. Zika virus infection with prolonged maternal viremia and fetal brain abnormalities. N Engl J Med. 2016;374(22):2142–51.
55. Brasil P, Pereira JP Jr, Moreira ME, Ribeiro Nogueira RM, Damasceno L, Wakimoto M, Rabello RS, Valderramos SG, Halai UA, Salles TS, Zin AA. Zika virus infection in pregnant women in Rio de Janeiro. N Engl J Med. 2016;375(24):2321–34.
56. Akhtar M, Kraemer MU, Gardner L. A dynamic neural network model for real-time predic-tion of the Zika epidemic in the Americas bioRxiv 2018 Jan 1:466581.
57. Leontaritis IJ, Billings SA. Input-output parametric models for non-linear systems part I: deterministic non-linear systems. Int J Control. 1985;41(2):303–28.
58. Narendra KS, Parthasarathy K. Identification and control of dynamical systems using neural networks. IEEE Trans Neural Netw. 1990;1(1):4–27.
S. Modak et al.
35
59. Chen S, Billings SA, Grant PM. Non-linear system identification using neural networks. Int J Control. 1990;51(6):1191–214.
60. Tersmette MJ, De Goede RE, Al BJ, Winkel IN, Gruters RA, Cuypers HT, Huisman HG, Miedema F. Differential syncytium-inducing capacity of human immunodeficiency virus iso-lates: frequent detection of syncytium-inducing isolates in patients with acquired immunode-ficiency syndrome (AIDS) and AIDS-related complex. J Virol. 1988;62(6):2026–32.
61. Alkhatib G, Combadiere C, Broder CC, Feng Y, Kennedy PE, Murphy PM, Berger EA. CC CKR5: a RANTES, MIP-1α, MIP-1ॆ receptor as a fusion cofactor for macrophage-tropic HIV-1. Science. 1996 Jun 28;272(5270):1955–8.
62. Liu R, Paxton WA, Choe S, Ceradini D, Martin SR, Horuk R, MacDonald ME, Stuhlmann H, Koup RA, Landau NR. Homozygous defect in HIV-1 coreceptor accounts for resistance of some multiply-exposed individuals to HIV-1 infection. Cell. 1996;86(3):367–77.
63. Deng H, Liu R, Ellmeier W, Choe S, Unutmaz D, Burkhart M, Marzio PD, Marmon S, Sutton RE, Hill CM, Davis CB. Identification of a major co-receptor for primary isolates of HIV-1. Nature. 1996;381(6584):661–6.
64. Doranz BJ, Rucker J, Yi Y, Smyth RJ, Samson M, Peiper SC, Parmentier M, Collman RG, Doms RW. A dual-tropic primary HIV-1 isolate that uses fusin and the β-chemokine receptors CKR-5, CKR-3, and CKR-2b as fusion cofactors. Cell. 1996;85(7):1149–58.
65. Dragic T, Litwin V, Allaway GP, Martin SR, Huang Y, Nagashima KA, Cayanan C, Maddon PJ, Koup RA, Moore JP, Paxton WA. HIV-1 entry into CD4+ cells is mediated by the chemo-kine receptor CC-CKR-5. Nature. 1996 Jun;381(6584):667–73.
66. Feng Y, Broder CC, Kennedy PE, Berger EA. HIV-1 entry cofactor: functional cDNA cloning of a seven-transmembrane, G protein-coupled receptor. Science. 1996;272(5263):872–7.
67. Chesebro B, Wehrly K, Nishio J, Perryman S. Mapping of independent V3 envelope determi-nants of human immunodeficiency virus type 1 macrophage tropism and syncytium forma-tion in lymphocytes. J Virol. 1996;70(12):9055–9.
68. Choe H, Farzan M, Sun Y, Sullivan N, Rollins B, Ponath PD, Wu L, Mackay CR, LaRosa G, Newman W, Gerard N. The β-chemokine receptors CCR3 and CCR5 facilitate infection by primary HIV-1 isolates. Cell. 1996;85(7):1135–48.
69. Cocchi F, DeVico AL, Garzino-Demo A, Cara A, Gallo RC, Lusso P. The V3 domain of the HIV–1 gp120 envelope glycoprotein is critical for chemokine–mediated blockade of infec-tion. Nat Med. 1996;2(11):1244–7.
70. Hwang SS, Boyle TJ, Lyerly HK, Cullen BR. Identification of the envelope V3 loop as the primary determinant of cell tropism in HIV-1. Science. 1991;253(5015):71–4.
71. Resch W, Hoffman N, Swanstrom R. Improved success of phenotype prediction of the human immunodeficiency virus type 1 from envelope variable loop 3 sequence using neural net-works. Virology. 2001;288(1):51–62.
72. MacKay DJ. Bayesian interpolation. Neural Comput. 1992;4(3):415–47. 73. Rodellar J, Alférez S, Acevedo A, Molina A, Merino A. Image processing and machine learn-
ing in the morphological analysis of blood cells. Int J Lab Hematol. 2018;40:46–53. 74. Angermueller C, Pärnamaa T, Parts L, Stegle O. Deep learning for computational biology.
Mol Syst Biol. 2016;12(7):878. 75. Ebrahimi M, Ahsan R. The first implication of image processing techniques on influenza
a virus sub-typing based on HA/NA protein sequences, using convolutional deep neural Network. BioRxiv 2018 Jan 1:448159.
76. https://www.uniprot.org. 77. Han Y, Kim D. Deep convolutional neural networks for pan-specific peptide-MHC class I
binding prediction. BMC Bioinform. 2017;18(1):585. 78. Liu W, Meng X, Xu Q, Flower DR, Li T. Quantitative prediction of mouse class I MHC
peptide binding affinity using support vector machine regression (SVR) models. BMC Bioinform. 2006 Dec;7(1):182.
AI Viral Biology
36
79. The World Bank. Reducing Climate-Sensitive Risks. 2014, Volume 1. Available online: http://documents.worldbank.org/curated/en/486511468167944431/Reducing-climate-sensitive-disease-risks. Accessed on 20 June 2017.
80. Fuentes A, Yoon S, Kim S, Park D. A robust deep-learning-based detector for real-time tomato plant diseases and pests recognition. Sensors. 2017;17(9):2022.
81. Krizhenvshky A, Sutskever I, Hinton G. Imagenet classification with deep convolutional net-works. InProceedings of the Conference Neural Information Processing Systems (NIPS). p. 1097–105.
82. Simonyan K, Zisserman A. Very deep convolutional networks for large-scale image recogni-tion. arXiv preprint arXiv:1409.1556. 2014 Sep 4.
83. Szegedy C, Liu W, Jia Y, Sermanet P, Reed S, Anguelov D, Erhan D, Vanhoucke V, Rabinovich A. Going deeper with convolutions. In Proceedings of the IEEE conference on computer vision and pattern recognition 2015. p. 1–9.
84. He K, Zhang X, Ren S, Sun J. Deep residual learning for image recognition. In Proceedings of the IEEE conference on computer vision and pattern recognition 2016. p. 770–8.
85. Xie S, Girshick R, Dollár P, Tu Z, He K. Aggregated residual transformations for deep neural networks. In Proceedings of the IEEE conference on computer vision and pattern recognition 2017. p. 1492–500.
86. Holland JH. Genetic algorithms. Sci Am. 1992;267(1):66–73. 87. Goldberg DE, Holland JH. Genetic algorithms and machine learning. Mach Learn.
1988;3(2):95–9. 88. Michalewicz Z, Janikow CZ, Krawczyk JB. A modified genetic algorithm for optimal control
problems. Comput Math Appl. 1992;23(12):83–94. 89. Gallo RC, Sarin PS, Gelmann EP, Robert-Guroff M, Richardson E, Kalyanaraman VS, Mann
D, Sidhu GD, Stahl RE, Zolla-Pazner S, Leibowitch J. Isolation of human T-cell leukemia virus in acquired immune deficiency syndrome (AIDS). Science. 1983;220(4599):865–7.
90. Barré-Sinoussi F, Chermann JC, Rey F, Nugeyre MT, Chamaret S, Gruest J, Dauguet C, Axler-Blin C, Vézinet-Brun F, Rouzioux C, Rozenbaum W. Isolation of a T-lymphotropic retrovirus from a patient at risk for acquired immune deficiency syndrome (AIDS). Science. 1983;220(4599):868–71.
91. Jung A, Maier R, Vartanian JP, Bocharov G, Jung V, Fischer U, Meese E, Wain-Hobson S, Meyerhans A. Recombination: multiply infected spleen cells in HIV patients. Nature. 2002;418(6894):144.
92. Bocharov G, Ford NJ, Edwards J, Breinig T, Wain-Hobson S, Meyerhans A. A genetic- algorithm approach to simulating human immunodeficiency virus evolution reveals the strong impact of multiply infected cells and recombination. J Gen Virol. 2005;86(11):3109–18.
93. De Clercq E. Emerging anti-HIV drugs. Expert Opin Emerg Drugs. 2005;10(2):241–74. 94. Mekouar K, Mouscadet JF, Desmaële D, Subra F, Leh H, Savouré D, Auclair C, d'Angelo
J. Styrylquinoline derivatives: a new class of potent HIV-1 integrase inhibitors that block HIV-1 replication in CEM cells. J Med Chem. 1998;41(15):2846–57.
95. Goudarzi N, Goodarzi M, Chen T. QSAR prediction of HIV inhibition activity of styrylquin-oline derivatives by genetic algorithm coupled with multiple linear regressions. Med Chem Res. 2012;21(4):437–43.
96. Leonard JT, Roy K. Exploring molecular shape analysis of styrylquinoline derivatives as HIV-1 integrase inhibitors. Eur J Med Chem. 2008;43(1):81–92.
97. Cong Y, Li BK, Yang XG, Xue Y, Chen YZ, Zeng Y. Quantitative structure–activity relation-ship study of influenza virus neuraminidase A/PR/8/34 (H1N1) inhibitors by genetic algorithm feature selection and support vector regression. Chemom Intell Lab Syst. 2013;127:35–42.
98. Williams MA, Lew W, Mendel DB, Tai CY, Escarpe PA, Laver WG, Stevens RC, Kim CU. Structure-activity relationships of carbocyclic influenza neuraminidase inhibitors. Bioorg Med Chem Lett. 1997;7(14):1837–42.
99. Kim CU, Lew W, Williams MA, Wu H, Zhang L, Chen X, Escarpe PA, Mendel DB, Laver WG, Stevens RC. Structure− activity relationship studies of novel carbocyclic influenza neuraminidase inhibitors. J Med Chem. 1998;41(14):2451–60.
S. Modak et al.