Embed Size (px)
Citation preview
DYNAMO/CINDY/AMIE Sonde Network Performance and Plans for Quality Control
Paul Ciesielski and Richard Johnson
Colorado State
University
• As of 29 February 2012, the DYNAMO/CINDY/AMIE sonde dataset is nearly 17,000 sondes and growing.
• Of this number, ~12,000 sondes are high resolution; the remainder are GTS-resolution or pibal sondes.
• Inventory covers a 152/day period; sites in India had < 1 sonde/day • Large sonde numbers for Indonesian sites reflect 1-2 pibals/day, in
addition to rawinsondes at 00 and 12 UTC.
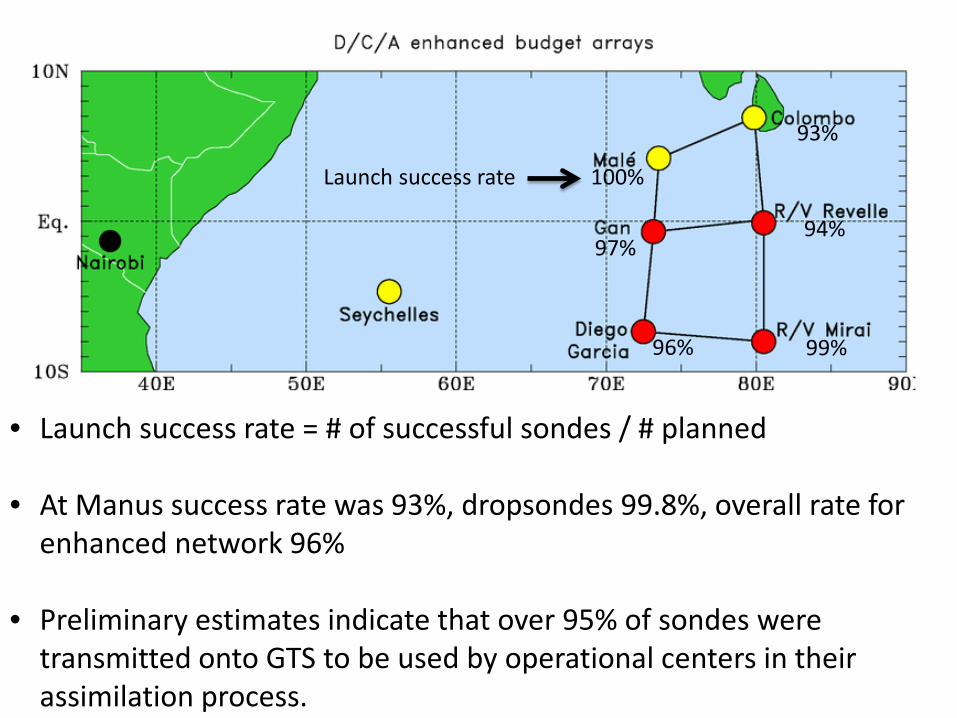
• Launch success rate = # of successful sondes / # planned
• At Manus success rate was 93%, dropsondes 99.8%, overall rate for enhanced network 96%
• Preliminary estimates indicate that over 95% of sondes were
transmitted onto GTS to be used by operational centers in their assimilation process.
100%
93%
94%
99% 96%
Launch success rate
97%
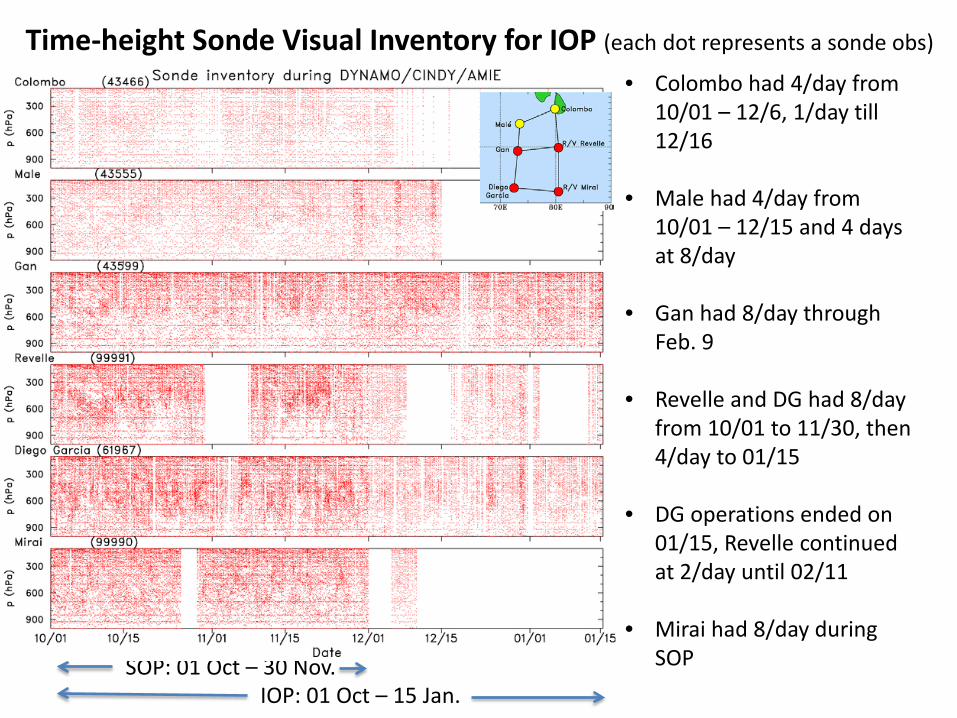
Time-height Sonde Visual Inventory for IOP (each dot represents a sonde obs)
SOP: 01 Oct – 30 Nov.
• Colombo had 4/day from 10/01 – 12/6, 1/day till 12/16
• Male had 4/day from 10/01 – 12/15 and 4 days at 8/day
• Gan had 8/day through
Feb. 9 • Revelle and DG had 8/day
from 10/01 to 11/30, then 4/day to 01/15
• DG operations ended on 01/15, Revelle continued at 2/day until 02/11
• Mirai had 8/day during SOP
IOP: 01 Oct – 15 Jan.
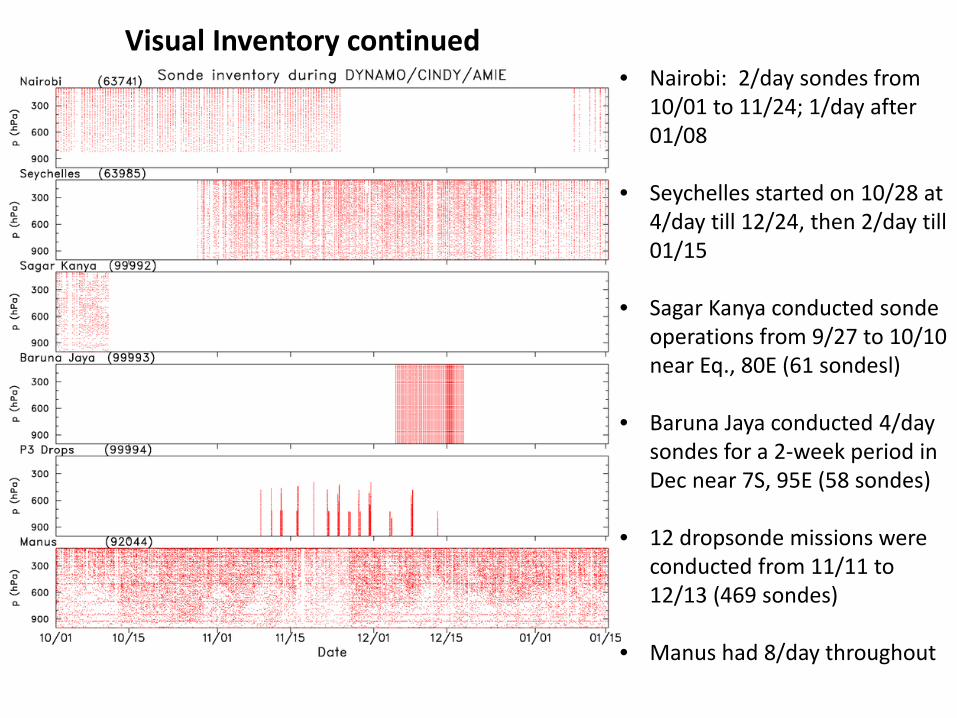
Visual Inventory continued • Nairobi: 2/day sondes from
10/01 to 11/24; 1/day after 01/08
• Seychelles started on 10/28 at
4/day till 12/24, then 2/day till 01/15
• Sagar Kanya conducted sonde operations from 9/27 to 10/10 near Eq., 80E (61 sondesl)
• Baruna Jaya conducted 4/day sondes for a 2-week period in Dec near 7S, 95E (58 sondes)
• 12 dropsonde missions were conducted from 11/11 to 12/13 (469 sondes)
• Manus had 8/day throughout
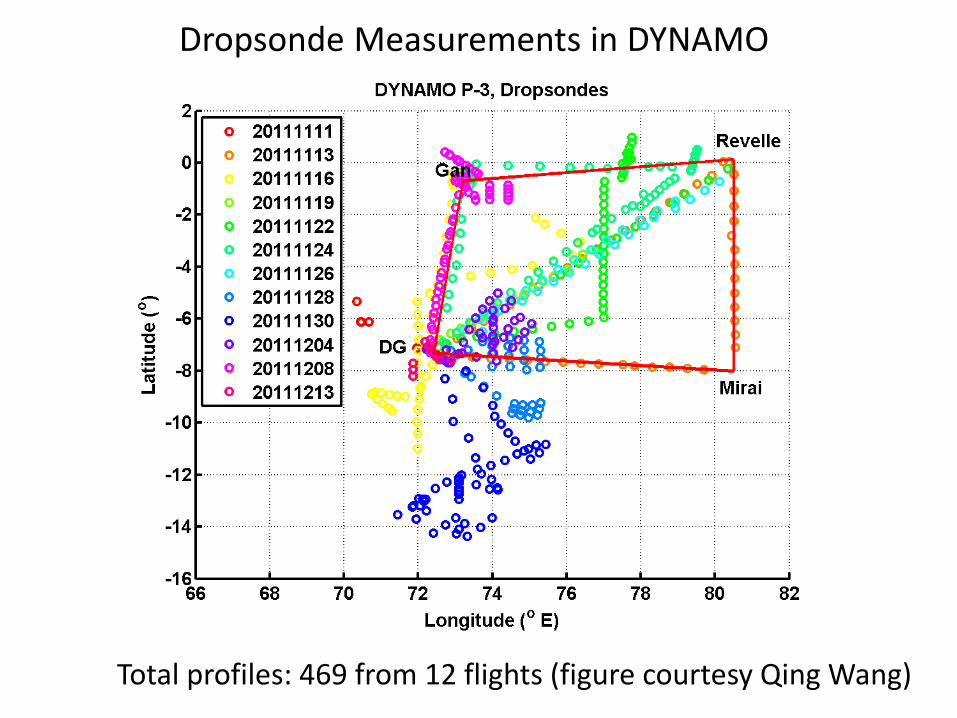
Dropsonde Measurements in DYNAMO
Total profiles: 469 from 12 flights (figure courtesy Qing Wang)
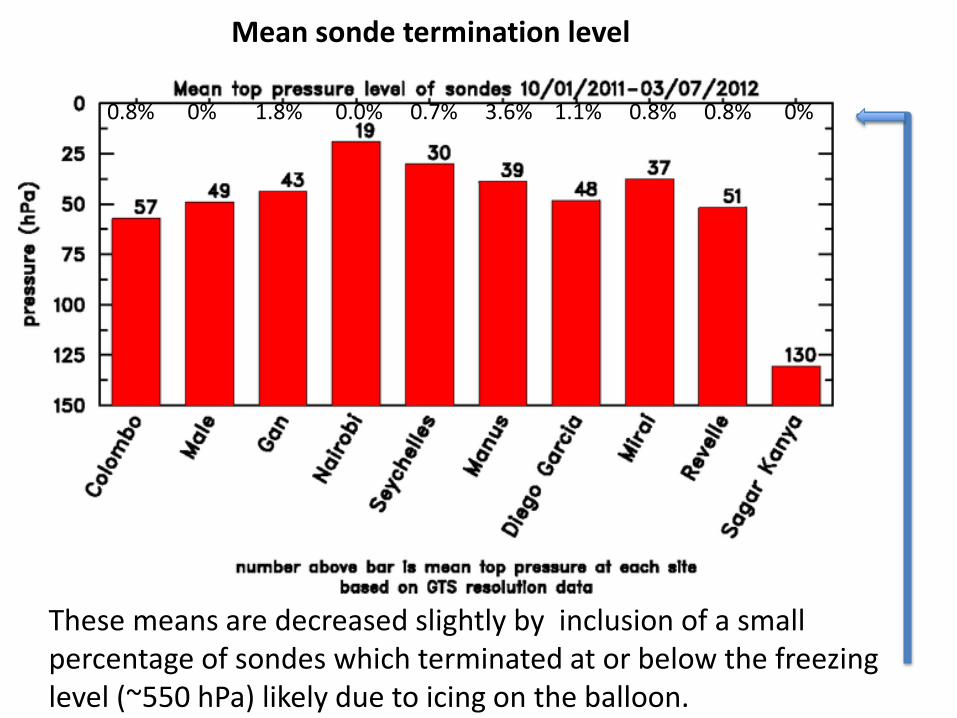
Mean sonde termination level
These means are decreased slightly by inclusion of a small percentage of sondes which terminated at or below the freezing level (~550 hPa) likely due to icing on the balloon.
0.8% 0% 1.8% 0.0% 0.7% 3.6% 1.1% 0.8% 0.8% 0%

Seven sonde types used among 53 Priority Sound Sites: • 27 Vaisala RS92 (Male’, Gan, Manus, four R/V, DG, Seychelles,
Nairobi and 17 others)
• 13 Meisei (Colombo and 12 Indonesian sites)
• 1 Modem (Ranai)
• 2 Graw (Singapore and Laoag)
• 7 IM MK3 (Indian sites)
• 1 VIZ (Guam)
• 2 Sippican Mark IIA (Koror and Yap)
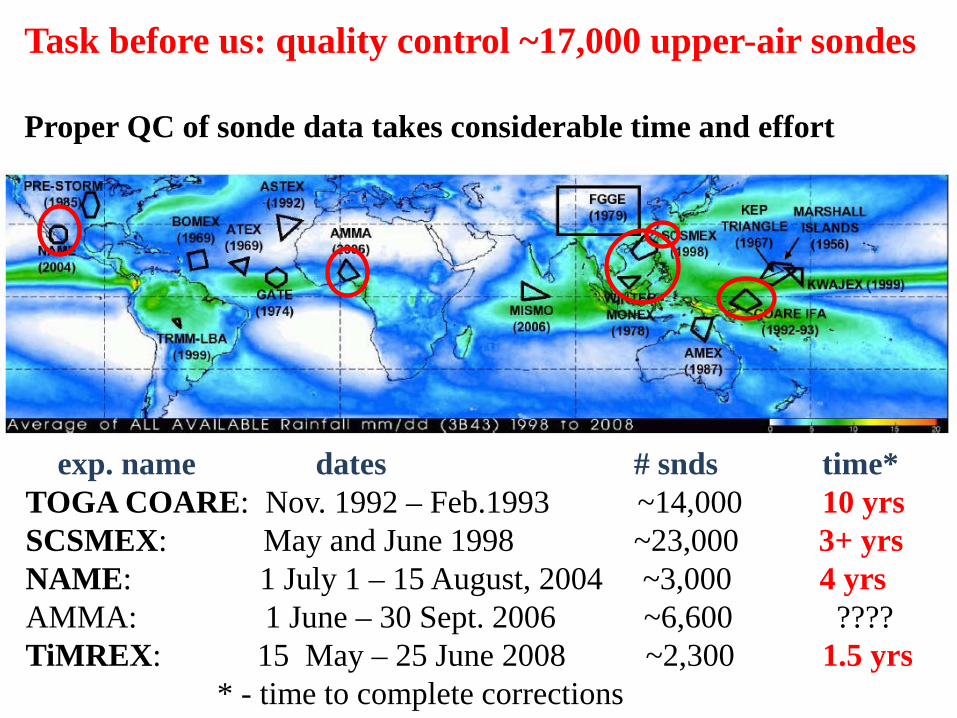
Task before us: quality control ~17,000 upper-air sondes Proper QC of sonde data takes considerable time and effort
exp. name dates # snds time* TOGA COARE: Nov. 1992 – Feb.1993 ~14,000 10 yrs SCSMEX: May and June 1998 ~23,000 3+ yrs NAME: 1 July 1 – 15 August, 2004 ~3,000 4 yrs AMMA: 1 June – 30 Sept. 2006 ~6,600 ???? TiMREX: 15 May – 25 June 2008 ~2,300 1.5 yrs * - time to complete corrections
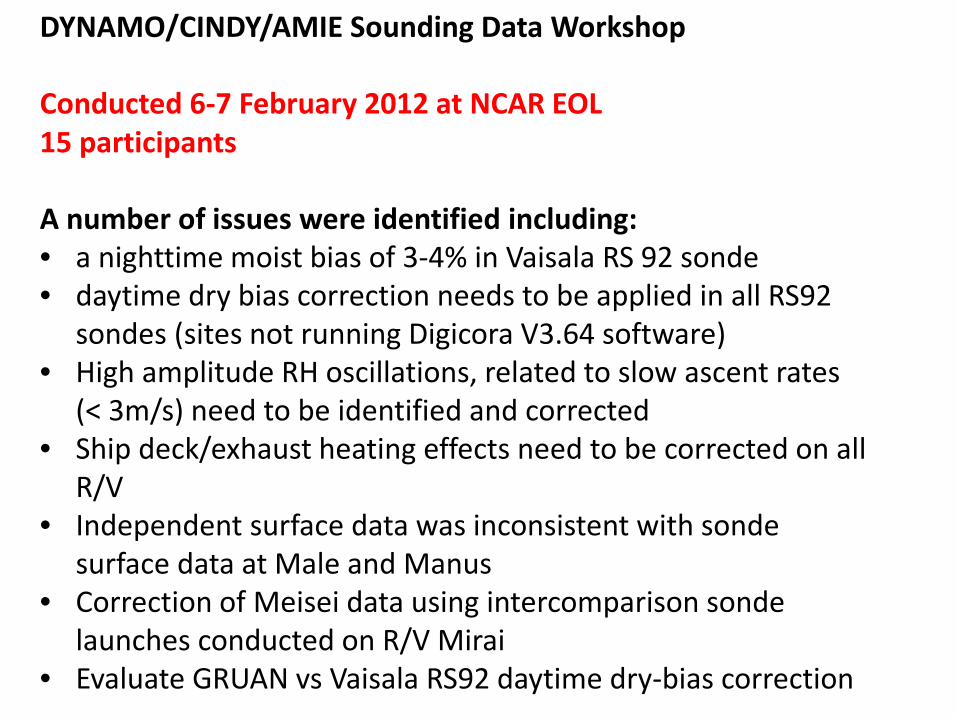
DYNAMO/CINDY/AMIE Sounding Data Workshop Conducted 6-7 February 2012 at NCAR EOL 15 participants A number of issues were identified including: • a nighttime moist bias of 3-4% in Vaisala RS 92 sonde • daytime dry bias correction needs to be applied in all RS92
sondes (sites not running Digicora V3.64 software) • High amplitude RH oscillations, related to slow ascent rates
(< 3m/s) need to be identified and corrected • Ship deck/exhaust heating effects need to be corrected on all
R/V • Independent surface data was inconsistent with sonde
surface data at Male and Manus • Correction of Meisei data using intercomparison sonde
launches conducted on R/V Mirai • Evaluate GRUAN vs Vaisala RS92 daytime dry-bias correction
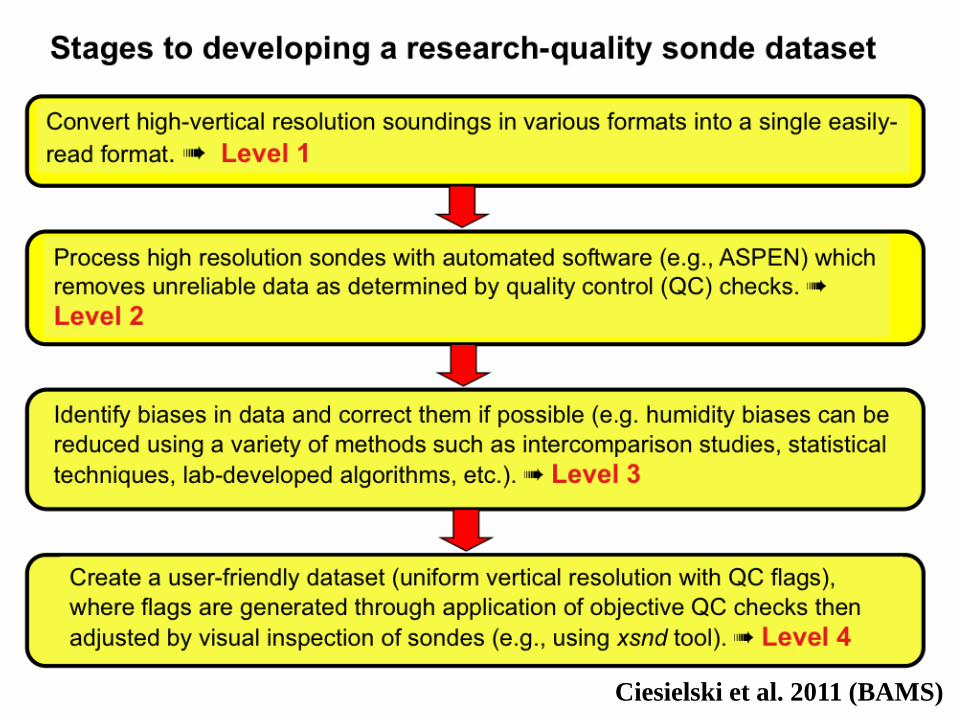
Ciesielski et al. 2011 (BAMS)

Site Level 0 Level 1 Level 2 Level 3 Level 4
Hi-res, raw
Hi-res, common
Hi-res, QC’ed
Hi-res, corrected 5-hPa, QC flags
Dropsondes x x x x Summer 12
Diego Garcia x na na Summer 12 Fall 12
Revelle x na na “ “
Gan x p p Summer/Fall 12 Winter 12
Manus x p p “ ‘’
Male x “ “
Colombo p “ “
Mirai x “ “
Nairobi “ “
Seychelles x “ “
13 Indonesian sites p Fall 2012 Winter/Spring 13
7 other PS sites p p p “ “
Estimated schedule for release of different versions of dataset
x – task completed, p – partially done, na – not available,

Summary
• Atmospheric sounding effort in DYNAMO/CINDY/AMIE has been an extraordinary success in all respects
• Quality control of the dataset has begun. As different levels are
completed, they will be made available on EOL data catalog: http://data.eol.ucar.edu/master_list/?project=DYNAMO • Biases (e.g, nighttime moist bias, upper-level dry bias in RS92) and
problems (e.g,, ship structure heating) are being identified and will be corrected in Level 3 products.
• Humidity errors in uncorrected RS92 sondes are on the order of
3-5% in column integrated sense. • Priority of QC effort is being given to sites in the core of enhanced
sonde network (i.e., central India Ocean).

Questions
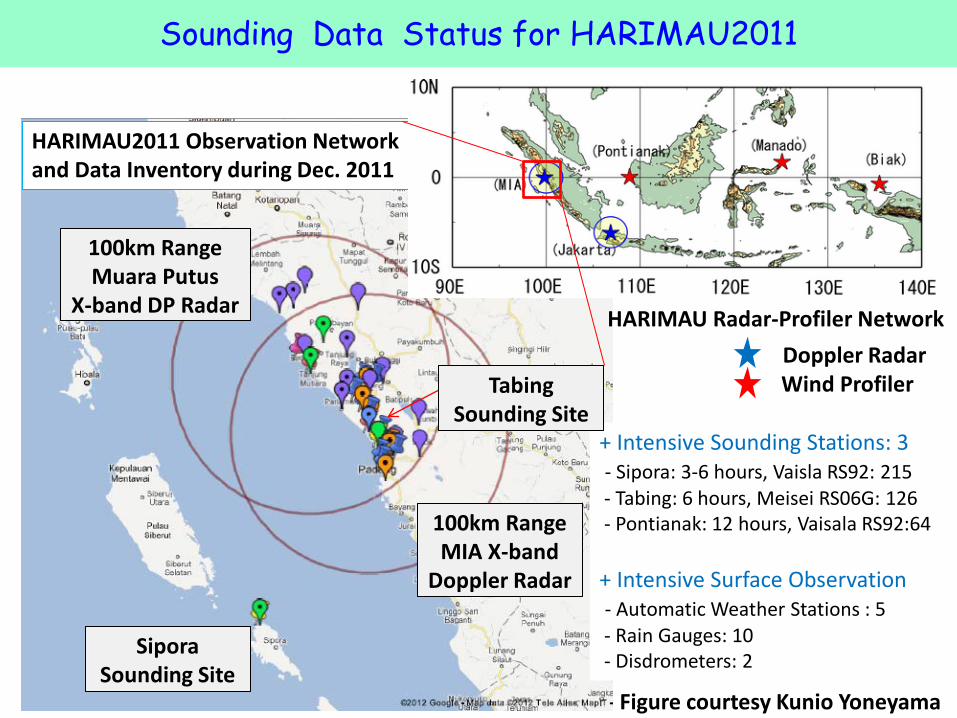
Sounding Data Status for HARIMAU2011
HARIMAU2011 Observation Network and Data Inventory during Dec. 2011
HARIMAU Radar-Profiler Network Doppler Radar Wind Profiler
100km Range Muara Putus
X-band DP Radar
100km Range MIA X-band
Doppler Radar
Sipora Sounding Site
+ Intensive Sounding Stations: 3 - Sipora: 3-6 hours, Vaisla RS92: 215 - Tabing: 6 hours, Meisei RS06G: 126 - Pontianak: 12 hours, Vaisala RS92:64 + Intensive Surface Observation - Automatic Weather Stations : 5 - Rain Gauges: 10 - Disdrometers: 2
Tabing Sounding Site
Figure courtesy Kunio Yoneyama

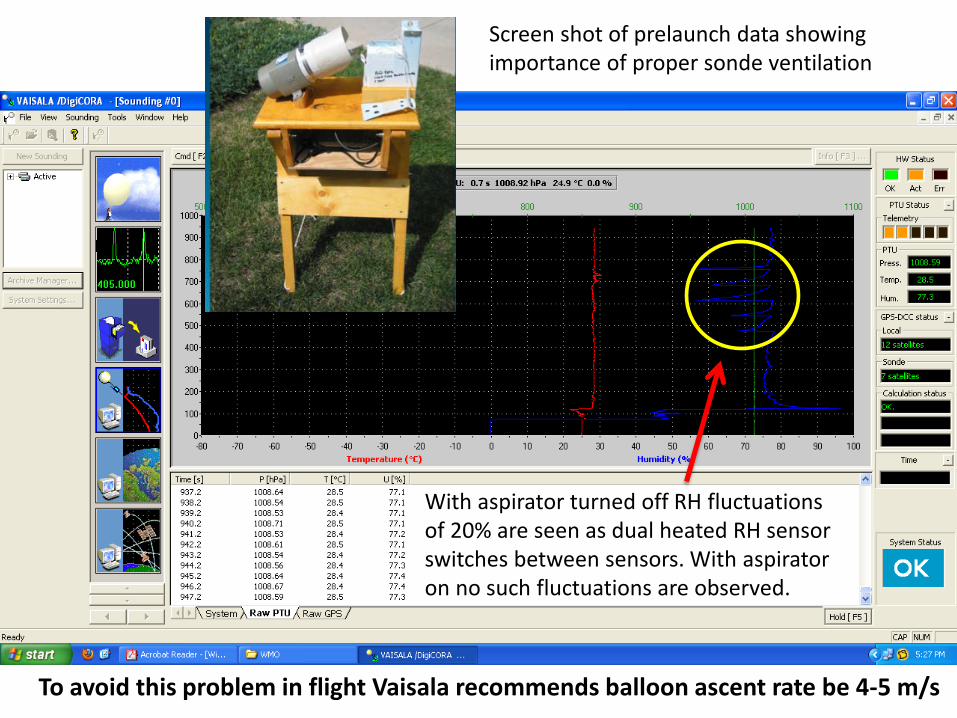
With aspirator turned off RH fluctuations of 20% are seen as dual heated RH sensor switches between sensors. With aspirator on no such fluctuations are observed.
Screen shot of prelaunch data showing importance of proper sonde ventilation
To avoid this problem in flight Vaisala recommends balloon ascent rate be 4-5 m/s
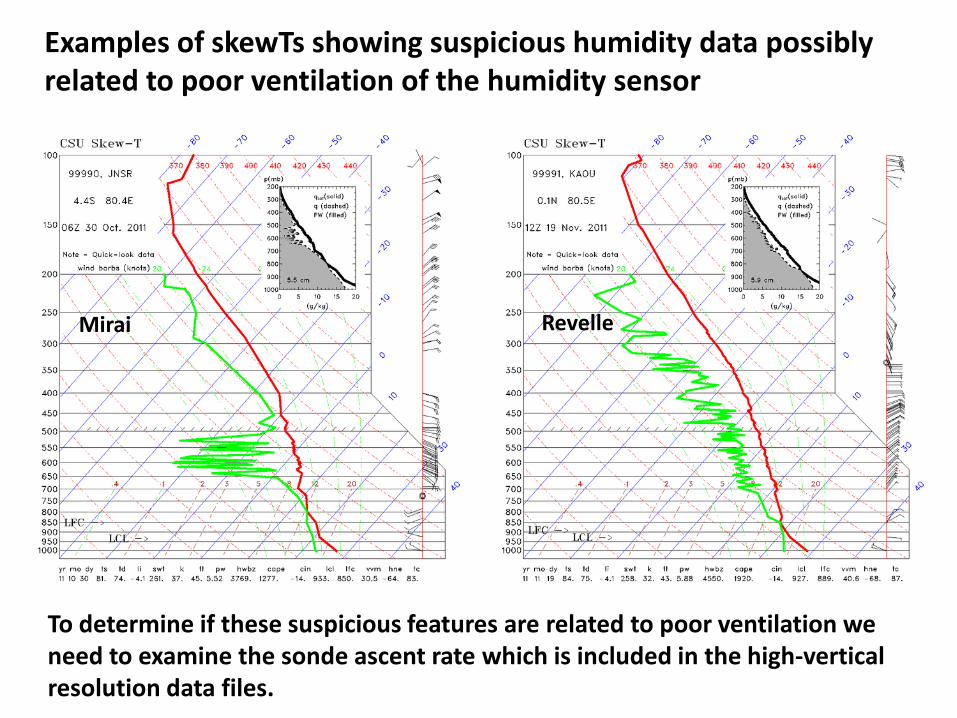
Examples of skewTs showing suspicious humidity data possibly related to poor ventilation of the humidity sensor
Mirai Revelle
To determine if these suspicious features are related to poor ventilation we need to examine the sonde ascent rate which is included in the high-vertical resolution data files.
20
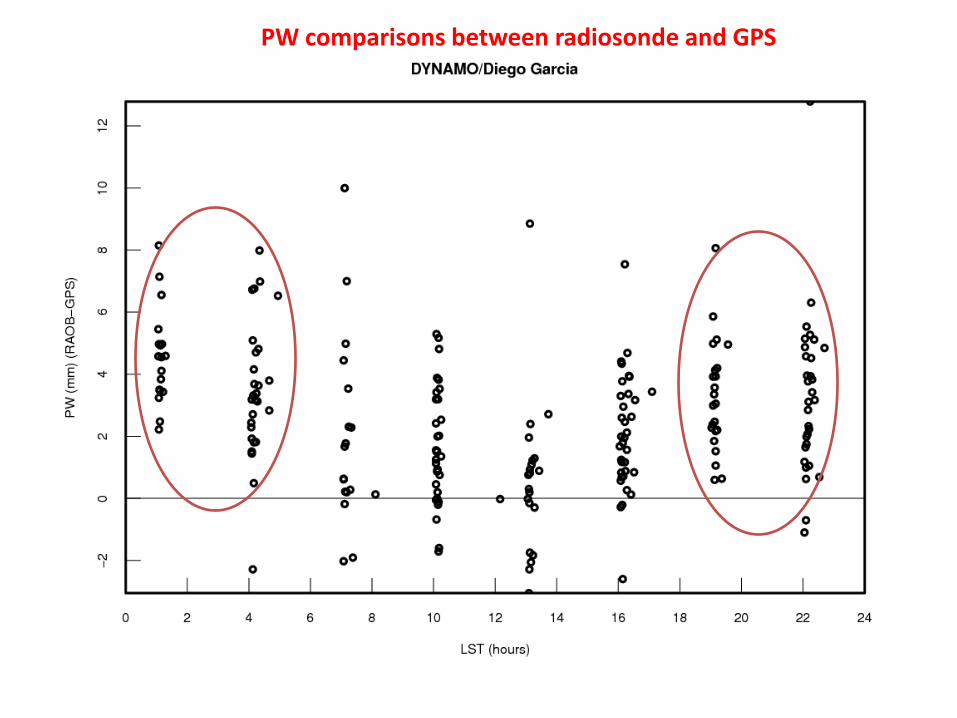
PW comparisons between radiosonde and GPS

Sonde too wet or surface too dry ???
21
22
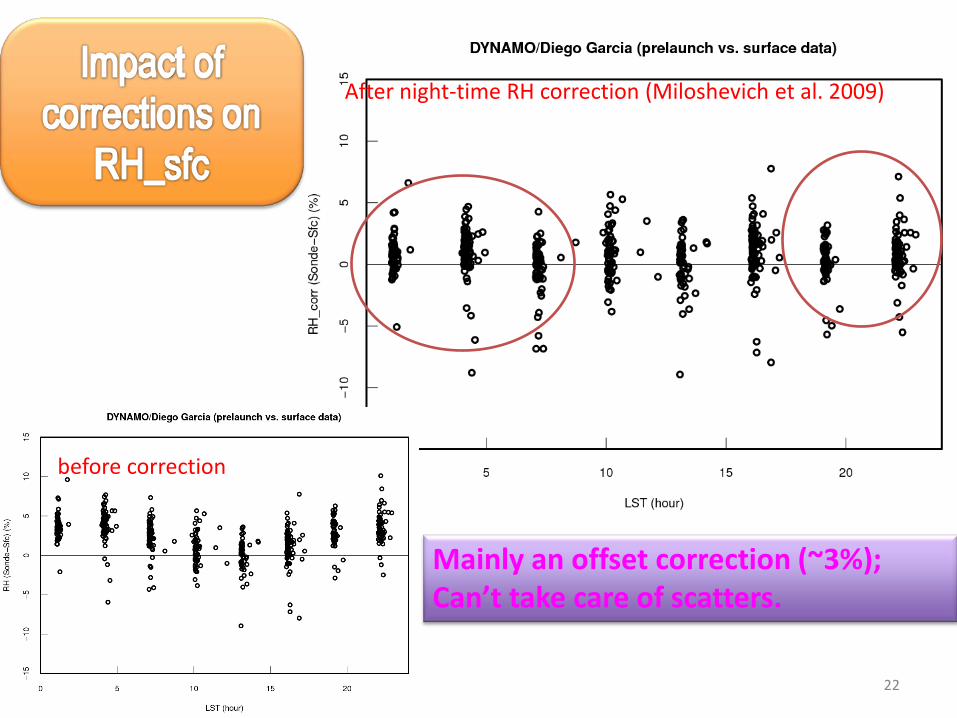
After night-time RH correction (Miloshevich et al. 2009)
before correction
Mainly an offset correction (~3%); Can’t take care of scatters.

Sounding Data Status ( 6/7 )
5) Indonesia (HARIMAU/SATREPS Project relevant) * Local Main counterpart - BPPT (Agency for Assessment and Application of Technology) * System maintenance and Data processing are done by Kyoto University. Pontianak Wind Profiler Missing period Oct 29, Dec 1 AWS Missing period Nov 17 – Jan 9 Manado Wind Profiler Missing period Oct 14 – 18, Nov 4 – 6, Nov 17 – 18 AWS No operational Biak Wind Profiler Missing period Oct 16 – Dec 26 AWS Missing period N/A * Data are available from http://www.jamstec.go.jp/iorgc/harimau/observation.html#data
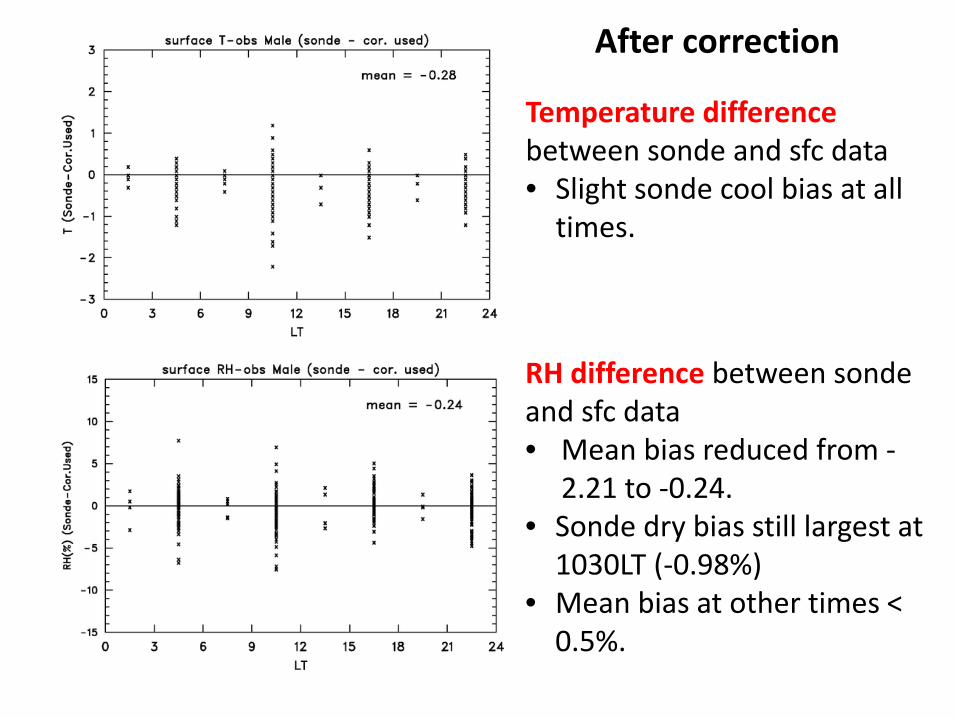
Temperature difference between sonde and sfc data • Slight sonde cool bias at all
times.
RH difference between sonde and sfc data • Mean bias reduced from -
2.21 to -0.24. • Sonde dry bias still largest at
1030LT (-0.98%) • Mean bias at other times <
0.5%.
After correction
•Level 3 data is linearly interpolated to create uniform resolution •A series of Quality-Control (QC) checks are applied which flag data as questionable or bad (for details see http://www.eol.ucar/projects/sondeqc) •After assigning objective QC flags, a software program (xsnd) is used to visually examine each sounding to subjectively adjust these flags.
•Using xsnd provides a mean to easily “buddy check” the data, i.e., visually compare sondes adjacent in time and in close proximity to each other for continuity of features.
Level 4: Uniform resolution dataset with QC flags marking suspicious data
How is it created?

Visual inspection of sondes, while tedious, is necessary to ensure a research quality dataset since subtle errors in sonde data are often difficult to detect with objective procedures. To facilitate this processing, we’ve developed a software tool (its display is shown below) which allows one to visually inspect a sonde and easily flag suspicious data.
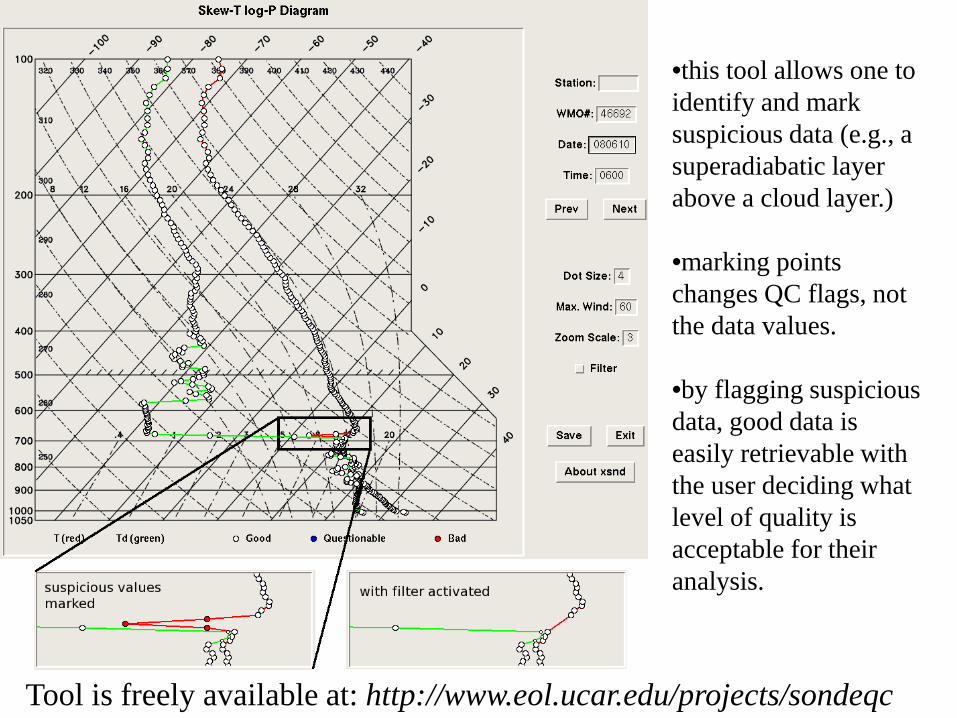
•this tool allows one to identify and mark suspicious data (e.g., a superadiabatic layer above a cloud layer.) •marking points changes QC flags, not the data values.
•by flagging suspicious data, good data is easily retrievable with the user deciding what level of quality is acceptable for their analysis.
Tool is freely available at: http://www.eol.ucar.edu/projects/sondeqc
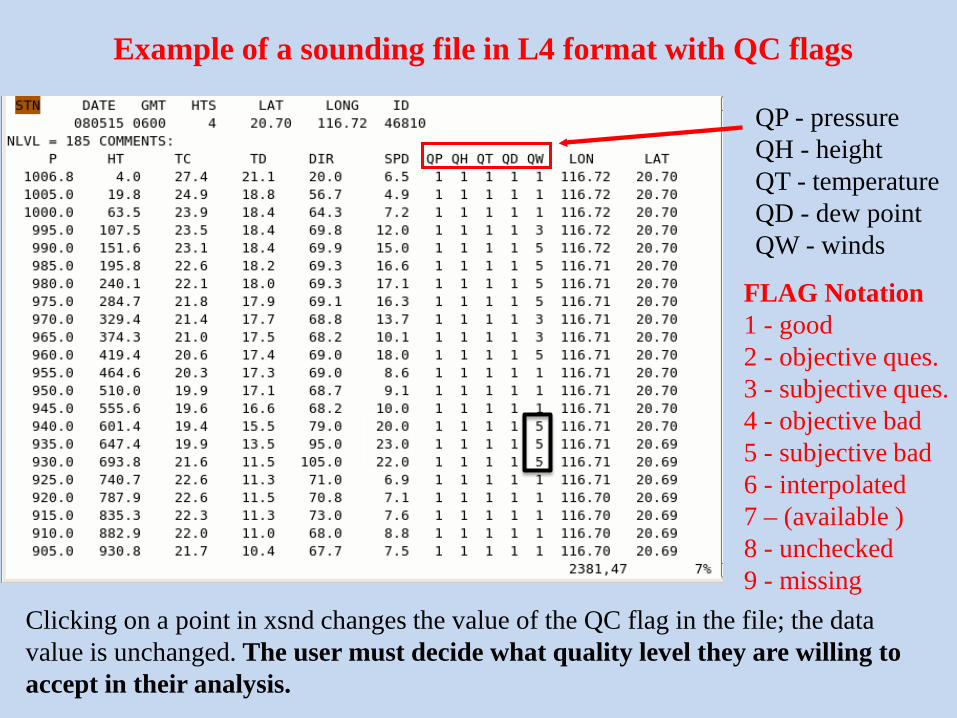
Example of a sounding file in L4 format with QC flags
Clicking on a point in xsnd changes the value of the QC flag in the file; the data value is unchanged. The user must decide what quality level they are willing to accept in their analysis.
FLAG Notation 1 - good 2 - objective ques. 3 - subjective ques. 4 - objective bad 5 - subjective bad 6 - interpolated 7 – (available ) 8 - unchecked 9 - missing
QP - pressure QH - height QT - temperature QD - dew point QW - winds

• Launch success rate at Manus was 93%, dropsondes 99.8%, overall success rate for enhanced network 96%
• Preliminary estimates indicate that over 95% of sondes were transmitted onto GTS to be used by operational centers in their assimilation process.
• Nearly 100 personnel were involved in sonde field operations including more than 30 students from US, Japan, Taiwan and Europe.
100%
93%
94%
99% 96%
Launch success rate
97%