Embed Size (px)
Citation preview

ENERGY FROM MUNICIPAL SOLID WASTE
Paul Amodeo, Ph.D.
SUNY Coblekill
Center for Environmental Science & Technology (CEST)

Energy from Municipal Solid Waste
GASIFICATION THEORY & PRACTICE

GASIFICATION
KEY ENGINEERING FACTORS
Technologies differ in many aspects but rely on
four key engineering factors:
Reactor design;
Gasification reactor atmosphere (level of oxygen or
air content);
Internal and external heating; and
Operating temperature

REACTOR DESIGN
CONVENTIONAL GASIFIER REACTORS
Generally oriented as vertical columns
Lack agitation in the reaction zone - Leads to numerous technical issues
significant need for control of feedstock size and moisture content
potential dead zones
Fluidized bed Fixed Bed

REACTOR DESIGN
ROTARY KILN GASIFIER REACTOR
Horizontally oriented reaction vessel placed on a slight slope
Natural rotation provides agitation of feedstock at high temperatures Allows for a complete conversion of the material to gas
Lack of a definable contacting bed Able to accept a wide variety of feedstock shapes and
sizes

GASIFICATION REACTOR ATMOSPHERE
Feedstock is subjected to high heat, pressure,
and either an oxygen-rich or oxygen-starved
environment within the gasifier.
Can be air or oxygen in combination with steam.
To a point, the water present takes part in a
positive manner toward the formation of desired
syngas end products

REACTOR HEATING
In general, gasification reactions are endothermic.
Need for some source of energy
May be heated
External to the vessel
Reminiscent of predominately pyrolytic processes where the
intent is shifted from the production of syngas to production of
an energy rich char.
Internally
combustion of some of the product gases
through the application of auxiliary heat.

OPERATING TEMPERATURES
Can be varied depending upon the desired
composition of the syngas.
Lower temperatures favor
Tar and ash production are favored
larger particulate sizes
Higher temperatures
Tar production tends to decrease
probably due to extended thermal cracking and steam reforming
reactions

THE GASIFICATION PROCESS
Pyrolysis (devolatilization): As carbonaceous fuels are heated volatiles are released and
char is produced.
Often produces hydrocarbon liquids (pyrolytic oils)
Combustion: Volatiles and char react with oxygen to form carbon dioxide
and carbon monoxide.
The heat produced promotes subsequent gasification reactions.
Gasification: Char reacts with carbon dioxide and steam to produce
syngas

GASIFICATION REACTIONS
Reactions
Carbonaceous solid and water.
C + H2O → CO + H2
Carbonaceous solid and carbon dioxide.
C + CO2 → 2 CO
Carbonaceous solid and hydrogen. C + 2 H2 → CH4
Other
Water Shift Reaction (High temperature, exothermic, catalytic). CO + H2O ↔ CO2 + H2
Product Temperature dependence
Higher temperatures (approximately 1000 deg C), CO and H2 (more than 85% by volume)
Lower temperatures: CH4 and CO2

EMISSION BYPRODUCTS
Ash:
mineral matter and particulates
Nitrogenous Products:
ammonia and NOx;
Volatile Organic Emissions (VOCs):
tars and oils
from a system that is not working optimally

Energy from Municipal Solid Waste
THE PROJECT

ROTARY GASIFICATION PROJECT OVERVIEW
Managed by US Army Corps of Engineers.
Funded by Strategic Environmental Research
and Development Program (SERDP).
Additional funding approved for later 2015
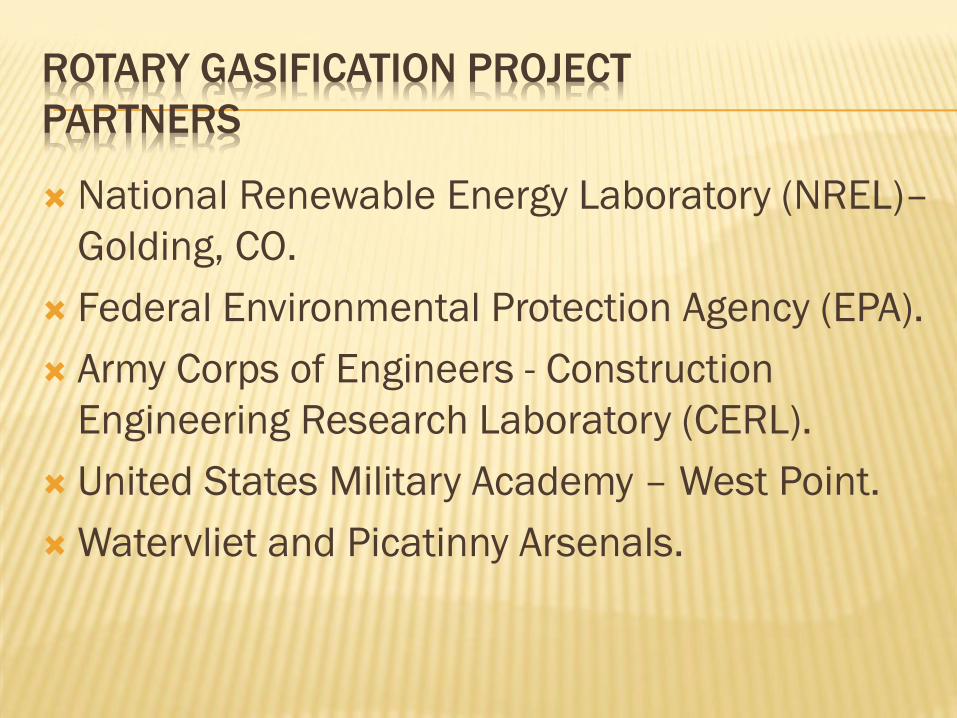
ROTARY GASIFICATION PROJECT
PARTNERS
National Renewable Energy Laboratory (NREL)–
Golding, CO.
Federal Environmental Protection Agency (EPA).
Army Corps of Engineers - Construction
Engineering Research Laboratory (CERL).
United States Military Academy – West Point.
Watervliet and Picatinny Arsenals.

WHY SUNY COBLESKILL?
SUNY Cobleskill’s available diversified biomass "test-feed“
Paper
Green
Animal Waste
Cafeteria Wastes
Organic Municipal Solid Wastes

PARTNER/FUNDING OBJECTIVES
● Create a design for a deployable
waste-to-energy (WTE) system
that meets the requirement of
the SON:
Based on gasification
Processes 1 to 3 tons/day of
mixed, non-hazardous solid
waste, with minimal sorting or
pretreatment required
Self-powered, with net positive,
exportable electric energy
Sized to fit two, 20 foot shipping
containers

Energy from Municipal Solid Waste
INCLINED INDIRECT FLAME PYROLITIC
ROTARY GASIFIER(IIFPRG)

COBLESKILL PROCESS
Unique Rotary Gasification.
Produces gaseous and (potentially) liquid fuels.
Accelerates what naturally occurs in the earth over thousands of years to less than 20 minutes (startup time).
End product is the generation of electricity and potential liquid fuels from waste and biomass.
Military use on forward operating bases as liquid fuel substitute while eliminating base waste
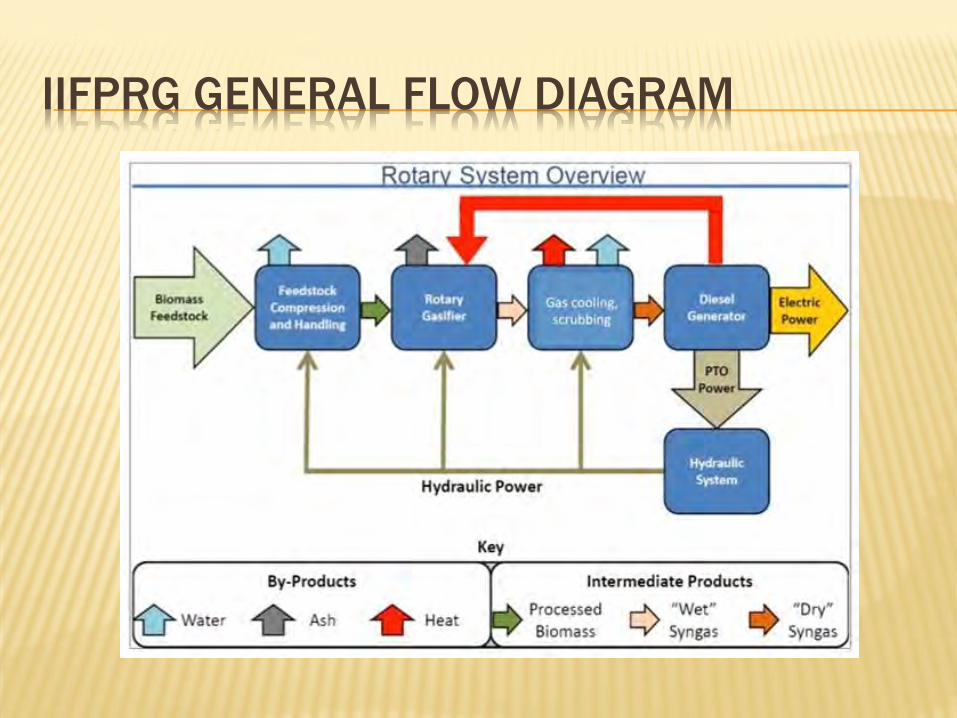
IIFPRG GENERAL FLOW DIAGRAM

THERMOCHEMICAL MODEL
Based on proximate analysis
of feedstock: HHV, volatiles,
fixed carbon, ash, moisture
For 60kW generator, syngas
flow to engine limits to 2
ton/day max.

INITIAL ENERGY CALCULATIONS (CERL)
USED IN ENERGY BALANCE
All required motors and pumps are driven by the power takeoff on the diesel generator,
keeping the system completely self sufficient. The system also presents the opportunity for
cogeneration through the use of wasted heat.
Operating Power Summary Maximum Driver Power of M-1 .5 BHP
Total Hydraulic Motor Power M-2 8.3 BHP Total Hydraulic Motor Power M-3 2.8 BHP
Design power of Hydraulic Motor M-4 2.2 BHP Power of Feedstock Handling System 9.3 BHP Total Hydraulic Motor Power 23.1 BHP
Hydraulic Motor Efficiency 95% Net Hydraulic Power 24.3 BHP
Engine Hydraulic Pump Eff. 95% Shaft Power Consumed at Engine Hyd. Pump 25.6 BHP
Gross Engine Shaft Power 99 BHP Net Engine Shaft Power 73.4 BHP Efficiency of Generator Head 90%
Estimated Usable Power Generated 49.6 kW (66.51 BHP)
Available Thermal Energy for Water Heating
Usable Water Temperature 180 deg. F Recoverable Heat from Scrubbing Fluid 35,000 BTU/hr
Recoverable Heat from Engine Cooling System 153,660 BTU/hr Maximum Recoverable Exhaust Gas Energy 77,780 BTU/hr
Total Recoverable Heat for Water Heating 266,440 BTU/hr Water Flow Rate at 160 F in and 180 F out 26.6 GPM

WASTE MIX SELECTION
● Design of waste mixes to emulate average data from CENTCOM reports
● Variations to account for mission, hourly, or personnel

STANDARD MIX GASIFIER FEED PROPORTIONS
WITH MOISTURE CONTENTS
No. Feedstock
Type Description
Component
% Wet Basis
Pro Rated
Moisture
Wet Feed
Rate, lbs/hr
1 Cardboard OCC, corrugated 15% 1.2% 14.6
2 Mixed Paper Office, news, any mixed clean
paper 15% 1.2% 14.6
3 HDPE Plastic 6% 0.0% 5.8
4 PET Plastic 6% 0.0% 5.8
5 PP Plastic 6% 0.0% 5.8
6 Food Campus Cafeteria Food Waste 20% 15.8% 19.4
7 Wood Plywood, construction waste
wood 24% 9.4% 23.3
8 Inerts Metals, glass 4% 0.0% 3.9
9 Textiles Polyester blends and cotton 4% 0.3% 3.9
Totals = 100% 28.0% 97.2
Energy from Municipal Solid Waste
IIFPRG DATA ANALYSIS

IIPRG GASIFIER TEMPERATURES USING THE
STANDARD MIX
0
200
400
600
800
1000
1200
0 5000 10000 15000 20000 25000
Tem
per
atu
re (
⁰F)
Time (Seconds)
TSS 101514-01 Internal and Discharge Gasifier TemperaturesSERDP Long Term Mix
2" From Feed Point
16" From Feed Point
24" From Feed Point
Gasifier Discharge

PERCENT DIESEL FUEL SAVINGS WITH SYNGAS
SUBSTITUTION
Statistic
% Diesel Fuel
Saving
Average 44.7%
Min 19.0%
Max 78.1%
Standard
Deviation 16.2%
Diesel fuel savings are calculated for 32 CLIP Tests collected from 10 continuous
runs of 1 to 4.5 hours in duration

DIESEL FUEL SAVINGS RELATIVE TO LOW
HEATING VALUE
0.0%
10.0%
20.0%
30.0%
40.0%
50.0%
60.0%
15000 20000 25000 30000 35000 40000 45000 50000
% D
iese
l Fu
el S
ave
d
Syngas Low Heating Load (BTU/HR)
Diesel Fuel Savings Relative to Low Heating Load
Liquid Diesel Fuel Savings, % Best-Fit Linear (Best-Fit)
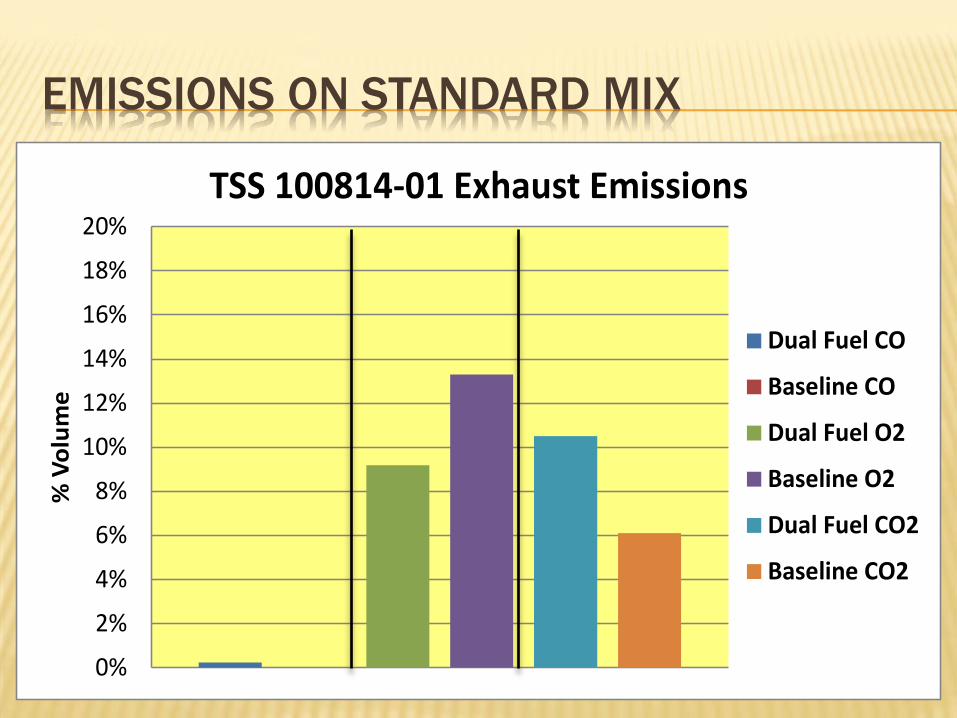
EMISSIONS ON STANDARD MIX
0%
2%
4%
6%
8%
10%
12%
14%
16%
18%
20%
% V
olu
me
TSS 100814-01 Exhaust Emissions
Dual Fuel CO
Baseline CO
Dual Fuel O2
Baseline O2
Dual Fuel CO2
Baseline CO2

NOX EMISSIONS
0
100
200
300
400
500
600
Par
ts p
er M
illio
n
TSS 10814-01 Exhaust Emissions
Dual Fuel NOx PPM
Baseline NOx PPM

STANDARD MIX - SYNGAS ANALYSIS
GC – MASS SPEC

STANDARD MIX – DIESEL EXHAUST ANALYSIS
GC – MASS SPEC

SYNGAS FEED COMPARISONS WITH JP-8
GC – MASS SPEC

EXHAUST COMPARISONS TO ROAD DIESEL
GC – MASS SPEC

SYNGAS HYDROCARBON GROUP COMPARISON
Hydrocarbon Group Comparison of Three Syn-Gas Mixes
0
5
10
15
20
25
30
35
40
45
50
Alkanes CycloAlkanes Alkenes AlkylBenzenes Indanes Naphthalenes
Groups
% C
om
po
sit
ion
50%-Plastic50%-FoodLong Term Mix
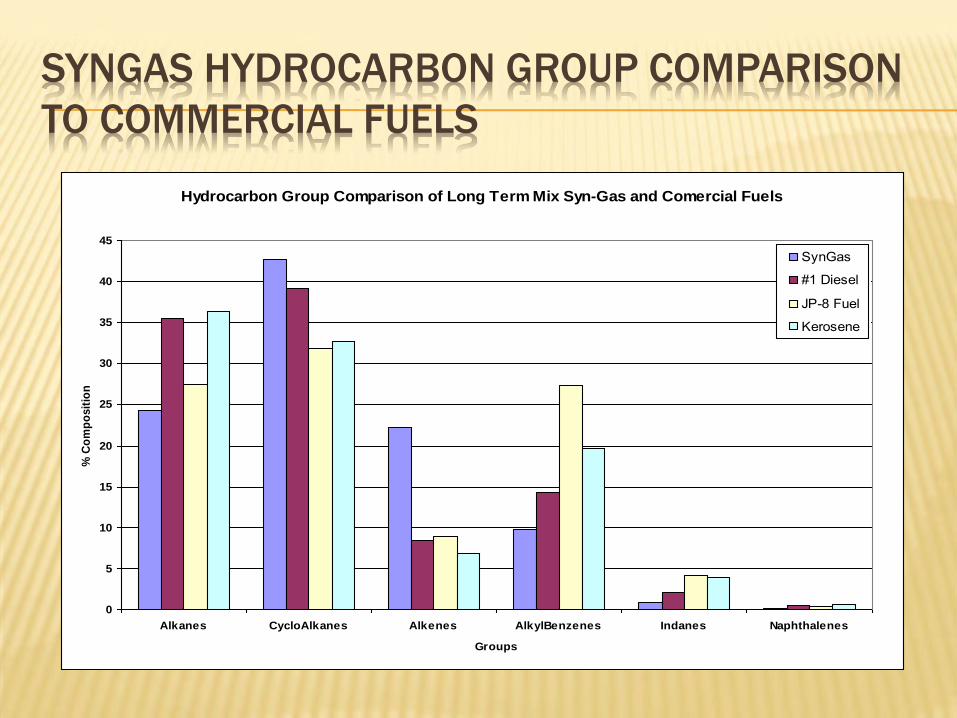
SYNGAS HYDROCARBON GROUP COMPARISON
TO COMMERCIAL FUELS
Hydrocarbon Group Comparison of Long Term Mix Syn-Gas and Comercial Fuels
0
5
10
15
20
25
30
35
40
45
Alkanes CycloAlkanes Alkenes AlkylBenzenes Indanes Naphthalenes
Groups
% C
om
po
sit
ion
SynGas
#1 Diesel
JP-8 Fuel
Kerosene

Energy from Municipal Solid Waste
CONCLUSIONS & FUTURE

COMPARISON WITH STATE OF THE ART
IIFPRG STATE OF THE ART
Feed Sizing
Little to no feed preparation
Moisture content
Have experienced good gas quality and acceptable tar with up to 50% moisture in feed
Gas Quality
Good gas quality
Able to substitute an average of 45% for diesel fuel with values up to 78%
Rapid Startup and Shutdown
Acceptable exhaust emissions – Reduced NOx
Feed sizing
Required for vertical units
Not required for rotary kilns
Moisture content
Poor gas and unacceptable tar with moisture much over 10%
Gas Quality
Generally lower gas quality
Often Long Startup and Shutdown
Acceptable exhaust emissions

GOOD NEWS
Project continues to be a technical success.
Meets the military objectives.
Fuel gas has higher energy than expected.
Able to reach performance targets at 50% of
the design flow.
Significant findings with liquid fuels.

POSSIBLE NEXT STEPS
Back feed electrical power onto campus grid using induction generation.
Enhance hydrogen production by splitting water.
Cogeneration using non-digestible ag wastes and silage plastics.
Liquid fuels from wastes.
Develop waste/biomass battery concept.
Increase generation capacity.
Fully automate.
Develop miniature size.
FUTURE DIRECTIONS
Commercialization.
Cruise Ships.
Disaster relief (FEMA).
Long Island Energy Infrastructure Development.
Patent Pursuit (April 2015).
SBIR (Small Business Innovation Research).