Embed Size (px)
Citation preview

Patterns of drinking behaviour Patterns of drinking behaviour and incidence of diseases amongst and incidence of diseases amongst
Scottish adultsScottish adults
Presented by:
Dami Olajide
BackgroundBackground
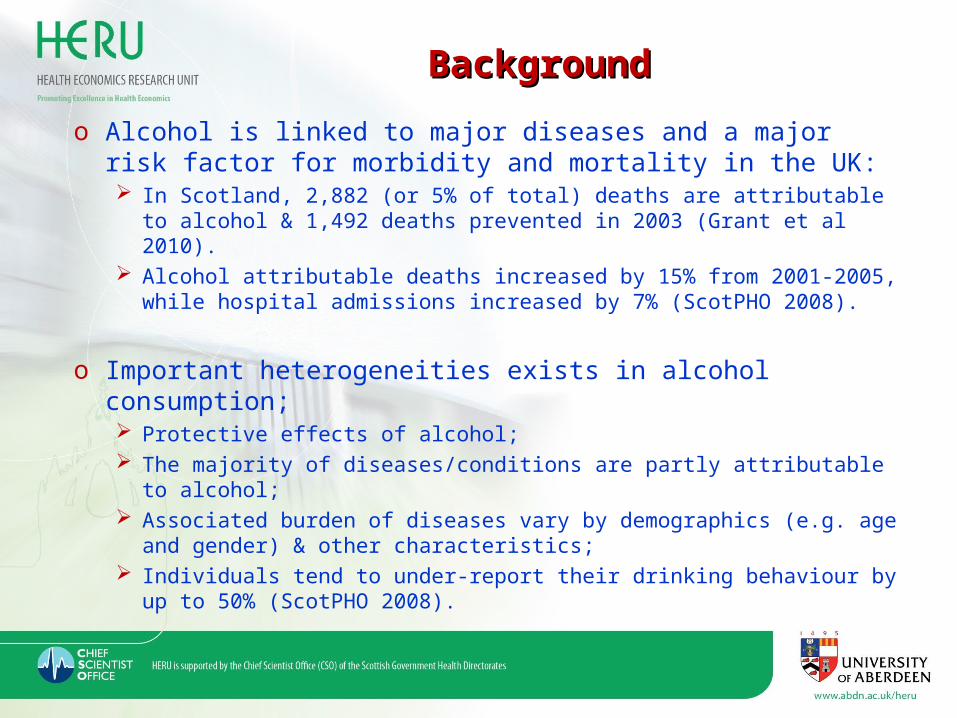
o Alcohol is linked to major diseases and a major risk factor for morbidity and mortality in the UK: In Scotland, 2,882 (or 5% of total) deaths are attributable to alcohol & 1,492
deaths prevented in 2003 (Grant et al 2010). Alcohol attributable deaths increased by 15% from 2001-2005, while hospital
admissions increased by 7% (ScotPHO 2008).
o Important heterogeneities exists in alcohol consumption; Protective effects of alcohol; The majority of diseases/conditions are partly attributable to alcohol; Associated burden of diseases vary by demographics (e.g. age and gender) &
other characteristics; Individuals tend to under-report their drinking behaviour by up to 50%
(ScotPHO 2008).
Aim and objectivesAim and objectives
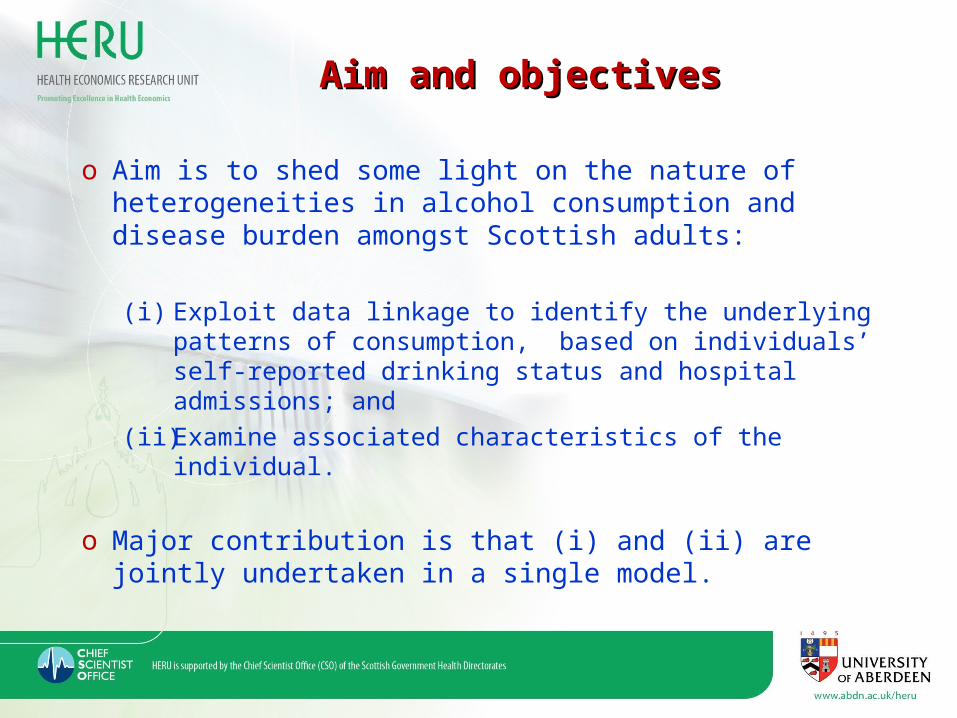
o Aim is to shed some light on the nature of heterogeneities in alcohol consumption and disease burden amongst Scottish adults:
(i) Exploit data linkage to identify the underlying patterns of consumption, based on individuals’ self-reported drinking status and hospital admissions; and
(ii) Examine associated characteristics of the individual.
o Major contribution is that (i) and (ii) are jointly undertaken in a single model.

Methods (1): DataMethods (1): Data
o Linked data set: Hospitalisation episodes from the Scottish Morbidity Records (SMR); Respondent characteristics from the Scottish Health Survey (SHeS).
o Incidence of an alcohol-related disease/condition: Presence of specific ICD9 & ICD10 codes (N=4,984 or 24%) Wholly or partially attributable to alcohol consumption (98% partially)
o Disease categories: abdominal/liver, cancers, heart (16%), nervous system/mental disorder,
others-conditions; none.

Data (ctd.)Data (ctd.)

Methods (2): ApproachMethods (2): Approach
o Latent class analysis (LCA) approach statistical method used to identify homogenous, mutually exclusive
groups (classes) existing within a heterogeneous population. Widely used in health care research to analyse behavioural patterns.
o Latent class regression model A single model for LCA for polytomous responses + regression
(Linzer and Lewis 2011) Item-response probabilities are obtained from LCA based on self-
reported drinking status and related diseases/conditions Characteristics associated with class membership are then obtained
from regression.
o Separate analysis for females and males.

Results (1): Latent class profilesResults (1): Latent class profiles
Females Males
C 1 C 2 C 3 C 1 C 2 C 3
Pr (class membership) 0.47 0.30 0.23 0.42 0.29 0.29
Alc. consumption: Never drk 0.031 0.061 0.178 0.014 0.043 0.042
Ex-drinker 0.014 0.091 0.099 0.014 0.041 0.102
Occ. or < 7 0.481 0.602 0.564 0.278 0.243 0.325
Over 7-14 0.214 0.157 0.106 0.215 0.101 0.146
Over 14 -28 0.193 0.059 0.04 0.277 0.272 0.197
Over 28 0.067 0.03 0.013 0.202 0.30 0.188
SMR post survey: None 0.942 0.802 0.395 0.962 0.884 0.307
Abdominal/liver 0.021 0.071 0.066 0.01 0.021 0.077
Cancers 0.015 0.014 0.041 0.004 0 0.021
Heart 0.01 0.067 0.489 0.022 0.017 0.567
Nervous/mental 0.006 0.027 0.006 0 0.054 0.016
Other (conditions) 0.006 0.018 0.003 0.002 0.024 0.012

Profiles continued (notes only)

Results (2): Graphical displaysResults (2): Graphical displaysFig.1. Females Fig.2. Males

Characteristics of class membershipCharacteristics of class membership
Females Males
Variables: (2/1) (2/1)
Age: No clear age effect Clear age effect (increasing)
Marital status: Lower for divwidsep Lower for married or cohabiting
Education qual: Decreasing progressively Significant only at degree level
Occ. soc. class: Decreasing progressively No association
Deprivation: Increasing progressively Significant only for most deprived.
Gtr. Glasgow: No association Positive association
(3/1) (3/1)
Age: Increasing progressively Similar
Marital status: Married/cohabiting positive Similar
Education qual: Decreasing progressively Similar, but lower in magnitude
Occ. soc. class: Decreasing progressively Similar
Deprivation: Increasing progressively Similar
Gtr. Glasgow: No association Positive association

Preliminary conclusionsPreliminary conclusions
o Given their patterns of alcohol and related diseases/conditions: Important gender differences at moderate level of risk (2/1) (age,
education qualification, social class, health board).• Women with better education and social class are at a lower risk of
alcohol-related diseases/conditions than men of similar characteristic. No clear gender differences in characteristics at highest level of
risk (3/1).
o Some indication of under-reporting: objective measures of alcohol consumption may reduce under-reporting.
o Diseases are largely partially related to alcohol.
o Further work: policy implications of findings