Embed Size (px)
Citation preview

Patterns of Convergence and Divergence in the
Euro Area
Ángel Estrada
Bank of Spain
Jordi Galí
Centre de Recerca en Economia Internacional
David López-Salido
Federal Reserve Board
Paper presented at the 13th Jacques Polak Annual Research Conference
Hosted by the International Monetary Fund
Washington, DC─November 8–9, 2012
The views expressed in this paper are those of the author(s) only, and the presence
of them, or of links to them, on the IMF website does not imply that the IMF, its
Executive Board, or its management endorses or shares the views expressed in the
paper.
1133TTHH JJAACCQQUUEESS PPOOLLAAKK AANNNNUUAALL RREESSEEAARRCCHH CCOONNFFEERREENNCCEE
NNOOVVEEMMBBEERR 88––99,, 22001122

Patterns of Convergence and Divergence in the Euro Area1
Ángel Estrada Jordi Galí David López-Salido
October 29, 2012
Abstract
We examine the extent of macroeconomic convergence/divergence among euro area countries over the past thirteen years. Our analysis pays special attention to the differential performance of labor markets, as well as the evolution of measures of competitiveness and the factors underlying the latter.
JEL Classification Numbers: E24, F31, O47
Keywords: macroeconomic convergence, labor markets, competitiveness, euro area
1 Prepared for the IMF Thirteenth Jacques Polak Annual Research Conference, November 89, 2012. Estrada: Bank of Spain. Galí: CREI, UPF and Barcelona GSE. López-Salido: Federal Reserve Board. The views expressed in this paper are those of the authors alone and do not necessarily reflect the views of the Bank of Spain or the Board of Governors of the Federal Reserve System or its staff.

2
1. Introduction
The creation of a European Monetary Union (EMU) in 1999 was widely expected to become a catalyst for further economic integration and convergence within Europe. The ongoing sovereign debt crisis and, more generally, the differential macroeconomic performance across euro area members in the aftermath of the 200809 recession has called into question that prediction, and led some commentators to argue that the adoption of a common currency may have instead been a factor of divergence and, in particular, a source of a growing gap between a “virtuous core” and a “sinful periphery.” The goal of the present paper is to assess whether the data support that view. In particular, we examine the extent of macroeconomic convergence/divergence among euro area countries over the past twelve years and the role that sharing a common currency may have played in accounting for that evolution. Our analysis pays special attention to the differential performance of labor markets as well as the evolution of measures of price-competitiveness and the factors underlying the latter, including wages and productivity. The relation between price-competitiveness and the current account imbalances is also explored, paying special attention to the role played by non price-competitiveness.
Our main findings can be summarized as follows: The first nine years of EMU were associated with a strong converge in unemployment rates across euro area countries. That process was interrupted and largely reversed by the financial crisis. This behavior of unemployment was largely determined by that of the employment rate, while the contribution of the participation rate was of a much lower magnitude.
Secondly, our analysis uncovers persistent inflation differentials and, as a result, large cumulative changes in relative prices, at least until 2007. Such dynamics reflect, to a large extent, the underlying patterns of unit labor costs and wages. The observed correlations suggest that the evolution of such measures of competitiveness has been a consequence of the differential growth rates in employment until 2007. Furthermore, rather than representing divergent patterns, the evolution of prices and unit labor costs was associated with a substantial convergence in the levels of those variables. In particular, the process of convergence in the prices of the traded products seems to have continued even during the recession.
Thirdly, and perhaps surprisingly, the large dispersion in current account balances across euro area countries seems to display a small correlation with “narrow” measures of competitiveness, as represented by relative price levels and unit labor costs. Instead, they seem to bear a stronger relation with

3
broader, non-price competitiveness factors. It follows that internal devaluation policies may have limited success at reducing external imbalances unless accompanied by structural reforms that boost some of those non-price factors.
The remainder of the paper is organized as follows. In Section 2, we analyze the behavior of the labor markets in the Euro area countries since the inception of the euro. We pay special attention to unemployment, employment, and participation rates. Section 3 discusses the evolution of price-competitiveness by looking at the behavior of nominal wages and productivity. The analysis also distinguishes between tradable and non-tradable goods sectors. The relation between price-competitiveness and the current account is explored in the fourth section of the paper, introducing other non-price components of competitiveness. The final section summarizes the main results of the paper.
2. Evolution of Labor Markets in the Euro Area
As of August 2012, the unemployment rate in the euro area was holding at 11.4%, about four percentage points higher than in early 2008, when it reached a record low since the start of EMU. That aggregate number, however, conceals huge differences across countries, as brought out in Figure 1. The lowest unemployment rates can be observed in Austria (4.5%) and Luxemburg (5.2%), while the highest are found in Spain (25.1%) and Greece (24.4%).2 Thus, the range of unemployment rates is above 20 percentage points. The standard deviation is 6.2%.
Figure 1. Unemployment Rate in Euro Area Countries (August 2012)
2 The figure for Greece corresponds to June 2012, the latest available at the time of writing.
4.55.2 5.3 5.5
6.5 7.47.9
8.4
10.110.6 10.7
11.4 11.7
14.215.0
15.9
24.425.1
0.0
5.0
10.0
15.0
20.0
25.0
30.0
% of labor force
Source: Eurostat

4
The large dispersion in unemployment rates is likely due to several factors, including the limited labor mobility within the euro area and the lack of a fiscal union that could act as a risk sharing device. Factors of this sort are often viewed as making the euro area fall short of an optimal currency area. In that light, it is useful to contrast the evidence above with that of the states in the U.S., another large currency union. Thus, in August 2012, when the national unemployment rate was 8.1%, the range of unemployment rates across U.S. states went from 3% in North Dakota and 4% in Nebraska to 12.1% in Nevada and 10.7% in Rhode Island, with a standard deviation of 1.8%. The contrast with the euro area is indeed stark as can be observed in the histogram of Figure 2.
Figure 2. Dispersion in the Unemployment Rates within Euro Area Countries and US States (August 2012)
Can the large dispersion in unemployment rates across the euro area be attributed to the adoption of a single currency and a common monetary policy? Or has the latter led a more similar labor market performance? In order to address those questions, we begin by looking at the evolution of the unemployment rate in eleven euro area countries: Belgium, Germany, France, Italy, Netherlands, Ireland, Spain, Portugal, Greece, Austria and Finland. We also report evidence for an aggregate (EA12) comprising the previous countries plus Luxembourg.
Figure 3 displays the evolution of unemployment rates across euro area countries, starting in 1998 (the year before the start of the euro) and ending in
0.0
10.0
20.0
30.0
40.0
50.0
0%‐3% 3%‐5% 5%‐7% 7%‐9% 9%‐11% 11%‐13% 13%‐15% 15%‐17% 17%‐19% 19%‐21% 21%‐23% 23%‐25%
Percentage
of countries/states
Unemployment rate range
Euro area USA
Sources: Eurostat and BLS

5
2011 (the last year for which we have annual data). Figure 4 shows the unemployment rates for selected dates: 1998 (the last year before EMU), 2007 (the last year of the expansion), and 2011 (the last year in our sample). The unemployment rate for the EA12 (displayed in black in Figures 3 and 4) has shown significant cyclical variations since the start of EMU: The first three years of substantial reduction were followed by an increase in the next three years. The latter increase mainly reflects the poor economic performance in several core countries, as well as Portugal. After that episode, the unemployment rate went down again until 2007, almost uniformly across countries. Finally, the recession that began in 2008 was associated to a rising unemployment rate in most countries, though the extent of the rise and subsequent reversal has differed substantially across countries, as is apparent in Figures 3 and 4. Thus, and relative to 2007, the unemployment rate in 2011 was 13.4 percentage points higher in Spain, 9.8 in Ireland and 9.4 in Greece. In contrast, it went down 2.8 percentage points in Germany over the same period.
Figure 3. Evolution of the Unemployment Rate in the Euro Area Countries
0.0
5.0
10.0
15.0
20.0
25.0
1998 1999 2000 2001 2002 2003 2004 2005 2006 2007 2008 2009 2010 2011
EURO‐12 BELGIUM GERMANY IRELAND
GREECE SPAIN FRANCE ITALY
NETHERLANDS AUSTRIA PORTUGAL FINLAND
% of labor force
Source: Eurostat

6
Figure 4. Evolution of the Unemployment Rate in Euro Area Countries: Selected Years
The impact of the adoption of the euro on the dispersion of unemployment rates is far from clear. This is apparent in Figure 5, which displays the evolution over time of the standard deviation of the unemployment rate across countries, as well as a measure of the range in that variable (excluding the two extreme observations on both ends). Thus, we see that the first nine years of the monetary union were characterized by a gradual, but sizeable, reduction in the dispersion of unemployment rates. The financial crisis and its aftermath is associated with the bulk of the increase in both dispersion measures, taking it to levels far exceeding those prevailing in 1998.
Figure 5. Dispersion in Unemployment Rates within the Euro Area
0.0
5.0
10.0
15.0
20.0
25.0
1998 2007 2011
EURO‐12 BELGIUM GERMANY IRELAND
GREECE SPAIN FRANCE ITALY
NETHERLANDS AUSTRIA PORTUGAL FINLAND
% of labor force
Source: Eurostat
0
2
4
6
8
10
1998 1999 2000 2001 2002 2003 2004 2005 2006 2007 2008 2009 2010 2011
STANDARD DEVIATION INTERQUARTILE RANGE
Source: Eurostat and own calculations

7
The limited convergence in unemployment rates over the same period is also brought out in Figure 6, which shows a scatter plot of the cumulative change in the unemployment rate between 1998 and 2011 against the unemployment rate in 1998. The observed pattern suggests the lack of overall convergence in unemployment rates. A simple regression confirms that casual observation. Using data from 1998 until 2011, we obtain (robust standard errors in brackets):
11|98 98(4.18) (0.43)1.35 0.015u u
with no evidence of significant beta-convergence.
Figure 6. Convergence of Unemployment Rates: 1998-2011
Interestingly, the same regression ending in 2007 (i.e. excluding the “crisis period”) yields
*07|98 98
(1.48) (0.15)4.05 0.69u u
thus pointing to significant beta-convergence, with two thirds of the gap being closed on average over this period. This is further illustrated in Figure 7, which is analogous to Figure 6 but with the reported cumulative change in the unemployment rate ending in 2007.
BEL
GER
IREGRE
ESP
FRA
ITA
NED
AUT
POR
FIN
y = ‐0.0153x + 1.3497R² = 0.0001
‐6.0
‐4.0
‐2.0
0.0
2.0
4.0
6.0
8.0
0 2 4 6 8 10 12 14 16 18
Cahnges in the unemploym
ent rate (1998‐2011)
Unemployment rate in 1998
% of active population
Source: Eurostat and own calculations

8
Figure 7. Convergence of Unemployment Rates: 1998-2007
To what extent do the unemployment rates prevailing in 1998, before the advent of the euro, help us predict those observed in 2011? A simple regression yields
*11 98
(4.18) (0.42)1.35 0.98u u
pointing to a significant predictive ability, with and R-squared of 0.37. Furthermore, the simple correlation between the two variables is 0.61 while Spearman's rank correlation is 0.55. Figure 8 plots the unemployment rates prevailing in 1998 and 2011 (together with a 45 degree line), illustrating the substantial link between the two variables and making clear that the adoption of a common currency has not changed dramatically the countries' ranking in terms of their unemployment rates (see also Figure 4 above). Note that the ranking is, however, preserved at the extremes, with Austria at the lowest end and Spain at the highest. Nevertheless, there are several countries that have experienced a large change in their ranking position: Portugal and Ireland (going up) and Finland and Germany (going down). The figure also highlights the differential impact of the crisis. The highly adverse experience of Spain, Portugal and Ireland since 2007 contrasts with that of Germany, Belgium, Finland, Italy, and (to a lesser extent) France, all of which experienced unemployment rates in 2011 below their pre-EMU levels.
BEL
GER
IRE GRE
ESP
FRA
ITA
NED AUT
POR
FINy = ‐0.6913x + 4.0477
R² = 0.6981
‐10.0
‐8.0
‐6.0
‐4.0
‐2.0
0.0
2.0
4.0
0 2 4 6 8 10 12 14 16 18
Changes in the unemploym
ent rate (1998‐2007)
Unemployment rate in 1998
% of active population
Source: Eurostat and own calculations

9
Figure 8. Unemployment Rates in the Euro Area: 2011 vs. 1998
Figure 9 offers an alternative perspective on the dynamics of euro area unemployment rates in the period under review. It plots the cumulative change in the unemployment rate between 2007 and 2011 (i.e. the “crisis period”) against the corresponding change between 1998 and 2007. There is a clear negative relation between the two variables, suggesting that, on average, economies with better performance up to 2007 are those that have subsequently experienced larger increases in the unemployment rate. The crisis has led to a reversal of fortunes. Again, we quantify that “reversal of fortunes” relationship by mean of a simple regression:
11|07 07|98(1.85) (0.52)1.54 0.86u u
Note, however, that the observations corresponding to the four countries at the center of the ongoing debt crisis (Portugal, Greece, Ireland and Spain) lie above the fitted line, suggesting that the reversal has been particularly damaging for them. This is confirmed by the following regression:
, , ,11|07 07|98
(0.52) (0.63) (0.13)1.40 8.62 0.78IRL GRE ESP PORu D u
BEL
GER
IRE
GRE
ESP
FRAITA
NEDAUT
POR
FIN
0.0
5.0
10.0
15.0
20.0
25.0
30.0
0 5 10 15 20 25 30
Unemploym
ent rate in 2012
Unemployment rate in 1998
% of active population
450
Source: Eurostat

10
Figure 9. Change in the Unemployment Rates: 2007-2011 vs. 1998-2007
Overall the evidence above suggests that the adoption of the euro has not been in itself a source of divergence in unemployment rates. On the contrary, the early years of the euro were associated with the emergence of strong convergence dynamics. The crisis, possibly combined with the fact that the adoption of the euro prevented the hardest hit countries from devaluing their currencies, together with the lack of mechanisms to compensate for asymmetric regional disturbances, appears to be the source of the failure of unemployment rates to converge.
The analysis above has focused on the unemployment rate, its distribution across euro area countries and the evolution of that distribution. Next we ask to what extent the picture that emerges from that analysis reflects developments in the employment rate, the participation rate or both.
Figure 10 shows the employment rate in the second quarter of 2012 for the EA17 countries.3 As it was the case for the unemployment rate, we observe large differences across countries in that variable, which ranges between 55.7% in Greece to 77.2% in the Netherlands, a gap of 22 percentage points. The standard deviation is 6.3%, of the same order of magnitude as that for the unemployment rate.
3 The employment rate is defined as employment as a share of the population aged 20-64.
BEL
GER
IREGRE
ESP
FRA
ITA
NED
AUT
POR
FIN
y = ‐0.8578x + 1.5362R² = 0.2355
‐4.0
0.0
4.0
8.0
12.0
16.0
‐10 ‐8 ‐6 ‐4 ‐2 0 2 4
Change
in the unemploym
ent rate (2007‐2011)
Change in the unemployment rate (1998‐2007)
% of active population
Source: Eurostat and own calculations

11
Figure 10. Employment Rate in the Euro Area Countries (2012Q2)
Figure 11 shows a scatter plot of the unemployment rate (vertical axis) against the employment rate (horizontal axis) in EA17 countries, using annual 2011 data for both variables. The figure reveals the extent to which differences in unemployment rates across countries are associated to differences in employment rates. We observe a clear negative relation, but one that is far from perfect (the correlation is -0.63, while Spearman’s rank correlation is -0.60). A key reason for the relatively weak fit is the presence of substantial differences in participation rates across countries. Thus, for instance, although Italy and Spain had almost identical employment rates in 2011, they have very different unemployment rates, due to the relatively low (high) participation rate in Italy (Spain).
Figure 11. Unemployment vs. Employment Rates in EA17 (2011)
77.2 76.875.9
74.6
72.2
71.570.7
69.668.3 68.1
67.2 67.2
65.264.1
62.661.3
59.6
55.7
40.0
50.0
60.0
70.0
80.0
% of population aged 20‐64
Source: Eurostat
BEL
GER
EST
IRL
GRE
ESP
FRA
ITACYP
LUX
MAL
NED
AUT
POR
SLK
SLO
FIN
y = ‐0.5576x + 47.719R² = 0.4029
0
5
10
15
20
25
50 55 60 65 70 75 80
Une
mploymen
t rate in 20
11
Employment rate in 2011
Source: Eurostat and own calculations

12
Figure 12 displays the participation rate against the unemployment rate for the EA17 countries in 2011. Note that, in contrast with the employment rate, the participation rate does not appear to be systematically related to the unemployment rate. In particular the simple correlation between the two is positive but statistically insignificant (0.02) and Spearman’s rank correlation is negative and, again, insignificant (-0.10).
Figure 12. Unemployment vs. Participation Rates in EA17 (2011)
The dominant role of employment as a factor underlying variations in the unemployment rate has been particularly significant during the financial crisis and its aftermath, as shown in Figure 13. The latter displays the cumulative change in the unemployment rate against the cumulative change in the employment rate, both since 2007. There is a clear strong negative relation between the two variables. The corresponding regression equation is:
11|07 11|07(0.64) (0.14)0.42 1.22u n
with an R² of 0.89.
BEL
GER
EST
IRL
GRE
ESP
FRAITA
CYP
LUX
MAL
NED
AUT
POR
SLK
SLO
FIN
y = 0.0517x + 5.6283R² = 0.0024
0
5
10
15
20
25
60 65 70 75 80 85
Une
mploymen
t rate in 2011
Participation rate in 2011
Source: Eurostat and own calculations

13
Figure 13. Change in Unemployment and in Employment Rates (2007-2011)
Figure 14 displays the cumulative change in the unemployment rate against the cumulative change in the participation rate, between 2007 and 2011. We see that participation rates have changed little during the crisis period, compared with employment rates. Moreover, the relation between unemployment and participation changes is a weak one. In fact, Ireland seems to be the only country for which the reduction in the participation rate has played an important role in dampening the impact on the unemployment rate of a lower employment rate. At the other end of the spectrum, in Spain the participation rate has increased by more than 2 percentage points during the crisis, worsening the unemployment statistics.
Figure 14. Change in Unemployment and in Participation Rates (2007-2011)
BEL
GER
IREGRE
ESP
FRAITA
NED
AUT
POR
FIN
y = ‐1.2176x + 0.4209R² = 0.8942
‐8.0
‐4.0
0.0
4.0
8.0
12.0
16.0
‐12.0 ‐10.0 ‐8.0 ‐6.0 ‐4.0 ‐2.0 0.0 2.0 4.0 6.0
Change
in the un
employmen
t rate (2007‐2011)
Change in the employment rate (2007‐2011)
Source: Eurostat and own calculations
BEL
GER
IREGRE
ESP
FRA
ITA
NED
AUT
POR
FINy = ‐0.2205x + 3.5271
R² = 0.0034
‐8.0
‐4.0
0.0
4.0
8.0
12.0
16.0
‐4.0 ‐3.0 ‐2.0 ‐1.0 0.0 1.0 2.0 3.0
Change
in the un
employmen
t rate (2007‐2011)
Change in the participation rate (2007‐2011)
Source: Eurostat and own calculations

14
Figures 15-19 display evidence analogous to that in Figures 3-7, but using the employment rate instead of the unemployment rate. The evidence on the employment rate is to a large extent, the mirror image of that on the unemployment rate. In particular, we observe large and persistent differences in employment rates, with no evidence of convergence over the full sample period. The limited convergence observed in the early years of the euro, as reflected in the measures of dispersion, seems to have been reversed since 2005 (about two years earlier than for unemployment).
Figure 15. Evolution of the Employment Rate in the Euro Area Countries (1998-2011)
Figure 16. Evolution of the Employment Rate in the Euro Area Countries: Selected Years
50.0
55.0
60.0
65.0
70.0
75.0
80.0
1998 1999 2000 2001 2002 2003 2004 2005 2006 2007 2008 2009 2010 2011
EURO‐12 BELGIUM GERMANY IRELAND
GREECE SPAIN FRANCE ITALY
NETHERLANDS AUSTRIA PORTUGAL FINLAND
% of working age population
Source: Eurostat
50.0
55.0
60.0
65.0
70.0
75.0
80.0
1998 2007 2011
EURO‐12 BELGIUM GERMANY IRELAND
GREECE SPAIN FRANCE ITALY
NETHERLANDS AUSTRIA PORTUGAL FINLAND
% of working age population
Source: Eurostat

15
Figures 15 and 16 point to an observation that seems worth making: the employment rate in 2011 lies substantially above that observed in 1998, the year before the start of the euro. This is true for the euro area as a whole, as well as for many individual countries, including Spain, whose employment rate has fallen dramatically in recent years. The only countries that have experienced a reduction in their employment rate compared with the pre-monetary union period are Greece, Portugal and Ireland.
Figure 17. Dispersion of Employment Rates within the Euro Area
Figure 18. Convergence of Employment Rates: 1998-2011
0
2
4
6
8
10
12
14
16
1998 1999 2000 2001 2002 2003 2004 2005 2006 2007 2008 2009 2010 2011
STANDARD DEVIATION INTERQUARTILE RANGE
Source: Eurostat and own calculations
BEL
GER
IREGRE
ESP
FRA
ITA
NED
AUT
POR
FIN
y = ‐0.0535x + 6.9606R² = 0.0089
‐4.0
‐2.0
0.0
2.0
4.0
6.0
8.0
10.0
50 55 60 65 70 75
Change
in the em
ploymen
t rate (1998‐2011)
Employment rate in 1998
% of working age population
Source: Eurostat and own calculations

16
Figure 19. Convergence of Employment Rates: 1998-2007
3. Patterns of Competitiveness in the Euro Area
To what extent the patterns of unemployment (across countries and over time) uncovered in the previous section can be accounted for by differences in “competitiveness”? Thus, a protracted period of rising unit labor costs, resulting from excessive wages increases or a poor productivity performance, could lead, in the absence of an exchange rate adjustment, to a real appreciation, a deterioration of the current account, and higher unemployment. In the context of fixed exchange rates, restoring of competitiveness will require an internal devaluation, in the form of reduction in nominal wages relative to productivity, so that unit labor costs decrease, competitiveness is progressively restored and the current account imbalance is reduced.
Even small differences in inflation rates, if persistent, can lead to sizable changes in relative price levels. Figure 20 shows the cumulative inflation rates across euro area countries, as measured by the cumulative rate of change in the GDP deflator. The differences are noteworthy. Note that over the period 1999-2007, Greece, Spain, Ireland and Portugal experienced the highest inflation rates. Differentials have become more muted since 2007.
BEL
GER
IRE
GRE
ESP
FRA
ITA NED
AUT
POR
FIN
y = ‐0.3314x + 26.344R² = 0.3381
0.0
2.0
4.0
6.0
8.0
10.0
12.0
14.0
16.0
50 55 60 65 70 75
Change
in the employm
net rate (1998‐2007)
Employment rate in 1998
% of working age population
Source: Eurostat and own calculations

17
Figure 20. Cumulative Inflation Rates in Euro Area Countries
In Figure 21 we display the evolution of (log) price levels in euro area countries.4 It is clear that, to a large extent, differences in inflation reflect a strong convergence process in price levels, especially for Greece, Spain, and Portugal. Even in 2011, there is substantial evidence of dispersion in the price levels across euro zone countries.
Figure 21. (Log-)Price Levels (GDP deflator) in Euro Area Countries
4 In the figure, the series represent the log of the GDP deflator in every country times the corresponding purchasing power parity (Euro-12=1) of the year base (2005). See Appendix 1 for details.
‐20.0
‐10.0
0.0
10.0
20.0
30.0
40.0
Euro area Belgium Germany Ireland Greece Spain France Italy Netherlands Austria Portugal Finland
1998‐2007 2007‐2011
Source: Eurostat
‐0.50
‐0.40
‐0.30
‐0.20
‐0.10
0.00
0.10
0.20
0.30
1998 1999 2000 2001 2002 2003 2004 2005 2006 2007 2008 2009 2010 2011
EURO‐12 BELGIUM GERMANY IRELAND
GREECE SPAIN FRANCE ITALY
NETHERLANDS AUSTRIA PORTUGAL FINLAND
Source: Eurostat and own calculations

18
Figures 22 and 23 confirm this impression. The figures use two simple statistics. To start with, Figure 22 shows there is evidence of a substantial reduction in the dispersion of the domestic (log) price levels in the euro zone. However, the figure also indicates that there are grounds for thinking that this reduction in dispersion has halted (or slightly reversed in the last two years).
Figure 22. Dispersion in Price Levels within the Euro Area
Figure 23. Convergence of Price Levels in the Euro Area: 1998-2011
Figure 23 uncovers a clear inverse relation between price levels in 1998 and subsequent cumulative inflation, suggesting a strong -convergence. Formally, a simple regression of the cumulative price increase between 1998 and 2011 and the price level in 1998 provides strong support for convergence:
0.00
0.05
0.10
0.15
0.20
1998 1999 2000 2001 2002 2003 2004 2005 2006 2007 2008 2009 2010 2011
STANDARD DEVIATION
Source: Eurostat and own calculations
BEL
GER
IRE
GRE ESP
FRA
ITANED
AUT
POR
FIN
y = ‐42.546x + 18.366R² = 0.7227
0.0
5.0
10.0
15.0
20.0
25.0
30.0
35.0
40.0
45.0
‐0.5 ‐0.4 ‐0.3 ‐0.2 ‐0.1 0.0 0.1
Change
in GDP de
flator (1998‐2011)
GDP deflator level in 1998 (Euro 12=1 in 2005)
Source: Eurostat and own calculations

19
11|98 98(2.08) (8.78)
18.37 42.55p p
Restricting the same regression to the pre-crisis period yields similar results:
07|98 98(2.90) (12.23)
14.06 40.71p p
Note, however, that until 2007 the rate of price convergence was faster than afterwards: the estimated regressions imply an annual convergence speed of 4.5% during the expansionary phase which diminishes to 3.3% in for the whole sample period.5
This process of price level “convergence” has involved a progressive reduction in the relative competitiveness of those countries with relatively low initial price levels. This convergence process has some connection with the observed patterns of employment: countries whose inflation rates remained above the average euro area rate (a deviation we use as a proxy of progressive lost in competitiveness) experienced stronger employment growth, as shown in Figure 24. That is, positive employment growth went hand in hand with the partial elimination of the initial price level divergences that prevailed at the inception of the euro.
Figure 24. Change in Employment and in Price Levels in the Euro Area (1998-2007)
5 It should be noted that this simple regression abstracts from the role played by indirect taxation in the periphery countries—which have increased considerably as part of the fiscal consolidations undertaken by some member governments. Excluding indirect taxation alters the previous evidence on price convergence during the recession into mild divergence.
BEL
GER
IRE
GRE
ESP
FRA
ITA NED
AUT
POR
FIN
y = 0.1832x + 2.3712R² = 0.2246
0.0
2.0
4.0
6.0
8.0
10.0
12.0
14.0
16.0
0 5 10 15 20 25 30 35 40
Change
in employm
ent rate (1998‐2007)
Change in GDP deflator level (1998‐2007)
Source: Eurostat and own calculations

20
These findings—which might reflect some of the growth enhancing reforms undertaken by euro area governments in the initial decade of the euro —potentially point to strong links running from aggregate demand to employment and from the latter to price pressures (i.e., relatively low competitiveness.)
Thus, countries experiencing above average inflation rates see their competitiveness decline, in the form of a real appreciation vis-à-vis the rest of the euro zone.6 Many of these countries benefited from a marked reduction of nominal interest rates in the transition to EMU and, given the evolution of inflation, they experienced a sustained reduction in real interest rates. This may have accounted for the strong expansion of domestic demand and the persistent deterioration of their current account.7
Therefore, the question of whether the persistent inflation differentials are a benign phenomenon explained by a structural convergence process, or are instead the source of long-lasting and damaging losses of competitiveness, is critical in distinguishing between two markedly different interpretations of current account imbalances and the subsequent required adjustment among euro area countries.
Under the, more benign interpretation, a lower real rate of interest and expectations of fast convergence justify a higher private domestic spending. Therefore, it has been argued that rising external imbalances are to be expected (and would be justified) in a currency union, and are made possible by the decoupling of national saving and investment facilitated by stronger integration (see Blanchard and Giavazzi, 2002).8
6 As we discuss in detail below, another possible factor that could help in accounting for persistent inflation differentials in the euro zone is the Balassa-Samuelson effect. We take up this point at more length below. 7 In some countries private, especially services, and public consumption grew above GDP; in some other it was construction investment the responsible for the expansion of the non-tradable sectors. 8 The ECB endorsed this view when it noted that “…it is plausible to conclude that the
move to Stage Three of EMU may have led to transitory expansionary effects on domestic demand in countries that experienced the largest decline in nominal and real interest rates, most notably Ireland, Portugal, Greece and Spain. Given the one-off nature of this regime shift, however, this source of inflation differentials is temporary. Moreover,[…] the equilibrating effect of changes in national competitiveness triggered by an increase in inflation differentials is likely to offset any expansionary effects of real interest rate changes over time. The loss in competitiveness in countries with above average inflation rates should eventually help to counterbalance the expansionary effect of the real interest rate decline on economic activity. By the same token, countries with below-average inflation rates, such as Germany and Austria, are
21
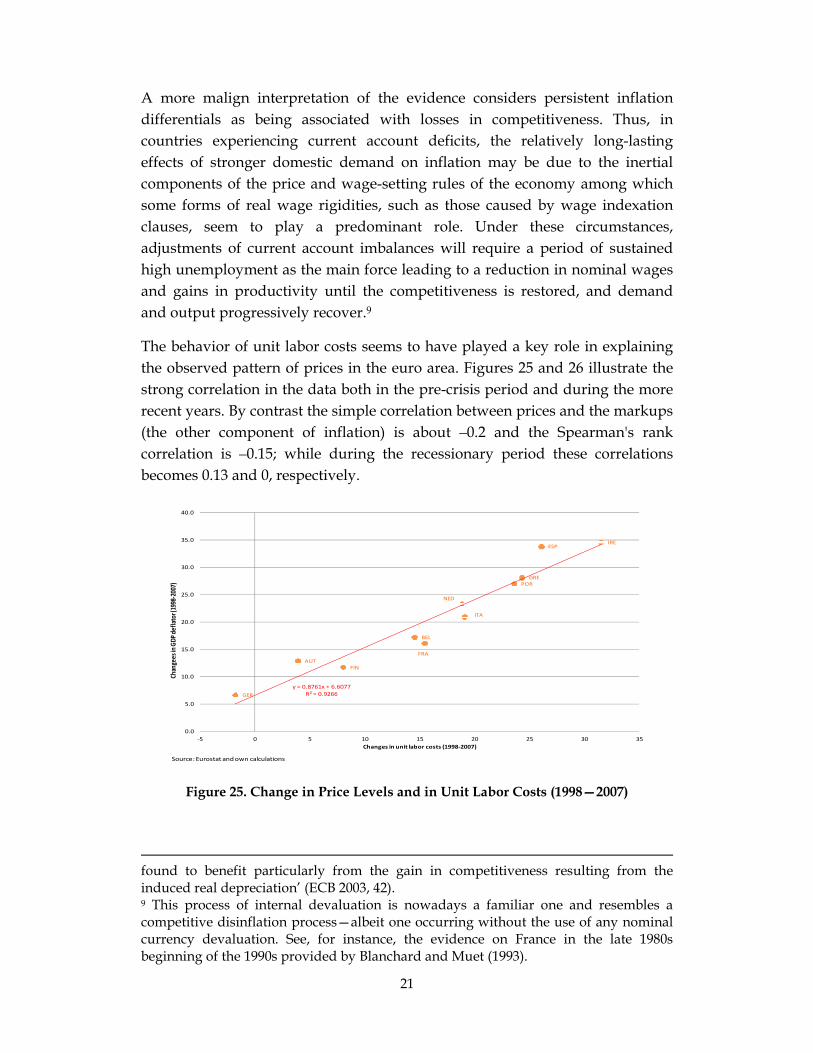
A more malign interpretation of the evidence considers persistent inflation differentials as being associated with losses in competitiveness. Thus, in countries experiencing current account deficits, the relatively long-lasting effects of stronger domestic demand on inflation may be due to the inertial components of the price and wage-setting rules of the economy among which some forms of real wage rigidities, such as those caused by wage indexation clauses, seem to play a predominant role. Under these circumstances, adjustments of current account imbalances will require a period of sustained high unemployment as the main force leading to a reduction in nominal wages and gains in productivity until the competitiveness is restored, and demand and output progressively recover.9
The behavior of unit labor costs seems to have played a key role in explaining the observed pattern of prices in the euro area. Figures 25 and 26 illustrate the strong correlation in the data both in the pre-crisis period and during the more recent years. By contrast the simple correlation between prices and the markups (the other component of inflation) is about –0.2 and the Spearman's rank correlation is –0.15; while during the recessionary period these correlations becomes 0.13 and 0, respectively.
Figure 25. Change in Price Levels and in Unit Labor Costs (1998—2007)
found to benefit particularly from the gain in competitiveness resulting from the induced real depreciation’ (ECB 2003, 42). 9 This process of internal devaluation is nowadays a familiar one and resembles a competitive disinflation process—albeit one occurring without the use of any nominal currency devaluation. See, for instance, the evidence on France in the late 1980s beginning of the 1990s provided by Blanchard and Muet (1993).
BEL
GER
IRE
GRE
ESP
FRA
ITA
NED
AUT
POR
FIN
y = 0.8761x + 6.6077R² = 0.9266
0.0
5.0
10.0
15.0
20.0
25.0
30.0
35.0
40.0
‐5 0 5 10 15 20 25 30 35
Changees in GDP
deflator (1998‐2007)
Changes in unit labor costs (1998‐2007)
Source: Eurostat and own calculations

22
Figure 26. Change in Price Levels and in Unit Labor Costs (2007—2011)
Next we turn to the analysis of some factors underlying the pattern of prices levels: unit labor costs and its two components, wages and labor productivity.
Figures 27 and 28 suggest that there exists some evidence in favor of unit labor cost convergence after the inception of the euro. A regression of cumulative growth of unit labor costs on its level in 1998 shows a negative and significant coefficient.
11|98 98(7.19) (10.27)3.10 29.89ulc ulc
Two countries, Germany and Austria, stand out in Figure 28: their cumulative growth in unit labor costs has been 6% and 12%, respectively, compared to 20% in the Euro area as a whole and well below what would be expected given their (initial) levels of unit labor costs. Most likely, the labor market reforms implemented in the first years of the monetary union and the quality of their labor market institutions may explain these results.
BEL
GER
IRE
GRE
ESP FRA
ITA
NED
AUT
POR
FIN
y = 0.8075x ‐ 0.8264R² = 0.7511
‐15.0
‐10.0
‐5.0
0.0
5.0
10.0
15.0
‐10 ‐5 0 5 10 15 20
Change
in GDP de
flator (2007‐2011)
Change in unit labor costs (2007‐2011)
Source: Eurostat and own calculations

23
Figure 27. Evolution of Unit Labor Costs in the Euro Area Countries: Selected Years
Figure 28. Convergence of Unit Labor Costs: 1998-2011
Excluding these two countries (the star indicates that the variables exclude them), the speed of convergence is reduced by almost one third per year and, which is substantially below that of prices:
* *11|98 98
(3.06) (4.14)16.89 13.45ulc ulc
‐1.20
‐1.00
‐0.80
‐0.60
‐0.40
‐0.20
0.00
1998 2007 2011
EURO‐12 BELGIUM GERMANY IRELAND
GREECE SPAIN FRANCE ITALY
NETHERLANDS AUSTRIA PORTUGAL FINLAND
Source: Eurostat and own calculations
BEL
GER
IRE
GRE
ESP
FRA
ITA NED
AUT
POR
FIN
y = ‐29.89x + 3.0964R² = 0.4851
0.0
5.0
10.0
15.0
20.0
25.0
30.0
35.0
‐1.0 ‐0.9 ‐0.8 ‐0.7 ‐0.6 ‐0.5 ‐0.4
Change
in unit laboor cost (1998‐2011)
Unit labor cost level in 1998
Source: Eurostat and own calculations

24
In addition, these estimates of convergence are affected by business cycles. Running the regression for the expansionary period yields:
07|98 98(7.55) (10.78)
14.67 46.10ulc ulc
During the recession period, the convergence parameter turns to be statistically insignificant:
11|07 07(8.32) (15.86)
12.99 12.16ulc ulc
In fact, during the last recession, countries that exhibited the lowest increases (or even decreases) of unit labor costs were Ireland (6%), Spain (1%), and Portugal (4%), while unit labor costs increased substantially in Finland (14%) and Belgium (12%). This process is helping periphery countries to rebuild competitiveness, and, therefore, to base the recovery in external demand—especially under a subdued domestic demand, private deleveraging process and the ongoing fiscal consolidation. Indeed, in the current context—conditional on appreciable gains in competitiveness—the recovery will be stronger and more durable if it is based on sustained productivity gains rather than on temporary wage cuts. Overall, these results tend to support that there are notable differences in the way recessions and expansion shape the dynamics (convergence and divergence) of competitiveness measures among euro zone countries.
We now turn the analysis of the two main components of unit labor costs: wages and labor productivity. Figures 29 and 32 show the convergence observed in labor productivity and nominal wages for euro area countries since the beginning of the Euro. Figure 29 suggests that productivity has not converged appreciably across countries. The following estimated regression confirms that impression:
11|98 98(99.52) (9.57)29.45 4.43prod prod

25
Figure 29. Convergence of Labor Productivity: 1998-2011
The lack of convergence does not reflect business cycle considerations. To show that this is the case, we run the convergence regression only during the expansionary period:
07|98 98(88.05) (8.47)45.23 5.80prod prod
Furthermore, the lack of convergence in aggregate labor productivity is not the result of sectoral composition effects (see Figures 30 and 31). This lack of convergence mirrors the substantial disparities in sectoral and aggregate productivities that still persist within euro area countries.
Figure 30. Convergence of Labor Productivity in the Tradable Sector: 1998-2011
BEL
GER
IRE
GRE
ESP
FRA
ITA
NED
AUT
POR
FIN
y = 0.9685x + 11.444R² = 0.0035
‐8.0
‐6.0
‐4.0
‐2.0
0.0
2.0
4.0
6.0
8.0
10.0
12.0
‐10.9 ‐10.8 ‐10.7 ‐10.6 ‐10.5 ‐10.4 ‐10.3 ‐10.2 ‐10.1 ‐10.0 ‐9.9 ‐9.8
Changes in prod
uctivity (1998‐2011)
Productivity level in 1998
Source: Eurostat and own calculations
BEL
GER
IRE
GRE
ESP
FRA
ITA
NED
AUT
POR
FIN
y = 4.5958x + 88.024R² = 0.0078
0.0
20.0
40.0
60.0
80.0
100.0
120.0
‐11.60 ‐11.40 ‐11.20 ‐11.00 ‐10.80 ‐10.60 ‐10.40 ‐10.20 ‐10.00 ‐9.80
Changes in prod
uctiv
ity (1998‐2011)
Productivity level in 1998Source: Eurostat and own calculations

26
Figure 31. Convergence of Labor Productivity in the Non-Tradable Sector: 1998-2011
Figure 32 shows that, in contrast with the case of productivity, there is some evidence of convergence in nominal wages. The following regression confirms that visual impression:
11|98 98(78.61) (6.06)94.21 12.12wage wage
This process of convergence was observed only in the expansionary period; with the recession unwinding the slight convergence observed during the initial years of the euro. Formally, the regression covering the expansionary years yields a slightly higher, in absolute terms, value of the slope of the regression:
07|98 98(89.15) (8.04)
155.77 16.93wage wage
Figure 32. Convergence of nominal wages: 1998-2011
BEL
GER
IRE
GRE
ESP
FRA
ITA
NED
AUT
POR
FIN
y = ‐0.4253x + 4.2711R² = 0.0004
0.0
2.0
4.0
6.0
8.0
10.0
12.0
14.0
16.0
‐10.80 ‐10.70 ‐10.60 ‐10.50 ‐10.40 ‐10.30 ‐10.20 ‐10.10 ‐10.00
Changes in p
rodu
ctivity
(1998‐2011)
Productivity level in 1998Source: Eurostat and own calculations
BEL
GER
IRE
GRE
ESP FRA
ITA
NED
AUT
POR
FIN
y = ‐12.116x ‐ 94.206R² = 0.2449
0.0
10.0
20.0
30.0
40.0
50.0
60.0
70.0
‐12.0 ‐11.8 ‐11.6 ‐11.4 ‐11.2 ‐11.0 ‐10.8 ‐10.6 ‐10.4
Changes in no
minal wages (1998‐2011)
Level of nominal wages in 1998
Source: Eurostat and own calculations

27
The results for nominal wages and price levels imply that real (product) wages have not converged in the course of the monetary union. See Figure 33, which gives picture very similar to that for labor productivity.
Figure 33. Convergence of Real Wages: 1998-2011
Given the lack of synchronization in current business cycles among euro area members, nominal and real wage flexibility—a key private sector margin that can be called on to accommodate a such asymmetric shocks—seems to be very limited, at least judging from the lack of convergence documented above.
As above mentioned, an additional factor that might help explain persistent inflation differentials is the Balassa-Samuelson effect. This hypothesis requires national inflation rates to be positively correlated with the difference between labor productivity growth in the traded versus non-tradable sectors.
In principle, persistent national inflation differentials need not be an adverse feature of a monetary union. As argued by Balassa (1964) and Samuelson (1964) this phenomenon can be associated with the process of real convergence of countries with lower income within the currency area. Those countries tend to experience high productivity growth in the tradable sector that would normally translate not only into higher real wages in that sector but also higher nominal wages in the non-tradable sector that would imply higher aggregate price
BELGER
IRE
GRE
ESP
FRA
ITA
NED
AUT
POR
FIN
y = ‐2.3191x ‐ 11.091R² = 0.0056
0.0
5.0
10.0
15.0
20.0
25.0
30.0
35.0
40.0
‐11.5 ‐11.4 ‐11.3 ‐11.2 ‐11.1 ‐11.0 ‐10.9 ‐10.8 ‐10.7 ‐10.6 ‐10.5 ‐10.4
Changes in real wages (1998‐2011)
Level of real wages in 1998
Source: Eurostat and own calculations

28
growth.10 There is already some evidence that this effect can justify some inflation differentials in the euro zone (see, for instance, the initial work by Canzoneri et al. (1998)). In addition, differences in sectoral productivity growth seem to explain low-frequency movements in relative national price indices (Andrés et al. (2008)). But, in general, as pointed out by the ECB (2003), there seem to emerge a growing consensus that the Balassa-Samuelson hypothesis cannot constitute a general explanation of persistent inflation differentials among euro zone members.11
Figures 34 and 35 display the evolution of the price level of traded and non-traded goods, respectively. To provide a medium-run perspective on this evolution, the figures focus on three specific dates: the year just before the monetary union, 1998; the peak of the expansion, 2007; and the last full year available—in the midst of the recent European sovereign debt crisis, 2011. Although we note the limits of any attempt to infer long-run equilibrium from the relative short-sample available, we find the results in these figures interesting in terms of their implications for whether or not certain inflation differentials (relative to the average inflation of the area) reflect the effects of Balassa-Samuelson-type of convergence.
Figure 34. Evolution of the Price Level of Tradable Goods in the Euro Area: Selected Years
10 As it is well-known, one of the assumptions embedded in the Balassa-Samuelson framework is that PPP holds for traded goods. Non-competitive market features, transportation costs, taxation, artificial barriers to trade, or sticky prices might create substantial short-run deviations from PPP in traded goods. 11 Of course, the original Balassa-Samuelson analysis does not imply inflation differential in traded, as it is assumed that the Law of One Price holds.
‐0.40
‐0.30
‐0.20
‐0.10
0.00
0.10
0.20
0.30
1998 2007 2011
BELGIUM GERMANY IRELAND GREECE
SPAIN FRANCE ITALY NETHERLANDS
AUSTRIA PORTUGAL FINLAND EURO‐12
Source: Eurostat and own calculations

29
Figure 35. Evolution of the Level of Non-Tradable Prices in the Euro Area Countries: Selected Years
The figures reveal that most of the increase in the prices is coming from non-traded sectors: Traded good prices rose, on average, around 0.8 per cent per year during 1998 – 2011; while prices in non-traded good sectors increased by more than 2 per cent per year. In fact, both figures reveal substantial relative price differentials between tradables and non-tradable goods in some countries, with Ireland as a clear case of comparison: inflation differentials of non tradables relative to tradables was 6.8 percent in Ireland, almost 4 percent in Finland, and around 3 percent in France.
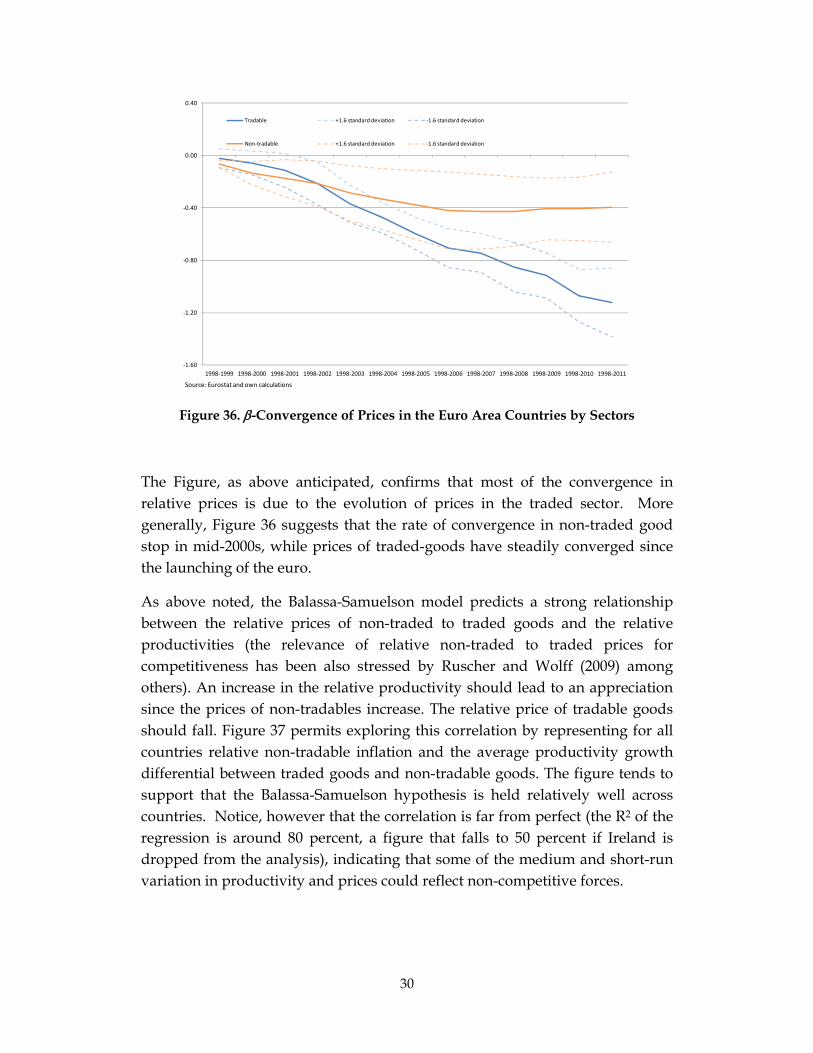
Overall, these results seem to suggest that countries have experienced convergence in prices of traded good sectors – although this is affected by both Ireland and Finland – with a lot less noticeable so in the prices of non-tradables good sectors. Figure 36 displays rolling estimates of the -convergence coefficient for tradables and non-tradables.12
12 This Figure reflects the results of a standard convergence regression, increasing each time by one year the cumulative growth in the left hand side and leaving unchanged the year of reference in the right hand side (1998 in this case).
‐0.60
‐0.50
‐0.40
‐0.30
‐0.20
‐0.10
0.00
0.10
0.20
0.30
0.40
1998 2007 2011
BELGIUM GERMANY IRELAND GREECE
SPAIN FRANCE ITALY NETHERLANDS
AUSTRIA PORTUGAL FINLAND EURO‐12
Source: Eurostat and own calculations
30
Figure 36. -Convergence of Prices in the Euro Area Countries by Sectors
The Figure, as above anticipated, confirms that most of the convergence in relative prices is due to the evolution of prices in the traded sector. More generally, Figure 36 suggests that the rate of convergence in non-traded good stop in mid-2000s, while prices of traded-goods have steadily converged since the launching of the euro.
As above noted, the Balassa-Samuelson model predicts a strong relationship between the relative prices of non-traded to traded goods and the relative productivities (the relevance of relative non-traded to traded prices for competitiveness has been also stressed by Ruscher and Wolff (2009) among others). An increase in the relative productivity should lead to an appreciation since the prices of non-tradables increase. The relative price of tradable goods should fall. Figure 37 permits exploring this correlation by representing for all countries relative non-tradable inflation and the average productivity growth differential between traded goods and non-tradable goods. The figure tends to support that the Balassa-Samuelson hypothesis is held relatively well across countries. Notice, however that the correlation is far from perfect (the R2 of the regression is around 80 percent, a figure that falls to 50 percent if Ireland is dropped from the analysis), indicating that some of the medium and short-run variation in productivity and prices could reflect non-competitive forces.
‐1.60
‐1.20
‐0.80
‐0.40
0.00
0.40
1998‐1999 1998‐2000 1998‐2001 1998‐2002 1998‐2003 1998‐2004 1998‐2005 1998‐2006 1998‐2007 1998‐2008 1998‐2009 1998‐2010 1998‐2011
Tradable +1.6 standard deviation ‐1.6 standard deviation
Non‐tradable +1.6 standard deviation ‐1.6 standard deviation
Source: Eurostat and own calculations

31
Figure 37. Inflation Differential in the Non-Traded and Traded sectors and Productivity Growth Differential in the Tradable and Non-Tradable sectors (1998-
2011)
Despite the apparent success of the BS for the traded sectors, extending the analysis to aggregate inflation reveals the presence of important deviations from the Balassa-Samuelson hypothesis. Figure 38 shows relationship between (aggregate) inflation and relative productivities by representing for all countries both average inflation and the average productivity growth differential between tradable goods and non-tradable goods. Contrary to the model’s prediction, this figure confirms an apparent negative correlation which is, however, affected by data corresponding to Ireland. In Germany, low productivity growth in the manufacturing sector has helped containing aggregate wage and price inflation. The opposite is true in Ireland where the productivity boom in tradables has generated surprisingly high wage and price inflation.13 The cases of high inflation countries (Greece, Spain, Portugal, and to some extent Italy) offer and interesting contrast in which sectoral productivity differentials have grown below the euro average. For the remaining countries there is no clear association between inflation and productivity developments.
13 This results hold if the analysis eliminates the last 4 years of the sample that correspond to the ongoing recessionary episode.
BEL
GER
IRE
GREESP
FRA
ITA
NED
AUT
POR
FIN
y = 1.0029x ‐ 6.7079R² = 0.8358
Excluding Irelandy = 1.025x ‐ 7.2138
R² = 0.5034
‐20.0
0.0
20.0
40.0
60.0
80.0
100.0
0.0 10.0 20.0 30.0 40.0 50.0 60.0 70.0 80.0 90.0 100.0
Change
in inflation differential non tradable‐tradable (1998‐2011)
Change in productivity differential tradable‐non tradable (1998‐2011)
Source: Eurostat and own calculations

32
Figure 38. Cumulative Inflation and Productivity Growth Differential in the Tradable and Non-Tradable sectors (1998-2011)
4. Competitiveness and External Imbalances
Although we acknowledge that international competitiveness, unemployment, and current account imbalances relationships are too complex to be gauged by looking at simple correlations, the purpose of this section is to produce a first pass on connecting competitiveness, broadly defined, with current account imbalances.
Figure 39 summarizes the evolution of current account balances, focusing on three dates (1998, 2007 and 2011). It is striking the scale of the increase of the external imbalances in many countries during the pre-crisis period, and the correction and convergence observed between 2007 and 2011.
BEL
GER
IRE
GRE
ESP
FRA
ITA NED
AUT
POR
FIN
y = ‐0.0765x + 28.184R² = 0.0469
Excluding Irelandy = ‐0.3634x + 34.751
R² = 0.2017
0.0
10.0
20.0
30.0
40.0
50.0
0.0 10.0 20.0 30.0 40.0 50.0 60.0 70.0 80.0 90.0 100.0
Change
in prices (1998‐2011)
Change in productivity differential tradable‐non tradable (1998‐2011)
EURO 12 WIEGHTED AVERAGE
Source: Eurostat and own calculations

33
Figure 39. Evolution of the Current Account (% of GDP): Selected Years
However, the relation between the current account balances and the relative prices of traded seems to be more complex than traditionally assumed. The relationship between the level of current account imbalances and the relative price of tradable goods, in 2007 and 2011, is shown in Figures 40 and 41.
Figure 40. Current Account Balance and Relative Tradable Prices (2007)
‐30
‐20
‐10
0
10
20
1998 2007 2011
EURO‐12 BELGIUM GERMANY IRELAND
GREECE SPAIN FRANCE ITALY
NETHERLANDS AUSTRIA PORTUGAL FINLAND
% of GDP
Source: Eurostat and own calculations
BEL
GER
IRE
GRE
ESP
FRAITA
NED
AUT
POR
FIN
y = 61.682x ‐ 1.9234R² = 0.2365
‐20.00
‐15.00
‐10.00
‐5.00
0.00
5.00
10.00
‐0.2 ‐0.1 ‐0.1 0.0 0.1 0.1 0.2
Curren
t accou
nt balance 2007
Tradable prices in 2007Source: Eurostat and own calculations

34
Figure 41. Current Account Balance and Relative Tradable Prices (2011)
In fact, the sign of the correlation in the year 2007 is the opposite of what it should be expected. In 2007, the euro area periphery countries had a lower relative price of tradable goods and, yet, they experienced larger current account deficits (albeit the correlation is barely significant). As seen from Figure 41, it can be argued that cyclical factors might be responsible for a lower relative price, there is still no obvious relationship between the relative prices of tradable goods and the considerable dispersion in current account imbalances.14 We find the lack of a relationship between the tradables prices and current account imbalances surprising.
As discussed above, during the last ten years, we have observed a convergence process in the prices of the tradable goods, yet the link between changes in the current account and changes in the relative price of tradable goods (as a proxy for real exchange rate developments) appears to be very weak.15 Figures 42 and 43 display the correlation between these two variables. The figures confirm the small explanatory power that the reduction in the relative prices of tradables 14 See Chen et al. (2012). This result is in line with Lane and Milessi-Ferreti (2012) which emphasize that the recent external adjustment in the euro area has taken primarily the form of ‘expenditure’ switching reduction’ rather than ‘expenditure switching’. 15 Broadening the definition of real exchange rate by introducing changes in the relative price of non-traded goods modifies marginally the results, as the correlation becomes negative but non-statically significant in the expansionary period and weahly significant in the recession once Ireland is excluded from the sample.
BEL
GER
IRE
GRE
ESPFRA
ITA
NED
AUT
POR
FIN
y = 12.89x ‐ 0.7876R² = 0.0426
‐15.00
‐10.00
‐5.00
0.00
5.00
10.00
‐0.3 ‐0.2 ‐0.2 ‐0.1 ‐0.1 0.0 0.1 0.1
Current account balance 2011
Tradable prices in 2011Source: Eurostat and own calculations

35
(i.e., real exchange depreciations) has on the changes in the current account balances. This result is in line with recent research by Lane and Milessi-Ferreti (2012) who find that, within the euro area, the direction of observed real exchange rate movements have been “destabilizing,” in the sense that those countries with large negative current account gaps and large net foreign liabilities have experienced real exchange rate appreciation.
Figure 42. Changes in the Current Account Balance and in Relative Tradable Prices in the Expansion Period (1998-2007)
Figure 43. Changes in the Current Account Balance and in the Relative Tradable Prices during the Recession (2007-2011)
BEL
GER
IRE
GRE
ESP
FRA
ITA
NEDAUT
POR
FINy = ‐0.1369x ‐ 1.7682
R² = 0.0807
‐15.0
‐10.0
‐5.0
0.0
5.0
10.0
‐30.0 ‐25.0 ‐20.0 ‐15.0 ‐10.0 ‐5.0 0.0 5.0 10.0 15.0 20.0 25.0
Change
in the current account balance (1998‐2007)
Change in tradable prices (1998‐2007)Source: Eurostat and own calculations
BELGER
IRE
GRE
ESP
FRAITA
NED
AUT
POR
FIN
y = ‐0.0679x + 0.389R² = 0.0375
‐6.0
‐4.0
‐2.0
0.0
2.0
4.0
6.0
8.0
‐40.0 ‐35.0 ‐30.0 ‐25.0 ‐20.0 ‐15.0 ‐10.0 ‐5.0 0.0 5.0 10.0 15.0
Change
in current account balance (2007‐2011)
Change in tradable prices (2007‐2011)Source: Eurostat and own calculations

36
Arguably, this interpretation of the results might be tempered by the possibility that the lack of correlation of the current account and the relative price of tradable goods might reflect the omission as a regressor of some index of economic activity, since the latter is known to be an important determinant of the current account. To control for the latter, we estimated a simple regression of the change in the current account (measured as percent of GDP) over the cumulated change in GDP and the relative price of tradable goods – over two different sample periods (1998—2007; and 2007—2011). The results for 1998-2007 are:
07|98 07|98 07|98(4.48) (0.16) (0.13)7.49 0.32 0.17 _cc gdp relp trad
with R2 equal to 40 percent. For 2007-2011 we find:
11|07 11|07 11|07(1.08) (0.19) (0.09)0.64 0.49 0.02 _cc gdp relp trad
with R2 equal to 48 percent. In neither regression the change in relative prices enters significantly as a determinant of the change in the current account (in contrast to cumulative GDP growth), confirming the conclusions based on the simple regressions above.
As noted by many commentators, absent any depreciation in the external value of the euro, the competitiveness problem of some euro area members arises from the inability of members to devaluate, and the correction of the external imbalances calls for a process of internal devaluation. Yet, as we have shown, the level of the relative price of tradable goods does not seem to be the key determinant of existing external imbalances.
This result calls for the need to broaden the scope and look at a larger set of factors that could explain the evolution of current account imbalances and its link to competitiveness. What are these additional aspects that need to be incorporated into our measure of competitiveness? The World Economic Forum has been influential in the construction of quantitative indexes of growth, business conditions, and competitiveness.16 In the rest of the section, we offer an initial (and tentative) pass in addressing the link between competitiveness (defined broadly; i.e., beyond prices or unit labor costs) and external
16 Several regulation indexes elaborated by the OECD could be use to assess the link between labor market regulation and good market regulations and external imbalances. The Doing Business indicators elaborated by the World Bank can be also used for this purpose. As we discuss below, these aspects constitutes key elements of the index elaborated by the World Economic Forum.

37
imbalances, using a comprehensive set of variables as captured by the Global Competitiveness Index (GCI).
One interesting advantage of the Global Competitiveness Index (GCI) is that is precisely constructed to define competitiveness beyond real exchange rate movements and it has been a useful tool in thinking about key macroeconomic and institutional elements, critical to understand the determinants of competitiveness and more broadly the growth process.17 In our view, this analysis aims at introducing some valuable insights into areas where further progress might be called for, in order to improve the competitiveness and induce sustainable current account imbalances.
The GCI is composed by twelve of “pillars,” all of which are widely accepted as being critical to economic growth. Using a combination of publicly available hard data and information provided in the Forum’s Executive Opinion Survey—which provides qualitative information on difficult-to-measure concepts—these pillars are brought together into the index. Hence, the index covers aspects such as the quality of the macroeconomic environment, the state of a country’s public and private institutions, the increasing importance of technology in the development process, a country’s technological readiness, the extent to which the country has a well-developed transport and communications infrastructure network, the quality of education as evaluated by the business community as well as staff’s training as a proxy for skill’s workers. More importantly, the index also covers goods, labor, and financial markets efficiency and development.18
Figure 44 shows the relationship between the levels of current account balances and the GCI in 2007 and 2011. These plots clearly illustrate the strength of the positive relationship between the external position and the competitiveness broadly defined (higher numbers of the GCI mean a more competitive country). As illustrated in the top line of Table 1, the predictive power of the GCI on current account positions is relatively high, with an R2 of the cross-sectional regression around 0.77 (both for 2007 and 2011).
17 This index was elaborated by Xavier Sala-i-Martin and Elsa Artadi and published by the World Economic Forum, and it expands on two previously considered indexes: The Growth Competitiveness Index and Business Competitiveness Index. For more details, see http://en.wikipedia.org/wiki/Global_Competitiveness_Report.
18 A brief description of the “pillars” is presented in the Appendix. See also Table 1.

38
Figure 44. Current Account Balances and Global Competitiveness Index: 2007 and 2011
Southern European countries display both low levels of broadly defined competitiveness and large current account deficits. If we give a causal interpretation to that relation, external adjustment would require continued gains in competitiveness – beyond the scope provided by further reductions in relative prices. To understand how this could be brought about we now turn to the analysis of which pillar or component of the GCI is driving the strong correlation between current account imbalances and competitiveness.
Table 1 shows the R2 of the pairwise cross sectional regressions between the current account level and each of the components of the GCI. The top line displays – as a reference – the R2 of the regression with the GCI. There are four factors that stand out in terms of their explanatory power for current account performance: (i) goods markets efficiency, (ii) technological readiness (i.e., the ability of entrepreneurs to adopt existing technologies to enhance the productivity of its industries), (iii) business sophistication (i.e., the quality of a country's business networks and supporting industries), and (iv) innovation capabilities.
BEL
GER
IRE
GRE
ESP
FRA
ITA
NED
AUT
POR
FIN
y = 15.117x ‐ 75.302R² = 0.7676
‐20.00
‐15.00
‐10.00
‐5.00
0.00
5.00
10.00
4.0 4.2 4.4 4.6 4.8 5.0 5.2 5.4 5.6
Current account balance 2007
Global competitiveness index 2007Source: Eurostat and World Economic Forum
BEL
GER
IRE
GRE
ESP
FRA
ITA
NED
AUT
POR
FIN
y = 9.0957x ‐ 45.526R² = 0.7648
‐15.00
‐10.00
‐5.00
0.00
5.00
10.00
3.5 4.0 4.5 5.0 5.5 6.0
Current account balance 2011
Global competitiveness index 2011Source: Eurostat and World Economic Forum

39
TABLE 1 R2 OF THE BIVARIATE CROSS-SECTIONAL REGRESSION
OF CURRENT ACCOUNT VS. GLOBAL COMPETITIVENESS COMPONENTS 2007 2011
Global competitiveness indicator 0.77 0.76 Pillar 1: Institutions 0.50 0.60 Pillar 2: Infrastructure 0.36 0.42 Pillar 3: Macroeconomic environment 0.55 0.63 Pillar 4: Health and primary education 0.45 0.34 Pillar 5: Higher education and training 0.50 0.57 Pillar 6: Goods markets efficiency 0.64 0.78 Pillar 7: Labor market efficiency 0.41 0.59 Pillar 8: Financial market development 0.40 0.30 Pillar 9: Technological readiness 0.77 0.60 Pillar 10: Market size 0.06 0.07 Pillar 11: Business sophistication 0.90 0.87 Pillar 12: Innovation 0.68 0.63 Source: Own calculations from World Economic Forum. See Appendix for a brief description of the pillars.
Thus, our analysis suggests that a comprehensive strategy aimed at reducing the large current account deficits of some of the euro area countries should include structural reforms that help enhance some of the factors above.
5. Conclusions
We have examined the extent of macroeconomic convergence and divergence in labor market and competitiveness related variables among euro area countries over the past thirteen years. A number of observations stand out. Primarily, the first nine years of EMU were associated with a strong converge in unemployment rates across euro area countries. That process was interrupted and largely reversed by the financial crisis. This behavior of unemployment was largely determined by that of the employment rate, while the contribution of the participation rate was of a much lower magnitude. Secondly, our analysis uncovers persistent inflation differentials and, as a result, large cumulative changes in relative prices, at least until 2007. Such dynamics reflect, to a large extent, the underlying patterns of unit labor costs and wages. The observed correlations suggest that the evolution of such measures of competitiveness has been a consequence of the differential growth
40
rates in employment until 2007. Furthermore, rather than representing divergent patterns, the evolution of prices and unit labor costs was associated with a substantial convergence in the levels of those variables. In particular, the process of convergence in the prices of the traded products seems to have continued even during the recession. Thirdly, and perhaps surprisingly, the large dispersion in current account balances across euro area countries seems to display a small correlation with “narrow” measures of competitiveness, as represented by relative price levels and unit labor costs. Instead, they seem to bear a stronger relation with broader, non-price competitiveness factors. It follows that internal devaluation policies may have limited success at reducing external imbalances unless accompanied by structural reforms that boost some of those non-price factors.
41
References Andrés, Javier; Eva Ortega, and Javier Vallés (2008): “Competition and Inflation Differentials in EMU”, Journal of Economic Dynamics and Control, 32 (3), pp. 848-874 Balassa, B. (1964): “The Purchasing Power Parity Doctrine: A Reappraisal”, Journal of Political Economy, vol. 72, December, pp. 584-596. Blanchard, O. and F. Giavazzi (2002): “Current Account Deficits in the Euro Area. The End of the Feldstein Horioka Puzzle?”, MIT Department of Economics Working Paper No. 03-05. Blanchard, O. and P.A. Muet (1993): “Competitiveness through Disinflation: An Assessment of the French Macroeconomic Strategy”, Economic Policy, Vol. 8, No. 16, April, pp. 11-56. Canzoneri, M., Cumby, R., Behzad D. and G. Eudey (1998): “Trends in European Productivity: Implications for Real Exchange Rates, Real Interest Rates and Inflation Differentials,” Working Papers 27, Oesterreichische Nationalbank (Austrian Central Bank). Chen, R., Milesi-Ferretti, G. M. and T. Tressel (2012): “External Imbalances in the Euro Area”, IMF Working Paper, 12/236. ECB (2003): Inflation Differentials in the Euro Area – Potential Causes and Policy Implications, Frankfurt, Germany. Lane, P, and G. M. Milessi-Ferretti (2012): “External adjustment and the global crisis, Journal of International Economics, forthcoming. Samuelson, P. (1964): “Theoretical Notes on Trade Problems”, Review of Economics and Statistics, volume 23. Ruscher, E. and G. B. Wolf (2009): “External rebalancing is not just an exporters' story: real exchange rates, the non-tradable sector and the euro”, Economic Papers 375, March 2009, ECFIN, European Commission.

42
Appendix: Data Sources and Description of the Variables Most of the data used in this paper has been obtained from the statistical office of the European Union (Eurostat), at the web site: http://epp.eurostat.ec.europa.eu/portal/page/portal/statistics/themes. In some cases the time series were forward extended using other data basis, such as AMECO (ECFIN European Commission): http://ec.europa.eu/economy_finance/ameco/user/serie/SelectSerie.cfm and EU-KLEMS: http://www.euklems.net/.
In particular, the European unemployment, employment and participation rates were obtained from the Labor Force Survey, using the conventional definitions (population aged 15-64): http://epp.eurostat.ec.europa.eu/portal/page/portal/employment_unemployment_lfs/data/database.
On its side, the US unemployment rate corresponds to the household data of the Bureau of Labor Statistics: http://www.bls.gov/news.release/laus.t01.htm.
GDP, value added and their deflators, employment (heads and hours, total employment and wage earners) and compensation of employees correspond to their National Accounts definitions. These time series were obtained from Eurostat at the web site: http://epp.eurostat.ec.europa.eu/portal/page/portal/national_accounts/data/database
In this respect, the tradable sector corresponds to the NACE activities A to E; the non-tradable sector to F to E.
The source of the purchasing power parities (PPP) used in the construction of the price levels is also Eurostat: http://epp.eurostat.ec.europa.eu/portal/page/portal/purchasing_power_parities/data/database
In this case, the tradable sector is identified with total goods and the non-tradable sector with total services.
Information on the current account was also obtained from the balance of payments compiled by Eurostat: http://epp.eurostat.ec.europa.eu/portal/page/portal/balance_of_payments/data/database
The rate of inflation is obtained as the changes in the log of the GDP deflator. These price deflators are transformed from index numbers (base year=1) to relative prices by multiplying the National Accounts index number by the PPP of the corresponding country with respect to the Euro area in the base year. Unit labor costs are defined as the ratio between wages and labor productivity. Wages are obtained by dividing compensation of employees on hours worked by employees. Finally, labor productivity corresponds to GDP (Value added) divided on hours worked by total employment. Finally, the Global Competitiveness Index corresponds to the elaboration of the World Economic Forum:
http://www.weforum.org/issues/competitiveness-0/gci2012-data-platform/

43
A brief description of the GCI twelve pillars provided in the main report.
First pillar: Institutions. The institutional environment is determined by the legal and administrative framework within which individuals, firms, and governments interact to generate wealth. Government attitudes toward markets and freedoms and the efficiency of its operations are also very important: excessive bureaucracy and red tape, overregulation, corruption, dishonesty in dealing with public contracts, lack of transparency and trustworthiness, inability to provide appropriate services for the business sector, and political dependence of the judicial system impose significant economic costs to businesses and slow the process of economic development.
Second pillar: Infrastructure. A well-developed transport and communications infrastructure network is a prerequisite for the access of less-developed communities to core economic activities and services. Effective modes of transport-including quality roads, railroads, ports, and air transport-enable entrepreneurs to get their goods and services to market in a secure and timely manner and facilitate the movement of workers to the most suitable jobs.
Third pillar: Macroeconomic environment. A proper management of public finances is also critical to ensuring trust in the national business environment. This pillar includes indicators capturing the quality of government management of public finances. Running persistent fiscal deficits limits the government's future ability to react to business cycles and to invest in competitiveness-enhancing measures. It is important to note that this pillar evaluates the stability of the macroeconomic environment, so it does not directly take into account the way in which public accounts are managed by the government.
Fourth pillar: Health and primary education. Poor health leads to significant costs to business, as sick workers are often absent or operate at lower levels of efficiency. In addition to health, this pillar takes into account the quantity and quality of the basic education received by the population.
Fifth pillar: Higher education and training. This pillar measures secondary and tertiary enrollment rates as well as the quality of education as evaluated by the business community. The extent of staff training is also taken into consideration because of the importance of vocational and continuous on-the-job training-which is neglected in many economies-for ensuring a constant upgrading of workers' skills.
Sixth pillar: Goods market efficiency. Healthy market competition, both domestic and foreign, is important in driving market efficiency and thus business productivity by ensuring that the most efficient firms, producing goods demanded by the market, are those that thrive. The best possible environment for the exchange of goods requires a minimum of impediments to business activity through government intervention. Market efficiency also depends on demand conditions such as customer orientation and buyer sophistication. For cultural or historical reasons, customers may be more demanding in some countries than in others.
Seventh pillar: Labor market efficiency. The efficiency and flexibility of the labor market are critical for ensuring that workers are allocated to their most effective use in the economy and provided with incentives to give their best effort in their jobs. Efficient labor markets must also ensure a clear relationship between worker incentives and their efforts to promote meritocracy at the workplace, and they must provide equity in the business environment between women and men.

44
Eighth pillar: Financial market development. An efficient financial sector allocates the resources saved by a nation's citizens, as well as those entering the economy from abroad, to their most productive uses. A thorough and proper assessment of risk is therefore a key ingredient of a sound financial market. In order to fulfill all those functions, the banking sector needs to be trustworthy and transparent, and-as has been made so clear recently-financial markets need appropriate regulation to protect investors and other actors in the economy at large.
Ninth pillar: Technological readiness. The technological readiness pillar measures the agility with which an economy adopts existing technologies to enhance the productivity of its industries, with specific emphasis on its capacity to fully leverage information and communication technologies (ICT) in daily activities and production processes for increased efficiency and enabling innovation for competitiveness.
Tenth pillar: Market size. Therefore we continue to use the size of the national domestic and foreign market in the Index. Thus exports can be thought of as a substitute for domestic demand in determining the size of the market for the firms of a country.
Eleventh pillar: Business sophistication. The quality of a country's business networks and supporting industries, as measured by the quantity and quality of local suppliers and the extent of their interaction, is important for a variety of reasons. Individual firms' advanced operations and strategies (branding, marketing, distribution, advanced production processes, and the production of unique and sophisticated products) spill over into the economy and lead to sophisticated and modern business processes across the country's business sectors.
Twelfth pillar: Innovation. The final pillar of competitiveness focuses on technological innovation. In particular, it means sufficient investment in research and development (R&D), especially by the private sector; the presence of high-quality scientific research institutions that can generate the basic knowledge needed to build the new technologies; extensive collaboration in research and technological developments between universities and industry; and the protection of intellectual property, in addition to high levels of competition and access to venture capital and financing that are analyzed in other pillars of the Index.