Embed Size (px)
Citation preview
Patterns of Carbon, Nitrogen andPhosphorus Dynamics in
Decomposing Foliar Litter inCanadian Forests
T. R. Moore,1* J. A. Trofymow,2 C. E. Prescott,3 J. Fyles,4 B. D. Titus2, andCIDET Working Group
1Department of Geography and Centre for Climate and Global Change Research, McGill University, Montreal, Quebec, Canada;2Pacific Forestry Centre, Canadian Forest Service, Victoria, British Columbia, Canada; 3Faculty of Forestry,
University of British Columbia, Vancouver, British Columbia, Canada; 4Department of Natural Resource Science,
McGill University, Montreal, Quebec, Canada
ABSTRACT
We examined the patterns of nitrogen (N) and
phosphorus (P) gain, retention or loss in ten foliar
tissues in a litterbag experiment over 6 years at 18
upland forest sites in Canada, ranging from sub-
arctic to cool temperate. N was usually retained in
the decomposing litter until about 50% of the
original C remained. The peak N content in the
litter was observed at between 72 and 99% of the
original C remaining, with C:N mass quotients
between 37 and 71 (mean 55). The rate of N re-
lease from the litters was not related to the original
N concentration, which may be associated with the
generally narrow range (0.59–1.28% N) in the
litters. P was immediately lost from all litters, ex-
cept beech leaves, with critical litter C:P mass
quotients for P release being in the range 700–900.
The rate of P loss was inversely correlated with the
original litter P concentration, which ranged from
0.02 to 0.13%. The soil underlying the litterbags
influenced the pattern of N and P dynamics in the
litters; there were weak correlations between the N
and P remaining at 60% C remaining in the litters
and the C:N and C:P quotients of the surface layer
of the soil. There was a trend for higher N and P
retention in the litter at sites with lower soil C:N
and N:P quotients, respectively. Although there
was a large variation in C:N, C:P and N:P quotients
in the original litters (29–83, 369–2122 and 5–26,
respectively), and some variation in the retention
or loss of N and P in the early stages of decompo-
sition, litters converged on C:N, C:P and N:P quo-
tients of 30, 450 and 16, when the C remaining fell
below 30%. These quotients are similar to that
found in the surface organic matter of these eco-
systems.
Key words: litter; forests; decomposition; carbon;
nitrogen; phosphorus; lignin.
INTRODUCTION
The continual, long-term input of fresh litter to the
surface of the forest floor through litterfall and its
ensuing progressive decomposition as it is broken
down physically and chemically into smaller units
leads to the formation of more recalcitrant soil or-
ganic material (humus) that accumulates and
forms the different horizons in the forest floor. As
fresh litter decays along this continuum that leads
to the formation of soil organic matter (Melillo and
Received 5 March 2004; accepted 5 November 2004; published online 30
January 2006
*Corresponding author; e-mail: [email protected]
Ecosystems (2006) 9: 46–62DOI: 10.1007/s10021-004-0026-x
46
others 1989), a point is reached when there is a net
release of nutrients. This loss of nutrients from
decomposing litter is a key process governing the
availability of nutrients in ecosystems. The mass
loss of forest litters is primarily dependent on cli-
mate and initial litter quality (for example,
Meentemeyer 1978; Trofymow and others 2002).
Mass loss is approximately proportional to the loss
of carbon (C) from litter, which has indirect effects
on nutrient availability, especially of nitrogen (N)
and phosphorus (P). As the availability of N and
sometimes P generally limits tree growth in forest
ecosystems (for example, Binkley 1986), an
understanding of the factors that control release of
these two nutrients from decomposing litter is
necessary for predicting or modelling nutrient
availability and ecosystem function. Although
many studies have documented changes in C, N
and P masses and concentrations as litter decom-
poses, they have generally been based on a narrow
range of litter types incubated in the field for a
relatively short time (several years) on a small
number of sites. CE Prescott (in press) has recently
reviewed our understanding of decomposition and
mineralization of nutrients from litter and humus.
The rate of nutrient loss from litter can be de-
scribed in relation to the rate of C loss: some ele-
ments are lost faster than C is mineralized, some in
proportion with C and some more slowly than C.
After a brief leaching phase, N is usually retained
relative to C loss during the initial stages of litter
decomposition. In some ecosystems, this leads to an
increase in the total quantity of N, indicative of net
import of N into the litter (Staaf 1980a, b). The
overall result is generally (but not always; see
Tripathi and Singh 1992) a gradual increase in N
concentration and concomitant decrease in the C:N
mass ratio or quotient over time (Staaf 1980a, b;
Vesterdal 1999). Although the initial retention of N
in litter can be a function of the requirements of an
increased biomass of decomposer organisms (Berg
and Soderstrom 1979), the accumulation of N in
decomposing litter can also be a function of
chemical immobilization. For example, ammonia-N
can be chemically fixed to litter and humus, and
has a particular affinity for fresh litter and litter
with low N concentration (Axelsson and Berg
1988). Patterns of P release are more variable, with
both initial loss (for example, Monleon and
Cromack 1996; Titus and Malcolm 1999) and initial
retention (for example, Staaf and Berg 1982; Berg
and Laskowski 1997) widely reported, depending
on litter type and site (for example, Bartos and
DeByle 1981; Kelly and Beauchamp 1987). We
therefore hypothesize (H1) that N will be generally
gained during early stages of decomposition,
whereas P will be gained or be lost.
Changes in N and P and loss of C leads to a con-
vergence of the C:N and C:P quotients of litters over
time (Prescott and others 1993; Rustad 1994;
Vesterdal 1999) until a critical value is reached after
which net loss of N or P from litter begins. Until this
point is reached, the main decomposer communi-
ties in the soil are unable to obtain enough N or P
from the litter to be able to consume the associated
C they require for energy, and are hence N- or P-
limited. After this critical value, they are able to take
up C, concomitantly meet their N or P require-
ments, and in the process release these nutrients
through turnover of decomposer populations. As
they are released, these nutrients become available
for uptake by organisms in the forest floor, includ-
ing trees, through roots and mycorrhizal associa-
tions. The rate of litter decomposition until critical
values are reached is a key determinant in defining
site productivity: the faster the change in quality of
decomposing litter (that is, C:N quotient), the
greater the nutrient availability and associated site
productivity. Critical C:N quotients for forest foliar
litters can be much higher than the 25–30 generally
reported for agricultural residues (Allison 1973;
Haynes 1986), and can range between 23 and 35
(Edmonds 1979, 1980) to 80 (Hart and others
1992). Critical C:P quotients for foliar litters range
from 350 (Rustad and Cronan 1988) to 480 (Gosz
and others 1973). We thus hypothesize (H2) that
critical C:N and C:P quotients at which N and P loss
begins will vary among litter types.
As some litter contains greater fractions of re-
calcitrant material that do not readily decay,
changes in the C:N and C:P quotients of the non-
recalcitrant fraction may be sufficient for net
nutrient release to begin. However, the presence of
the recalcitrant fraction will increase the critical
value. We therefore further hypothesize (H3) that
litters with high concentrations of recalcitrant
materials will have higher critical C:N quotients.
The amount of N and P either retained or lost can
be closely related to the initial concentrations of
these nutrients in the litter. Generally, litters with
low initial concentrations of N or P retain more of
these nutrients during the early stages of decay (for
example, Edmonds 1980) before critical C:N or C:P
values are reached. Conversely, litters with high
initial concentrations of N or P have the greatest
initial loss of these nutrients (for example, Berg and
Ekbohm 1983; Stohlgren 1988), because critical
values have either been attained before litterfall, or
earlier in the decomposition process once litter
reaches the soil surface. We therefore hypothesize
C, N and P Dynamics in Decomposing Litter 47
that (H4) the initial concentration of N or P in litter
will influence patterns of nutrient loss.
The nature and amount of the organic constitu-
ents of litter can also affect nutrient cycling pat-
terns. For example, a strong positive relationship
between the initial concentration of the acid un-
hydrolyzable residue (AUR, also known as the acid-
insoluble residue or ‘‘Klason lignin’’ fraction; see
Preston and others 2000) of litter and the amount
of N retained during decomposition has been re-
ported (McClaugherty and others 1985; Upadhyay
and Singh 1985 and references therein; Berg and
Staaf 1987; White 1988). N loss is also delayed in
litter with a high lignin concentration (Berg and
McClaugherty 1989). It is thought that changes in
N in litter may therefore occur through its com-
plexing with organic molecules in the litter, and
hence (H5) we also hypothesize that the initial
AUR (that is, ‘‘Klason lignin’’) concentration of our
litter may affect N accumulation.
Finally, patterns of gain and loss of N and P can
also be influenced by exogenous availability from
the site, as suggested by the increased N content
found in decomposing litter on relatively N-rich
forest floors (Chadwick and others 1998) or on
fertilized (Berg and Tamm 1994) or clearcut (Berg
and Ekbohm 1983) sites. This suggests that these
site effects are not universal (Prescott and others
1993), and site may not influence N and P
dynamics in litter as much as the initial N and P
status of the litter (Vesterdal 1999). We therefore
hypothesize that (H6) N or P availability in the
surface soil will have smaller effects on nutrients in
litter than initial litter composition, but nutrients
will tend to be retained more in litter on nutrient-
rich sites across Canada.
We used litterbags to monitor decomposition of
ten litter types with different characteristics incu-
bated in situ for 6 years at 18 well-drained upland
sites in a range of different ecosystems across
Canada as part of the Canadian intersite decom-
position experiment (CIDET). This study was
established in 1992 to determine the controls on
long-term litter mass loss and nutrient dynamics
using 11 litter types on 21 sites across a broad range
of forested ecoclimatic regions in Canada (Trofy-
mow and others 1995; Trofymow and CIDET
Working Group 1998). CIDET therefore offers a
unique opportunity to broadly test hypotheses
regarding factors controlling nutrient dynamics in
decomposing litter. Three- and 6-year mass loss
results have been published (Moore and others
1999; Trofymow and others 2002), as has a study of
a wide variety of litter quality variables on the 3-
year mass loss (Preston and others 2000). CIDET
therefore allowed us to determine if there were
general relationships of C, N and P changes over a
relatively long time (6 years) that would increase
our understanding of the controls on nutrient
availability in forested ecosystems.
METHODS
About 11,000 litterbags containing 12 material
types (ten foliar litters and surface and buried wood
blocks) were installed at 21 locations (18 upland,
three wetland sites), representing the major eco-
climatic provinces (Ecoregions Working Group
1989) of Canada (see Trofymow and CIDET
Working Group 1998 for details). Some of the
characteristics of the ten foliar litter types and 18
upland sites used in this present study are listed in
Tables 1 and 2.
The ten foliar litter types were collected from
litter traps or senescent tissues. Litters were air-
dried, thoroughly mixed and sub-sampled to
determine air-dry to oven-dry mass conversion
factors. Sub-samples were milled to pass through a
0.2-mm mesh prior to elemental analysis (C, N and
P) and wet chemical proximate analysis of C frac-
tions (Trofymow and others 1995).
Litterbags were made of 20 cm · 20 cm poly-
propylene fabric with 0.25 mm · 0.5 mm openings
and contained 10 g of litter. Each litter type was
placed at all sites, in four replicate plots per site.
Bags were placed so that they were in contact with
the forest floor, where present, and thick standing
grass or lichen layers were moved aside. One bag
per litter type was removed from each plot once per
year, over the first 6 years, giving four replicates
per year for each litter type at each site. After col-
lection, litterbags were oven-dried at 70�C, the
remaining litter weighed and percent mass
remaining calculated. The exponential decay
parameter (k y)1, Olson 1963) was calculated from
the linear regression of the natural log of mass
remaining over time. The samples were ground and
analyzed for C, N and P concentrations and the
percent of original mass of C, N and P remaining
was calculated, on an ash-included basis. All quo-
tients (C:N, C:P and N:P) were calculated on an
elemental mass basis. The amount of N and P
remaining at the end of each of the first 6 years of
field incubation (as percent of original mass) was
plotted over the amount of C remaining (as percent
of original mass). This elucidated patterns of gain,
loss or retention of N and P relative to C, inde-
pendent of decay rate. Functional interpretations of
general stoichiometric relationships could then be
made without the confounding influence of decay
48 T. R. Moore and others
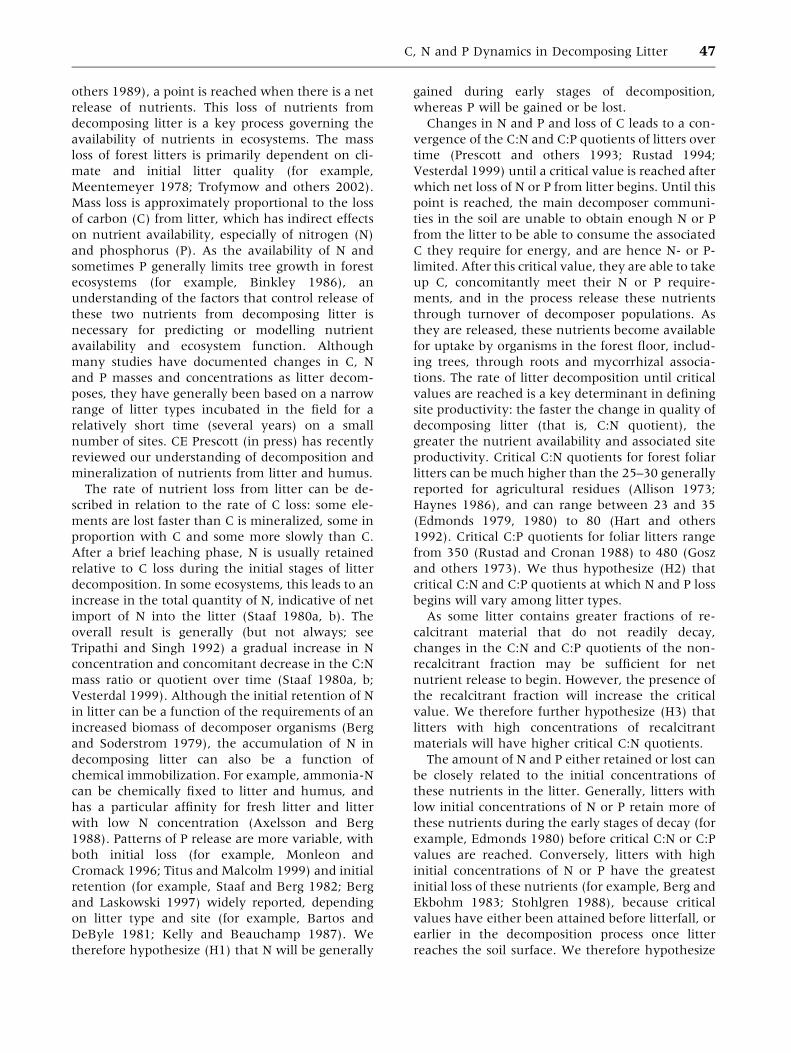
Tab
le1.
Init
ial
Com
posi
tion
of
the
Ten
Lit
ter
Types
(fro
mTro
fym
ow
an
dC
IDE
TW
ork
ing
Gro
up
1988)
an
dM
ass
Rem
ain
ing
an
dE
xpon
en
tial
Deco
mposi
tion
Para
mete
r(k
)over
6Y
ears
,A
vera
ged
acr
oss
the
18
Sit
es
Init
ial
litt
er
com
posi
tion
Deco
mp
osi
tion
Lit
ter
typ
e
Lit
ter
cod
eC
(%)
N(%
)
C:N
qu
oti
en
tP
(%)
C:P
qu
oti
en
t
N:P
qu
oti
en
t
AU
R
(%)
AU
R:N
qu
oti
en
t
AU
R:P
qu
oti
en
t
6-y
ear
mass
rem
ain
ing
(%of
ori
gin
al)
6-y
ear
deca
y
para
mete
r
(k,
y)
1)
Tre
mbli
ng
asp
en
leaves
(Pop
ulu
str
emu
loid
esM
ich
x.)
Asp
en
46.8
0.6
770
0.1
27
369
5.3
14.4
22
113
42
)0.1
40
Am
eri
can
beech
leaves
(Fa
gus
gra
nd
ifol
iaE
rh.)
Beech
47.0
0.7
166
0.0
36
1306
19.7
28.0
39
778
51
)0.1
17
Wh
ite
bir
chle
aves
(Bet
ula
pa
pyr
ifer
aM
ars
h.)
Bir
ch48.0
0.7
267
0.0
38
1263
18.9
24.0
33
632
34
)0.1
84
West
ern
redce
dar
needle
s
(Th
uja
pli
cata
Don
ex
D.D
on
)
Cedar
49.7
0.6
478
0.0
47
1057
13.6
35.6
56
757
53
)0.1
18
Bra
cken
fern
(Pte
rid
ium
aq
uil
inu
m(L
.)K
uh
n)
Fern
46.3
0.8
853
0.0
66
702
13.3
32.9
37
498
44
)0.1
44
Fesc
ue
gra
ss
(Fes
tuca
ha
lii
(Vase
y)
Pip
er)
Fesc
ue
43.8
0.7
162
0.0
58
755
12.2
11.2
16
272
32
)0.1
73
Dou
gla
s-fi
rn
eedle
s
(Pse
ud
o-ts
uga
men
zies
ii
Mir
b.
Fra
nco
)
Fir
49.6
0.7
070
0.1
05
472
6.7
30.3
43
289
46
)0.1
44
Jack
pin
en
eedle
s
(Pin
us
ba
nk
sia
na
Lam
b.)
Pin
e49.7
1.2
839
0.1
27
391
10.1
32.8
26
258
42
)0.1
48
Bla
cksp
ruce
needle
s
(Pic
eam
ari
an
aM
ill.
BSP)
Spru
ce49.5
0.7
368
0.0
79
627
9.2
28.3
39
358
36
)0.1
83
Tam
ara
ckn
eedle
s
(La
rix
lari
cin
a(D
uR
oi)
K.K
och
)
Tam
ara
ck48.8
0.5
983
0.0
23
2122
25.7
24.0
41
1770
48
)0.1
25
Qu
otie
nts
are
base
don
mass
.
C, N and P Dynamics in Decomposing Litter 49
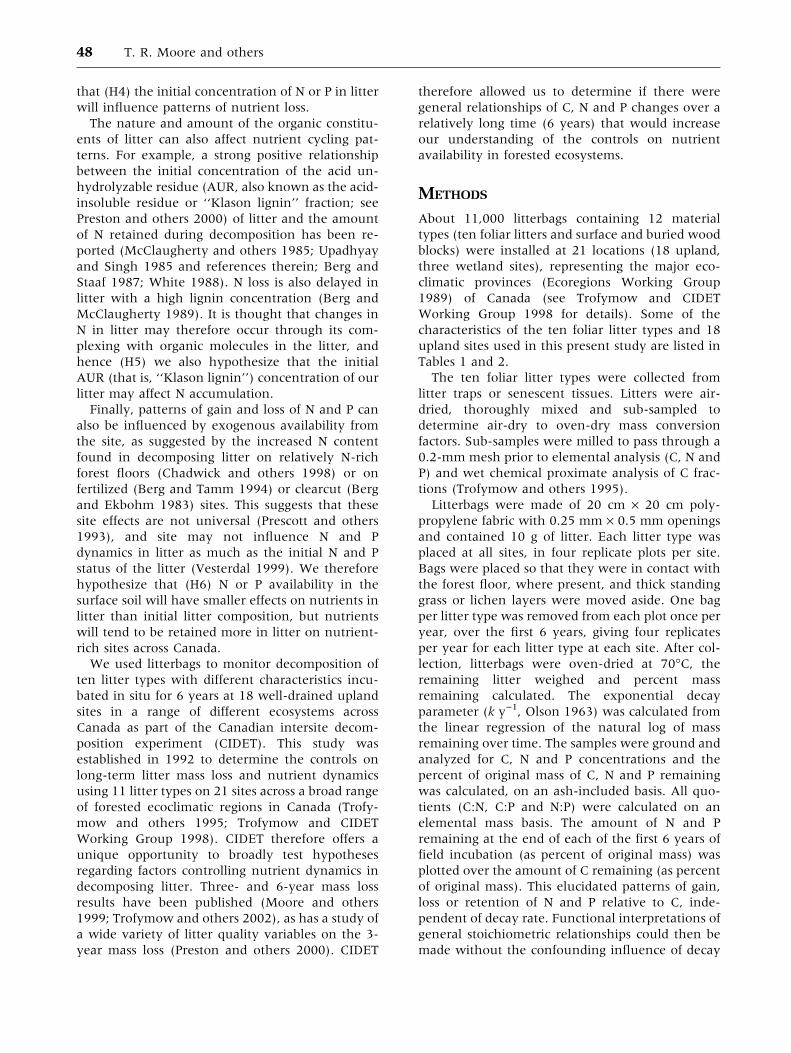
Tab
le2.
Loca
tion
,E
cocl
imati
cPro
vin
cean
dSu
rface
Soil
Ch
em
istr
yof
the
18
Upla
nd
Sit
es
an
dM
ass
Rem
ain
ing
an
dE
xpon
en
tial
Deco
mposi
tion
Para
mete
r(k
)over
6Y
ears
,A
vera
ged
acr
oss
the
Ten
Lit
ters
(fro
mTro
fym
ow
an
dC
IDE
TW
ork
ing
Gro
up
1998)
Sit
elo
cati
on
an
d
acr
on
ym
Eco
clim
ati
c
pro
vin
ce
Lati
tud
e(�
N)
&lo
ngit
ud
e(�
W)
Soil
hori
zon
Soil
pH
aC
(%)
N
(%)
C:N
qu
oti
en
t
P
(%)
C:P
qu
oti
en
t
N:P
qu
oti
en
t
6-y
ear
mass
rem
ain
ing
(%of
ori
gin
al)
6-y
ear
deca
y
para
mete
r
(k,
y)
1)
Rock
yH
arb
ou
r,B
ore
al
49�3
20 ,
57�5
00
Oi–
Oe–O
a–
24.4
0.8
136
0.0
69
405
11.7
32
)0.1
76
NF
(CB
R)
E4.3
5.5
0.2
127
0.0
40
137
5.3
Ch
aple
au
,B
ore
al
47�3
80 ,
83�1
40
Oi–
Oe–O
a–
35.7
1.0
235
0.1
07
415
9.5
29
)0.2
06
ON
(CH
A)
E4.3
1.7
0.0
723
0.0
22
76
3.2
Gan
der,
Bore
al
48�5
50 ,
54�3
40
Oi–
Oe–O
a–
45.8
0.7
462
0.0
86
678
8.6
35
)0.1
76
NF
(GA
N)
E3.8
1.9
0.0
632
0.0
07
289
8.6
Gil
lam
,Su
barc
tic
56�1
90 ,
94�5
10
Oi–
Oe–O
a–
38.3
1.0
536
0.0
67
570
15.6
61
)0.0
77
MN
(GI1
)A
&B
w6.6
4.6
0.2
122
0.0
53
87
4.0
Hid
den
Lake,
Sou
thco
rdil
lera
n50�3
30 ,
118�5
00
Oi–
Oe–O
a–
38.8
1.1
235
0.0
98
397
11.4
31
)0.1
88
BC
(HID
)E
&B
s5.9
2.0
0.0
728
0.1
49
13
0.5
Inu
vik
,Su
barc
tic
68�1
90 ,
133�3
20
O–
41.7
0.9
743
0.1
51
276
6.4
77
)0.0
42
NW
T(I
NU
)A
5.2
2.7
0.1
617
0.3
26
80.5
Kan
an
ask
is,
Sou
thco
rdil
lera
n51�0
00 ,
115�0
00
Oi–
Oe–O
a38.3
1.1
633
0.1
04
370
11.2
43
)0.1
33
AB
(KA
N)
A5.0
1.3
0.0
720
0.0
23
58
3.0
Morg
an
Arb
ore
tum
,C
ool
tem
pera
te45�2
50 ,
73�5
70
Oi–
Oe–O
a–
31.6
1.1
328
0.0
80
394
14.1
23
)0.2
51
QC
(MA
R)
AE
4.0
4.4
0.1
726
0.0
20
219
8.5
Mon
tmore
ncy
,B
ore
al
47�1
90 ,
71�0
80
Oi–
Oe
–43.6
0.9
347
0.1
51
289
6.2
34
)0.1
63
QC
(MO
N)
E4.1
1.2
0.0
815
0.0
10
117
8.0
Nels
on
Hou
se,
Bore
al
55�5
50 ,
98�3
70
Oi–
Oe
–30.7
0.5
358
0.0
57
538
9.3
56
)0.0
90
MN
(NH
1)
Ej
4.8
0.6
0.0
321
0.0
09
60
3.3
Pri
nce
Alb
ert
,B
ore
al
53�1
30 ,
105�3
80
Oi–
Oe–O
a–
28.1
0.6
047
0.0
57
492
10.5
56
)0.0
95
SK
(PA
L)
AE
6.2
1.8
0.0
921
0.0
21
88
4.3
Peta
waw
a,
Cool
tem
pera
te45�5
50 ,
77�3
50
Oi–
Oe–O
a–
41.9
1.2
234
0.1
02
411
12.0
34
)0.2
24
ON
(PE
T)
E4.1
3.6
0.1
036
0.0
24
147
2.5
Port
McN
eil
,B
C(P
ML)
Paci
fic
cord
ille
ran
50�3
60 ,
127�2
00
Oi–
Oe
–47.0
1.1
242
0.0
66
717
17.0
31
)0.1
76
Oa
3.5
40.7
0.9
244
0.0
51
802
18.0
Sch
eff
erv
ille
,Q
C(S
CH
)Su
barc
tic
54�5
20 ,
66�3
90
Oi–
Oe–O
a–
36.6
0.7
648
0.0
79
465
9.6
48
)0.1
18
Bw
4.9
1.9
0.0
921
0.0
37
51
2.4
Sh
aw
nig
an
Lake,
Paci
fic
cord
ille
ran
48�3
80 ,
123�4
20
Oi–
Oe–O
a–
41.2
0.8
549
0.1
18
349
7.2
27
)0.2
11
BC
(SH
L)
E&
Bh
5.1
3.4
0.0
939
0.0
94
36
1.0
Term
un
dee,
SK
(TE
R)
Tra
nsi
tion
al
51�5
00 ,
104�5
50
Oi–
Oe–O
aA
–15.0
0.9
017
0.0
97
155
9.3
47
)0.1
27
gra
ssla
nd
A7.0
4.1
0.3
313
0.0
51
81
6.5
Tople
y,
BC
(TO
P)
Sou
thco
rdil
lera
n54�3
60 ,
126�1
80
Oi–
Oe
–39.7
1.0
538
0.1
56
254
6.7
38
)0.1
56
E&
Bw
4.8
2.7
0.1
124
0.0
69
39
1.6
Wh
iteh
ors
e,
YK
(WH
I)N
ort
hco
rdil
lera
n60�5
10 ,
135�1
20
Oi–
Oe
–33.0
1.1
529
0.1
37
241
8.4
70
)0.0
49
Ash
5.6
1.9
0.0
729
0.0
65
30
1.2
Qu
otie
nts
are
base
don
mass
.aSoi
lpH
inw
ate
r.
50 T. R. Moore and others
rate, which is largely a function of time and cli-
matic conditions.
RESULTS
Litter and Site Characteristics
There was little variation in the C and N concen-
trations of the ten initial litters (Table 1), with only
pine needles substantially richer in N (1.28%) than
the other litters (0.59–0.88%). Consequently, the
range of C:N mass quotients was narrow (53–83),
except for the pine needles (39). The range of initial
P concentration was larger (0.023–0.127%), with
C:P quotients from 369 to 2,122. The initial N:P
mass quotients ranged from 5.3–25.7. There was
also a large variation in Ca concentration (0.37–
4.55%) and AUR (acid-unhydrolyzable residue, or
‘‘Klason lignin’’, 11–36%), the latter resulting in
AUR:N quotients of between 16 and 56.
The large range of vegetation and climate at the
18 sites are presented in Table 2. The surface or-
ganic horizons (usually Oi–Oe–Oa) had N concen-
trations ranging from 0.53 to 1.20%, resulting in
C:N quotients of between 28 and 62 (Table 2). Total
P concentration of the uppermost horizon was also
variable, ranging from 0.057 to 0.156%, with C:P
quotients ranging from 254 to 717. Quotients of N:P
in the upper forest floor ranged from 6.2 to 17.0. In
the underlying organic-mineral horizon (usually A
and AE), the soils are generally acid (pH in water
ranging from 3.5 to 6.0) except for the Gillam (GI1),
Prince Albert (PAL) and Termundee (TER) sites,
where pH was between 6.2 and 7.0. In these A, AE
or E horizons, C:N and C:P quotients ranged from 13
to 39 and 8 to 289, respectively.
Litter Mass Loss
The litter mass after 6 years had declined to an
average (across all sites) of 32% (fescue) to 53%
(cedar) of the original mass (Table 1). The average
exponential decay (k) rates over the 6 years ranged
from )0.117 (beech) to )0.184 (birch). Expressed
as the average value for the ten litters at each site,
the slowest rates of decomposition were at Inuvik
(INU), with 77% original mass remaining and a k
value of )0.042, and the fastest rates were at
Morgan Arboretum (MAR), with 23% mass
remaining and a k value of )0.251 (Table 2).
N and P Dynamics
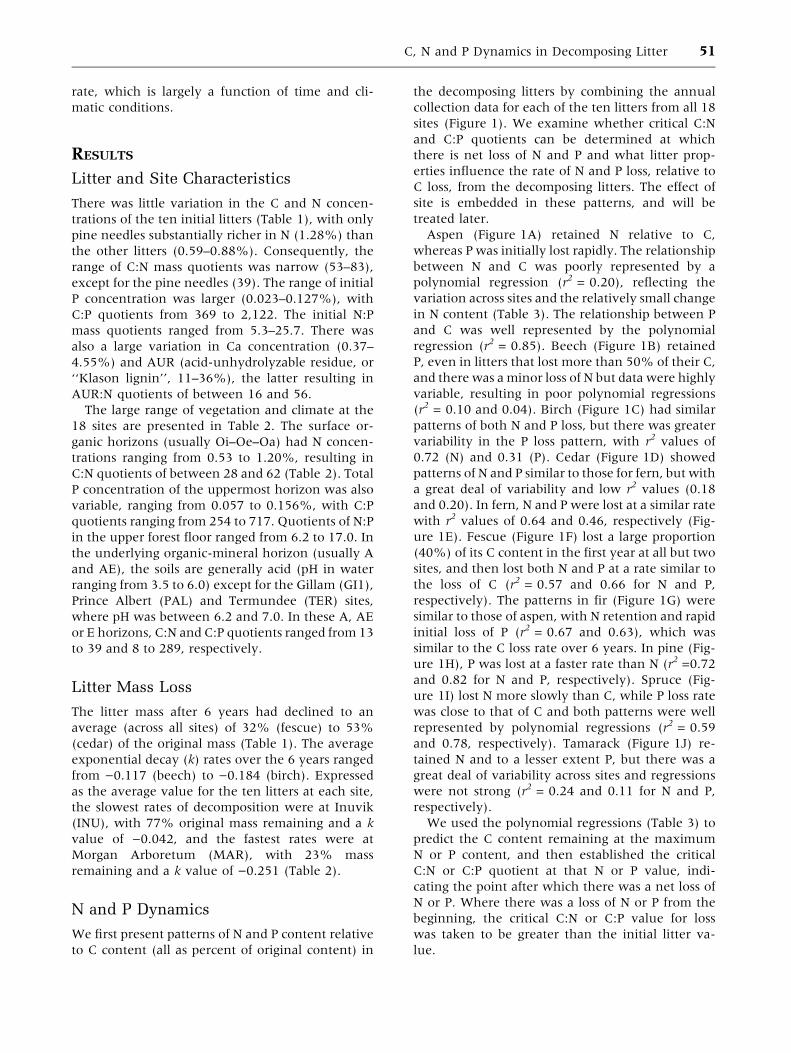
We first present patterns of N and P content relative
to C content (all as percent of original content) in
the decomposing litters by combining the annual
collection data for each of the ten litters from all 18
sites (Figure 1). We examine whether critical C:N
and C:P quotients can be determined at which
there is net loss of N and P and what litter prop-
erties influence the rate of N and P loss, relative to
C loss, from the decomposing litters. The effect of
site is embedded in these patterns, and will be
treated later.
Aspen (Figure 1A) retained N relative to C,
whereas P was initially lost rapidly. The relationship
between N and C was poorly represented by a
polynomial regression (r2 = 0.20), reflecting the
variation across sites and the relatively small change
in N content (Table 3). The relationship between P
and C was well represented by the polynomial
regression (r2 = 0.85). Beech (Figure 1B) retained
P, even in litters that lost more than 50% of their C,
and there was a minor loss of N but data were highly
variable, resulting in poor polynomial regressions
(r2 = 0.10 and 0.04). Birch (Figure 1C) had similar
patterns of both N and P loss, but there was greater
variability in the P loss pattern, with r2 values of
0.72 (N) and 0.31 (P). Cedar (Figure 1D) showed
patterns of N and P similar to those for fern, but with
a great deal of variability and low r2 values (0.18
and 0.20). In fern, N and P were lost at a similar rate
with r2 values of 0.64 and 0.46, respectively (Fig-
ure 1E). Fescue (Figure 1F) lost a large proportion
(40%) of its C content in the first year at all but two
sites, and then lost both N and P at a rate similar to
the loss of C (r2 = 0.57 and 0.66 for N and P,
respectively). The patterns in fir (Figure 1G) were
similar to those of aspen, with N retention and rapid
initial loss of P (r2 = 0.67 and 0.63), which was
similar to the C loss rate over 6 years. In pine (Fig-
ure 1H), P was lost at a faster rate than N (r2 =0.72
and 0.82 for N and P, respectively). Spruce (Fig-
ure 1I) lost N more slowly than C, while P loss rate
was close to that of C and both patterns were well
represented by polynomial regressions (r2 = 0.59
and 0.78, respectively). Tamarack (Figure 1J) re-
tained N and to a lesser extent P, but there was a
great deal of variability across sites and regressions
were not strong (r2 = 0.24 and 0.11 for N and P,
respectively).
We used the polynomial regressions (Table 3) to
predict the C content remaining at the maximum
N or P content, and then established the critical
C:N or C:P quotient at that N or P value, indi-
cating the point after which there was a net loss of
N or P. Where there was a loss of N or P from the
beginning, the critical C:N or C:P value for loss
was taken to be greater than the initial litter va-
lue.
C, N and P Dynamics in Decomposing Litter 51
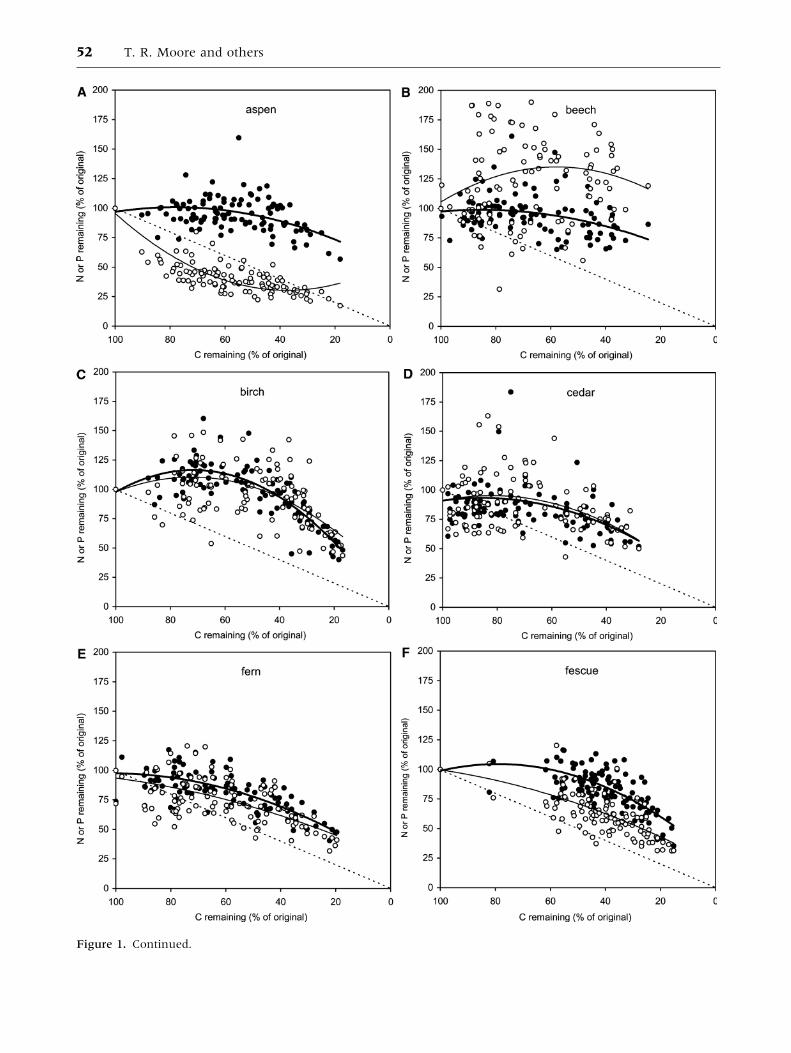
Figure 1. Continued.
52 T. R. Moore and others
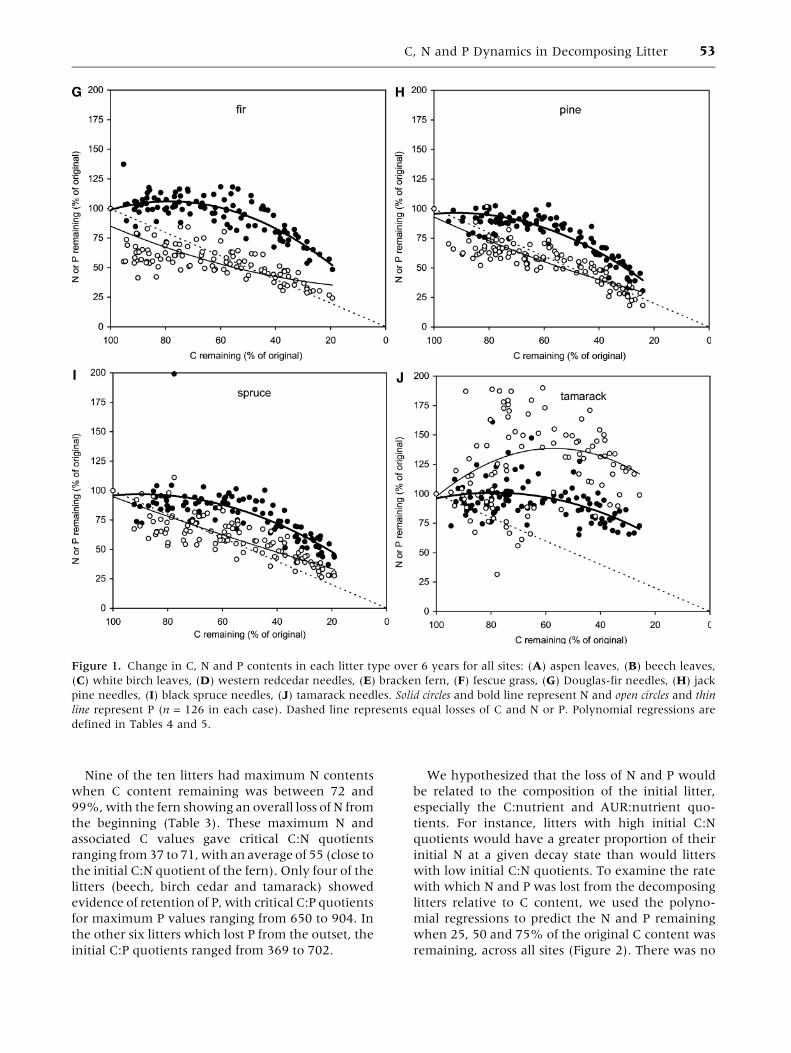
Nine of the ten litters had maximum N contents
when C content remaining was between 72 and
99%, with the fern showing an overall loss of N from
the beginning (Table 3). These maximum N and
associated C values gave critical C:N quotients
ranging from 37 to 71, with an average of 55 (close to
the initial C:N quotient of the fern). Only four of the
litters (beech, birch cedar and tamarack) showed
evidence of retention of P, with critical C:P quotients
for maximum P values ranging from 650 to 904. In
the other six litters which lost P from the outset, the
initial C:P quotients ranged from 369 to 702.
We hypothesized that the loss of N and P would
be related to the composition of the initial litter,
especially the C:nutrient and AUR:nutrient quo-
tients. For instance, litters with high initial C:N
quotients would have a greater proportion of their
initial N at a given decay state than would litters
with low initial C:N quotients. To examine the rate
with which N and P was lost from the decomposing
litters relative to C content, we used the polyno-
mial regressions to predict the N and P remaining
when 25, 50 and 75% of the original C content was
remaining, across all sites (Figure 2). There was no
Figure 1. Change in C, N and P contents in each litter type over 6 years for all sites: (A) aspen leaves, (B) beech leaves,
(C) white birch leaves, (D) western redcedar needles, (E) bracken fern, (F) fescue grass, (G) Douglas-fir needles, (H) jack
pine needles, (I) black spruce needles, (J) tamarack needles. Solid circles and bold line represent N and open circles and thin
line represent P (n = 126 in each case). Dashed line represents equal losses of C and N or P. Polynomial regressions are
defined in Tables 4 and 5.
C, N and P Dynamics in Decomposing Litter 53
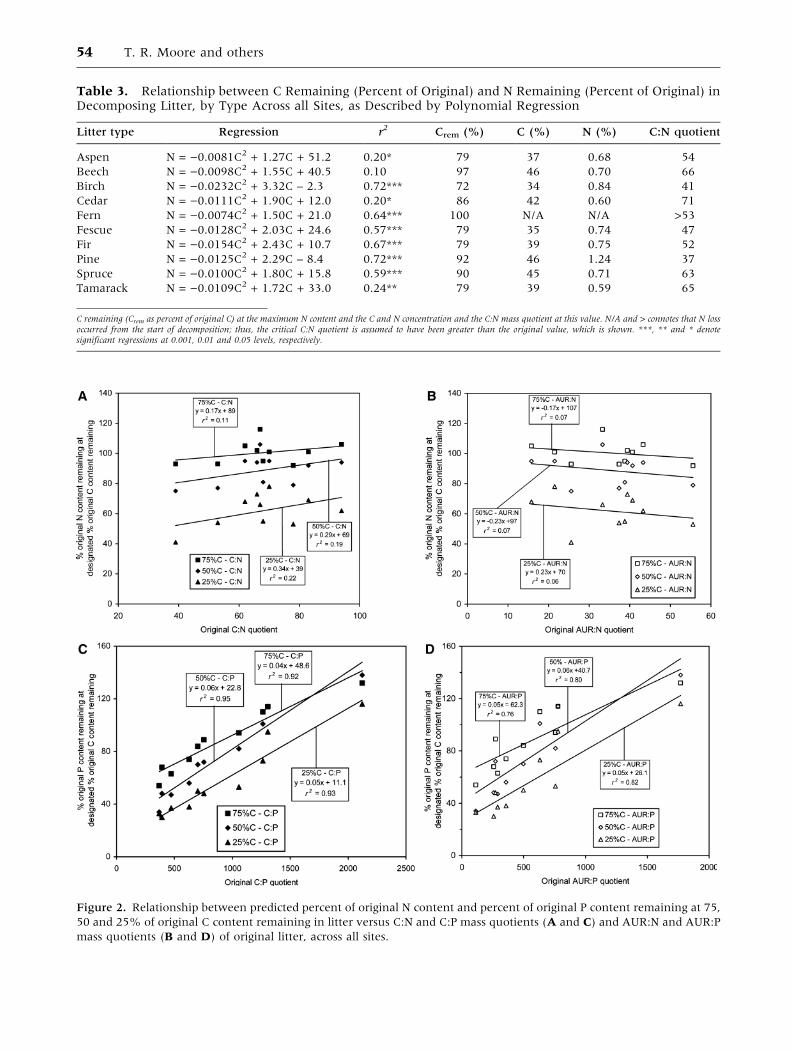
Table 3. Relationship between C Remaining (Percent of Original) and N Remaining (Percent of Original) inDecomposing Litter, by Type Across all Sites, as Described by Polynomial Regression
Litter type Regression r2 Crem (%) C (%) N (%) C:N quotient
Aspen N = )0.0081C2 + 1.27C + 51.2 0.20* 79 37 0.68 54
Beech N = )0.0098C2 + 1.55C + 40.5 0.10 97 46 0.70 66
Birch N = )0.0232C2 + 3.32C – 2.3 0.72*** 72 34 0.84 41
Cedar N = )0.0111C2 + 1.90C + 12.0 0.20* 86 42 0.60 71
Fern N = )0.0074C2 + 1.50C + 21.0 0.64*** 100 N/A N/A >53
Fescue N = )0.0128C2 + 2.03C + 24.6 0.57*** 79 35 0.74 47
Fir N = )0.0154C2 + 2.43C + 10.7 0.67*** 79 39 0.75 52
Pine N = )0.0125C2 + 2.29C – 8.4 0.72*** 92 46 1.24 37
Spruce N = )0.0100C2 + 1.80C + 15.8 0.59*** 90 45 0.71 63
Tamarack N = )0.0109C2 + 1.72C + 33.0 0.24** 79 39 0.59 65
C remaining (Crem as percent of original C) at the maximum N content and the C and N concentration and the C:N mass quotient at this value. N/A and > connotes that N lossoccurred from the start of decomposition; thus, the critical C:N quotient is assumed to have been greater than the original value, which is shown. ***, ** and * denotesignificant regressions at 0.001, 0.01 and 0.05 levels, respectively.
Figure 2. Relationship between predicted percent of original N content and percent of original P content remaining at 75,
50 and 25% of original C content remaining in litter versus C:N and C:P mass quotients (A and C) and AUR:N and AUR:P
mass quotients (B and D) of original litter, across all sites.
54 T. R. Moore and others
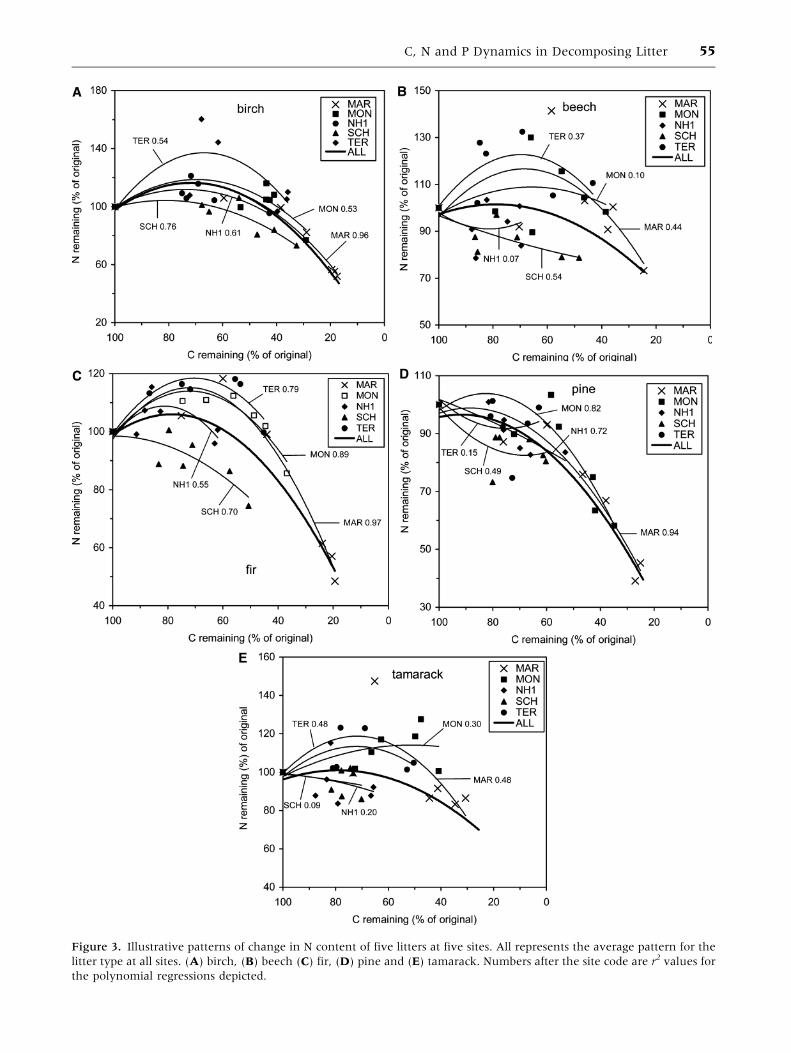
Figure 3. Illustrative patterns of change in N content of five litters at five sites. All represents the average pattern for the
litter type at all sites. (A) birch, (B) beech (C) fir, (D) pine and (E) tamarack. Numbers after the site code are r2 values for
the polynomial regressions depicted.
C, N and P Dynamics in Decomposing Litter 55
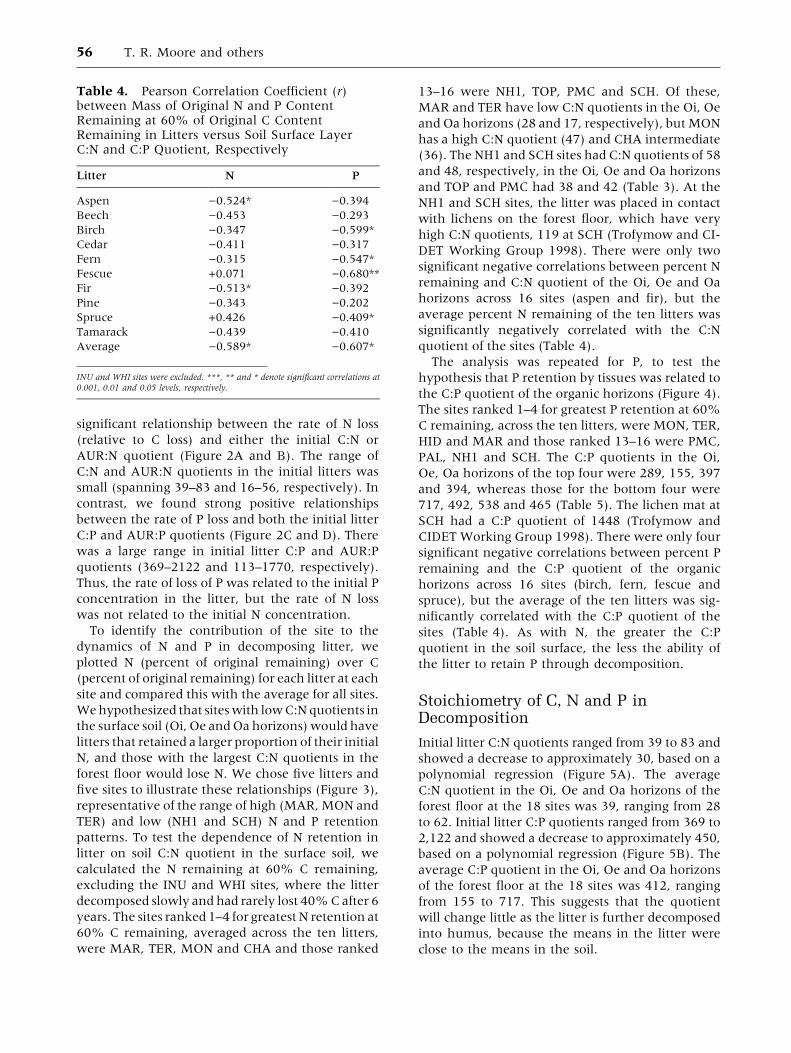
significant relationship between the rate of N loss
(relative to C loss) and either the initial C:N or
AUR:N quotient (Figure 2A and B). The range of
C:N and AUR:N quotients in the initial litters was
small (spanning 39–83 and 16–56, respectively). In
contrast, we found strong positive relationships
between the rate of P loss and both the initial litter
C:P and AUR:P quotients (Figure 2C and D). There
was a large range in initial litter C:P and AUR:P
quotients (369–2122 and 113–1770, respectively).
Thus, the rate of loss of P was related to the initial P
concentration in the litter, but the rate of N loss
was not related to the initial N concentration.
To identify the contribution of the site to the
dynamics of N and P in decomposing litter, we
plotted N (percent of original remaining) over C
(percent of original remaining) for each litter at each
site and compared this with the average for all sites.
We hypothesized that sites with low C:N quotients in
the surface soil (Oi, Oe and Oa horizons) would have
litters that retained a larger proportion of their initial
N, and those with the largest C:N quotients in the
forest floor would lose N. We chose five litters and
five sites to illustrate these relationships (Figure 3),
representative of the range of high (MAR, MON and
TER) and low (NH1 and SCH) N and P retention
patterns. To test the dependence of N retention in
litter on soil C:N quotient in the surface soil, we
calculated the N remaining at 60% C remaining,
excluding the INU and WHI sites, where the litter
decomposed slowly and had rarely lost 40% C after 6
years. The sites ranked 1–4 for greatest N retention at
60% C remaining, averaged across the ten litters,
were MAR, TER, MON and CHA and those ranked
13–16 were NH1, TOP, PMC and SCH. Of these,
MAR and TER have low C:N quotients in the Oi, Oe
and Oa horizons (28 and 17, respectively), but MON
has a high C:N quotient (47) and CHA intermediate
(36). The NH1 and SCH sites had C:N quotients of 58
and 48, respectively, in the Oi, Oe and Oa horizons
and TOP and PMC had 38 and 42 (Table 3). At the
NH1 and SCH sites, the litter was placed in contact
with lichens on the forest floor, which have very
high C:N quotients, 119 at SCH (Trofymow and CI-
DET Working Group 1998). There were only two
significant negative correlations between percent N
remaining and C:N quotient of the Oi, Oe and Oa
horizons across 16 sites (aspen and fir), but the
average percent N remaining of the ten litters was
significantly negatively correlated with the C:N
quotient of the sites (Table 4).
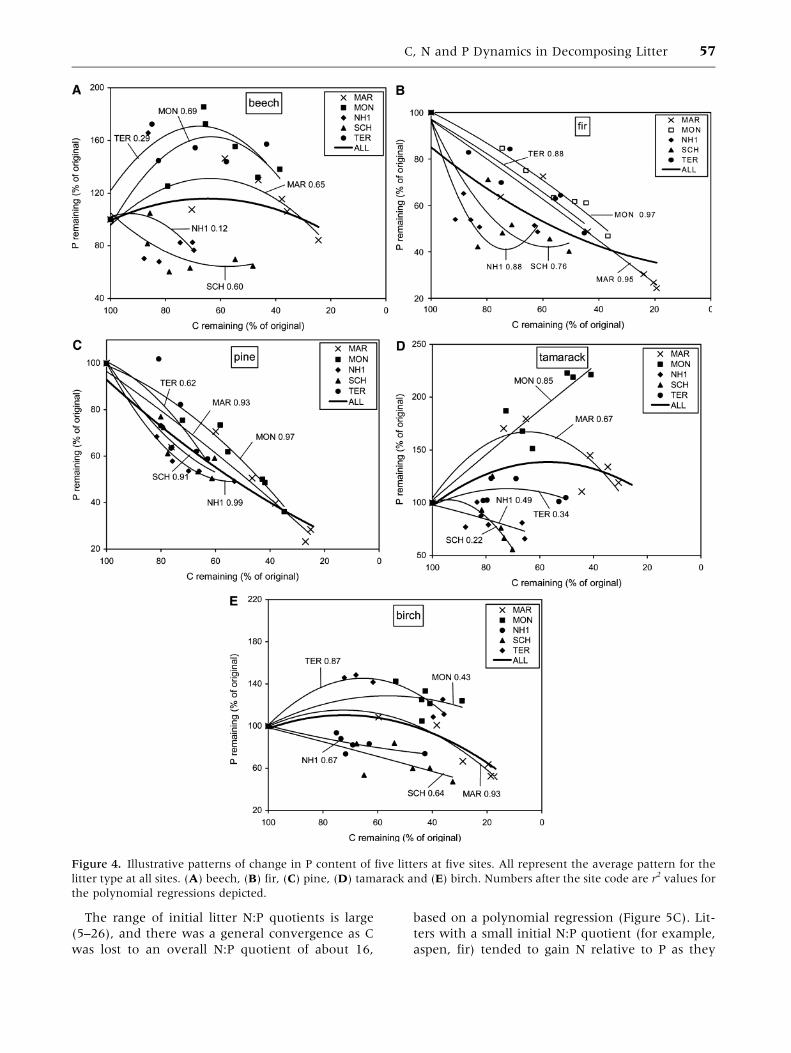
The analysis was repeated for P, to test the
hypothesis that P retention by tissues was related to
the C:P quotient of the organic horizons (Figure 4).
The sites ranked 1–4 for greatest P retention at 60%
C remaining, across the ten litters, were MON, TER,
HID and MAR and those ranked 13–16 were PMC,
PAL, NH1 and SCH. The C:P quotients in the Oi,
Oe, Oa horizons of the top four were 289, 155, 397
and 394, whereas those for the bottom four were
717, 492, 538 and 465 (Table 5). The lichen mat at
SCH had a C:P quotient of 1448 (Trofymow and
CIDET Working Group 1998). There were only four
significant negative correlations between percent P
remaining and the C:P quotient of the organic
horizons across 16 sites (birch, fern, fescue and
spruce), but the average of the ten litters was sig-
nificantly correlated with the C:P quotient of the
sites (Table 4). As with N, the greater the C:P
quotient in the soil surface, the less the ability of
the litter to retain P through decomposition.
Stoichiometry of C, N and P inDecomposition
Initial litter C:N quotients ranged from 39 to 83 and
showed a decrease to approximately 30, based on a
polynomial regression (Figure 5A). The average
C:N quotient in the Oi, Oe and Oa horizons of the
forest floor at the 18 sites was 39, ranging from 28
to 62. Initial litter C:P quotients ranged from 369 to
2,122 and showed a decrease to approximately 450,
based on a polynomial regression (Figure 5B). The
average C:P quotient in the Oi, Oe and Oa horizons
of the forest floor at the 18 sites was 412, ranging
from 155 to 717. This suggests that the quotient
will change little as the litter is further decomposed
into humus, because the means in the litter were
close to the means in the soil.
Table 4. Pearson Correlation Coefficient (r)between Mass of Original N and P ContentRemaining at 60% of Original C ContentRemaining in Litters versus Soil Surface LayerC:N and C:P Quotient, Respectively
Litter N P
Aspen )0.524* )0.394
Beech )0.453 )0.293
Birch )0.347 )0.599*
Cedar )0.411 )0.317
Fern )0.315 )0.547*
Fescue +0.071 )0.680**
Fir )0.513* )0.392
Pine )0.343 )0.202
Spruce +0.426 )0.409*
Tamarack )0.439 )0.410
Average )0.589* )0.607*
INU and WHI sites were excluded. ***, ** and * denote significant correlations at0.001, 0.01 and 0.05 levels, respectively.
56 T. R. Moore and others
The range of initial litter N:P quotients is large
(5–26), and there was a general convergence as C
was lost to an overall N:P quotient of about 16,
based on a polynomial regression (Figure 5C). Lit-
ters with a small initial N:P quotient (for example,
aspen, fir) tended to gain N relative to P as they
Figure 4. Illustrative patterns of change in P content of five litters at five sites. All represent the average pattern for the
litter type at all sites. (A) beech, (B) fir, (C) pine, (D) tamarack and (E) birch. Numbers after the site code are r2 values for
the polynomial regressions depicted.
C, N and P Dynamics in Decomposing Litter 57
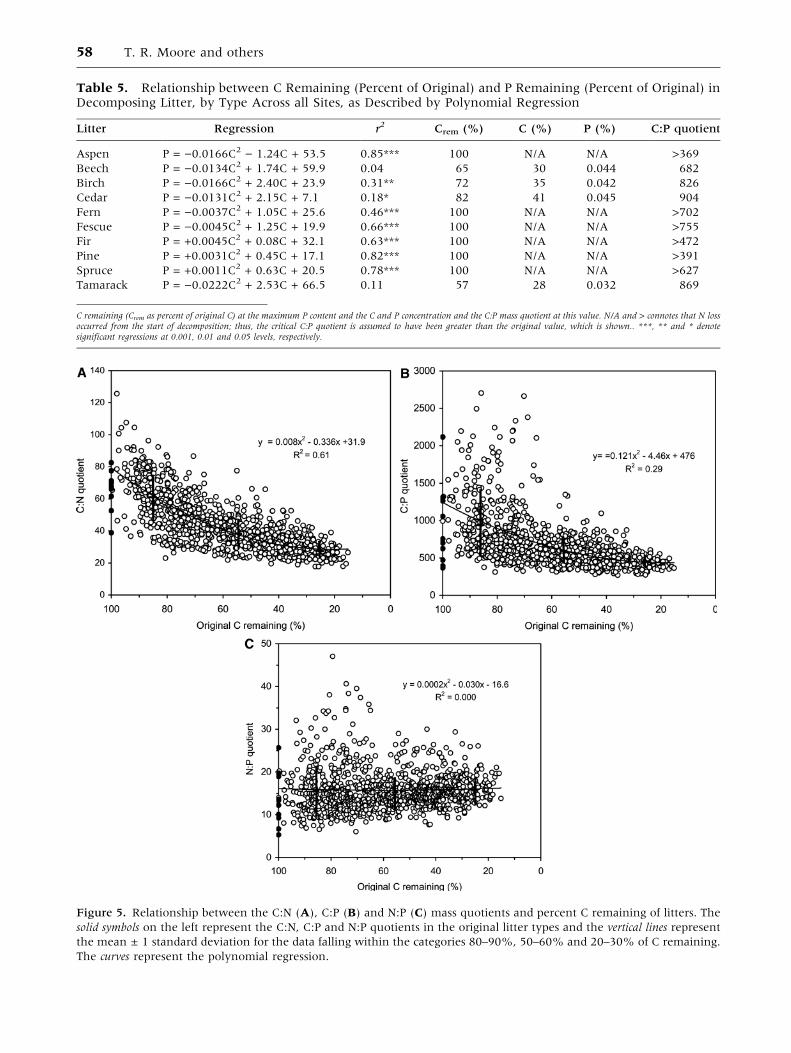
Table 5. Relationship between C Remaining (Percent of Original) and P Remaining (Percent of Original) inDecomposing Litter, by Type Across all Sites, as Described by Polynomial Regression
Litter Regression r2 Crem (%) C (%) P (%) C:P quotient
Aspen P = )0.0166C2 ) 1.24C + 53.5 0.85*** 100 N/A N/A >369
Beech P = )0.0134C2 + 1.74C + 59.9 0.04 65 30 0.044 682
Birch P = )0.0166C2 + 2.40C + 23.9 0.31** 72 35 0.042 826
Cedar P = )0.0131C2 + 2.15C + 7.1 0.18* 82 41 0.045 904
Fern P = )0.0037C2 + 1.05C + 25.6 0.46*** 100 N/A N/A >702
Fescue P = )0.0045C2 + 1.25C + 19.9 0.66*** 100 N/A N/A >755
Fir P = +0.0045C2 + 0.08C + 32.1 0.63*** 100 N/A N/A >472
Pine P = +0.0031C2 + 0.45C + 17.1 0.82*** 100 N/A N/A >391
Spruce P = +0.0011C2 + 0.63C + 20.5 0.78*** 100 N/A N/A >627
Tamarack P = )0.0222C2 + 2.53C + 66.5 0.11 57 28 0.032 869
C remaining (Crem as percent of original C) at the maximum P content and the C and P concentration and the C:P mass quotient at this value. N/A and > connotes that N lossoccurred from the start of decomposition; thus, the critical C:P quotient is assumed to have been greater than the original value, which is shown.. ***, ** and * denotesignificant regressions at 0.001, 0.01 and 0.05 levels, respectively.
Figure 5. Relationship between the C:N (A), C:P (B) and N:P (C) mass quotients and percent C remaining of litters. The
solid symbols on the left represent the C:N, C:P and N:P quotients in the original litter types and the vertical lines represent
the mean ± 1 standard deviation for the data falling within the categories 80–90%, 50–60% and 20–30% of C remaining.
The curves represent the polynomial regression.
58 T. R. Moore and others
decompose, whereas litters with a high initial N:P
quotient (for example, beech and tamarack) tended
to lose N relative to P. There is also a greater
divergence of N:P ratio in the early stages of
decomposition among the beech and tamarack lit-
ters. The average N:P quotient in the Oi, Oe and Oa
horizons of the forest floor at the 18 sites was 10
and ranged from 6–17, suggesting that the quotient
will decrease as the litter is further decomposed
into soil humus.
DISCUSSION
The range of C:N mass quotients in the litters used
in our study (39–83) is slightly smaller than the
range of 31–90 in 14 tree litters employed by the
long-term intersite decomposition experiment
(LIDET, M. E. Harmon, Oregon State Univ., per-
sonal communication). Thus, our results may be
constrained by the narrow range in the initial C:N
quotient of the litters used, with only pine needles
having a low value (39). The range of C:P mass
quotients of our litters started at a lower value
(369) than the lowest LIDET ratio (664) but only
ranged up to 2,122, compared to 4,138 for LIDET
(M. E. Harmon, personal communication). The
stronger patterns established for P loss in CIDET
may reflect the influence of a lower quotient and
smaller range, as CIDET covered only about half of
the upper range of values found in LIDET.
The mesh size of the litter-bags is small and
exclusion of macroinvertebrates may affect the
rates of decomposition and N and P dynamics. At
the Shawnigan site, there was no difference in
decay rates or on soil organism communities in
litterbags with wood chips or mixed litter between
CIDET litter-bags and those with a mesh size of 5
mm (Setala and others 1996; Trofymow 1998;
Addison and others 2003a, b). Although the results
are applicable to cool temperate to subarctic forests,
they may not apply in forests where macroinver-
tebrates play an important role in the decomposi-
tion processes.
Testing our Hypotheses
The results of our study are largely consistent with
our initial hypotheses, as described in the Intro-
duction.
Hypothesis 1: N is generally gained during early stages
of decomposition, whereas P may be gained or be lost.
Nitrogen was retained in all litters, until about 40%
of the original C had been lost. Phosphorus release
was more variable, with both initial retention and
release occurring, depending on the litter type.
Hypothesis 2: Critical C:N and C:P quotients at which
N and P loss begins vary among litter type. The critical
C:N quotient ranged from 37 (pine) to 71 (cedar)
and for C:P quotient ranged from 682 (beech) to
904 (cedar). These were generally in the ranges
reported for similar litters.
Hypothesis 3: Litters with high concentrations of re-
calcitrant materials have higher critical C:N quotients.
Critical quotients increased with increasing recal-
citrance of litter, as indicated by the rate of decay
(mass loss or exponential k value) or the initial C:N
quotient. This is consistent with the suggestion that
the critical C:N quotient depends on the portion of
the litter that has decomposed (Burger and Pritchett
1984). In our recalcitrant litters, the portion that
had been decayed may have had a C:N quotient of
about 30, but the material remaining still had a
much higher C:N quotient and thus raised the
apparent critical C:N quotient.
Hypothesis 4: The initial concentration of N or P in
litter influences patterns of nutrient loss. There was a
strong relationship between the initial P concen-
tration in litter and the pattern of P release, as lit-
ters with high initial P concentrations lost P and
those with low concentrations retained P. Only
those litters with C:P quotients greater than 700
retained P. There was no such relationship for N.
This may have stemmed from the much greater
range of initial C:P than C:N quotients in our litters.
Hypothesis 5: The initial AUR or ‘‘Klason lignin’’
concentration of litter affects N accumulation. There was
little evidence to support this hypothesis based on
the weak relationship between original AUR:N
quotient and N content of litter at various stages of
decomposition (Figure 2b).
Hypothesis 6: N or P availability in the surface soil
has smaller effects on nutrients in litter than initial litter
composition, but nutrients tend to be retained more in
litter in nutrient-rich environments. There was some
evidence that the availability of N and P in the
surrounding forest floor at each site influenced N
and P release from the litter. The amount of N or P
remaining in litter was weakly but negatively cor-
related with the C:N and C:P quotients in the forest
floor. This probably reflects the degree to which
colonizing fungi can export or import nutrients in
the litter to or from the adjacent forest floor. A
positive but weak relationship was reported by
Vesterdal (1999).
Stoichiometry of C, N and P inDecomposition
Recently, there has been considerable attention
given to broad C, N and P stoichiometries, such as
C, N and P Dynamics in Decomposing Litter 59
in leaves related to climate (Reich and Oleksyn
2004), in plant tissues (Knecht and Goransson
2004), in food webs (Elser and others 2000) and in
C sequestration in ecosystems (Hessen and others
2004). Here, we have the opportunity to determine
if patterns are apparent across Canadian forests.
As the litters decomposed over 6 years, there was
a general decline and convergence in C:N and C:P
quotients as percent C remaining was reduced to
less than 40%, a commonly noted phenomenon in
many other decomposition studies (for example,
Melillo and others 1989; Vesterdal 1999). Our re-
sults suggest that C:N and C:P quotients move to
values of about 30 and 450, respectively, similar to
those observed in the upper organic layers of the
soil at these forested sites. In a collation of data for
terrestrial autotrophs, Elser and others (2000) noted
the wide range in C:N and C:P quotients and with
means of 31 and 375, on a mass basis. They also
noted mean C:N and C:P quotients of 6 and 45 for
terrestrial invertebrate herbivores, showing that
this decrease in quotients as litter decomposes re-
flects the nutrient demands of the decomposer
populations.
We found a convergence of N:P ratios during decay
to between 10 and 20, with a mean value of
approximately 16. This has not been reported before,
but appears to be a common occurrence, based on a
collation of N:P quotients from three sources: (1)
studies with decomposition data, (2) studies with
forest floor data, and (3) studies with both decom-
position and forest floor data. In litter decomposition
studies, the N:P quotients of beech, aspen and balsam
poplar leaves decaying over 3 to 5 years rose from 7 to
20, from 5 to 23 and from 5 to 19, respectively (Staaf
1980a, b; Louiser and Parkinson 1978). In decom-
posing red spruce needles, initial N:P ratios of 3 to 9
rose to 16 to 17 over two years (Rustad and Cronan
1988). The initial N:P quotient in a variety of litters in
three Rocky Mountain forests was 5–15 but in-
creased to between 10 and 15 after 3 to 5 years of
decomposition (Prescott and others 1993). Litter
ultimately decomposes and becomes forest floor
material, so it is not surprising that the range of N:P
quotients (10–20) that we found in our long-term
study is also consistent with several estimates of the
N:P quotientof humus found by others, ranging from
12 to 15 (Gosz and others 1976), 15 (Berg and Las-
kowski1997),17 (Goszandothers1973),18 (Lousier
and Parkinson 1978) and, from a review of the
world’s forests, 11–20 for temperate and boreal forest
floors (Vogt and others 1986). Finally, some studies
measured N and P in both decomposing litter and
forest floor. Over 1 year, Gosz and others (1973) re-
ported a convergence of N:P quotients during decay
of birch, maple and beech leaf litter from initial val-
ues of 14–29 to between 15 to 17, similar to that for
the forestfloor (17and15 in theOeandOahorizons).
The N:P quotient of litter in New Brunswick con-
verged from between 4 and 27 to between 14 and 17
after2years,whichencompasses the15–16 foundfor
the forest floor (MacLean and Wein 1978).
If we are correct in our assumption that the N:P
quotient in decomposing litter will approach 16,
regardless of initial litter values, then the pattern of
net P retention and loss during decay might be
predictable from the initial N:P quotient of the lit-
ter: loss of P from litters with initial N:P quotients
less than 16 and retention or gain of P in those
greater than 16. For example, Edmonds (1980)
measured net immobilization of P in western
hemlock leaf litter with an initial N:P quotient of 20
but observed loss of P in Pacific silver fir and
Douglas-fir with initial N:P quotients of 5. Monleon
and Cromack (1996) reviewed four studies of
Ponderosa pine needle decay and noted that there
was loss of P during the first year from all litters
with initial N:P quotients less than 11. Baker and
Attiwill (1985) reported initial retention of P in
Eucalyptus litter (initial N:P quotient 33–38) but loss
from Pinus radiata litter (initial N:P quotient 8–12)
with a convergence between 13 and 24 after 2
years of decomposition. Tripathi and Singh (1992)
found that P was retained in bamboo wood and
roots (N:P quotient 25 and 35), but not in grass
shoots and twigs (N:P quotients 14 and 15). How-
ever, they found P retention in bamboo leaves (N:P
quotient 12) but not in sheaths (N:P quotient 24),
which is not consistent with our hypothesis.
Together, these observations suggest that there is
a consistent convergence of N:P quotient to be-
tween 10 and 20 during decomposition of forest
litter in temperate and boreal forests. Although
changes in N:P quotients during litter decay have
received little attention, they are increasingly rec-
ognized as a major determinant of nutrient limita-
tion and release in ecosystems (Sterner and Elser
2002). For example, Koerselman and Meuleman
(1996) reviewed the literature on N and P limita-
tions to growth in a variety of wetland ecosystems
and concluded that a soil N:P quotient greater than
16:1 indicates P limitation while that less than 14:1
indicates N limitation for plants. Knecht and
Goransson (2004) reviewed N and P concentrations
in plant tissues, noting a range in N:P quotient from
2 to 50 and averages for coniferous, deciduous and
herbaceous tissues of 8, 11 and 10, respectively.
Elser and others (2000) compared C:N:P quotients
of autotrophs and invertebrate herbivores in ter-
restrial ecosystems and found, on a mass basis, that
60 T. R. Moore and others
autotroph C:N, C:P and N:P quotients averaged 31,
378 and 13, respectively, whereas values for
invertebrate herbivores averaged 7, 45 and 12,
respectively. Elser and Urabe (1999) suggest that
the basic predictions of nutrient release using of
stoichiometric models are generally supported by
experimental data from pelagic systems, showing
that critical N:P release quotients are primarily a
function of the N:P quotients of algae and their
grazers. Stoichiometry may apply in soils, where
food webs are becoming increasingly recognized as
important regulators of nutrient cycling. Our find-
ings suggest a stoichiometric relationship associated
with the decay process in forests, in which litters of
widely divergent initial chemistry are transformed
into humus within a smaller range of N:P quo-
tients. This may be another case of ‘‘consumer-
driven nutrient cycling’’ (Elser and Urabe 1999),
arising from differences in the N:P ratios of bacteria
and fungi and their grazers. This convergence of
N:P ratios is in keeping with the ‘‘decay filter’’
concept (Melillo and others 1989), in which
decomposition converts relatively heterogeneous
litter into homogeneous humus.
CONCLUSION
As has been found for rates of mass loss in foliar
tissues placed in diverse ecosystems (for example,
Moore and others 1999; Trofymow and others
2002), we have shown here that relationships can
be developed which are broadly applicable and can
be used to predict the fate of N and P as litter
decomposes in Canadian forests. The critical vari-
ables are primarily the composition of the original
litter, particularly the C:N and C:P quotients, and
secondarily the characteristics of the underlying
soil. Our results suggest that stoichiometric rela-
tionships between C, N and P can be developed for
the litter–humus continuum, similar to those
developed in aquatic ecosystems.
ACKNOWLEDGEMENTS
Funding from the Climate Change and Ecosystems
Processes Networks of the Canadian Forest service
supported this experiment. The CIDET Working
Group includes C. Camire, L. Duschene, L. Kozak, M.
Kranabetter, I. Morrison, M. Siltanen, S. Smith,
S. Visser R. Wein and C. Preston technical support
was provided by B. Ferris, A. Harris, L. Kutny, R.
Leach and D. White. We gratefully acknowledge
D. Anderson, C. Monreal, R. Trowbridge, M. Weber
and the late Steve Zoltai for encouragement and
assistance in establishing sites or initial litter collec-
tion. Further information on CIDET is available on
the Web at http:///www.pfc.cfs.nrcan.gc.ca/ cli-
mate/cidet.
REFERENCES
Addison J, Trofymow J, Marshall VG. 2003a. Functional role of
Collembola in decomposition in coastal temperate rainforests.
Appl Soil Ecol 24:247–61.
Addison J, Trofymow J, Marshall VG. 2003b. Abundance, spe-
cies diversity, and community structure of Collembola in
successional coastal temperate forests on Vancouver Island,
Canada. Appl Soil Ecol 24:233–46.
Allison FE. 1973. Soil organic matter and its role in crop pro-
duction. Amsterdam: Elsevier.
Axelsson G, Berg B. 1988. Fixation of ammonia (15N) to Pinus
sylvestris needle litter in different stages of decomposition.
Scand J For Res 3:273–9.
Bartos DL, DeByle NV. 1981. Quantity, decomposition, and
nutrient dynamics of aspen litter fall in Utah. For Sci 27:381–90.
Baker TG, Attiwill PM. 1985. Above-ground nutrient distribution
and cycling in Pinus radiata D Don and Eucalyptus oblique L’herit
forests in southeastern Australia. For Ecol Manage 13:41–52.
Berg B, Ekbohm G. 1983. Nitrogen immobilization in decom-
posing needle litter at variable carbon:nitrogen ratios. Ecology
64:63–7.
Berg B, Laskowski R. 1997. Changes in nutrient concentrations
and nutrient release in decomposing needle litter in mono-
cultural systems of Pinus contorta and Pinus sylvestris – a com-
parison and synthesis. Scand J For Res 12:113–21.
Berg B, McClaugherty CA. 1989. Nitrogen and phosphorus re-
lease from decomposing litter in relation to the disappearance
of lignin. Can J Bot 67:1148–56.
Berg B, Soderstrom B. 1979. Fungal biomass and nitrogen in
decomposing Scots pine needle litter. Soil Biol Biochem
11:339–41.
Berg B, Staaf H. 1987. Release of nutrients from decomposing
white birch and Scots pine needle litter. Pedobiologia 30:55–63.
Berg B, Tamm CO. 1994. Decomposition and nutrient dynamics
of litter in long-term optimum nutrition experiments. II.
Nutrient concentrations in decomposing Picea abies needle
litter. Scand J For Res 9:99–105.
Binkley D. 1986. Forest nutrition management Toronto: Wiley.
Burger JA, Pritchett WL. 1984. Effects of clearfelling and site
preparation on nitrogen mineralization in a southern pine
stand. Soil Sci Soc Am J 48:1432–37.
Chadwick DR, Ineson P, Woods C, Pearce TG. 1998. Decompo-
sition of Pinus sylvestris litter in litter-bags: influence of
underlying native litter layer. Soil Biol Biochem 30:47–55.
Ecoregions Working Group. 1989. Ecoclimatic regions of Can-
ada, first approximation. Ecoregions Working Group of Can-
ada Committee on Ecological Land Classification. Ottawa:
Ecological Land Classification Series, Number 23, Sustainable
Development Branch, Canadian Wildlife Service, Conserva-
tion and Protection, Environment Canada.
Edmonds RL. 1979. Decomposition and nutrient release in
Douglas-fir needle litter in relation to stand development. Can
J For Res 9:132–40.
Edmonds RL. 1980. Litter decomposition and nutrient release in
Douglas-fir, red alder, western hemlock, and Pacific silver fir
ecosystems in western Washington. Can J For Res 10:317–37.
C, N and P Dynamics in Decomposing Litter 61
Elser JJ, Fagan WF, Denno RF, Dobberfuhl DR, Folarin A,
Huberty A, Interland S, Kilham SS, McCauley E, Schulz KL,
Siemann EH, Sterner RW. 2000. Nutritional constraints in
terrestrial and freshwater food webs. Nature 408:578–80.
Elser JJ, Urabe J. 1999. The stoichiometry of consumer-driven
nutrient recycling: theory, observations, and consequences.
Ecology 80:735–51.
Gosz JR, Likens GE, Bormann FH. 1973. Nutrient release from
decomposing leaf and branch litter in the Hubbard Brook
Forest, New Hampshire. Ecol Monogr 43:173–91.
Gosz JR, Likens GE, Bormann FH. 1976. Organic matter and
nutrient dynamics of the forest and forest floor in the Hubbard
Brook Forest. Oecologia 22:1441–50.
Hart SC, Firestone MK, Paul EA. 1992. Decomposition and
nutrient dynamics of Ponderosa pine needles in a Mediterra-
nean-type climate. Can J For Res 22:306–14.
Haynes RJ. 1986. Mineral nitrogen in the plant-soil system.
Toronto: Academic.
Hessen DO, Agren GI, Anderson TR, Elser JJ, de Ruiter PC. 2004.
Carbon sequestration in ecosystems: the role of stoichiometry.
Ecology 85:1179–92.
Kelly JM, Beauchamp JJ. 1987. Mass loss and nutrient changes
in decomposing upland oak and mesic mixed-hardwood leaf
litter. Soil Sci Soc Am J 51:1616–22.
Knecht MF, Goransson A. 2004. Terrestrial plants require
nutrients in similar proportions. Tree Physiol 24:447–60.
Koerselman W, Meuleman AFM. 1996. The vegetation N:P ratio:
a new tool to detect the nature of nutrient limitation. J Appl
Ecol 33:1441–50.
Lousier JD, Parkinson D. 1978. Chemical element dynamics in
decomposing leaf litter. Can J Bot 56:2795–812.
MacLean DA, Wein RW. 1978. Weight loss and nutrient changes
in decomposing litter and forest floor material in New
Brunswick forest stands. Can J Bot 56:2730–49.
McClaugherty CA, Pastor J, Aber JD, Melillo JM. 1985. Forest
litter decomposition in relation to soil nitrogen dynamics and
litter quality. Ecology 66:266–75.
Meentemeyer V. 1978. Macroclimate and lignin control of litter
decomposition rates. Ecology 59:465–72.
Melillo JM, Aber JD, Linkins AE, Ricca A, Fry B, Nadelhoffer KJ.
1989. Carbon and nitrogen dynamics along the decay contin-
uum: plant litter to soil organic matter. Plant Soil 115:189–98.
Monleon VJ, Cromack K. 1996. Long-term effects of prescribed
underburning on litter decomposition and nutrient release in
ponderosa pine stands in central Oregon. For Ecol Manage
81:143–52.
Moore TR, Trofymow JA, Taylor B, Prescott C, Camire C,
Duschene L, Fyles J, Kozak L, Kranabetter M, Morrison I,
Siltanen M, Smith S, Titus B, Visser S, Wein R, Zoltai S. 1999.
Litter decomposition rates in Canadian forests. Glob Change
Biol 5:75–82.
Olson JS. 1963. Energy storage and the balance of producers and
decomposers in ecological systems. Ecology 44:322–31.
Prescott CE, Taylor BR, Parsons WJF, Durall DM, Parkinson D.
1993. Nutrient release from decomposing litter in Rocky
Mountain coniferous forests: influence of nutrient availability.
Can J For Res 23:1576–86.
Prescott CE. 2005. Decomposition and mineralization of nutri-
ents from litter and humus. In: BassiriRad H, Ed. Nutrient
acquisition by plants: an ecological perspective. Ecological
Studies Series. Berlin Heidelberg New York: Springer p. 15–41.
Preston CM, Trofymow JA, Working Group. 2000. Variability in
litter quality and its relationship to litter decay in Canadian
forests. Can J Bot 78:1269–87.
Reich PB, Oleksyn J. 2004. Global patterns of plant leaf N and P
in relations to temperature and latitude. Proc Nat Acad Sci
101:11001–6.
Rustad LE. 1994. Element dynamics along a decay continuum in
a red spruce ecosystem in Maine, USA. Ecology 75:867–79.
Rustad LE, Cronan CS. 1988. Element loss and retention during
litter decay in a red spruce stand in Maine. Can J For Res
18:947–53.
Setala H, Marshall VG, Trofymow JA. 1996. Influence of body
size of soil fauna on litter decomposition and 15N uptake by
poplar in a pot trial. Soil Biol Biochem 28:1661–75.
Staaf H. 1980a. Influence of chemical composition, addition of
raspberry leaves, and nitrogen supply on decomposition rate
and dynamics of nitrogen and phosphorus in beech leaf litter.
Oikos 35:55–62.
Staaf H. 1980b. Release of plant nutrients from decomposing leaf
litter in a South Swedish beech forest. Holarctic Ecol 3:129–
36.
Staaf H, Berg B. 1982. Accumulation and release of plant
nutrients in decomposing Scots pine needle litter. Long-term
decomposition in a Scots pine forest. II. Can J Bot 60:1561–68.
Sterner RW, Elser JJ. 2002. Ecological stoichiometry. Princeton:
Princeton University Press.
Stohlgren TJ. 1988. Litter dynamics in two Sierran mixed conifer
forests. 2. Nutrient release in decomposing leaf litter. Can J
For Res 18:1136–44.
Titus BD, Malcolm DC. 1999. The long-term decomposition of
Sitka spruce needles in brash. Forestry 72:207–21.
Tripathi SK, Singh KP. 1992. Nutrient immobilization and re-
lease patterns during plant decomposition in a dry tropical
bamboo savanna, India. Biol Fertil Soils 14:191–9.
Trofymow JA. 1998. Detrital carbon fluxes and microbial activity
in successional Douglas-fir forests. Northwest Sci 72 (Special
Issue No. 2):51–3.
Trofymow JA, CIDET Working Group. 1998. CIDET–The Cana-
dian intersite decomposition experiment: project and site
establishment report. Victoria: Inf. Rep. BC-X-378, Natural
Resources Canada, Canadian Forest Service.
Trofymow JA, Preston CM, Prescott CE. 1995. Litter quality and
its potential effect on decay rates of materials from Canadian
forests. Water Air Soil Pollut. 82:215–26.
Trofymow JA, Moore TR, Titus B, Prescott C, Morrison I, Silta-
nen M, Smith S, Fyles J, Wein R, Camire C, Duschene L,
Kozak L, Kranabetter M, Visser S. 2002. Rates of litter
decomposition over 6 years in Canadian forests: influence of
litter quality and climate. Can J For Res 32:789–804.
Upadhyay VP, Singh JS. 1985. Nitrogen dynamics of decom-
posing hardwood leaf litter in a central Himalayan forest. Soil
Biol Biochem 17:827–830.
Vesterdal L. 1999. Influence of soil type on mass loss and
nutrient release from decomposing foliage litter of beech and
Norway spruce. Can J For Res 29:95–105.
Vogt KA, Grier CC, Vogt DJ. 1986. Production, turnover, and
nutrient dynamics of above- and below-ground detritus of
world forests. Adv Ecol Res 15:303–77.
White DL. 1988. Litter decomposition in southern Appalachian
black locust and pine-hardwood stands: litter quality and
nitrogen dynamics. Can J For Res 18:54–63.
62 T. R. Moore and others