Embed Size (px)
Citation preview
1
Dr Neelam Dhingra
Coordinator
Blood Transfusion Safety
WHO, Geneva
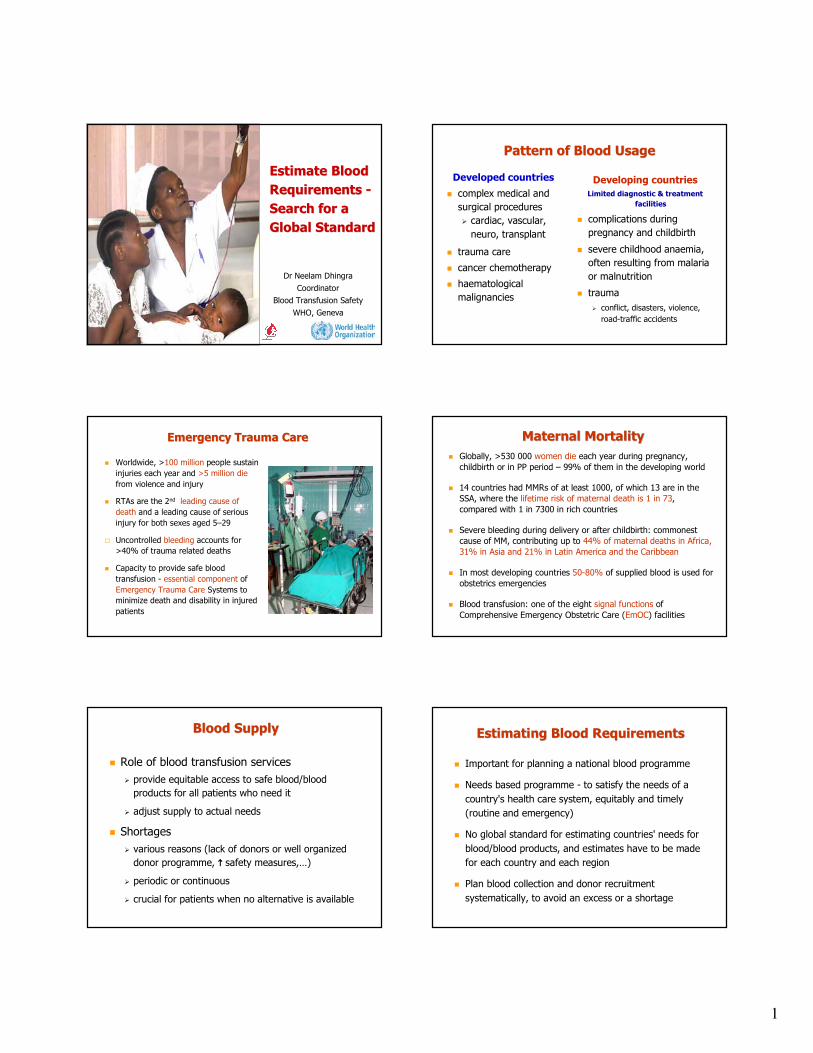
Estimate BloodEstimate Blood
Requirements Requirements --
Search for aSearch for a
Global Standard Global Standard
Pattern of Blood Pattern of Blood UsageUsage
Developed countries
� complex medical and
surgical procedures
� cardiac, vascular,
neuro, transplant
� trauma care
� cancer chemotherapy
� haematological
malignancies
Developing countries
Limited diagnostic & treatment
facilities
� complications during
pregnancy and childbirth
� severe childhood anaemia,
often resulting from malaria
or malnutrition
� trauma
� conflict, disasters, violence,
road-traffic accidents
Emergency Trauma Care Emergency Trauma Care
� Worldwide, >100 million people sustain
injuries each year and >5 million die
from violence and injury
� RTAs are the 2nd leading cause of
death and a leading cause of serious
injury for both sexes aged 5–29
� Uncontrolled bleeding accounts for
>40% of trauma related deaths
� Capacity to provide safe blood
transfusion - essential component of
Emergency Trauma Care Systems to
minimize death and disability in injured
patients
Maternal MortalityMaternal MortalityMaternal Mortality
� Globally, >530 000 women die each year during pregnancy,
childbirth or in PP period – 99% of them in the developing world
� 14 countries had MMRs of at least 1000, of which 13 are in the
SSA, where the lifetime risk of maternal death is 1 in 73,
compared with 1 in 7300 in rich countries
� Severe bleeding during delivery or after childbirth: commonest
cause of MM, contributing up to 44% of maternal deaths in Africa,
31% in Asia and 21% in Latin America and the Caribbean
� In most developing countries 50-80% of supplied blood is used for
obstetrics emergencies
� Blood transfusion: one of the eight signal functions of
Comprehensive Emergency Obstetric Care (EmOC) facilities
Blood SupplyBlood Supply
� Role of blood transfusion services
� provide equitable access to safe blood/blood
products for all patients who need it
� adjust supply to actual needs
� Shortages
� various reasons (lack of donors or well organized
donor programme, ↑↑↑↑ safety measures,…)
� periodic or continuous
� crucial for patients when no alternative is available
Estimating Blood Requirements Estimating Blood Requirements
� Important for planning a national blood programme
� Needs based programme - to satisfy the needs of a
country's health care system, equitably and timely
(routine and emergency)
� No global standard for estimating countries' needs for
blood/blood products, and estimates have to be made
for each country and each region
� Plan blood collection and donor recruitment
systematically, to avoid an excess or a shortage
2
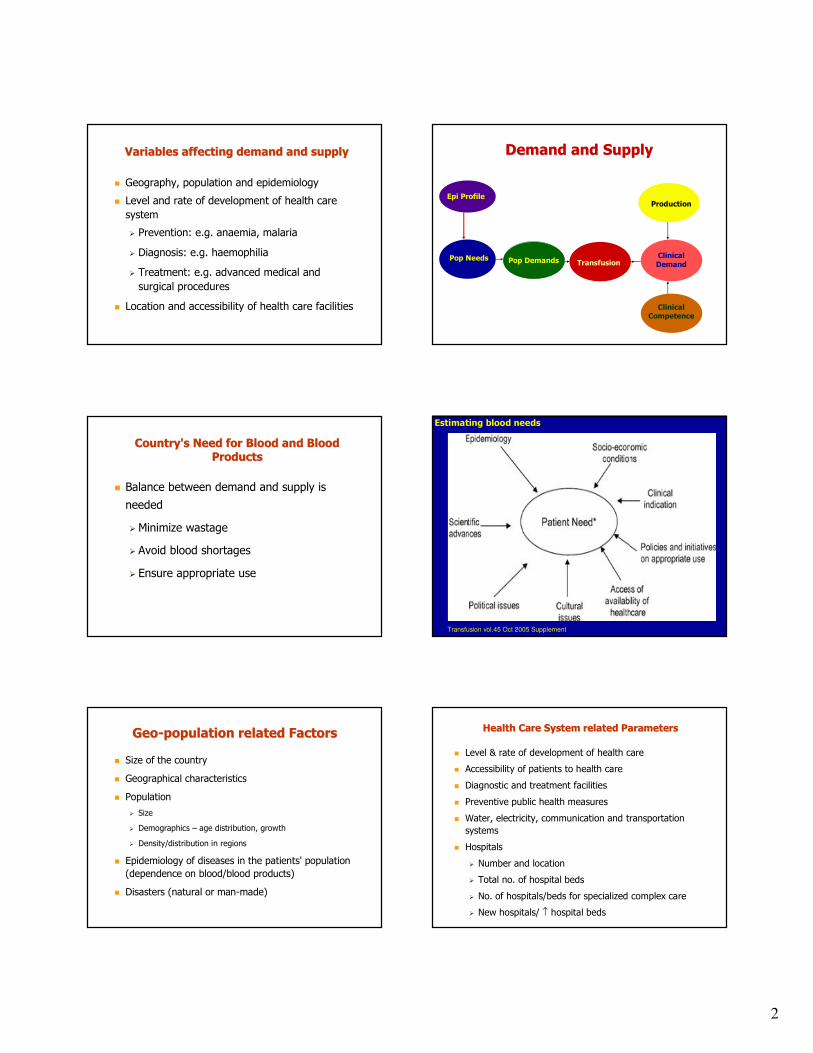
Variables affecting demand and supplyVariables affecting demand and supply
� Geography, population and epidemiology
� Level and rate of development of health care
system
� Prevention: e.g. anaemia, malaria
� Diagnosis: e.g. haemophilia
� Treatment: e.g. advanced medical and
surgical procedures
� Location and accessibility of health care facilities
Epi Profile
Pop Needs Pop Demands
Clinical Competence
Clinical
Demand Transfusion
Production
Demand and SupplyDemand and Supply
Country's Need for Blood and Blood Country's Need for Blood and Blood
Products Products
� Balance between demand and supply is
needed
� Minimize wastage
� Avoid blood shortages
� Ensure appropriate use
Estimating blood needsEstimating blood needs
Transfusion vol.45 Oct 2005 Supplement
GeoGeo--population related Factorspopulation related Factors
� Size of the country
� Geographical characteristics
� Population
� Size
� Demographics – age distribution, growth
� Density/distribution in regions
� Epidemiology of diseases in the patients' population
(dependence on blood/blood products)
� Disasters (natural or man-made)
� Level & rate of development of health care
� Accessibility of patients to health care
� Diagnostic and treatment facilities
� Preventive public health measures
� Water, electricity, communication and transportation
systems
� Hospitals
� Number and location
� Total no. of hospital beds
� No. of hospitals/beds for specialized complex care
� New hospitals/ ↑ hospital beds
Health Care System related ParametersHealth Care System related Parameters
3
� Development and effectiveness of BTS to provide
safe blood/blood products to support regular and
specific transfusion needs
� Number of blood centres and level of coordination
� Assessment of services in each centre
� blood collected, blood processing, storage and
transport capacity
� % of blood separated into components
� shelf-life of blood/blood components
BTS BTS related Parameters (1 of 2)related Parameters (1 of 2)
� Degree of component preparation tailored to real need
and resources of a country
� What % of blood should be separated into
components?
� What to do with the excess plasma?
� Options for Fractionation – Contract / In-country
� Hospital blood stock management / inventory control
� Future needs, including the feasibility of using recovered
plasma for fractionation
� Future need for apheresis and / or autologous programme
BTS BTS related Parameters (2 of 2)related Parameters (2 of 2)
Clinical Blood UsageClinical Blood Usage Parameters Parameters
� National guidelines on blood usage
� Size of hospital (s) and number of patients
� No. and kind of procedures, deliveries, anaemia pts
� Clinical competence and experience of staff
� Training for hospital and blood bank staff
� Annual blood usage review (past, present and future) -
hospitals, blood components
� Different types of components needed
NBS Total Losses 2005/06
>2.2million donors attending
13.14
2.02
2.23
0.27
0
2
4
6
8
10
12
14
16
18
20
Per
10
0 A
tte
nd
ee
s
Time-Expiring at
NBS
Complete Donations
Not Validated
Incomplete Bled
Donations
Attendees Not Bled
NBS Donations 2005/06
>2.2million donors attending
0
10
20
30
40
50
60
70
80
90
100
Pe
r 1
00
Att
en
de
es
Time-Expiring at
NBS
Complete Donations
Not Validated
Incomplete Bled
Donations
Attendees Not Bled
Issued Red Cell
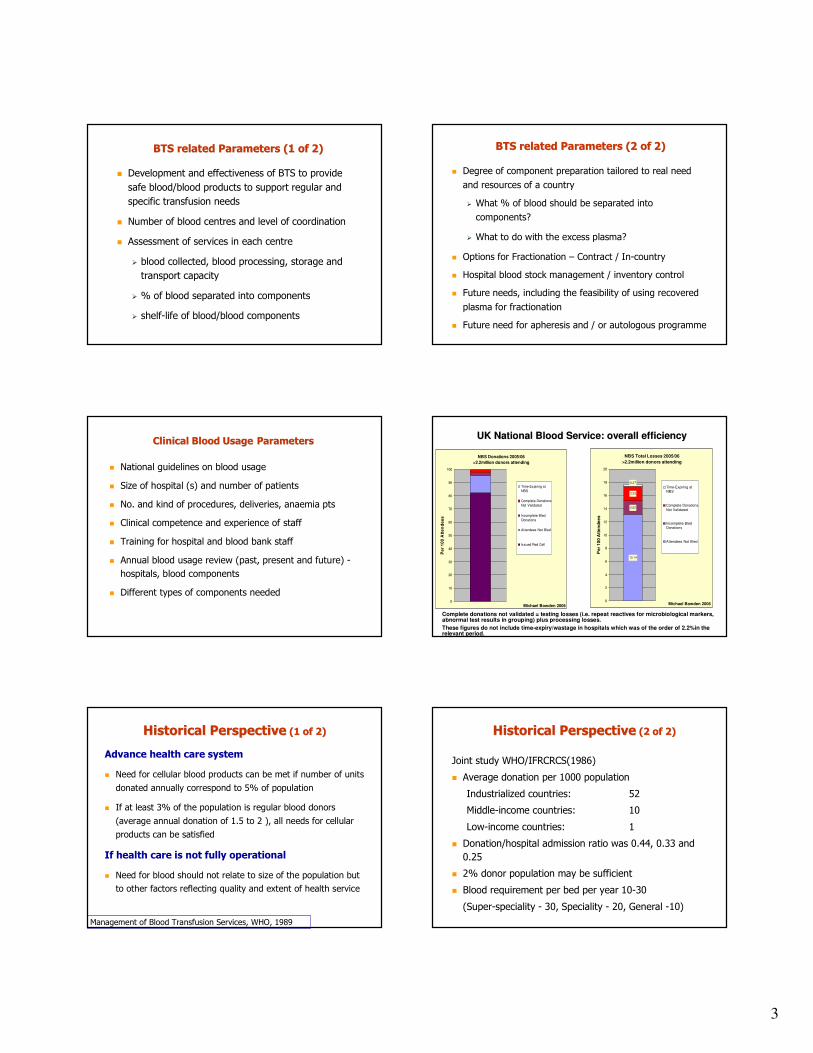
Michael Bowden 2006 Michael Bowden 2006
Complete donations not validated = testing losses (i.e. repeat reactives for microbiological markers, abnormal test results in grouping) plus processing losses.
These figures do not include time-expiry/wastage in hospitals which was of the order of 2.2%in therelevant period.
UK National Blood Service: overall efficiencyUK National Blood Service: overall efficiency
Historical PerspectiveHistorical Perspective (1 of 2)(1 of 2)
Advance health care system
� Need for cellular blood products can be met if number of units
donated annually correspond to 5% of population
� If at least 3% of the population is regular blood donors
(average annual donation of 1.5 to 2 ), all needs for cellular
products can be satisfied
If health care is not fully operational
� Need for blood should not relate to size of the population but
to other factors reflecting quality and extent of health service
Management of Blood Transfusion Services, WHO, 1989
Joint study WHO/IFRCRCS(1986)
� Average donation per 1000 population
Industrialized countries: 52
Middle-income countries: 10
Low-income countries: 1
� Donation/hospital admission ratio was 0.44, 0.33 and
0.25
� 2% donor population may be sufficient
� Blood requirement per bed per year 10-30
(Super-speciality - 30, Speciality - 20, General -10)
Historical PerspectiveHistorical Perspective (2 of 2)(2 of 2)
4
0.0
10.0
20.0
30.0
40.0
50.0
60.0
70.0
80.0
0.2 0.3 0.4 0.5 0.6 0.7 0.8 0.9 1
HDI values
Nu
mb
er
of
do
na
tio
ns /
10
00
pop
ula
tio
n
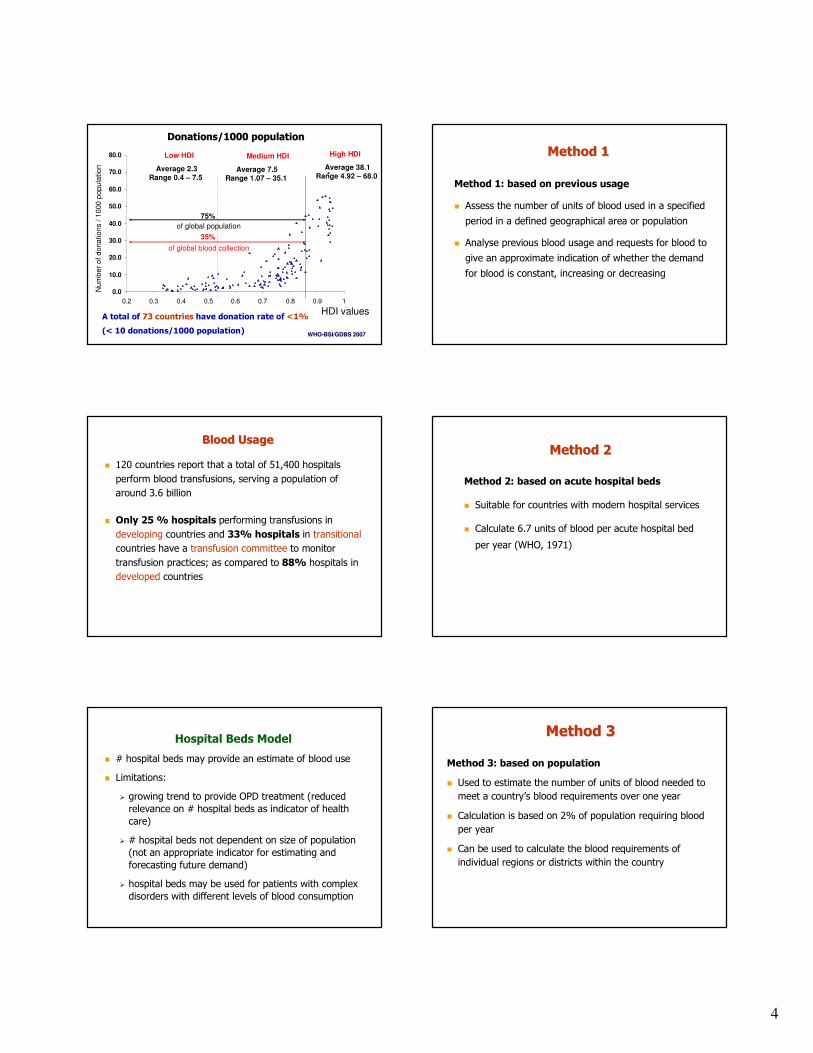
75%
of global population
High HDILow HDI Medium HDI
Donations/1000 populationDonations/1000 population
35%
of global blood collection
A total of 73 countries have donation rate of <1%
(< 10 donations/1000 population)
Average 2.3Range 0.4 – 7.5
Average 7.5Range 1.07 – 35.1
Average 38.1Range 4.92 – 68.0
WHOWHO--BSI/GDBS 2007BSI/GDBS 2007
Method 1Method 1
Method 1: based on previous usage
� Assess the number of units of blood used in a specified
period in a defined geographical area or population
� Analyse previous blood usage and requests for blood to
give an approximate indication of whether the demand
for blood is constant, increasing or decreasing
Blood UsageBlood Usage
� 120 countries report that a total of 51,400 hospitals
perform blood transfusions, serving a population of
around 3.6 billion
� Only 25 % hospitals performing transfusions in
developing countries and 33% hospitals in transitional
countries have a transfusion committee to monitor
transfusion practices; as compared to 88% hospitals in
developed countries
Method 2Method 2
Method 2: based on acute hospital beds
� Suitable for countries with modern hospital services
� Calculate 6.7 units of blood per acute hospital bed
per year (WHO, 1971)
Hospital Beds Model
� # hospital beds may provide an estimate of blood use
� Limitations:
� growing trend to provide OPD treatment (reduced
relevance on # hospital beds as indicator of health
care)
� # hospital beds not dependent on size of population
(not an appropriate indicator for estimating and
forecasting future demand)
� hospital beds may be used for patients with complex
disorders with different levels of blood consumption
Method 3Method 3
Method 3: based on population
� Used to estimate the number of units of blood needed to
meet a country’s blood requirements over one year
� Calculation is based on 2% of population requiring blood
per year
� Can be used to calculate the blood requirements of
individual regions or districts within the country
5
Population Based Model
� Makes it possible to:
� compare between countries or regions of
similar size
� project the trend in requirements in terms
of population trends
� paint a picture of the national situation
Method 3Method 3
Example
� For a country with a population of 10 million,
calculate as follows:
� 10 000 000 x 2% = 200 000 units of blood per
year or approximately 3850 per week
� A minimum of 100 000 donors will be needed if
each donor gives blood at least twice per year
Selecting a method to estimate Selecting a method to estimate
blood requirementsblood requirements
� Method 1 is the most practical where there is a
constant supply of blood
� Methods 2 and 3 can be useful where no data are
available or new established blood centre
1
Health Statistics and Informatics 3 February 2010
The Global Burden of Disease approach to comparable international statistics
Gretchen Stevens
Health Statistics and Informatics Department
Health Statistics and Informatics
Overview
A brief introduction to the Global Burden of Disease project
Issues in preparing comparable cross-national statistics
1. Selecting indicators and metrics
2. Correcting for bias in available data
3. Estimating and communicating uncertainty
Health Statistics and Informatics
Global burden of Disease (GBD)
A standardized framework for integrating all available information on mortality, causes of death, individual health status, and condition-specific epidemiology to provide an overview of the levels of population health and the causes of loss of health
• Consistent, comprehensive descriptive epidemiology
• Common metric or summary measure
Health Statistics and Informatics
GBD Principles
Quantities of interest are total events or states at the population level
Best available data used to make estimates
Corrections for major known biases to improve cross-population comparability
Comprehensive set of disease and injury causes –nothing is left out in principle
No blanks in the tables, only wider uncertainty intervals
Internal consistency used as a tool to improve validity
Health Statistics and Informatics
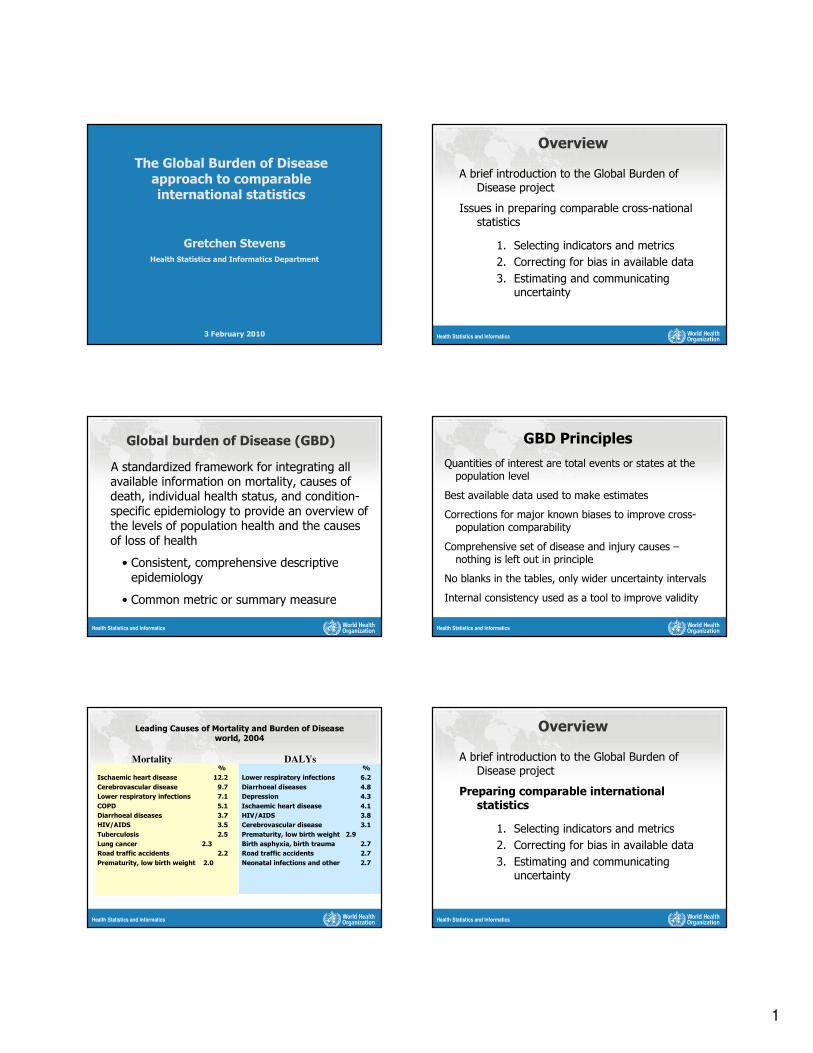
Leading Causes of Mortality and Burden of Diseaseworld, 2004
%
Ischaemic heart disease 12.2
Cerebrovascular disease 9.7
Lower respiratory infections 7.1
COPD 5.1
Diarrhoeal diseases 3.7
HIV/AIDS 3.5
Tuberculosis 2.5
Lung cancer 2.3
Road traffic accidents 2.2
Prematurity, low birth weight 2.0
%
Lower respiratory infections 6.2
Diarrhoeal diseases 4.8
Depression 4.3
Ischaemic heart disease 4.1
HIV/AIDS 3.8
Cerebrovascular disease 3.1
Prematurity, low birth weight 2.9
Birth asphyxia, birth trauma 2.7
Road traffic accidents 2.7
Neonatal infections and other 2.7
Mortality DALYs
Health Statistics and Informatics
Overview
A brief introduction to the Global Burden of Disease project
Preparing comparable international statistics
1. Selecting indicators and metrics
2. Correcting for bias in available data
3. Estimating and communicating uncertainty
2
Health Statistics and Informatics
Three types of health statistics
Unadjusted statistics:
Adjusted statistics:
Predicted statistics:
derived directly from primary data collection
corrected for known biases
predicted using a statistical model, includes both forecasts and "farcasts"
Health Statistics and Informatics
What is meant by comparable statistics?
Key elements:
Quantities of interest are estimated at the population level
Corrections for major known biases
Estimates are made for every population
Adjusted and predicted statistics can be used for national and international priority-setting
Health Statistics and Informatics
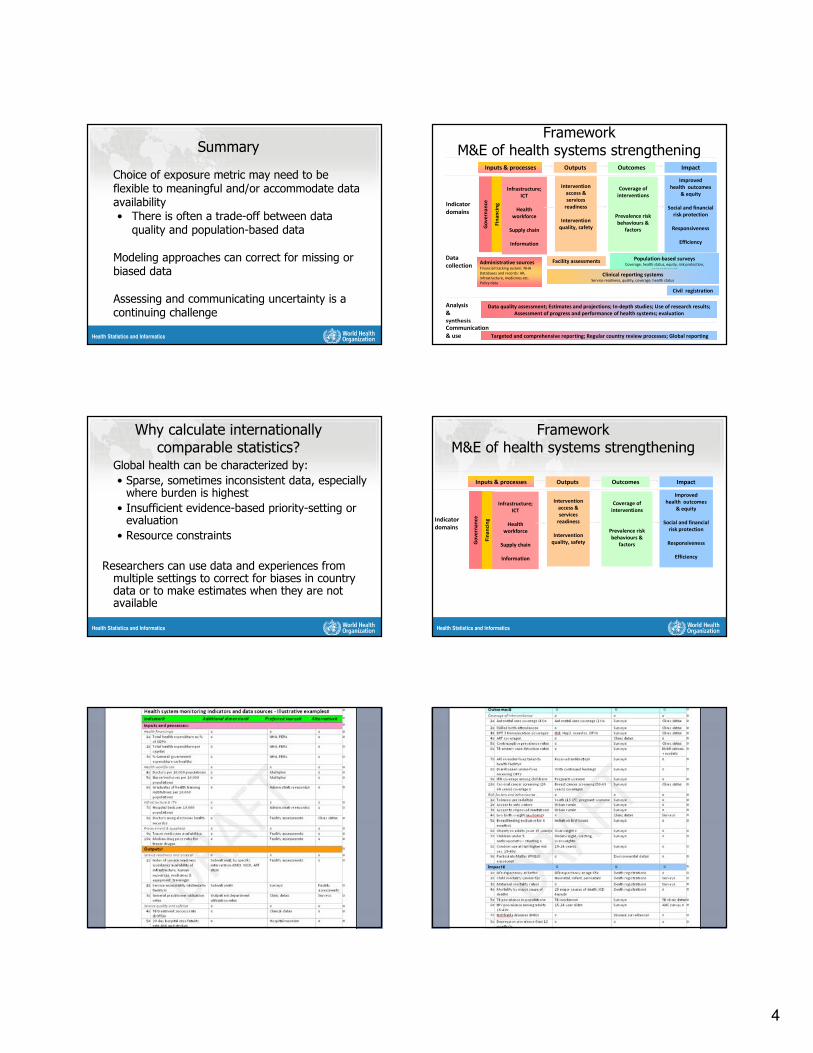
Three issues to consider when generating comparable statistics
1. Selecting indicators and metrics
2. Correcting for bias in available data
3. Estimating and communicating uncertainty
Health Statistics and Informatics
Selecting health indicator and metrics
• Meaningful health indicator
• Data are available or collectable
• Disease and risk factor indicators are preferably comparable across diseases/risk factors
Health Statistics and Informatics
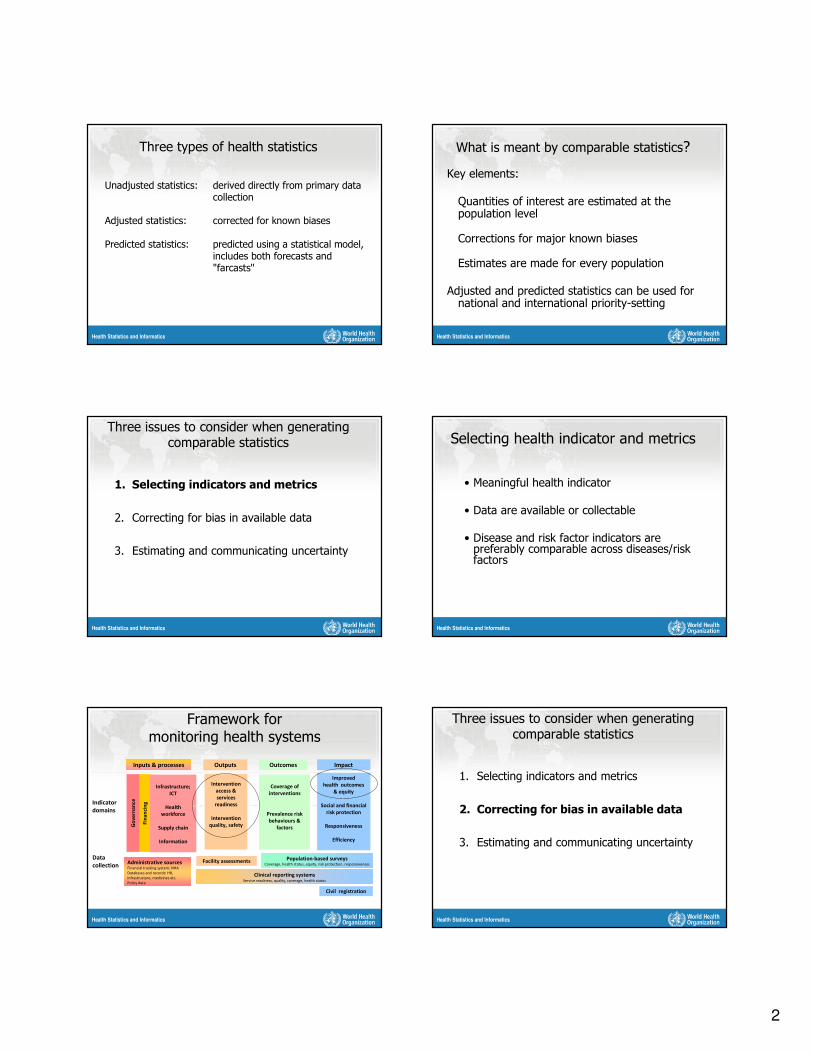
Inputs & processes Outputs Outcomes Impact
Data
collection
Indicator
domains
Improved
health outcomes
& equity
Social and financial
risk protection
Responsiveness
Efficiency
Fin
an
cin
g
Infrastructure;
ICT
Health
workforce
Supply chain
Information
Intervention
access &
services
readiness
Intervention
quality, safety
Coverage of
interventions
Prevalence risk
behaviours &
factorsGo
ve
rna
nce
Administrative sourcesFinancial tracking system; NHA
Databases and records: HR,
infrastructure, medicines etc.
Policy data
Facility assessments Population-based surveys
Coverage, health status, equity, risk protection, responsiveness
Clinical reporting systemsService readiness, quality, coverage, health status
Civil registration
Framework for monitoring health systems
Health Statistics and Informatics
Three issues to consider when generating comparable statistics
1. Selecting indicators and metrics
2. Correcting for bias in available data
3. Estimating and communicating uncertainty
3
Health Statistics and Informatics
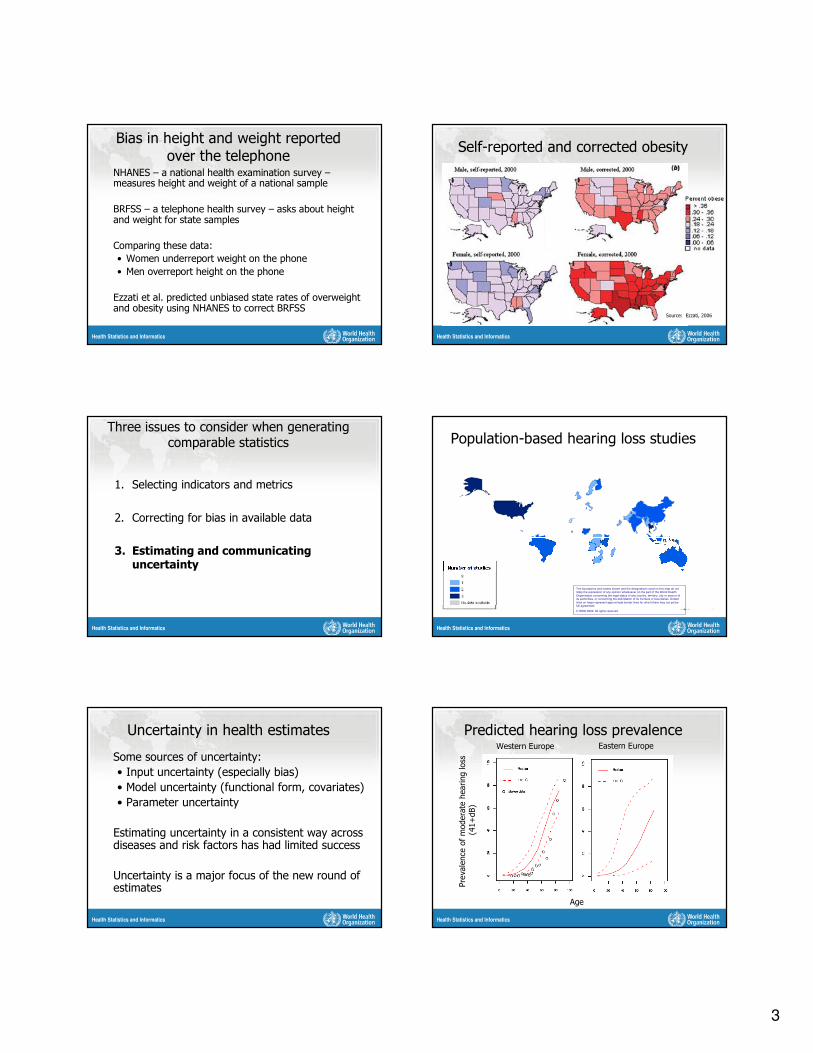
Bias in height and weight reported over the telephone
NHANES – a national health examination survey –measures height and weight of a national sample
BRFSS – a telephone health survey – asks about height and weight for state samples
Comparing these data:
• Women underreport weight on the phone
• Men overreport height on the phone
Ezzati et al. predicted unbiased state rates of overweight and obesity using NHANES to correct BRFSS
Health Statistics and Informatics
Self-reported and corrected obesity
Source: Ezzati, 2006
Health Statistics and Informatics
Three issues to consider when generating comparable statistics
1. Selecting indicators and metrics
2. Correcting for bias in available data
3. Estimating and communicating uncertainty
Health Statistics and Informatics
Population-based hearing loss studies
Health Statistics and Informatics
The boundaries and names shown and the designations used on this map do not imply the expression of any opinion whatsoever on the part of the World Health
Organization concerning the legal status of any country, territory, city or area or of its authorities, or concerning the delimitation of its frontiers or boundaries. Dotted
lines on maps represent approximate border lines for which there may not yet be full agreement.
© WHO 2002. All rights reserved
Health Statistics and Informatics
Uncertainty in health estimates
Some sources of uncertainty:
• Input uncertainty (especially bias)
• Model uncertainty (functional form, covariates)
• Parameter uncertainty
Estimating uncertainty in a consistent way across diseases and risk factors has had limited success
Uncertainty is a major focus of the new round of estimates
Health Statistics and Informatics
Predicted hearing loss prevalence
Prevalence
of moderate hearing loss
(41+dB)
Age
Western Europe Eastern Europe
4
Health Statistics and Informatics
Summary
Choice of exposure metric may need to be flexible to meaningful and/or accommodate data availability• There is often a trade-off between data
quality and population-based data
Modeling approaches can correct for missing or biased data
Assessing and communicating uncertainty is a continuing challenge
Health Statistics and Informatics
Inputs & processes Outputs Outcomes Impact
Data
collection
Indicator
domains
Analysis
&
synthesisCommunication
& use
Improved
health outcomes
& equity
Social and financial
risk protection
Responsiveness
Efficiency
Fin
an
cin
g
Infrastructure;
ICT
Health
workforce
Supply chain
Information
Intervention
access &
services
readiness
Intervention
quality, safety
Coverage of
interventions
Prevalence risk
behaviours &
factors
Go
ve
rna
nce
Administrative sourcesFinancial tracking system; NHA
Databases and records: HR,
infrastructure, medicines etc.
Policy data
Facility assessments Population-based surveys
Coverage, health status, equity, risk protection,
responsiveness
Clinical reporting systemsService readiness, quality, coverage, health status
Civil registration
Data quality assessment; Estimates and projections; In-depth studies; Use of research results;
Assessment of progress and performance of health systems; evaluation
Targeted and comprehensive reporting; Regular country review processes; Global reporting
FrameworkM&E of health systems strengthening
Health Statistics and Informatics
Why calculate internationally comparable statistics?
Global health can be characterized by:
• Sparse, sometimes inconsistent data, especially where burden is highest
• Insufficient evidence-based priority-setting or evaluation
• Resource constraints
Researchers can use data and experiences from multiple settings to correct for biases in country data or to make estimates when they are not available
Health Statistics and Informatics
Inputs & processes Outputs Outcomes Impact
Indicator
domains
Improved
health outcomes
& equity
Social and financial
risk protection
Responsiveness
Efficiency
Fin
an
cin
g
Infrastructure;
ICT
Health
workforce
Supply chain
Information
Intervention
access &
services
readiness
Intervention
quality, safety
Coverage of
interventions
Prevalence risk
behaviours &
factorsGo
ve
rna
nce
FrameworkM&E of health systems strengthening
Health Statistics and Informatics Health Statistics and Informatics
World Health Organization 12 April, 2010
1
WHO Experts' Consultation on
Estimation of Blood Requirements03 February 2010
Geneva.
Dr Peter OlumeseGlobal Malaria ProgrammeWHO/HQ, Geneva
Requirements of Blood & Blood
Components for Management of Malaria
Requirements of Blood & Blood
Components for Management of Malaria
Requirements of blood for management of malaria. Expert Consultation, Geneva, 03 Feb 20102 |
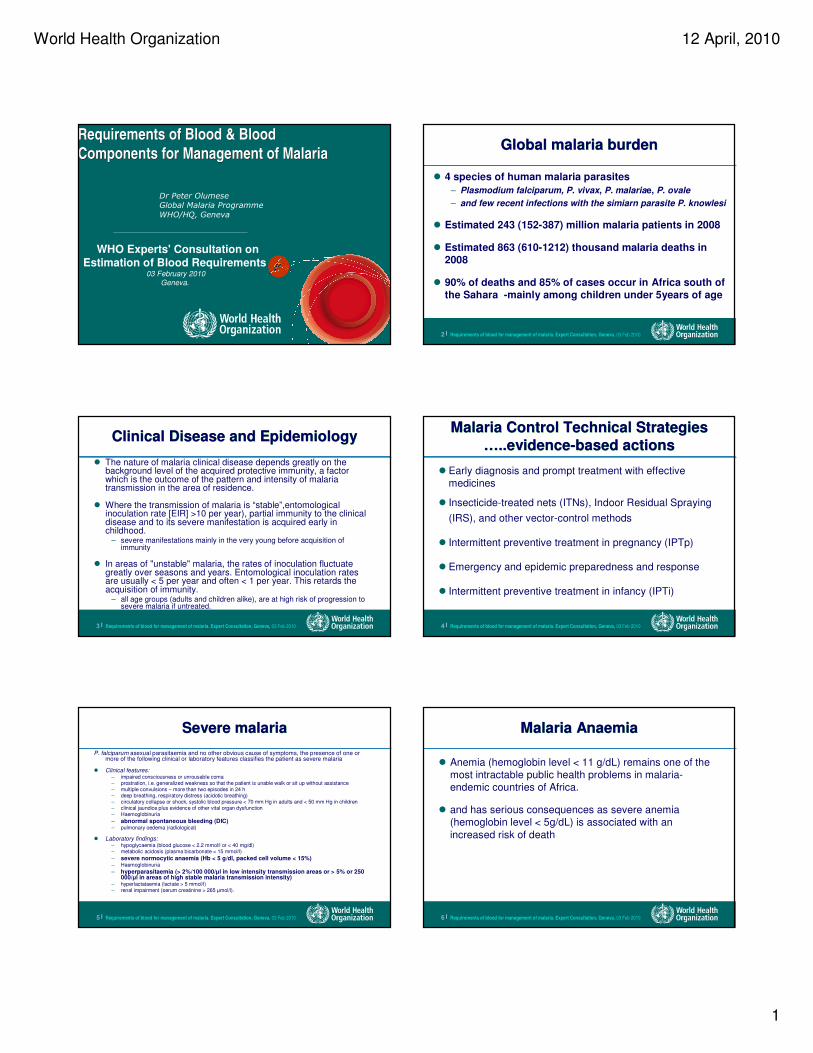
Global malaria burdenGlobal malaria burden
� 4 species of human malaria parasites
– Plasmodium falciparum, P. vivax, P. malariae, P. ovale
– and few recent infections with the simiarn parasite P. knowlesi
� Estimated 243 (152-387) million malaria patients in 2008
� Estimated 863 (610-1212) thousand malaria deaths in 2008
� 90% of deaths and 85% of cases occur in Africa south of the Sahara -mainly among children under 5years of age
Requirements of blood for management of malaria. Expert Consultation, Geneva, 03 Feb 20103 |
Clinical Disease and EpidemiologyClinical Disease and Epidemiology
� The nature of malaria clinical disease depends greatly on the background level of the acquired protective immunity, a factor which is the outcome of the pattern and intensity of malaria transmission in the area of residence.
� Where the transmission of malaria is “stable”,entomological inoculation rate [EIR] >10 per year), partial immunity to the clinical disease and to its severe manifestation is acquired early in childhood.
– severe manifestations mainly in the very young before acquisition of immunity
� In areas of "unstable" malaria, the rates of inoculation fluctuate greatly over seasons and years. Entomological inoculation rates are usually < 5 per year and often < 1 per year. This retards the acquisition of immunity.
– all age groups (adults and children alike), are at high risk of progression to severe malaria if untreated.
Requirements of blood for management of malaria. Expert Consultation, Geneva, 03 Feb 20104 |
Malaria Control Technical Strategies
…..evidence-based actions
Malaria Control Technical Strategies
…..evidence-based actions
� Early diagnosis and prompt treatment with effective
medicines
� Insecticide-treated nets (ITNs), Indoor Residual Spraying
(IRS), and other vector-control methods
� Intermittent preventive treatment in pregnancy (IPTp)
� Emergency and epidemic preparedness and response
� Intermittent preventive treatment in infancy (IPTi)
Requirements of blood for management of malaria. Expert Consultation, Geneva, 03 Feb 20105 |
Severe malariaSevere malaria
P. falciparum asexual parasitaemia and no other obvious cause of symptoms, the presence of one or more of the following clinical or laboratory features classifies the patient as severe malaria
� Clinical features: – impaired consciousness or unrousable coma– prostration, i.e. generalized weakness so that the patient is unable walk or sit up without assistance – multiple convulsions – more than two episodes in 24 h– deep breathing, respiratory distress (acidotic breathing)– circulatory collapse or shock, systolic blood pressure < 70 mm Hg in adults and < 50 mm Hg in children– clinical jaundice plus evidence of other vital organ dysfunction– Haemoglobinuria
– abnormal spontaneous bleeding (DIC)– pulmonary oedema (radiological)
� Laboratory findings:– hypoglycaemia (blood glucose < 2.2 mmol/l or < 40 mg/dl) – metabolic acidosis (plasma bicarbonate < 15 mmol/l)
– severe normocytic anaemia (Hb < 5 g/dl, packed cell volume < 15%)– Haemoglobinuria
– hyperparasitaemia (> 2%/100 000/µl in low intensity transmission areas or > 5% or 250 000/µl in areas of high stable malaria transmission intensity)
– hyperlactataemia (lactate > 5 mmol/l)– renal impairment (serum creatinine > 265 µmol/l).
Requirements of blood for management of malaria. Expert Consultation, Geneva, 03 Feb 20106 |
Malaria AnaemiaMalaria Anaemia
� Anemia (hemoglobin level < 11 g/dL) remains one of the
most intractable public health problems in malaria-
endemic countries of Africa.
� and has serious consequences as severe anemia
(hemoglobin level < 5g/dL) is associated with an
increased risk of death
World Health Organization 12 April, 2010
2
Requirements of blood for management of malaria. Expert Consultation, Geneva, 03 Feb 20107 |
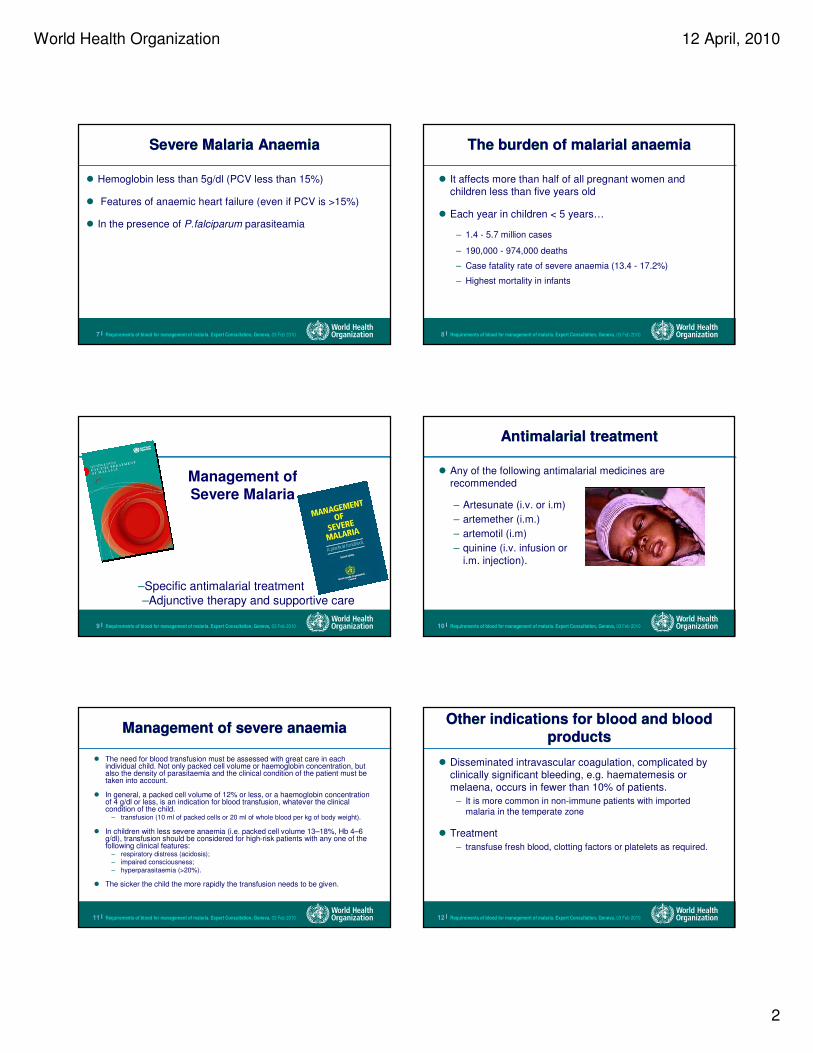
Severe Malaria AnaemiaSevere Malaria Anaemia
� Hemoglobin less than 5g/dl (PCV less than 15%)
� Features of anaemic heart failure (even if PCV is >15%)
� In the presence of P.falciparum parasiteamia
Requirements of blood for management of malaria. Expert Consultation, Geneva, 03 Feb 20108 |
The burden of malarial anaemiaThe burden of malarial anaemia
� It affects more than half of all pregnant women and
children less than five years old
� Each year in children < 5 years…
– 1.4 - 5.7 million cases
– 190,000 - 974,000 deaths
– Case fatality rate of severe anaemia (13.4 - 17.2%)
– Highest mortality in infants
Requirements of blood for management of malaria. Expert Consultation, Geneva, 03 Feb 20109 |
Management of
Severe Malaria
–Specific antimalarial treatment
–Adjunctive therapy and supportive care
Requirements of blood for management of malaria. Expert Consultation, Geneva, 03 Feb 201010 |
Antimalarial treatment Antimalarial treatment
� Any of the following antimalarial medicines are
recommended
3
– Artesunate (i.v. or i.m)
– artemether (i.m.)
– artemotil (i.m)
– quinine (i.v. infusion or
i.m. injection).
Requirements of blood for management of malaria. Expert Consultation, Geneva, 03 Feb 201011 |
Management of severe anaemiaManagement of severe anaemia
� The need for blood transfusion must be assessed with great care in each individual child. Not only packed cell volume or haemoglobin concentration, but also the density of parasitaemia and the clinical condition of the patient must be taken into account.
� In general, a packed cell volume of 12% or less, or a haemoglobin concentration of 4 g/dl or less, is an indication for blood transfusion, whatever the clinical condition of the child.
– transfusion (10 ml of packed cells or 20 ml of whole blood per kg of body weight).
� In children with less severe anaemia (i.e. packed cell volume 13–18%, Hb 4–6 g/dl), transfusion should be considered for high-risk patients with any one of the following clinical features:
– respiratory distress (acidosis); – impaired consciousness;
– hyperparasitaemia (>20%).
� The sicker the child the more rapidly the transfusion needs to be given.
Requirements of blood for management of malaria. Expert Consultation, Geneva, 03 Feb 201012 |
Other indications for blood and blood
products
Other indications for blood and blood
products
� Disseminated intravascular coagulation, complicated by
clinically significant bleeding, e.g. haematemesis or
melaena, occurs in fewer than 10% of patients.
– It is more common in non-immune patients with imported malaria in the temperate zone
� Treatment
– transfuse fresh blood, clotting factors or platelets as required.
World Health Organization 12 April, 2010
3
Requirements of blood for management of malaria. Expert Consultation, Geneva, 03 Feb 201013 |
Other indications for blood and blood
products
Other indications for blood and blood
products
� Hperparasitaemia– If parasitaemia exceeds 10% in severely ill patients, especially
those deteriorating after optimal chemotherapy, exchange transfusion with screened blood should be considered where facilities are available
– Exchange blood transfusion
– There have been many anecdotal reports and several series claiming benefit for exchange blood transfusion in severe malaria but no comparative trials.
– There is no consensus on whether it reduces mortality or how it might work, so there is no global recommendation on its us
Requirements of blood for management of malaria. Expert Consultation, Geneva, 03 Feb 201014 |
Challenges of blood transfusionChallenges of blood transfusion
� Wastage
– Non availability of paediatric blood bags
– Use of whole blood in place of packed cells or other specific blood components (e.g platelets)
– Unnecessary transfusions
• Inadequate diagnostics facilities
• Blood storage facilities –proper blood bank facilities
15 |
Impact of the scale up malaria control measures in Africa
Impact of the scale up malaria control measures in Africa
SME/MP/WHO Surveillance, 2008
12 April 2010
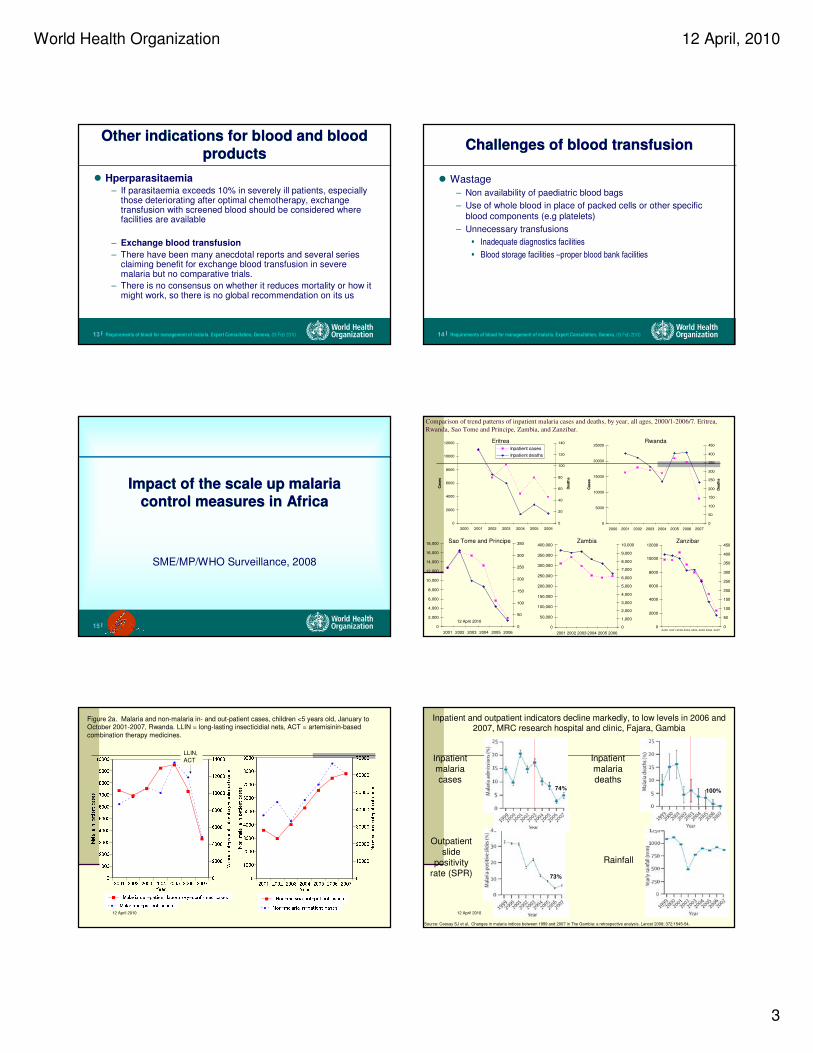
Comparison of trend patterns of inpatient malaria cases and deaths, by year, all ages, 2000/1-2006/7. Eritrea,
Rwanda, Sao Tome and Principe, Zambia, and Zanzibar.
Rwanda
0
2000
4000
6000
8000
10000
12000
2000 2001 2002 2003 2004 2005 2006
Cases
0
20
40
60
80
100
120
140
Death
s
Inpatient cases
Inpatient deaths
Eritrea
Sao Tome and Principe Zambia Zanzibar
0
5000
10000
15000
20000
25000
2000 2001 2002 2003 2004 2005 2006 2007
Cases
0
50
100
150
200
250
300
350
400
450
Death
s
0
2,000
4,000
6,000
8,000
10,000
12,000
14,000
16,000
18,000
2001 2002 2003 2004 2005 2006
0
50
100
150
200
250
300
350
0
50,000
100,000
150,000
200,000
250,000
300,000
350,000
400,000
2001 2002 2003 2004 2005 2006
0
1,000
2,000
3,000
4,000
5,000
6,000
7,000
8,000
9,000
10,000
0
2000
4000
6000
8000
10000
12000
2000 2001 2002 2003 2004 2005 2006 20070
50
100
150
200
250
300
350
400
450
12 April 2010
Figure 2a. Malaria and non-malaria in- and out-patient cases, children <5 years old, January to October 2001-2007, Rwanda. LLIN = long-lasting insecticidial nets, ACT = artemisinin-based
combination therapy medicines.
�
�
�
�
�
�
�
�
�
�
��
�
�2001 2002 2003 2004 2005 2006 200701000200030004000500060007000800090001000002000400060008000100001200014000
Malaria in-patient cases Malaria out-patient laboratory-confirmed cases
Year� Malaria in-patient cases� Malaria out-patient laboratory-confirmed cases
�
�
�
�
�
�
�
�
�
�
�
�
�
�
2001 2002 2003 2004 2005 2006 20070100020003000400050006000700080009000010000200003000040000500006000070000
Non-malaria in-patient cases Non-malaria out-patient casesYear� Non-malaria in-patient cases� Non-malaria out-patient cases
LLIN,
ACT
12 April 2010
Inpatient malaria cases
Inpatient malaria deaths
Outpatient slide
positivity rate (SPR)
Rainfall
Inpatient and outpatient indicators decline markedly, to low levels in 2006 and 2007, MRC research hospital and clinic, Fajara, Gambia
Source: Ceesay SJ et al. Changes in malaria indices between 1999 and 2007 in The Gambia: a retrospective analysis. Lancet 2008; 372:1545-54.
74% 100%
73%
World Health Organization 12 April, 2010
4
Requirements of blood for management of malaria. Expert Consultation, Geneva, 03 Feb 201019 |
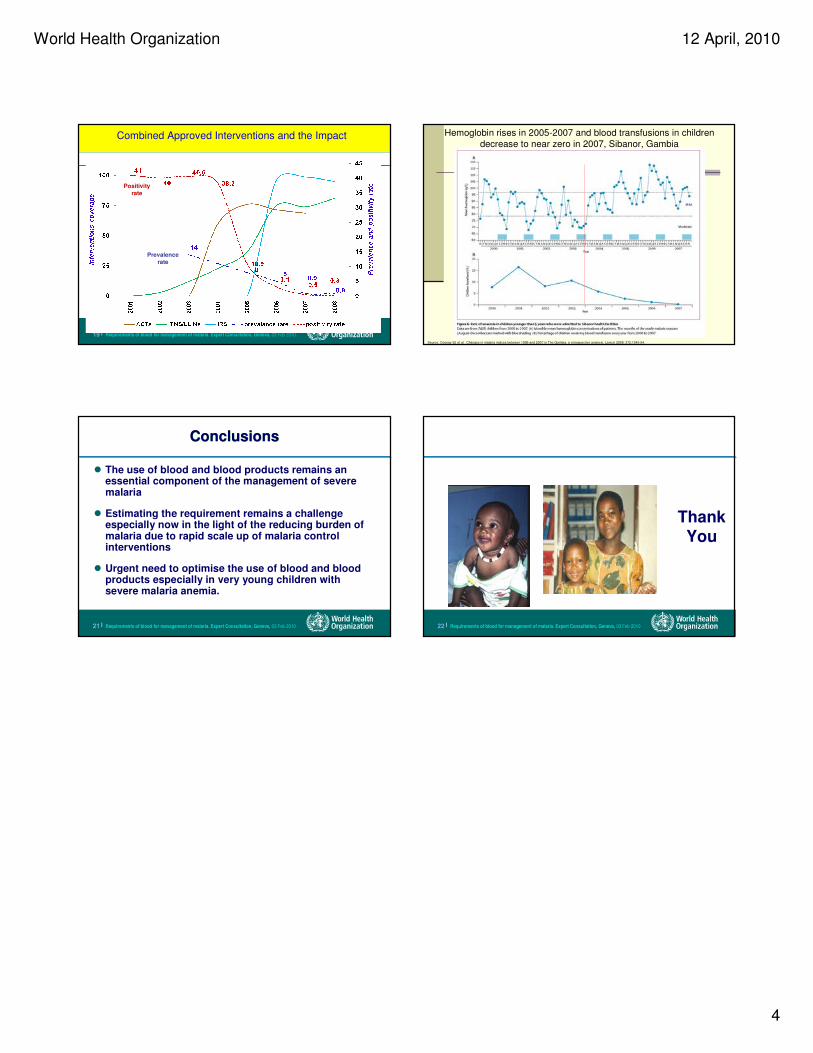
Combined Approved Interventions and the ImpactCombined Approved Interventions and the Impact
Positivity
rate
Prevalence
rate
12 April 2010
Source: Ceesay SJ et al. Changes in malaria indices between 1999 and 2007 in The Gambia: a retrospective analysis. Lancet 2008; 372:1545-54.
Hemoglobin rises in 2005-2007 and blood transfusions in children
decrease to near zero in 2007, Sibanor, Gambia
Requirements of blood for management of malaria. Expert Consultation, Geneva, 03 Feb 201021 |
ConclusionsConclusions
� The use of blood and blood products remains an essential component of the management of severe malaria
� Estimating the requirement remains a challenge especially now in the light of the reducing burden of malaria due to rapid scale up of malaria control interventions
� Urgent need to optimise the use of blood and blood products especially in very young children with severe malaria anemia.
Requirements of blood for management of malaria. Expert Consultation, Geneva, 03 Feb 201022 |
Thank You
World Health Organization 12 April, 2010
1
WHO Experts' Consultation on Estimation of Blood RequirementsGeneva Feb 3-5, 20101 |
Requirements of blood &
blood components in
maternity care
Matthews MathaiDepartment of Making Pregnancy Safer
Requirements of blood &
blood components in
maternity care
Matthews MathaiDepartment of Making Pregnancy Safer
WHO Experts' Consultation on Estimation of Blood RequirementsGeneva Feb 3-5, 20102 |
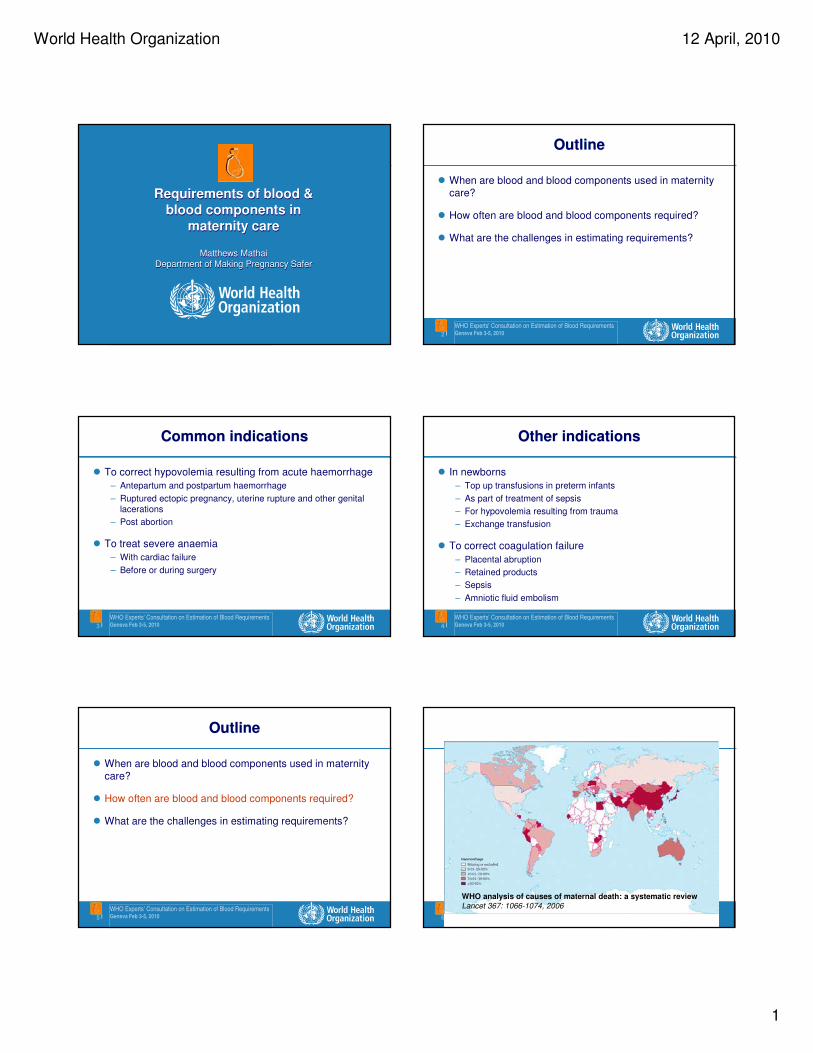
OutlineOutline
� When are blood and blood components used in maternity
care?
� How often are blood and blood components required?
� What are the challenges in estimating requirements?
WHO Experts' Consultation on Estimation of Blood RequirementsGeneva Feb 3-5, 20103 |
Common indicationsCommon indications
� To correct hypovolemia resulting from acute haemorrhage
– Antepartum and postpartum haemorrhage
– Ruptured ectopic pregnancy, uterine rupture and other genital lacerations
– Post abortion
� To treat severe anaemia
– With cardiac failure
– Before or during surgery
WHO Experts' Consultation on Estimation of Blood RequirementsGeneva Feb 3-5, 20104 |
Other indicationsOther indications
� In newborns
– Top up transfusions in preterm infants
– As part of treatment of sepsis
– For hypovolemia resulting from trauma
– Exchange transfusion
� To correct coagulation failure
– Placental abruption
– Retained products
– Sepsis
– Amniotic fluid embolism
WHO Experts' Consultation on Estimation of Blood RequirementsGeneva Feb 3-5, 20105 |
OutlineOutline
� When are blood and blood components used in maternity
care?
� How often are blood and blood components required?
� What are the challenges in estimating requirements?
WHO Experts' Consultation on Estimation of Blood RequirementsGeneva Feb 3-5, 20106 |
WHO analysis of causes of maternal death: a systematic review
Lancet 367: 1066-1074, 2006
World Health Organization 12 April, 2010
2
WHO Experts' Consultation on Estimation of Blood RequirementsGeneva Feb 3-5, 20107 |
WH
O a
na
lys
is o
f c
au
se
s o
f m
ate
rna
l d
ea
th:
a s
ys
tem
ati
c r
ev
iew
La
nce
t 3
67
: 1
06
6-1
07
4, 2
00
6
WHO Experts' Consultation on Estimation of Blood RequirementsGeneva Feb 3-5, 20108 |
We need to have a
strategic approach to achieve our
goals
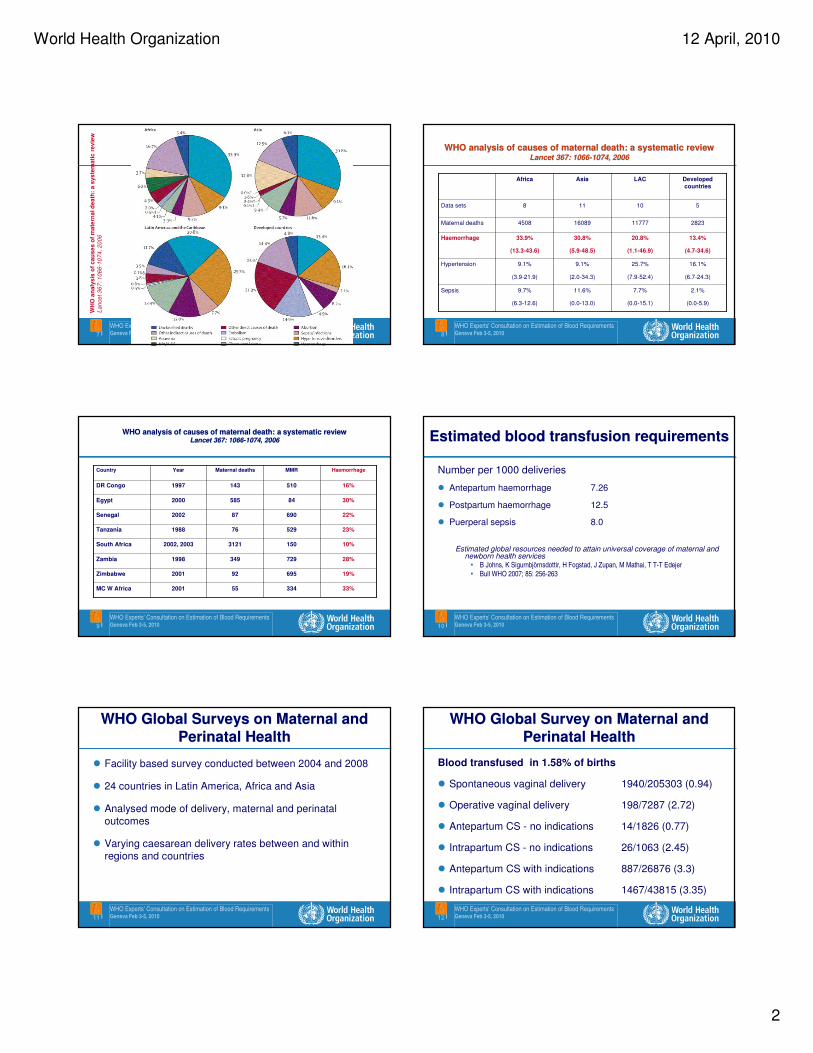
WHO analysis of causes of maternal death: a systematic reviewLancet 367: 1066-1074, 2006
WHO analysis of causes of maternal death: a systematic reviewLancet 367: 1066-1074, 2006
2.1%
(0.0-5.9)
7.7%
(0.0-15.1)
11.6%
(0.0-13.0)
9.7%
(6.3-12.6)
Sepsis
16.1%
(6.7-24.3)
25.7%
(7.9-52.4)
9.1%
(2.0-34.3)
9.1%
(3.9-21.9)
Hypertension
13.4%
(4.7-34.6)
20.8%
(1.1-46.9)
30.8%
(5.9-48.5)
33.9%
(13.3-43.6)
Haemorrhage
282311777160894508Maternal deaths
510118Data sets
Developed
countries
LACAsiaAfrica
WHO Experts' Consultation on Estimation of Blood RequirementsGeneva Feb 3-5, 20109 |
WHO analysis of causes of maternal death: a systematic reviewLancet 367: 1066-1074, 2006
WHO analysis of causes of maternal death: a systematic reviewLancet 367: 1066-1074, 2006
33%334552001MC W Africa
19%695922001Zimbabwe
28%7293491998Zambia
10%15031212002, 2003South Africa
23%529761988Tanzania
22%690872002Senegal
30%845852000Egypt
16%5101431997DR Congo
HaemorrhageMMRMaternal deathsYearCountry
WHO Experts' Consultation on Estimation of Blood RequirementsGeneva Feb 3-5, 201010 |
Estimated blood transfusion requirements Estimated blood transfusion requirements
Number per 1000 deliveries
� Antepartum haemorrhage 7.26
� Postpartum haemorrhage 12.5
� Puerperal sepsis 8.0
Estimated global resources needed to attain universal coverage of maternal and newborn health services
• B Johns, K Sigurnbjörnsdottir, H Fogstad, J Zupan, M Mathai, T T-T Edejer
• Bull WHO 2007; 85: 256-263
WHO Experts' Consultation on Estimation of Blood RequirementsGeneva Feb 3-5, 201011 |
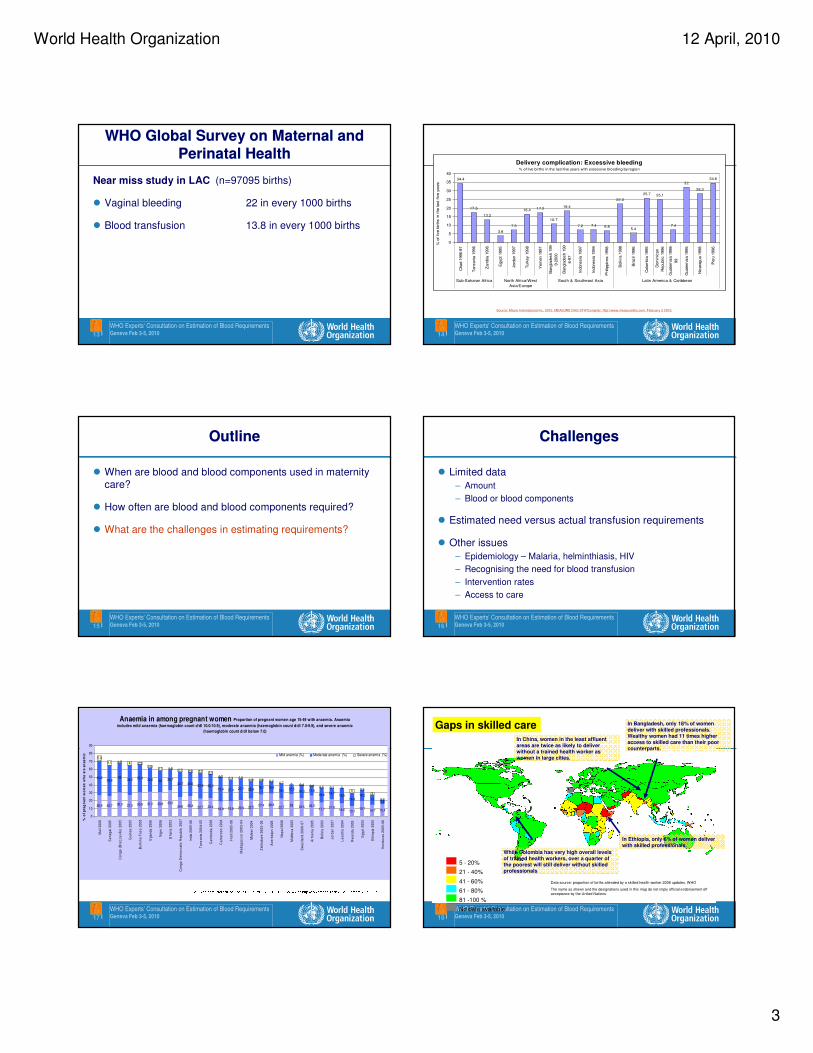
WHO Global Surveys on Maternal and
Perinatal Health
WHO Global Surveys on Maternal and
Perinatal Health
� Facility based survey conducted between 2004 and 2008
� 24 countries in Latin America, Africa and Asia
� Analysed mode of delivery, maternal and perinatal
outcomes
� Varying caesarean delivery rates between and within
regions and countries
WHO Experts' Consultation on Estimation of Blood RequirementsGeneva Feb 3-5, 201012 |
WHO Global Survey on Maternal and
Perinatal Health
WHO Global Survey on Maternal and
Perinatal Health
Blood transfused in 1.58% of births
� Spontaneous vaginal delivery 1940/205303 (0.94)
� Operative vaginal delivery 198/7287 (2.72)
� Antepartum CS - no indications 14/1826 (0.77)
� Intrapartum CS - no indications 26/1063 (2.45)
� Antepartum CS with indications 887/26876 (3.3)
� Intrapartum CS with indications 1467/43815 (3.35)
World Health Organization 12 April, 2010
3
WHO Experts' Consultation on Estimation of Blood RequirementsGeneva Feb 3-5, 201013 |
WHO Global Survey on Maternal and
Perinatal Health
WHO Global Survey on Maternal and
Perinatal Health
Near miss study in LAC (n=97095 births)
� Vaginal bleeding 22 in every 1000 births
� Blood transfusion 13.8 in every 1000 births
WHO Experts' Consultation on Estimation of Blood RequirementsGeneva Feb 3-5, 201014 |
Source: Macro International Inc, 2010. MEASURE DHS STATcompiler. http://www.measuredhs.com, February 2 2010.
Delivery complication: Excessive bleeding% of live births in the last five years with excessive bleeding by region
34.4
17.5
13.2
3.8
7.3
16.4 17.2
10.7
18.4
7.2 7.4 6.8
22.3
5.4
25.7 25.1
7.4
32
28.3
34.6
0
5
10
15
20
25
30
35
40
Chad 1
996-9
7
Tanzania
1996
Zam
bia
1996
Egypt
1995
Jord
an 1
997
Turk
ey 1
998
Yem
en 1
997
Bangla
desh 1
99
9-2
000
Bangla
desh 1
99
6-9
7
Indonesia
1997
Indonesia
1994
Phili
ppin
es 1
998
Bolivia
1998
Bra
zil
1996
Colo
mbia
1995
Dom
inic
an
Republic 1
996
Guate
mala
1998-
99
Guate
mala
1995
Nic
ara
gua 1
998
Peru
1996
Sub-Saharan Africa North Africa/West
Asia/Europe
South & Southeast Asia Latin America & Caribbean
% o
f live b
irth
s in t
he last
five y
ears
WHO Experts' Consultation on Estimation of Blood RequirementsGeneva Feb 3-5, 201015 |
OutlineOutline
� When are blood and blood components used in maternity
care?
� How often are blood and blood components required?
� What are the challenges in estimating requirements?
WHO Experts' Consultation on Estimation of Blood RequirementsGeneva Feb 3-5, 201016 |
ChallengesChallenges
� Limited data
– Amount
– Blood or blood components
� Estimated need versus actual transfusion requirements
� Other issues
– Epidemiology – Malaria, helminthiasis, HIV
– Recognising the need for blood transfusion
– Intervention rates
– Access to care
WHO Experts' Consultation on Estimation of Blood RequirementsGeneva Feb 3-5, 201017 |
Anaemia in among pregnant women Proportion of pregnant women age 15-49 with anaemia. Anaemia
includes mild anaemia (haemoglobin count d/dl 10.0-10.9), moderate anaemia (haemoglobin count d/dl 7.0-9.9), and severe anaemic
(haemoglobin count d/dl below 7.0)
26.9 25.7 30.3 27.3 30.6 31.2 30.8 33.224.6 25.8 22.7 23.4
18.8 19.6 20.9 22.527.4 28.8
22.728 23.5 26.5
17.721.8
16.5 13.119.7
14.7 15.4
44.239.8
3838.2 35.4 30.6 28 26.7
32.7 30.632.8 30.3
31.4 27.4 27.7 22.918.1 15.6
19.1 12.516.3 11.6
18.8 14.719.5
16.914.2
135.8
5.9
5.1 1.5 4 2.32.6
2.7 1.2 2.7 2.2 2.7 3.40.7 3.3 1.5
1.9 1.5 0.20.7 0 0.4 0.6 0.5 0.1 0
5 0.33
0.2
0
10
20
30
40
50
60
70
80
90
Ma
li 2
00
6
Se
ne
ga
l 2
00
5
Co
ng
o (
Bra
zz
av
ille
) 2
00
5
Gu
ine
a 2
00
5
Bu
rkin
a F
as
o 2
00
3
Ug
an
da
20
06
Nig
er
20
06
Gh
an
a 2
00
3
Co
ng
o D
em
oc
ratic
Re
pu
blic
20
07
Ind
ia 2
00
5-0
6
Ta
nz
an
ia 2
00
4-0
5
Ca
mb
od
ia 2
00
5
Ca
me
roo
n 2
00
4
Ha
iti 2
00
5-0
6
Ma
da
ga
sc
ar
20
03
-04
Ma
law
i 2
00
4
Zim
ba
bw
e 2
00
5-0
6
Az
erb
aija
n 2
00
6
Ne
pa
l 2
00
6
Mo
ldo
va
20
05
Sw
az
ilan
d 2
00
6-0
7
Arm
en
ia 2
00
5
Bo
livia
20
03
Jo
rda
n 2
00
7
Le
so
tho
20
04
Rw
an
da
20
05
Eg
yp
t 2
00
5
Eth
iop
ia 2
00
5
Ho
nd
ura
s 2
00
5-0
6 %
of
pre
gn
an
t w
om
en
wh
o a
re a
na
em
ic Mild anemia (%) Moderate anemia (%) Severe anemia (%)
WHO Experts' Consultation on Estimation of Blood RequirementsGeneva Feb 3-5, 201018 |
5 - 20%
81 -100 %
41 - 60%
No data available
21 - 40%
61 - 80%
Data source: proportion of births attended by a skilled health worker 2008 updates, WHO
The name as shown and the designations used in this map do not imply official endorsement off
acceptance by the United Nations.
Gaps in skilled care
In Ethiopia, only 6% of women deliver with skilled professionals.
In Bangladesh, only 18% of women deliver with skilled professionals. Wealthy women had 11 times higher access to skilled care than their poor counterparts.
In China, women in the least affluent areas are twice as likely to deliver without a trained health worker as women in large cities.
While Colombia has very high overall levels of trained health workers, over a quarter of the poorest will still deliver without skilled professionals
World Health Organization 12 April, 2010
4
WHO Experts' Consultation on Estimation of Blood RequirementsGeneva Feb 3-5, 201019 |
Less than 5 %
5-15 %
More than 15 %
No data available
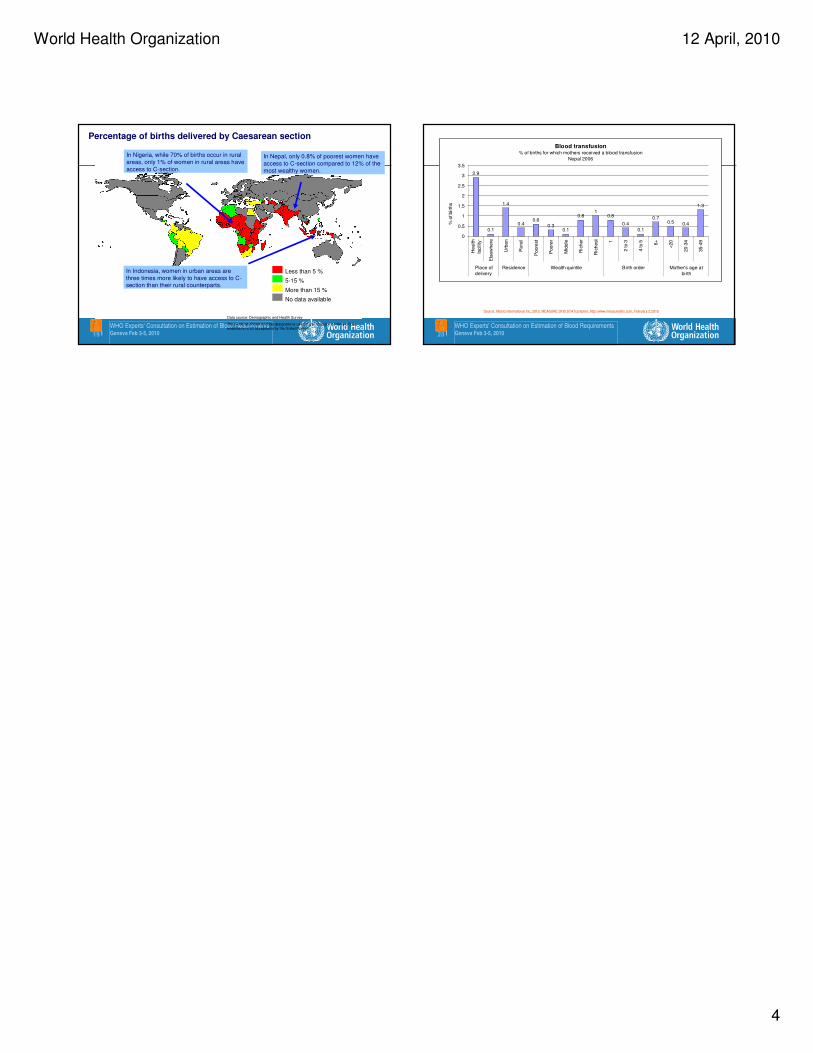
Percentage of births delivered by Caesarean section
In Nepal, only 0.8% of poorest women have
access to C-section compared to 12% of the
most wealthy women.
In Indonesia, women in urban areas are
three times more likely to have access to C-section than their rural counterparts.
In Nigeria, while 70% of births occur in rural
areas, only 1% of women in rural areas have
access to C-section.
Data source: Demographic and Health Survey
The name as shown and the designations used in this map do not imply official endorsement off acceptance by the United Nations. WHO Experts' Consultation on Estimation of Blood Requirements
Geneva Feb 3-5, 201020 |
Source: Macro International Inc, 2010. MEASURE DHS STATcompiler. http://www.measuredhs.com, February 2 2010.
Blood transfusion% of births for which mothers received a blood transfusion
Nepal 2006
2.9
0.1
1.4
0.40.6
0.30.1
0.81
0.8
0.4
0.1
0.70.5 0.4
1.3
0
0.5
1
1.5
2
2.5
3
3.5
Health
facility
Els
ew
here
Urb
an
Rura
l
Poore
st
Poore
r
Mid
dle
Ric
her
Ric
hest 1
2 to 3
4 to 5 6+
<20
20-3
4
35-4
9
Place of
delivery
Residence Wealth quintile Birth order Mother's age at
birth
% o
f birth
s
1
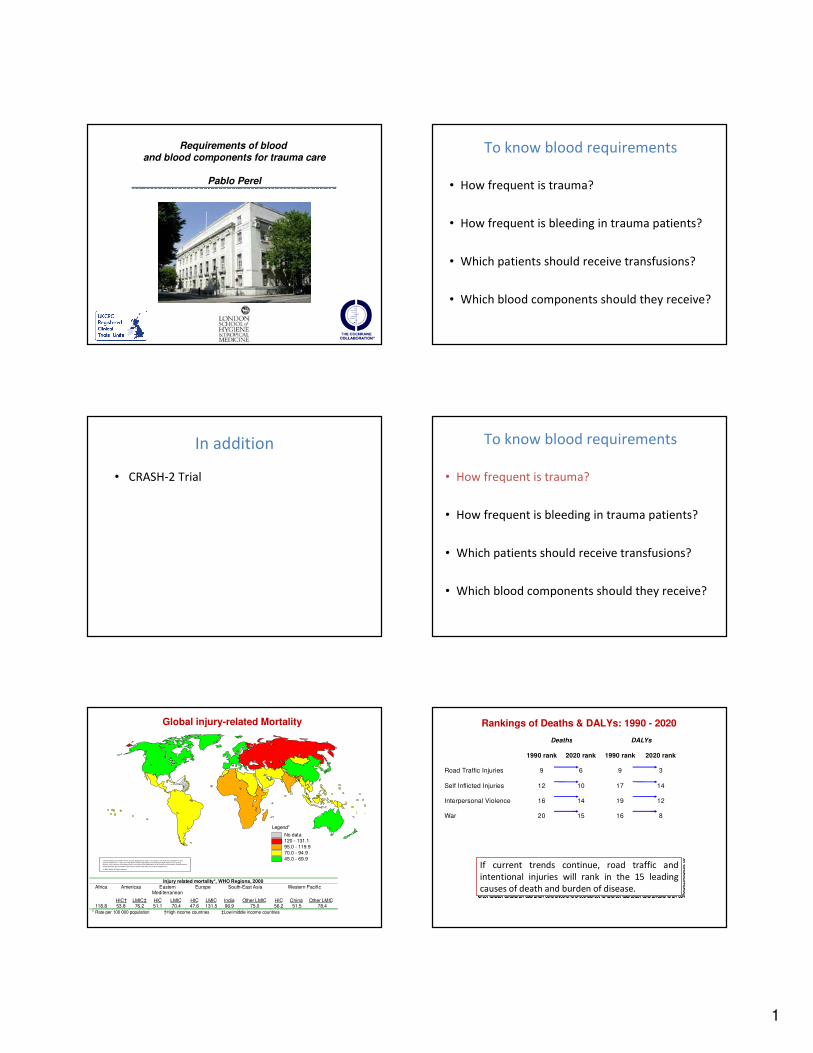
Requirements of blood
and blood components for trauma care
Pablo Perel
To know blood requirements
• How frequent is trauma?
• How frequent is bleeding in trauma patients?
• Which patients should receive transfusions?
• Which blood components should they receive?
In addition
• CRASH-2 Trial • How frequent is trauma?
• How frequent is bleeding in trauma patients?
• Which patients should receive transfusions?
• Which blood components should they receive?
To know blood requirements
Injury related mortality*, WHO Regions, 2000Africa Americas Eastern
MediterraneanEurope South-East Asia Western Pacific
HIC† LMIC‡ HIC LMIC HIC LMIC India Other LMIC HIC China Other LMIC118.8 53.8 76.2 51.1 70.4 47.6 131.5 96.9 75.0 56.2 51.5 78.4
* Rate per 100 000 population †High income countries ‡Low/middle income countries
Global injury-related Mortality
The boundaries and names shown and the designations used on this map do not imply the expression of any
opinion whatsoever on the part of the World Health Organization concerning the legal status of any country,
territory, city or area or of its authorities, or concerning the delimitation of its frontiers or boundaries. Dotted lines on
maps repre sent approximate border lines for which there may not yet be full agreement.
© WHO 2002. All rights re served
No data120 - 131.1
95.0 - 119.9
70.0 - 94.9
45.0 - 69.9
Legend*
Deaths DALYs
1990 rank 2020 rank 1990 rank 2020 rank
Road Traffic Injuries 9 6 9 3
Self Inflicted Injuries 12 10 17 14
Interpersonal Violence 16 14 19 12
War 20 15 16 8
If current trends continue, road traffic and
intentional injuries will rank in the 15 leading
causes of death and burden of disease.
If current trends continue, road traffic and
intentional injuries will rank in the 15 leading
causes of death and burden of disease.
Rankings of Deaths & DALYs: 1990 - 2020
2
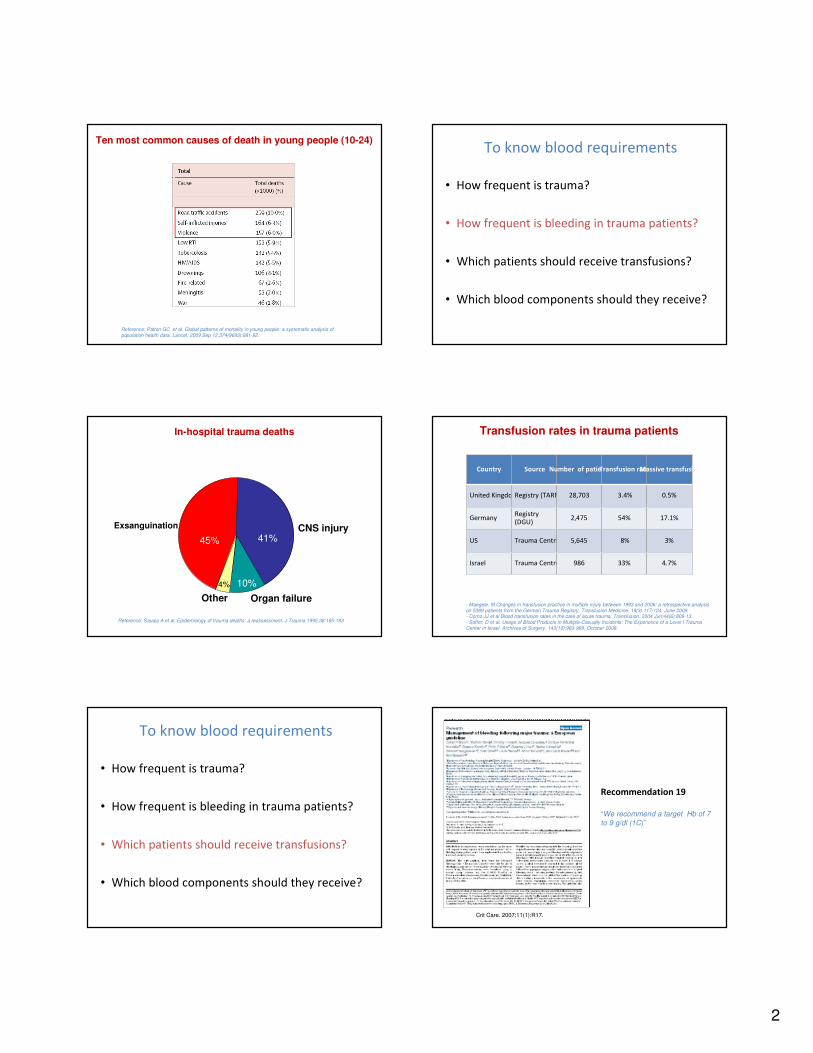
Reference: Patton GC, et al. Global patterns of mortality in young people: a systematic analysis of population health data. Lancet. 2009 Sep 12;374(9693):881-92.
Ten most common causes of death in young people (10-24)
• How frequent is trauma?
• How frequent is bleeding in trauma patients?
• Which patients should receive transfusions?
• Which blood components should they receive?
To know blood requirements
Exsanguination CNS injury
Organ failureOther
45% 41%
10%4%
Reference: Sauaia A et al. Epidemiology of trauma deaths: a reassessment. J Trauma 1995;38:185-193
In-hospital trauma deaths Transfusion rates in trauma patients
Country Source Number of patientsTransfusion rateMassive transfusion
United Kingdom Registry (TARN) 28,703 3.4% 0.5%
GermanyRegistry
(DGU)2,475 54% 17.1%
US Trauma Centre 5,645 8% 3%
Israel Trauma Centre 986 33% 4.7%
- Maegele, M Changes in transfusion practice in multiple injury between 1993 and 2006: a retrospective analysis on 5389 patients from the German Trauma Registry. Transfusion Medicine. 19(3):117-124, June 2009.- Como JJ et al Blood transfusion rates in the care of acute trauma. Transfusion. 2004 Jun;44(6):809-13.- Soffer, D et al. Usage of Blood Products in Multiple-Casualty Incidents: The Experience of a Level I Trauma Center in Israel. Archives of Surgery. 143(10):983-989, October 2008.
• How frequent is trauma?
• How frequent is bleeding in trauma patients?
• Which patients should receive transfusions?
• Which blood components should they receive?
To know blood requirements
Recommendation 19
“We recommend a target Hb of 7
to 9 g/dl (1C)”
Crit Care. 2007;11(1):R17.
3
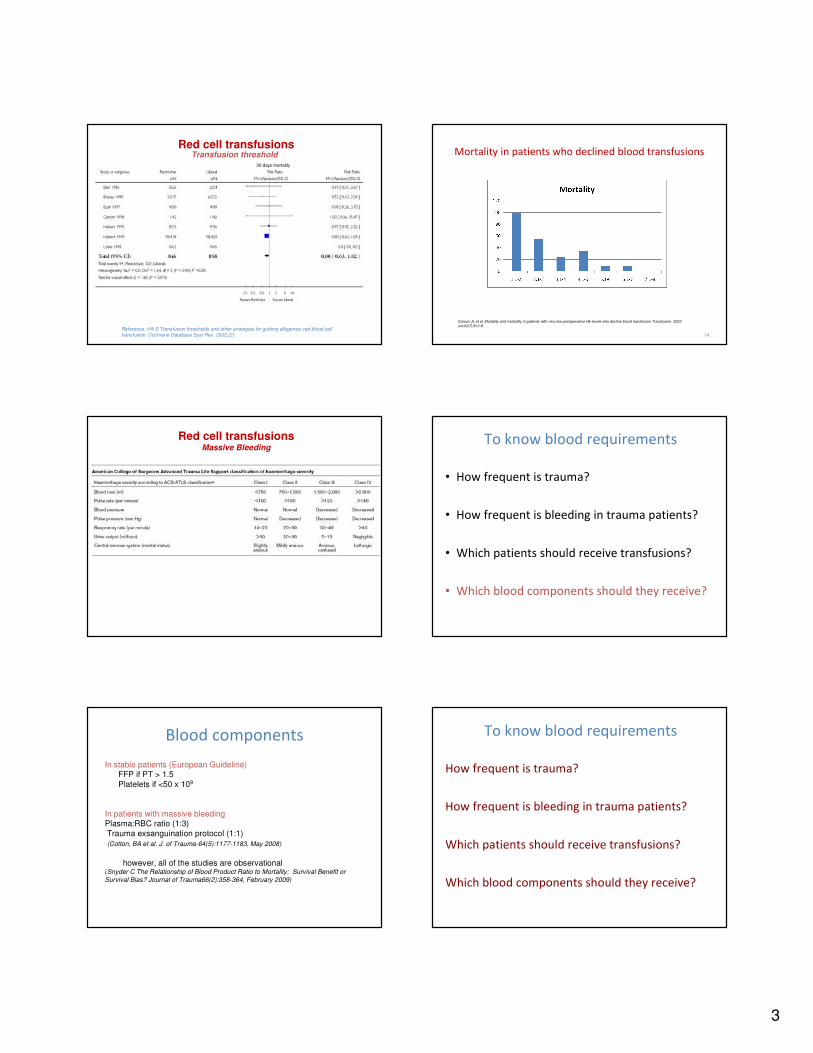
Reference: Hill S Transfusion thresholds and other strategies for guiding allogeneic red blood cell transfusion. Cochrane Database Syst Rev. 2002;(2):
30 days mortality
Transfusion threshold Red cell transfusions
Mortality in patients who declined blood transfusions
14
Carson JL et al. Mortality and morbidity in patients with very low postoperative Hb levels who decline blood transfusion Transfusion. 2002
Jul;42(7):812-8.
Red cell transfusionsMassive Bleeding
• How frequent is trauma?
• How frequent is bleeding in trauma patients?
• Which patients should receive transfusions?
• Which blood components should they receive?
To know blood requirements
Blood components
In stable patients (European Guideline)FFP if PT > 1.5
Platelets if <50 x 109
In patients with massive bleeding Plasma:RBC ratio (1:3)
Trauma exsanguination protocol (1:1)
(Cotton, BA et al. J. of Trauma-64(5):1177-1183, May 2008)
however, all of the studies are observational(Snyder C The Relationship of Blood Product Ratio to Mortality: Survival Benefit or
Survival Bias? Journal of Trauma66(2):358-364, February 2009)
How frequent is trauma?
How frequent is bleeding in trauma patients?
Which patients should receive transfusions?
Which blood components should they receive?
To know blood requirements
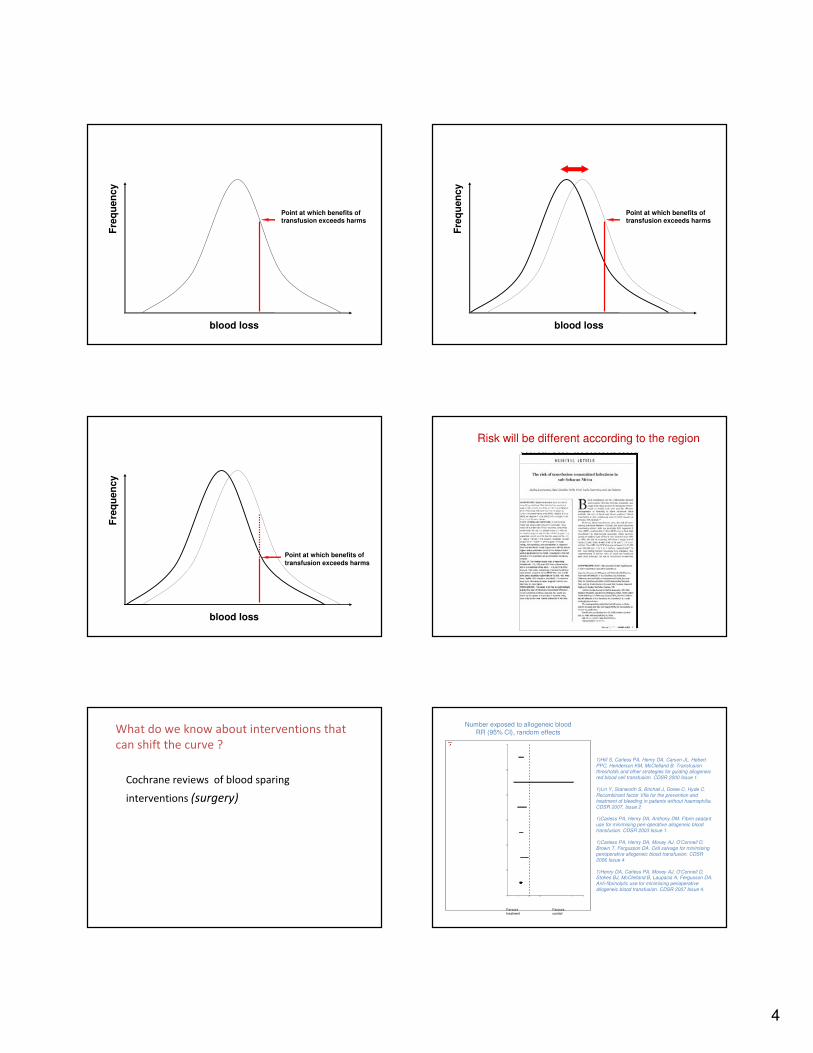
4
blood loss
Point at which benefits of transfusion exceeds harms
Fre
qu
en
cy
Point at which benefits of transfusion exceeds harms
blood loss
Fre
qu
en
cy
Point at which benefits of
transfusion exceeds harms
blood loss
Fre
qu
en
cy
Risk will be different according to the region
What do we know about interventions that
can shift the curve ?
Cochrane reviews of blood sparing
interventions (surgery)
1)Hill S, Carless PA, Henry DA, Carson JL, Hebert PPC, Henderson KM, McClelland B. Transfusion thresholds and other strategies for guiding allogeneic red blood cell transfusion. CDSR 2000 Issue 1.
1)Lin Y, Stanworth S, Birchall J, Doree C, Hyde C. Recombinant factor VIIa for the prevention and treatment of bleeding in patients without haemophilia. CDSR 2007, Issue 2
1)Carless PA, Henry DA, Anthony DM. Fibrin sealant use for minimising peri-operative allogeneic blood transfusion. CDSR 2003 Issue 1.
1)Carless PA, Henry DA, Moxey AJ, O'Connell D, Brown T, Fergusson DA. Cell salvage for minimising perioperative allogeneic blood transfusion. CDSR 2006 Issue 4
1)Henry DA, Carless PA, Moxey AJ, O'Connell D, Stokes BJ, McClelland B, Laupacis A, Fergusson DA. Anti-fibrinolytic use for minimising perioperative allogeneic blood transfusion. CDSR 2007 Issue 4.
Favours treatment
Favours control
Number exposed to allogeneic bloodRR (95% CI), random effects

5
0 0.4 0.8 1.2 1.6 2.0
Blood units
1.1 (0.6-1.6)TXA
Blood units saved
Effects of TXA
RR (95% CI)
Antifibrinolytic better Antifibrinolytic worse
0 0.4 0.8 1.2 1.6 2.0
TXA 0.67 (0.41-1.09)
Re-operation
Effects of TXA
TXA
RR (95% CI)
Antifibrinolytic better Antifibrinolytic worse
0 0.4 0.8 1.2 1.6 2.0
0.60 (0.32-1.12)
Mortality
Effects of TXA
Outcome Tranexamic Acid
RR 95% CI
Myocardial Infarction 0.96 0.48-1.90
Stroke 1.25 0.47-3.31
Deep venous thrombosis 0.77 0.37-1.61
Renal failure 0.73 0.16-3.32
No evidence of adverse effects for tranexamic acid
Adverse effects of tranexamic acid
• Bleeding is a leading cause of trauma death
• Antifibrinolytics reduce blood loss after surgery
• A simple intervention like TXA could prevent thousands
of trauma deaths and transfusion associated infections
A large randomised controlled trial among trauma
patients with significant haemorrhage, of the
effects of antifibrinolytic treatment on death and
transfusion requirement
Rationale for the CRASH-2 Participating countries
6
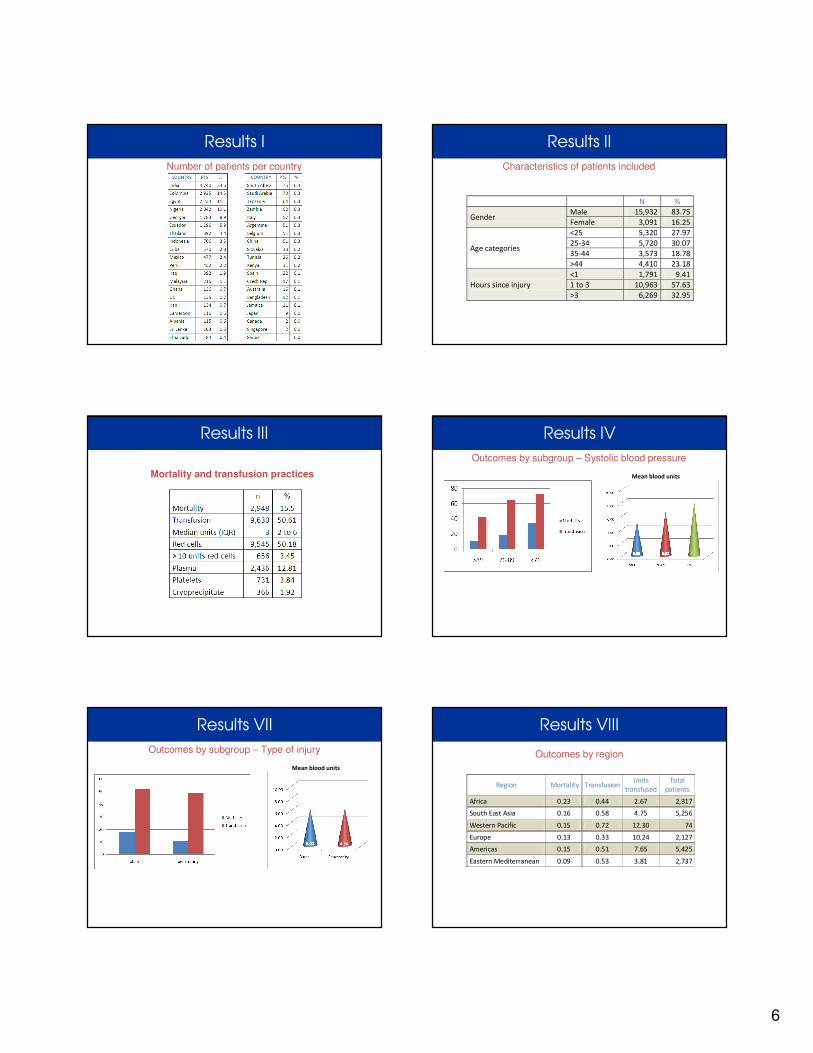
Number of patients per country
Results I Results II
Characteristics of patients included
N %
Gender Male 15,932 83.75
Female 3,091 16.25
Age categories
<25 5,320 27.97
25-34 5,720 30.07
35-44 3,573 18.78
>44 4,410 23.18
Hours since injury
<1 1,791 9.41
1 to 3 10,963 57.63
>3 6,269 32.95
Results III
Mortality and transfusion practices
Results IV
Outcomes by subgroup – Systolic blood pressure
Mean blood units
Results VII
Outcomes by subgroup – Type of injury
Mean blood units
Results VIII
Outcomes by region
Region Mortality Transfusion Units
transfused
Total
patients
Africa 0.23 0.44 2.67 2,317
South East Asia 0.16 0.58 4.75 5,256
Western Pacific 0.15 0.72 12.30 74
Europe 0.13 0.33 10.24 2,127
Americas 0.15 0.51 7.65 5,425
Eastern Mediterranean 0.09 0.53 3.81 2,737
7
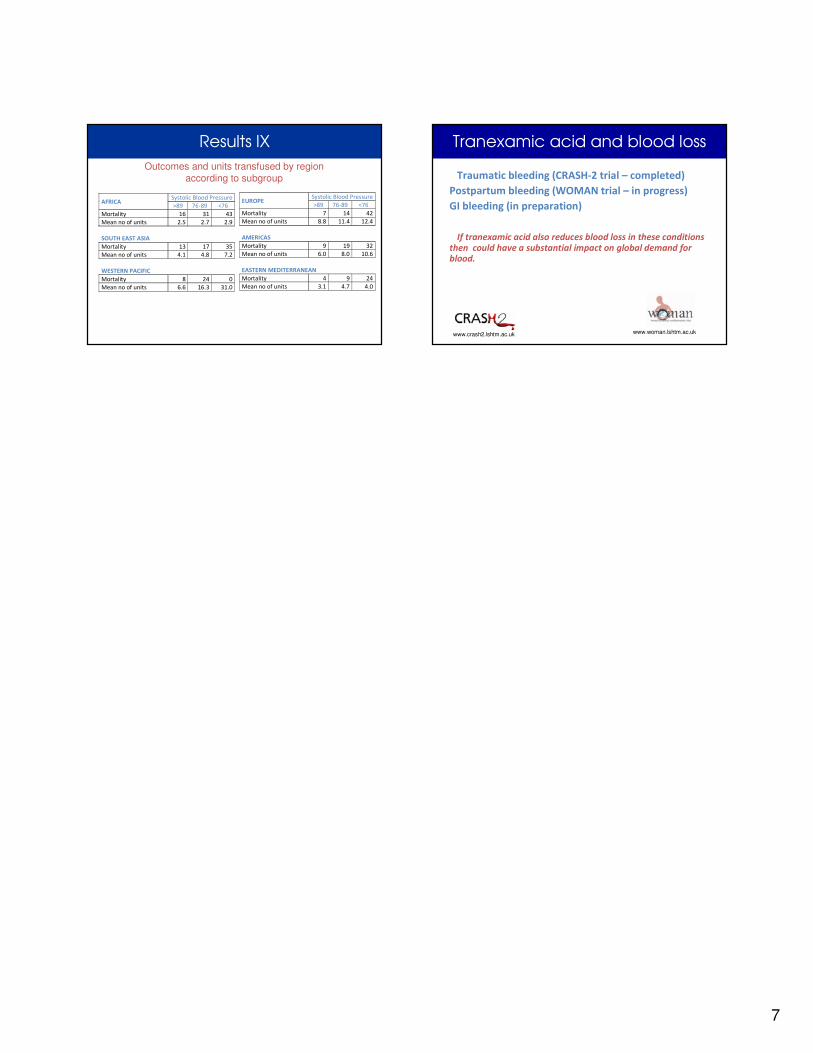
Results IX
Outcomes and units transfused by region according to subgroup
AFRICA Systolic Blood Pressure
>89 76-89 <76
Mortality 16 31 43
Mean no of units 2.5 2.7 2.9
SOUTH EAST ASIA
Mortality 13 17 35
Mean no of units 4.1 4.8 7.2
WESTERN PACIFIC
Mortality 8 24 0
Mean no of units 6.6 16.3 31.0
EUROPE Systolic Blood Pressure
>89 76-89 <76
Mortality 7 14 42
Mean no of units 8.8 11.4 12.4
AMERICAS
Mortality 9 19 32
Mean no of units 6.0 8.0 10.6
EASTERN MEDITERRANEAN
Mortality 4 9 24
Mean no of units 3.1 4.7 4.0
Traumatic bleeding (CRASH-2 trial – completed)
Postpartum bleeding (WOMAN trial – in progress)
GI bleeding (in preparation)
If tranexamic acid also reduces blood loss in these conditions
then could have a substantial impact on global demand for
blood.
Tranexamic acid and blood loss
www.crash2.lshtm.ac.uk www.woman.lshtm.ac.uk
World Health Organization 12 April 2010
1
1 |
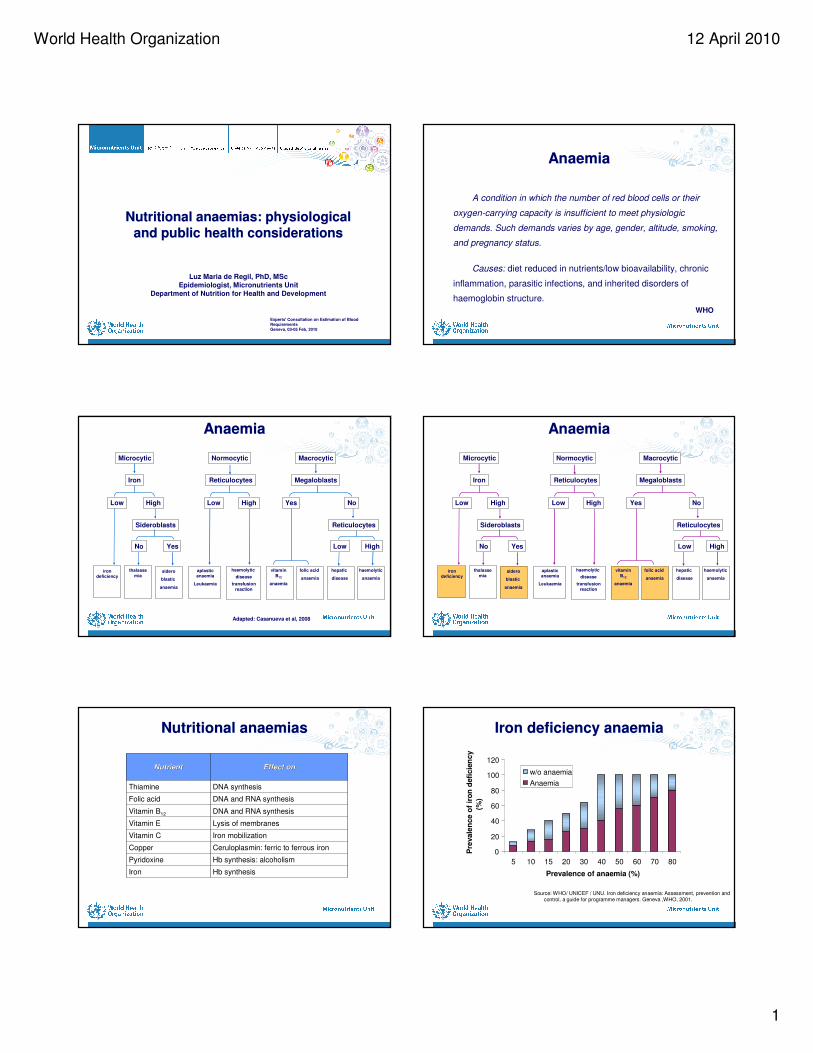
Nutritional anaemias: physiological
and public health considerations
Nutritional anaemias: physiological
and public health considerations
Luz Maria de Regil, PhD, MSc
Epidemiologist, Micronutrients Unit
Department of Nutrition for Health and Development
Experts' Consultation on Estimation of Blood RequirementsGeneva, 03-05 Feb, 2010
2 |
AnaemiaAnaemia
A condition in which the number of red blood cells or their
oxygen-carrying capacity is insufficient to meet physiologic
demands. Such demands varies by age, gender, altitude, smoking,
and pregnancy status.
Causes: diet reduced in nutrients/low bioavailability, chronic
inflammation, parasitic infections, and inherited disorders of
haemoglobin structure.
WHO
3 |
AnaemiaAnaemia
Microcytic Normocytic Macrocytic
Iron Reticulocytes Megaloblasts
Low High Low High Yes No
Sideroblasts
No Yes
iron deficiency
thalasse
miasidero
blastic
anaemia
aplasticanaemia
Leukaemia
haemolytic
disease
transfusion
reaction
vitamin
B12
anaemia
folic acid
anaemia
hepatic
disease
haemolytic
anaemia
Low High
Reticulocytes
Adapted: Casanueva et al, 2008
4 |
AnaemiaAnaemia
Microcytic Normocytic Macrocytic
Iron Reticulocytes Megaloblasts
Low High Low High Yes No
Sideroblasts
No Yes
iron deficiency
thalasse
miasidero
blastic
anaemia
aplasticanaemia
Leukaemia
haemolytic
disease
transfusion
reaction
vitamin
B12
anaemia
folic acid
anaemia
hepatic
disease
haemolytic
anaemia
Low High
Reticulocytes
5 |
Nutritional anaemiasNutritional anaemias
DNA synthesisThiamine
DNA and RNA synthesisFolic acid
DNA and RNA synthesisVitamin B12
Hb synthesisIron
Hb synthesis: alcoholismPyridoxine
Ceruloplasmin: ferric to ferrous ironCopper
Iron mobilizationVitamin C
Lysis of membranesVitamin E
Effect onEffect onNutrientNutrient
6 |
Iron deficiency anaemiaIron deficiency anaemia
0
20
40
60
80
100
120
5 10 15 20 30 40 50 60 70 80
Prevalence of anaemia (%)
Pre
vale
nce o
f ir
on
defi
cie
ncy
(%)
w/o anaemia
Anaemia
Source: WHO/ UNICEF / UNU. Iron deficiency anaemia: Assessment, prevention and control, a guide for programme managers. Geneva ,WHO, 2001.
World Health Organization 12 April 2010
2
7 |
!!
!
!
Category of public health significance(anaemia prevalence)
Normal (<5.0%)
Mild (5.0-19.9%)
Moderate (20.0-39.9%)
Severe (≥40.0%)
No Data
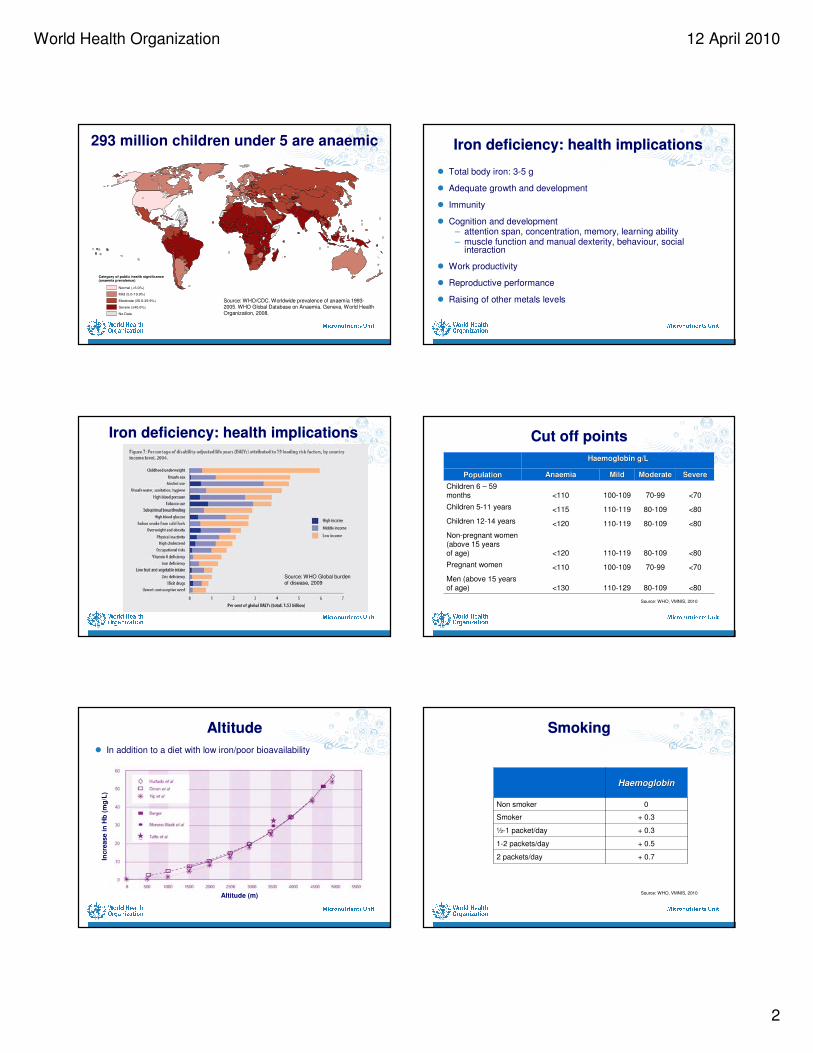
293 million children under 5 are anaemic
Source: WHO/CDC. Worldwide prevalence of anaemia 1993-2005. WHO Global Database on Anaemia. Geneva, World Health Organization, 2008.
8 |
Iron deficiency: health implicationsIron deficiency: health implications
� Total body iron: 3-5 g
� Adequate growth and development
� Immunity
� Cognition and development– attention span, concentration, memory, learning ability– muscle function and manual dexterity, behaviour, social
interaction
� Work productivity
� Reproductive performance
� Raising of other metals levels
9 |
Iron deficiency: health implicationsIron deficiency: health implications
Source: WHO Global burden of disease, 2009
10 |
Cut off pointsCut off points
<8080-109110-129<130Men (above 15 years of age)
<7070-99100-109<110Pregnant women
<8080-109110-119<120
Non-pregnant women (above 15 years of age)
<8080-109110-119<120Children 12-14 years
<8080-109110-119<115Children 5-11 years
<7070-99100-109<110Children 6 – 59 months
SevereSevereModerateModerateMildMildAnaemiaAnaemiaPopulationPopulation
Haemoglobin g/LHaemoglobin g/L
Source: WHO, VMNIS, 2010
11 |
AltitudeAltitude
� In addition to a diet with low iron/poor bioavailability
Altitude (m)
Incre
ase i
n H
b(m
g/L
)
12 |
SmokingSmoking
+ 0.72 packets/day
+ 0.51-2 packets/day
+ 0.3½-1 packet/day
+ 0.3Smoker
0Non smoker
HaemoglobinHaemoglobin
Source: WHO, VMNIS, 2010
World Health Organization 12 April 2010
3
13 |
15 20 25 30 35 40
RBC
Fetus
1
2
3
4
Iro
n n
ee
ds
(mg
/ d
ay
)
Fe losses
Weeks of pregnancy
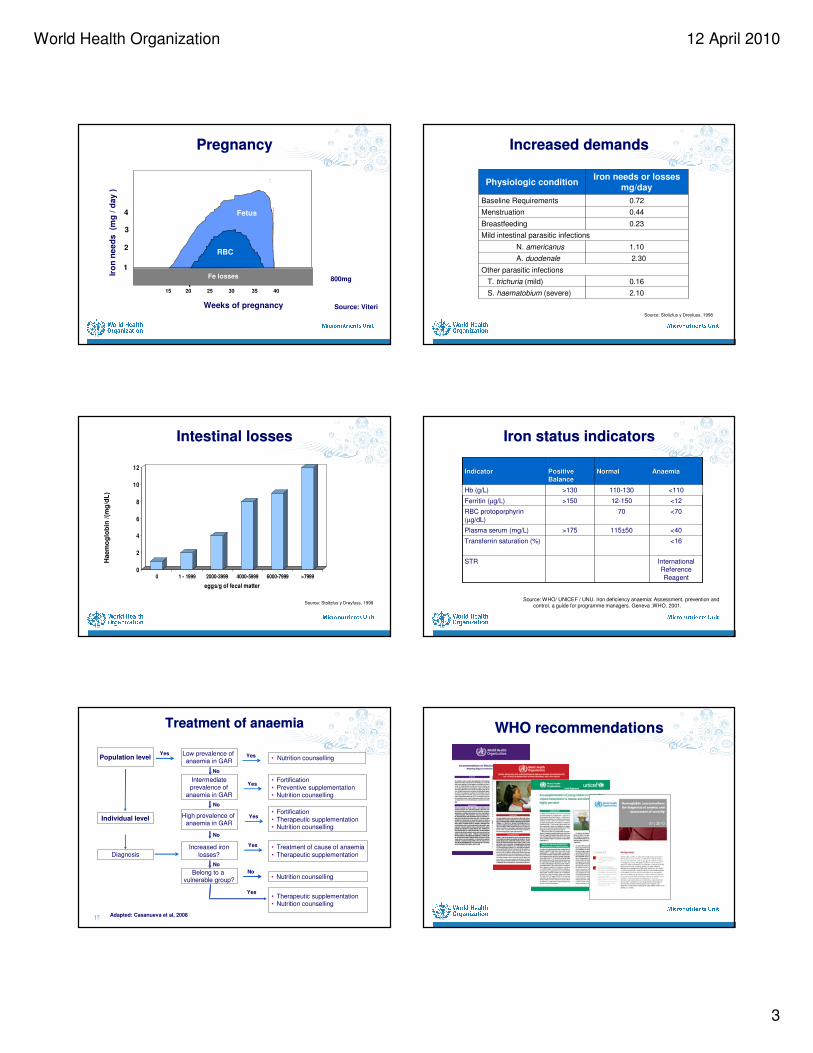
PregnancyPregnancy
800mg
Source: Viteri
14 |
Increased demandsIncreased demands
2.10S. haematobium (severe)
0.16T. trichuria (mild)
Other parasitic infections
2.30A. duodenale
1.10N. americanus
Mild intestinal parasitic infections
0.23Breastfeeding
0.44Menstruation
0.72Baseline Requirements
Iron needs or lossesmg/day
Physiologic condition
Source: Stoltzfus y Dreyfuss, 1998
15 |
Intestinal lossesIntestinal losses
0
2
4
6
8
10
12
0 1 - 1999 2000-3999 4000-5999 6000-7999 >7999
eggs/g of fecal matter
Haem
og
lob
in/(
mg
/dL
)
Source: Stoltzfus y Dreyfuss, 1998
16 |
Iron status indicatorsIron status indicators
<16Transferrin saturation (%)
<110110-130>130Hb (g/L)
International Reference
Reagent
STR
<40115±50>175Plasma serum (mg/L)
<7070RBC protoporphyrin
(µg/dL)
<1212-150>150Ferritin (µg/L)
AnaemiaAnaemiaNormalNormalPositivePositive
BalanceBalanceIndicatorIndicator
Source: WHO/ UNICEF / UNU. Iron deficiency anaemia: Assessment, prevention and control, a guide for programme managers. Geneva ,WHO, 2001.
17 |
Treatment of anaemiaTreatment of anaemia
Population levelLow prevalence of anaemia in GAR
Intermediate
prevalence of anaemia in GAR
• Fortification
• Preventive supplementation• Nutrition counselling
• Nutrition counselling
High prevalence of anaemia in GAR
• Fortification
• Therapeutic supplementation• Nutrition counselling
Individual level
DiagnosisIncreased iron
losses?
• Treatment of cause of anaemia
• Therapeutic supplementation
Belong to a vulnerable group?
• Nutrition counselling
• Therapeutic supplementation• Nutrition counselling
Yes
No
No
No
No
No
Yes
Yes
Yes
Yes
Yes
Adapted: Casanueva et al, 200818 |
WHO recommendationsWHO recommendations
World Health Organization 12 April 2010
4
19 |
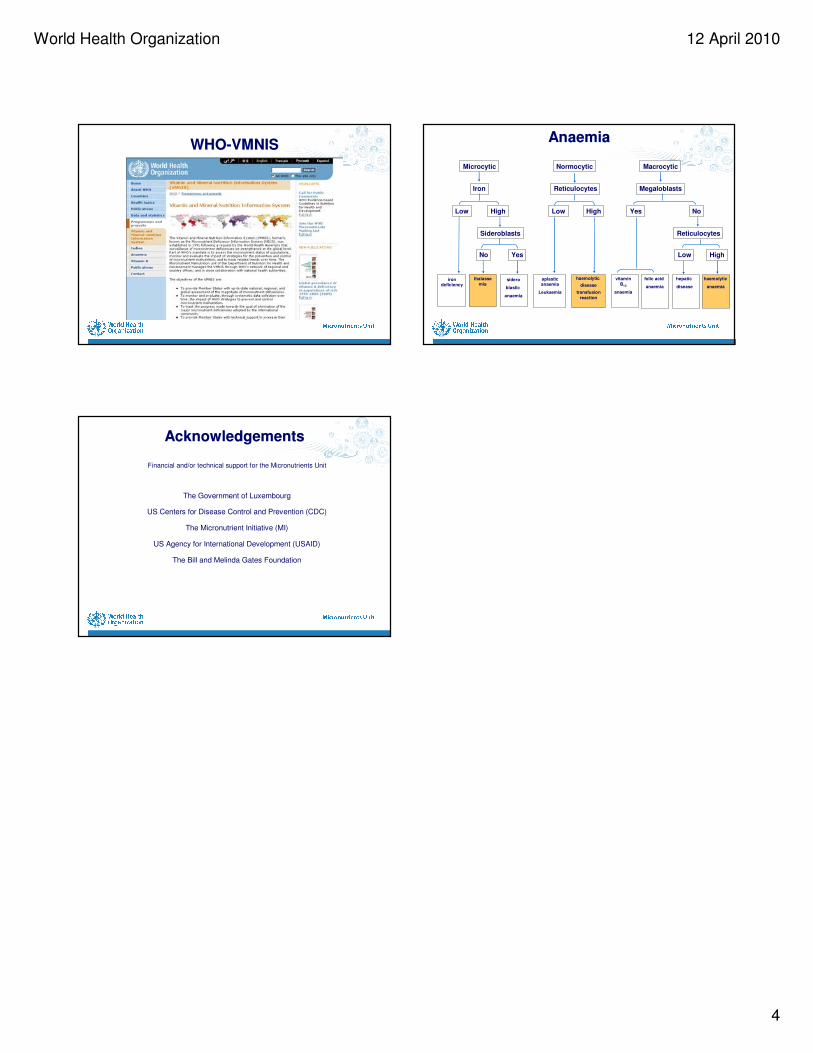
WHO-VMNISWHO-VMNIS
20 |
AnaemiaAnaemia
Microcytic Normocytic Macrocytic
Iron Reticulocytes Megaloblasts
Low High Low High Yes No
Sideroblasts
No Yes
iron deficiency
thalasse
miasidero
blastic
anaemia
aplasticanaemia
Leukaemia
haemolytic
disease
transfusion
reaction
vitamin
B12
anaemia
folic acid
anaemia
hepatic
disease
haemolytic
anaemia
Low High
Reticulocytes
21 |
AcknowledgementsAcknowledgements
Financial and/or technical support for the Micronutrients Unit
The Government of Luxembourg
US Centers for Disease Control and Prevention (CDC)
The Micronutrient Initiative (MI)
US Agency for International Development (USAID)
The Bill and Melinda Gates Foundation
1
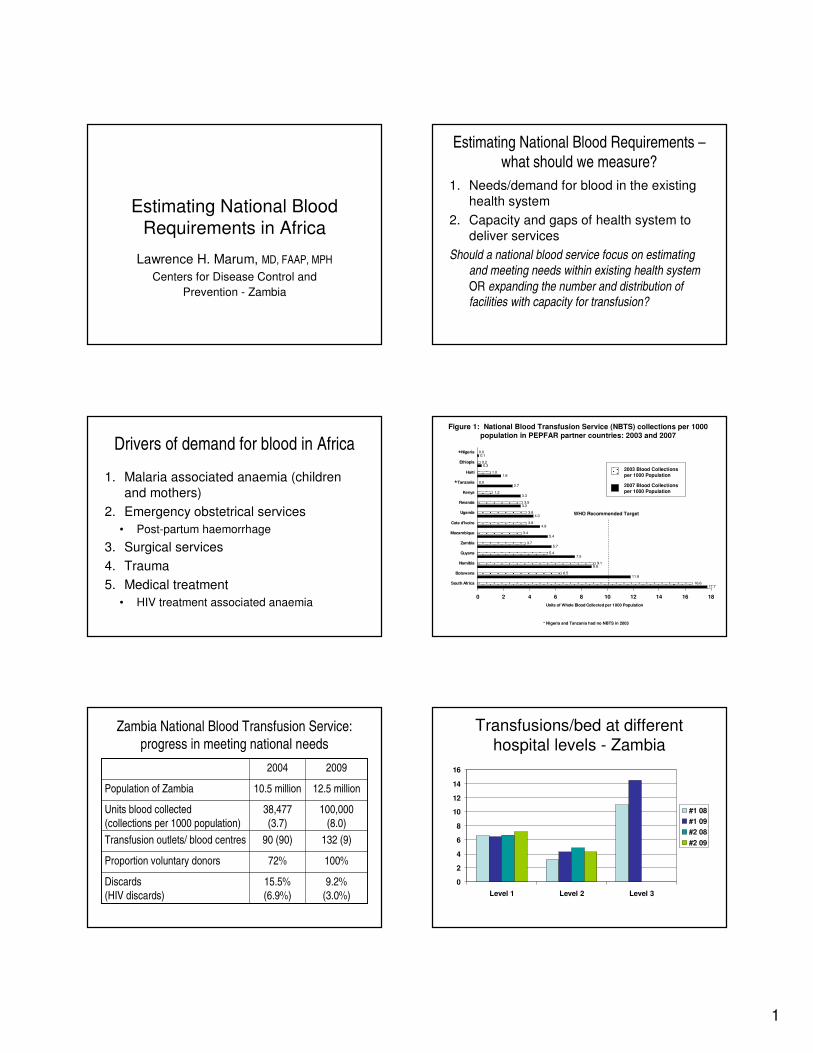
Estimating National Blood
Requirements in Africa
Lawrence H. Marum, MD, FAAP, MPH
Centers for Disease Control and
Prevention - Zambia
Estimating National Blood Requirements –
what should we measure?
1. Needs/demand for blood in the existing
health system
2. Capacity and gaps of health system to
deliver services
Should a national blood service focus on estimating and meeting needs within existing health system
OR expanding the number and distribution of facilities with capacity for transfusion?
Drivers of demand for blood in Africa
1. Malaria associated anaemia (children
and mothers)
2. Emergency obstetrical services
• Post-partum haemorrhage
3. Surgical services
4. Trauma
5. Medical treatment
• HIV treatment associated anaemia
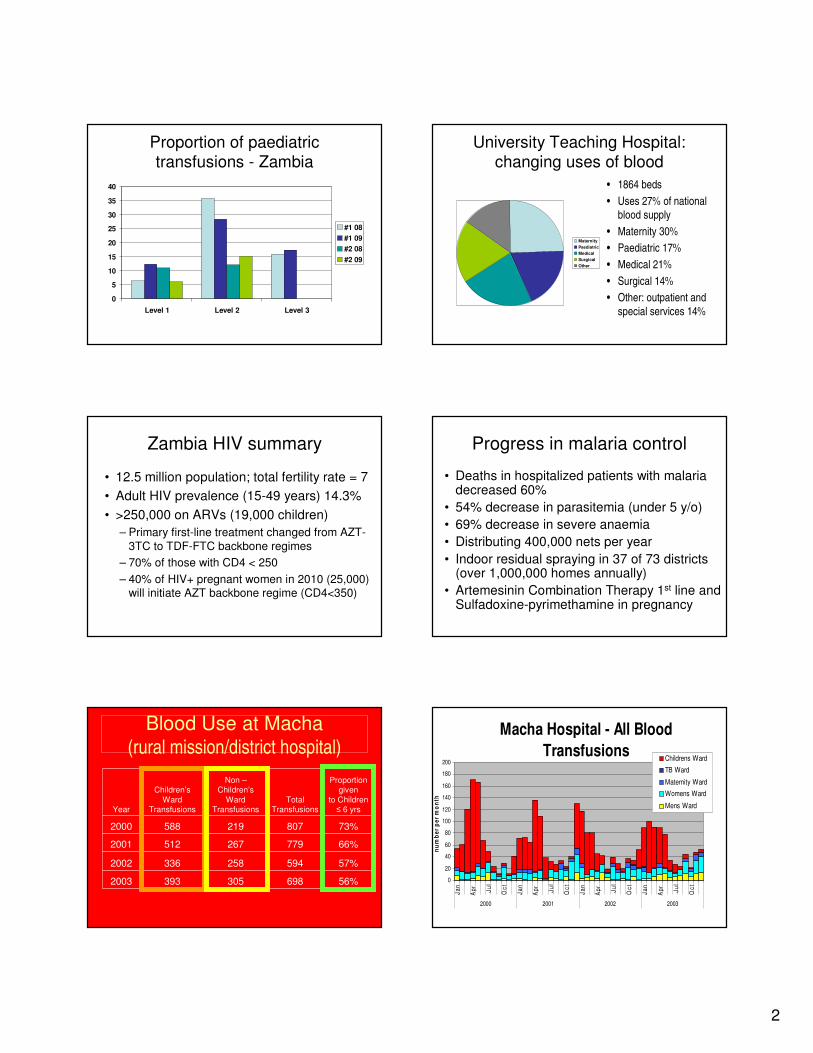
17.716.6
11.86.5
8.89.1
7.55.4
5.73.7
5.43.4
4.83.8
4.33.8
3.33.5
3.31.2
2.70.0
1.81.0
0.30.2
0.10.0
0 2 4 6 8 10 12 14 16 18
South Africa
Botswana
Namibia
Guyana
Zambia
Mozambique
Cote d'Ivoire
Uganda
Rwanda
Kenya
Tanzania
Haiti
Ethiopia
Nigeria
Units of Whole Blood Collected per 1000 Population
Figure 1: National Blood Transfusion Service (NBTS) collections per 1000 population in PEPFAR partner countries: 2003 and 2007
2003 Blood Collections per 1000 Population
2007 Blood Collections per 1000 Population
* Nigeria and Tanzania had no NBTS in 2003
*
*
WHO Recommended Target
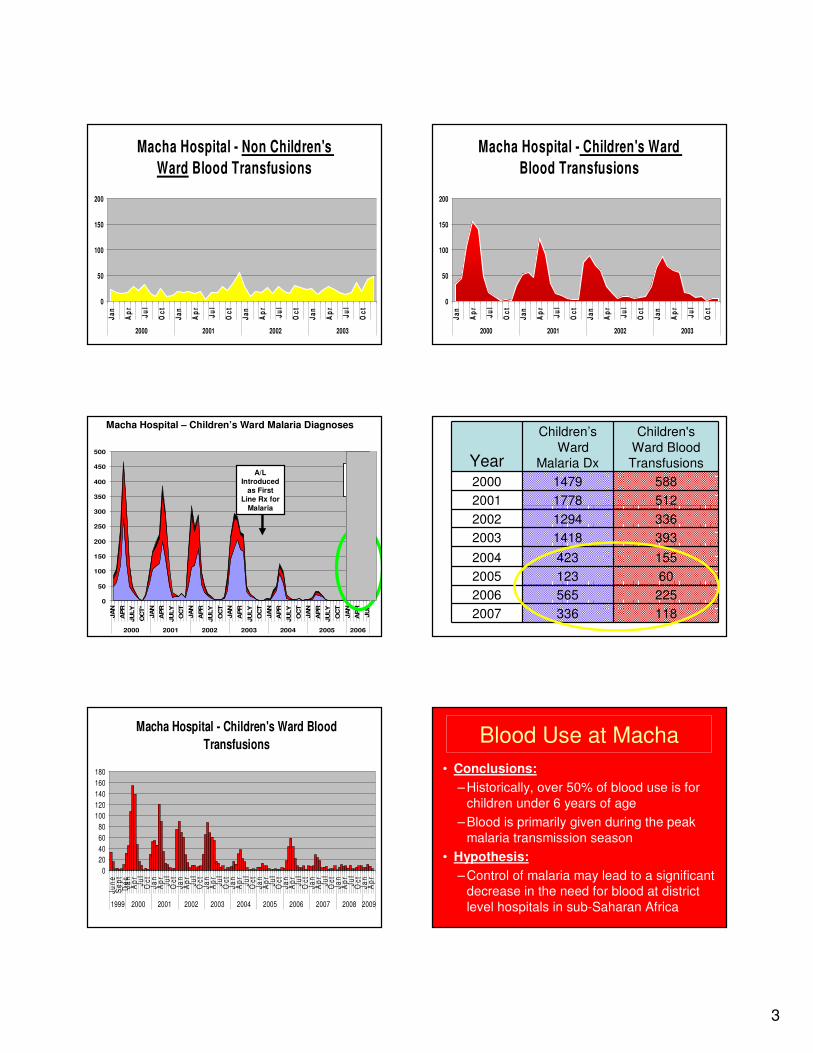
Zambia National Blood Transfusion Service:
progress in meeting national needs
100,000
(8.0)
38,477
(3.7)
Units blood collected
(collections per 1000 population)
132 (9)90 (90)Transfusion outlets/ blood centres
100%72%Proportion voluntary donors
9.2%
(3.0%)
15.5%
(6.9%)
Discards
(HIV discards)
12.5 million10.5 millionPopulation of Zambia
20092004
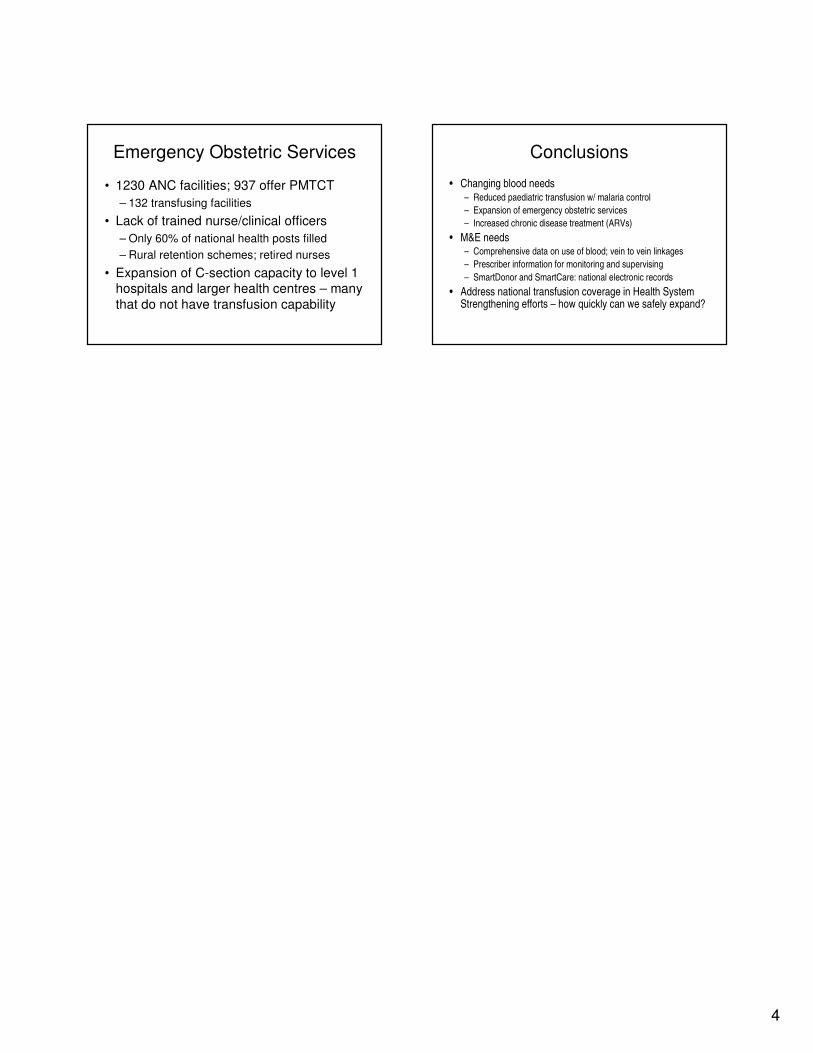
Transfusions/bed at different hospital levels - Zambia
0
2
4
6
8
10
12
14
16
Level 1 Level 2 Level 3
#1 08
#1 09
#2 08
#2 09
2
Proportion of paediatrictransfusions - Zambia
0
5
10
15
20
25
30
35
40
Level 1 Level 2 Level 3
#1 08
#1 09
#2 08
#2 09
University Teaching Hospital: changing uses of blood
Maternity
Paediatric
Medical
Surgical
Other
• 1864 beds
• Uses 27% of national
blood supply
• Maternity 30%
• Paediatric 17%
• Medical 21%
• Surgical 14%
• Other: outpatient and
special services 14%
Zambia HIV summary
• 12.5 million population; total fertility rate = 7
• Adult HIV prevalence (15-49 years) 14.3%
• >250,000 on ARVs (19,000 children)
– Primary first-line treatment changed from AZT-
3TC to TDF-FTC backbone regimes
– 70% of those with CD4 < 250
– 40% of HIV+ pregnant women in 2010 (25,000) will initiate AZT backbone regime (CD4<350)
Progress in malaria control
• Deaths in hospitalized patients with malaria decreased 60%
• 54% decrease in parasitemia (under 5 y/o)
• 69% decrease in severe anaemia
• Distributing 400,000 nets per year
• Indoor residual spraying in 37 of 73 districts (over 1,000,000 homes annually)
• Artemesinin Combination Therapy 1st line and Sulfadoxine-pyrimethamine in pregnancy
Blood Use at Macha
(rural mission/district hospital)
Children’s
Ward Transfusions
Non –Children’s
Ward Transfusions
Total Transfusions
Proportion given
to Children ≤ 6 yrsYear
2000 588 219 807 73%
2001 512 267 779 66%
2002 336 258 594 57%
2003 393 305 698 56%
Macha Hospital - All Blood
Transfusions
0
20
40
60
80
100
120
140
160
180
200
Ja
n
Ap
r
Ju
l
Oc
t
Ja
n
Ap
r
Ju
l
Oc
t
Ja
n
Ap
r
Ju
l
Oc
t
Ja
n
Ap
r
Ju
l
Oc
t
2000 2001 2002 2003
nu
mb
er
pe
r m
on
th
Childrens Ward
TB Ward
Maternity Ward
Womens Ward
Mens Ward
3
Macha Hospital - Non Children's
Ward Blood Transfusions
0
50
100
150
200
Ja
n
Ap
r
Ju
l
Oc
t
Ja
n
Ap
r
Ju
l
Oc
t
Ja
n
Ap
r
Ju
l
Oc
t
Ja
n
Ap
r
Ju
l
Oc
t
2000 2001 2002 2003
Macha Hospital - Children's Ward
Blood Transfusions
0
50
100
150
200
Ja
n
Ap
r
Ju
l
Oc
t
Ja
n
Ap
r
Ju
l
Oc
t
Ja
n
Ap
r
Ju
l
Oc
t
Ja
n
Ap
r
Ju
l
Oc
t
2000 2001 2002 2003
0
50
100
150
200
250
300
350
400
450
500
JA
N
AP
R
JU
LY
OC
T*
JA
N
AP
R
JU
LY
OC
T
JA
N
AP
R
JU
LY
OC
T
JA
N
AP
R
JU
LY
OC
T
JA
N
AP
R
JU
LY
OC
T
JA
N
AP
R
JU
LY
OC
T
JA
N
AP
R
JU
L
2000 2001 2002 2003 2004 2005 2006
Macha Hospital – Children’s Ward Malaria Diagnoses
A/L out of
stock
A/L Introduced
as First Line Rx for
Malaria
Year
Children’s
WardMalaria Dx
Children's
Ward BloodTransfusions
2000 1479 588
2001 1778 512
2002 1294 336
2003 1418 393
2004 423 155
2005 123 60
2006 565 225
2007 336 118
Macha Hospital - Children's Ward Blood
Transfusions
0
20
40
60
80
100
120
140
160
180
Ju
ne
Se
pt
De
cJ
an
Ap
rJ
ul
Oc
tJ
an
Ap
rJ
ul
Oc
tJ
an
Ap
rJ
ul
Oc
tJ
an
Ap
rJ
ul
Oc
tJ
an
Ap
rJ
ul
Oc
tJ
an
Ap
rJ
ul
Oc
tJ
an
Ap
rJ
ul
Oc
tJ
an
Ap
rJ
ul
Oc
tJ
an
Ap
rJ
ul
Oc
tJ
an
Ap
r
1999 2000 2001 2002 2003 2004 2005 2006 2007 2008 2009
Blood Use at Macha
• Conclusions:
– Historically, over 50% of blood use is for
children under 6 years of age
– Blood is primarily given during the peak
malaria transmission season
• Hypothesis:
– Control of malaria may lead to a significant decrease in the need for blood at district
level hospitals in sub-Saharan Africa
4
Emergency Obstetric Services
• 1230 ANC facilities; 937 offer PMTCT
– 132 transfusing facilities
• Lack of trained nurse/clinical officers
– Only 60% of national health posts filled
– Rural retention schemes; retired nurses
• Expansion of C-section capacity to level 1 hospitals and larger health centres – many
that do not have transfusion capability
Conclusions
• Changing blood needs– Reduced paediatric transfusion w/ malaria control
– Expansion of emergency obstetric services
– Increased chronic disease treatment (ARVs)
• M&E needs– Comprehensive data on use of blood; vein to vein linkages
– Prescriber information for monitoring and supervising
– SmartDonor and SmartCare: national electronic records
• Address national transfusion coverage in Health System Strengthening efforts – how quickly can we safely expand?
1
Dr Francine DécaryPresident and CEO
Carolina SarappaBusiness Analyst
Héma-Québec
03-05 February 2010
WHO Experts’ Group Consultation on Estimation
of Blood requirements
DIFFERENT MODELS OF BLOOD ESTIMATION
A BLOOD CENTRE PERSPECTIVE
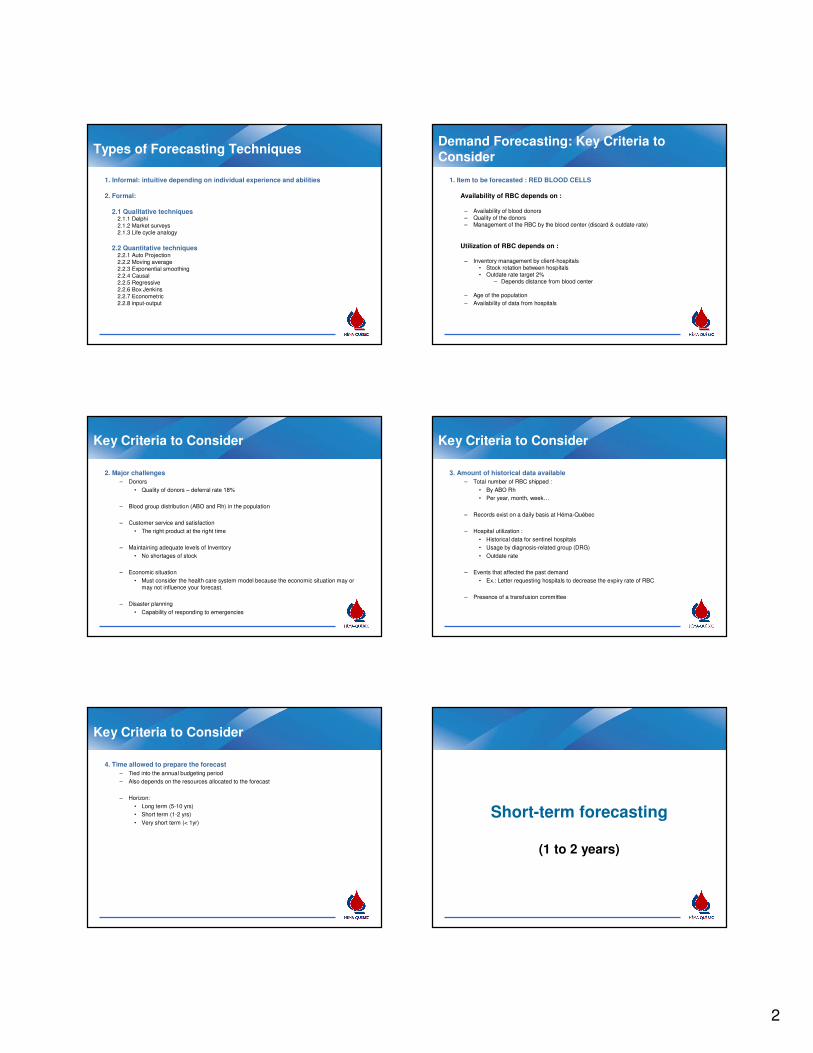
Background : national health care
CanadaPopulation:33,968,200
Territory:9,984,670 km²
QuebecPopulation:7,828,879
Territory:
1,542,056 km²
Hospitals:99
Model:Blood banks in hospitals
Blood Management System in Quebec Quebec statistics 2008-09
� Blood units drawn: 245,938
� RBC shipped to hospitals: 231,958
� Inventory at HQ: 8 days
� Outdating at HQ: 0.62%
� Outdating in the hospitals: 1,4%
RBC utilization in hospitals
100Total
12Others
43Hematologicaldisease & transplant
7Trauma
1Obstetrics
12Urgent
25Surgery: Elective
% Indications
Comparison of RBC utilization with other countries
USAFrance
QUEBEC
45.5
33.028.5
0
10
20
30
40
50
Un
its
/10
00
po
pula
tio
n/y
ea
r
2
Types of Forecasting Techniques
1. Informal: intuitive depending on individual experience and abilities
2. Formal:
2.1 Qualitative techniques2.1.1 Delphi2.1.2 Market surveys2.1.3 Life cycle analogy
2.2 Quantitative techniques2.2.1 Auto Projection2.2.2 Moving average2.2.3 Exponential smoothing2.2.4 Causal2.2.5 Regressive2.2.6 Box Jenkins2.2.7 Econometric2.2.8 input-output
Demand Forecasting: Key Criteria to Consider
1. Item to be forecasted : RED BLOOD CELLS
Availability of RBC depends on :
– Availability of blood donors– Quality of the donors– Management of the RBC by the blood center (discard & outdate rate)
Utilization of RBC depends on :
– Inventory management by client-hospitals• Stock rotation between hospitals• Outdate rate target 2%
– Depends distance from blood center
– Age of the population
– Availability of data from hospitals
Key Criteria to Consider
2. Major challenges
– Donors
• Quality of donors – deferral rate 18%
– Blood group distribution (ABO and Rh) in the population
– Customer service and satisfaction
• The right product at the right time
– Maintaining adequate levels of Inventory
• No shortages of stock
– Economic situation
• Must consider the health care system model because the economic situation may or may not influence your forecast.
– Disaster planning
• Capability of responding to emergencies
Key Criteria to Consider
3. Amount of historical data available
– Total number of RBC shipped :
• By ABO Rh
• Per year, month, week…
– Records exist on a daily basis at Héma-Québec
– Hospital utilization :
• Historical data for sentinel hospitals
• Usage by diagnosis-related group (DRG)
• Outdate rate
– Events that affected the past demand
• Ex.: Letter requesting hospitals to decrease the expiry rate of RBC
– Presence of a transfusion committee
Key Criteria to Consider
4. Time allowed to prepare the forecast
– Tied into the annual budgeting period
– Also depends on the resources allocated to the forecast
– Horizon:
• Long term (5-10 yrs)
• Short term (1-2 yrs)
• Very short term (< 1yr)
Short-term forecasting
(1 to 2 years)
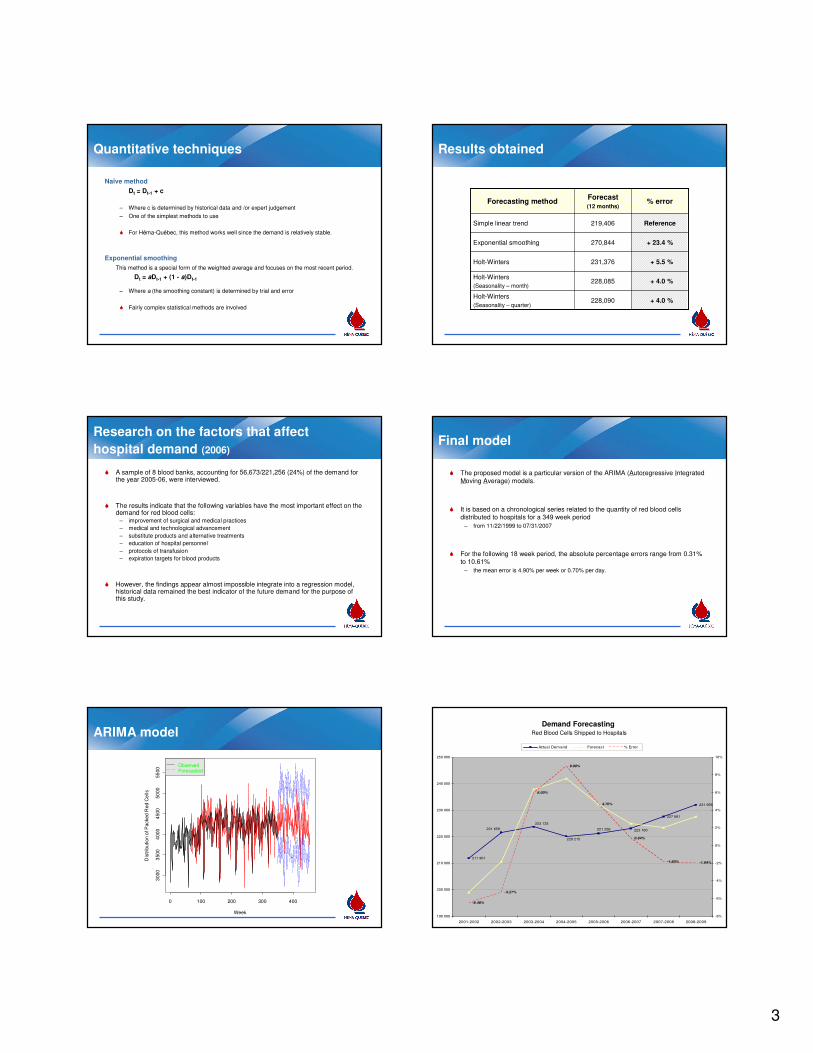
3
Quantitative techniques
Naïve method
Dt = Dt-1 + c
– Where c is determined by historical data and /or expert judgement
– One of the simplest methods to use
� For Héma-Québec, this method works well since the demand is relatively stable.
Exponential smoothing
This method is a special form of the weighted average and focuses on the most recent period.
Dt = aDt-1 + (1 - a)Dt-1
– Where a (the smoothing constant) is determined by trial and error
� Fairly complex statistical methods are involved
Results obtained
+ 4.0 %228,090Holt-Winters
(Seasonality – quarter)
+ 4.0 %228,085Holt-Winters
(Seasonality – month)
+ 5.5 %231,376Holt-Winters
+ 23.4 %270,844Exponential smoothing
Reference219,406Simple linear trend
% errorForecast(12 months)
Forecasting method
Research on the factors that affect
hospital demand (2006)
� A sample of 8 blood banks, accounting for 56,673/221,256 (24%) of the demand for the year 2005-06, were interviewed.
� The results indicate that the following variables have the most important effect on the demand for red blood cells:
– improvement of surgical and medical practices
– medical and technological advancement
– substitute products and alternative treatments
– education of hospital personnel
– protocols of transfusion
– expiration targets for blood products
� However, the findings appear almost impossible integrate into a regression model, historical data remained the best indicator of the future demand for the purpose of this study.
Final model
� The proposed model is a particular version of the ARIMA (Autoregressive Integrated
Moving Average) models.
� It is based on a chronological series related to the quantity of red blood cells distributed to hospitals for a 349 week period
– from 11/22/1999 to 07/31/2007
� For the following 18 week period, the absolute percentage errors range from 0.31% to 10.61%
– the mean error is 4.90% per week or 0.70% per day.
ARIMA model
Week
Dis
trib
ution o
f P
acked
Red C
ells
0 100 200 300 400
3000
3500
4000
4500
50
00
55
00
ObservedForecasted
211 901
227 581
231 958
221 256 223 100221 659
223 723
220 215
-6.48%
-5.27%
6.00%
9.00%
4.70%
0.84%
-1.83% -1.94%
190 000
200 000
210 000
220 000
230 000
240 000
250 000
2001-2002 2002-2003 2003-2004 2004-2005 2005-2006 2006-2007 2007-2008 2008-2009
-8%
-6%
-4%
-2%
0%
2%
4%
6%
8%
10%
Actual Demand Forecast % Error
Demand ForecastingRed Blood Cells Shipped to Hospitals
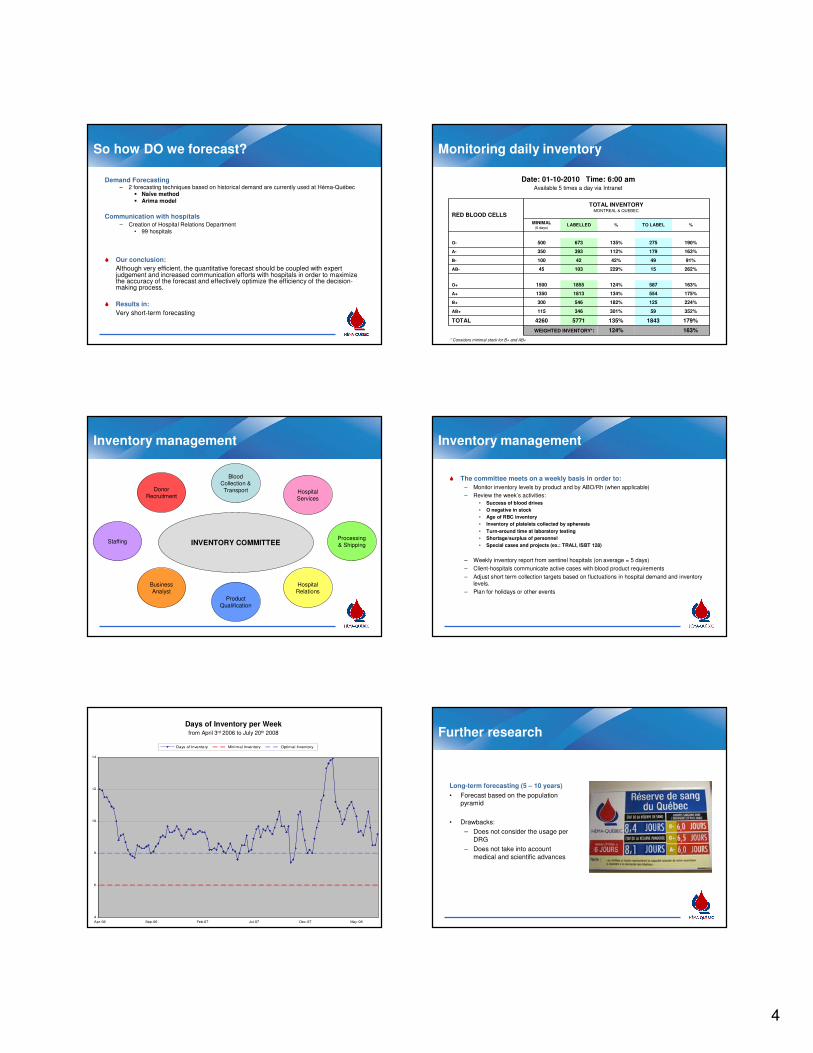
4
So how DO we forecast?
Demand Forecasting– 2 forecasting techniques based on historical demand are currently used at Héma-Québec
� Naïve method� Arima model
Communication with hospitals– Creation of Hospital Relations Department
• 99 hospitals
� Our conclusion:
Although very efficient, the quantitative forecast should be coupled with expert judgement and increased communication efforts with hospitals in order to maximize the accuracy of the forecast and effectively optimize the efficiency of the decision-making process.
� Results in:
Very short-term forecasting
Monitoring daily inventory
163%124%WEIGHTED INVENTORY*:
179%1843135%57714260TOTAL
352%59301%346115AB+
224%125182%546300B+
175%554134%18131350A+
163%587124%18551500O+
262%15229%10345AB-
91%4942%42100B-
163%179112%393350A-
190%275135%673500O-
%TO LABEL%LABELLEDMINIMAL
(6 days)
TOTAL INVENTORYMONTREAL & QUEBEC
RED BLOOD CELLS
Date: 01-10-2010 Time: 6:00 amAvailable 5 times a day via Intranet
* Considers minimal stock for B+ and AB+
Inventory management
BusinessAnalyst
INVENTORY COMMITTEEProcessing& Shipping
ProductQualification
HospitalRelations
BloodCollection &
Transport HospitalServices
Staffing
DonorRecruitment
Inventory management
� The committee meets on a weekly basis in order to:
– Monitor inventory levels by product and by ABO/Rh (when applicable)
– Review the week’s activities:
• Success of blood drives
• O negative in stock
• Age of RBC inventory
• Inventory of platelets collected by apheresis
• Turn-around time at laboratory testing
• Shortage/surplus of personnel
• Special cases and projects (ex.: TRALI, ISBT 128)
– Weekly inventory report from sentinel hospitals (on average = 5 days)
– Client-hospitals communicate active cases with blood product requirements
– Adjust short term collection targets based on fluctuations in hospital demand and inventory levels.
– Plan for holidays or other events
4
6
8
10
12
14
Apr-06 Sep-06 Feb-07 Jul-07 Dec-07 May-08
Days of Inventory Minimal Inventory Optimal Inventory
Days of Inventory per Weekfrom April 3rd 2006 to July 20th 2008 Further research
Long-term forecasting (5 – 10 years)
• Forecast based on the population pyramid
• Drawbacks:
– Does not consider the usage per
DRG
– Does not take into account
medical and scientific advances
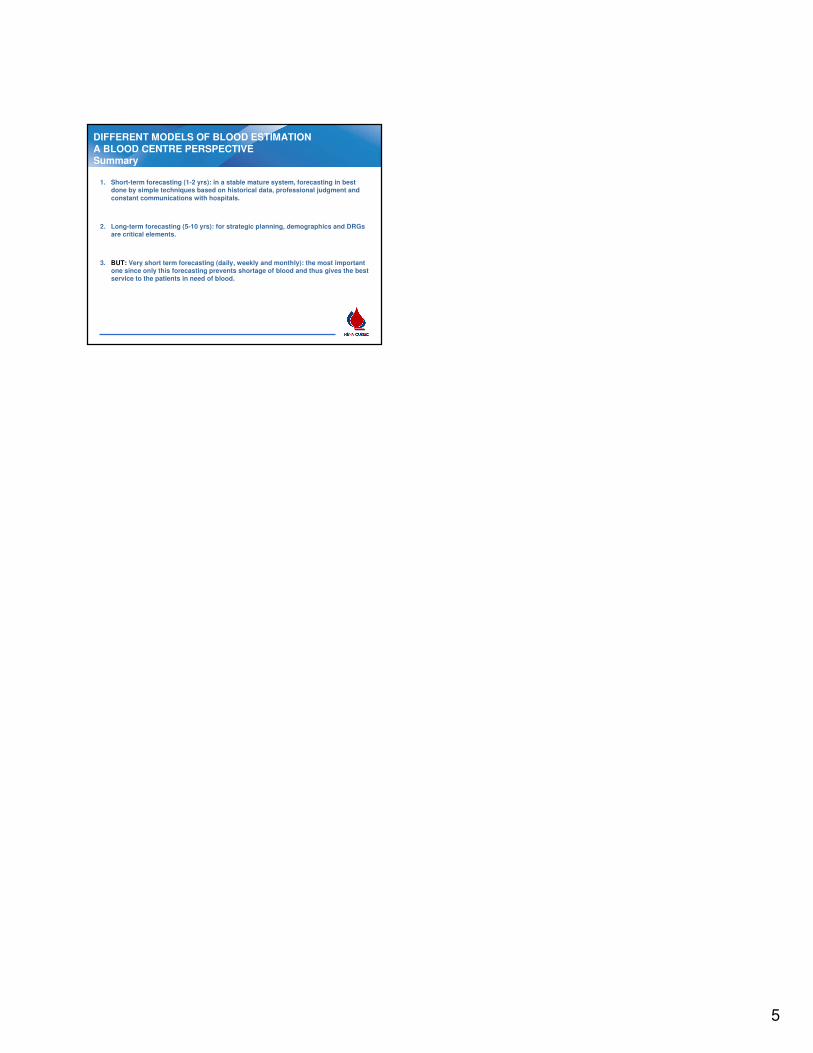
5
DIFFERENT MODELS OF BLOOD ESTIMATION A BLOOD CENTRE PERSPECTIVESummary
1. Short-term forecasting (1-2 yrs): in a stable mature system, forecasting in best done by simple techniques based on historical data, professional judgment and
constant communications with hospitals.
2. Long-term forecasting (5-10 yrs): for strategic planning, demographics and DRGsare critical elements.
3. BUT: Very short term forecasting (daily, weekly and monthly): the most important one since only this forecasting prevents shortage of blood and thus gives the best service to the patients in need of blood.
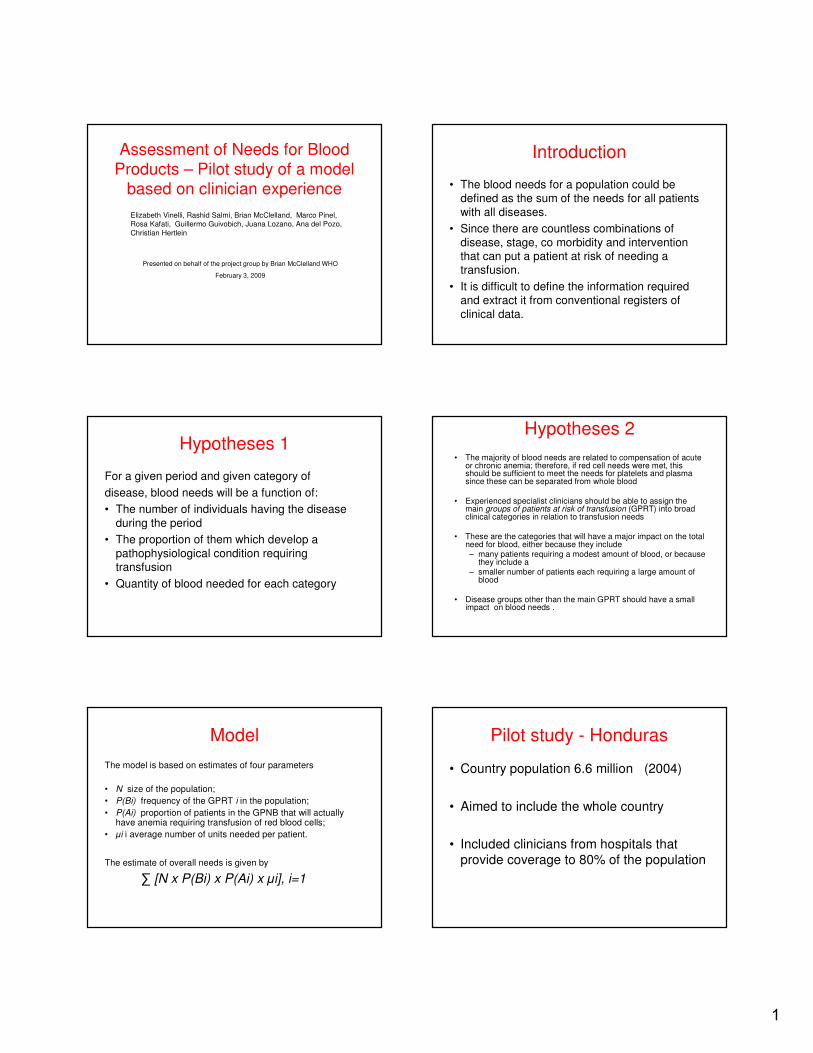
1
Assessment of Needs for Blood Products – Pilot study of a model
based on clinician experience
Elizabeth Vinelli, Rashid Salmi, Brian McClelland, Marco Pinel, Rosa Kafati, Guillermo Guivobich, Juana Lozano, Ana del Pozo,
Christian Hertlein
Presented on behalf of the project group by Brian McClelland WHO
February 3, 2009
Introduction
• The blood needs for a population could be defined as the sum of the needs for all patients
with all diseases.
• Since there are countless combinations of
disease, stage, co morbidity and intervention that can put a patient at risk of needing a transfusion.
• It is difficult to define the information required and extract it from conventional registers of
clinical data.
Hypotheses 1
For a given period and given category of
disease, blood needs will be a function of:
• The number of individuals having the disease
during the period
• The proportion of them which develop a
pathophysiological condition requiring transfusion
• Quantity of blood needed for each category
Hypotheses 2
• The majority of blood needs are related to compensation of acuteor chronic anemia; therefore, if red cell needs were met, this should be sufficient to meet the needs for platelets and plasma since these can be separated from whole blood
• Experienced specialist clinicians should be able to assign the main groups of patients at risk of transfusion (GPRT) into broad clinical categories in relation to transfusion needs
• These are the categories that will have a major impact on the total need for blood, either because they include – many patients requiring a modest amount of blood, or because
they include a – smaller number of patients each requiring a large amount of
blood
• Disease groups other than the main GPRT should have a small impact on blood needs .
Model
The model is based on estimates of four parameters
• N size of the population;
• P(Bi) frequency of the GPRT i in the population;
• P(Ai) proportion of patients in the GPNB that will actually have anemia requiring transfusion of red blood cells;
• µi i average number of units needed per patient.
The estimate of overall needs is given by
∑ [N x P(Bi) x P(Ai) x µi], i=1
Pilot study - Honduras
• Country population 6.6 million (2004)
• Aimed to include the whole country
• Included clinicians from hospitals thatprovide coverage to 80% of the population
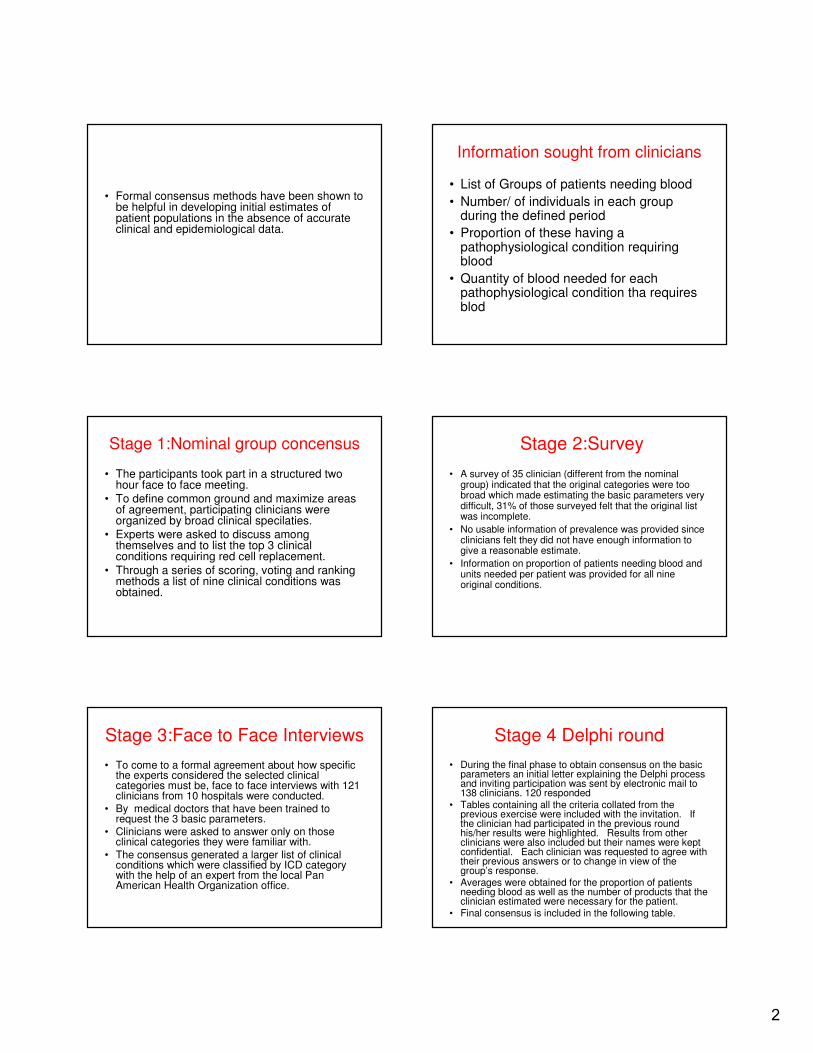
2
• Formal consensus methods have been shown to be helpful in developing initial estimates of patient populations in the absence of accurate clinical and epidemiological data.
Information sought from clinicians
• List of Groups of patients needing blood
• Number/ of individuals in each group during the defined period
• Proportion of these having a pathophysiological condition requiring blood
• Quantity of blood needed for each pathophysiological condition tha requires blod
Stage 1:Nominal group concensus
• The participants took part in a structured two hour face to face meeting.
• To define common ground and maximize areas of agreement, participating clinicians were organized by broad clinical specilaties.
• Experts were asked to discuss among themselves and to list the top 3 clinical conditions requiring red cell replacement.
• Through a series of scoring, voting and ranking methods a list of nine clinical conditions was obtained.
Stage 2:Survey
• A survey of 35 clinician (different from the nominal group) indicated that the original categories were too broad which made estimating the basic parameters very difficult, 31% of those surveyed felt that the original list was incomplete.
• No usable information of prevalence was provided since clinicians felt they did not have enough information to give a reasonable estimate.
• Information on proportion of patients needing blood andunits needed per patient was provided for all nineoriginal conditions.
Stage 3:Face to Face Interviews
• To come to a formal agreement about how specific the experts considered the selected clinical categories must be, face to face interviews with 121 clinicians from 10 hospitals were conducted.
• By medical doctors that have been trained to request the 3 basic parameters.
• Clinicians were asked to answer only on those clinical categories they were familiar with.
• The consensus generated a larger list of clinical conditions which were classified by ICD category with the help of an expert from the local Pan American Health Organization office.
Stage 4 Delphi round
• During the final phase to obtain consensus on the basic parameters an initial letter explaining the Delphi process and inviting participation was sent by electronic mail to 138 clinicians. 120 responded
• Tables containing all the criteria collated from the previous exercise were included with the invitation. If the clinician had participated in the previous round his/her results were highlighted. Results from other clinicians were also included but their names were kept confidential. Each clinician was requested to agree with their previous answers or to change in view of the group’s response.
• Averages were obtained for the proportion of patients needing blood as well as the number of products that the clinician estimated were necessary for the patient.
• Final consensus is included in the following table.
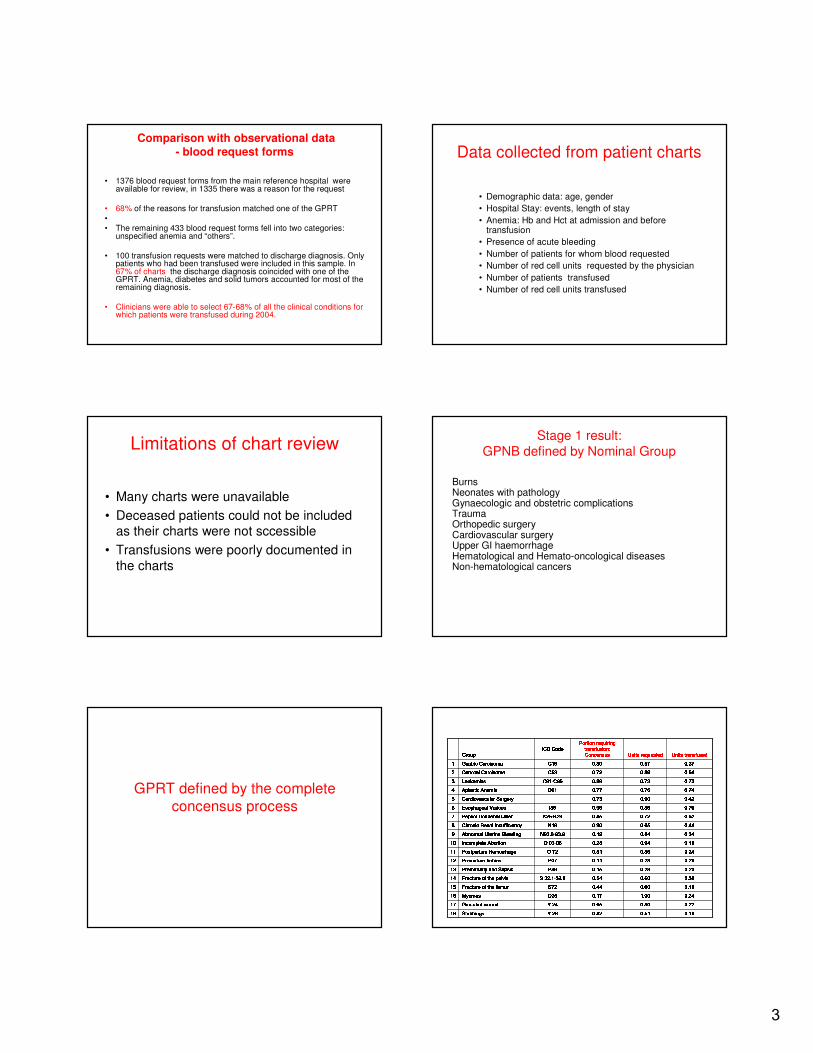
3
Comparison with observational data- blood request forms
• 1376 blood request forms from the main reference hospital were available for review, in 1335 there was a reason for the request
• 68% of the reasons for transfusion matched one of the GPRT
•• The remaining 433 blood request forms fell into two categories:
unspecified anemia and “others”.
• 100 transfusion requests were matched to discharge diagnosis. Only patients who had been transfused were included in this sample. In 67% of charts the discharge diagnosis coincided with one of the GPRT. Anemia, diabetes and solid tumors accounted for most of the remaining diagnosis.
• Clinicians were able to select 67-68% of all the clinical conditions for which patients were transfused during 2004.
Data collected from patient charts
• Demographic data: age, gender
• Hospital Stay: events, length of stay
• Anemia: Hb and Hct at admission and before transfusion
• Presence of acute bleeding
• Number of patients for whom blood requested
• Number of red cell units requested by the physician
• Number of patients transfused
• Number of red cell units transfused
Limitations of chart review
• Many charts were unavailable
• Deceased patients could not be included as their charts were not sccessible
• Transfusions were poorly documented in
the charts
Stage 1 result:
GPNB defined by Nominal Group
BurnsNeonates with pathologyGynaecologic and obstetric complicationsTrauma Orthopedic surgeryCardiovascular surgeryUpper GI haemorrhageHematological and Hemato-oncological diseasesNon-hematological cancers
GPRT defined by the complete
concensus process
0.190.190.190.190.510.510.510.510.420.420.420.42Y.28Y.28Y.28Y.28StabbingsStabbingsStabbingsStabbings18181818 0.220.220.220.220.800.800.800.800.650.650.650.65Y.24Y.24Y.24Y.24GunGunGunGun----shot woundshot woundshot woundshot wound17171717 0.340.340.340.341.001.001.001.000.170.170.170.17D25D25D25D25MyomasMyomasMyomasMyomas16161616 0.180.180.180.180.600.600.600.600.440.440.440.44S72S72S72S72Fracture of the femurFracture of the femurFracture of the femurFracture of the femur15151515 0.380.380.380.380.600.600.600.600.540.540.540.54S 32.1S 32.1S 32.1S 32.1----32.832.832.832.8Fracture of the pelvisFracture of the pelvisFracture of the pelvisFracture of the pelvis14141414 0.230.230.230.230.280.280.280.280.150.150.150.15P36P36P36P36Prematurity and SepsisPrematurity and SepsisPrematurity and SepsisPrematurity and Sepsis13131313 0.260.260.260.260.280.280.280.280.110.110.110.11P07P07P07P07Premature babiesPremature babiesPremature babiesPremature babies12121212 0.240.240.240.240.860.860.860.860.510.510.510.51O 72O 72O 72O 72Postpartum HemorrhagePostpartum HemorrhagePostpartum HemorrhagePostpartum Hemorrhage11111111 0.160.160.160.160.940.940.940.940.280.280.280.28O 03O 03O 03O 03----06060606Incomplete AbortionIncomplete AbortionIncomplete AbortionIncomplete Abortion10101010 0.340.340.340.340.840.840.840.840.190.190.190.19N93.8N93.8N93.8N93.8----93.993.993.993.9Abnormal Uterine BleedingAbnormal Uterine BleedingAbnormal Uterine BleedingAbnormal Uterine Bleeding9999 0.440.440.440.440.650.650.650.650.900.900.900.90N18N18N18N18Chronic Renal InsufficiencyChronic Renal InsufficiencyChronic Renal InsufficiencyChronic Renal Insufficiency8888 0.620.620.620.620.720.720.720.720.450.450.450.45K25K25K25K25----K29K29K29K29Peptic/ Peptic/ Peptic/ Peptic/ DoudenalDoudenalDoudenalDoudenal UlcerUlcerUlcerUlcer7777 0.760.760.760.760.860.860.860.860.960.960.960.96I85I85I85I85Esophageal Esophageal Esophageal Esophageal VaricesVaricesVaricesVarices6666 0.420.420.420.420.900.900.900.900.730.730.730.73Cardiovascular SurgeryCardiovascular SurgeryCardiovascular SurgeryCardiovascular Surgery5555 0.740.740.740.740.760.760.760.760.770.770.770.77D61D61D61D61AplasticAplasticAplasticAplastic AnemiaAnemiaAnemiaAnemia4444 0.730.730.730.730.730.730.730.730.890.890.890.89C91C91C91C91----C95C95C95C95LeukemiasLeukemiasLeukemiasLeukemias3333 0.640.640.640.640.860.860.860.860.720.720.720.72C53C53C53C53Cervical CarcinomaCervical CarcinomaCervical CarcinomaCervical Carcinoma2222 0.370.370.370.370.570.570.570.570.800.800.800.80C16C16C16C16Gastric CarcinomaGastric CarcinomaGastric CarcinomaGastric Carcinoma1111 Units transfusedUnits transfusedUnits transfusedUnits transfusedUnits requestedUnits requestedUnits requestedUnits requestedPortion requiring Portion requiring Portion requiring Portion requiring transfusion: transfusion: transfusion: transfusion: ConcensusConcensusConcensusConcensusICD CodeICD CodeICD CodeICD CodeGroupGroupGroupGroup
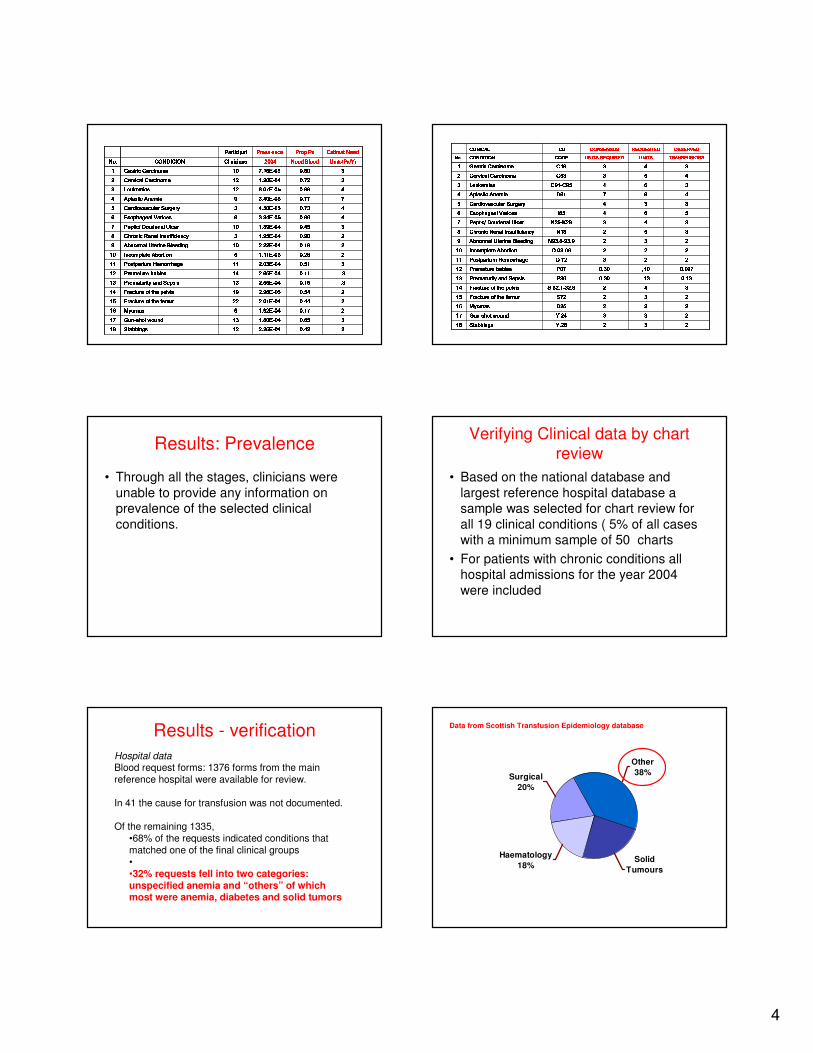
4
22220.420.420.420.422.26E2.26E2.26E2.26E----0404040412121212StabbingsStabbingsStabbingsStabbings18181818 33330.650.650.650.651.80E1.80E1.80E1.80E----0404040413131313GunGunGunGun----shot woundshot woundshot woundshot wound17171717 22220.170.170.170.171.92E1.92E1.92E1.92E----040404046666MyomasMyomasMyomasMyomas16161616 22220.440.440.440.442.01E2.01E2.01E2.01E----0404040422222222Fracture of the femurFracture of the femurFracture of the femurFracture of the femur15151515 22220.540.540.540.542.96E2.96E2.96E2.96E----0505050519191919Fracture of the pelvisFracture of the pelvisFracture of the pelvisFracture of the pelvis14141414 .3.3.3.30.150.150.150.152.55E2.55E2.55E2.55E----0404040413131313Prematurity and SepsisPrematurity and SepsisPrematurity and SepsisPrematurity and Sepsis13131313 .3.3.3.30.110.110.110.112.65E2.65E2.65E2.65E----0404040414141414Premature babiesPremature babiesPremature babiesPremature babies12121212 33330.510.510.510.512.03E2.03E2.03E2.03E----0404040411111111Postpartum HemorrhagePostpartum HemorrhagePostpartum HemorrhagePostpartum Hemorrhage11111111 22220.280.280.280.281.11E1.11E1.11E1.11E----030303036666Incomplete AbortionIncomplete AbortionIncomplete AbortionIncomplete Abortion10101010 22220.190.190.190.192.22E2.22E2.22E2.22E----0404040410101010Abnormal Uterine BleedingAbnormal Uterine BleedingAbnormal Uterine BleedingAbnormal Uterine Bleeding9999 22220.900.900.900.901.95E1.95E1.95E1.95E----040404043333Chronic Renal InsufficiencyChronic Renal InsufficiencyChronic Renal InsufficiencyChronic Renal Insufficiency8888 33330.450.450.450.451.89E1.89E1.89E1.89E----0404040410101010Peptic/ Peptic/ Peptic/ Peptic/ DoudenalDoudenalDoudenalDoudenal UlcerUlcerUlcerUlcer7777 44440.960.960.960.963.34E3.34E3.34E3.34E----050505058888Esophageal Esophageal Esophageal Esophageal VaricesVaricesVaricesVarices6666 44440.730.730.730.734.50E4.50E4.50E4.50E----050505053333Cardiovascular SurgeryCardiovascular SurgeryCardiovascular SurgeryCardiovascular Surgery5555 77770.770.770.770.773.40E3.40E3.40E3.40E----050505059999AplasticAplasticAplasticAplastic AnemiaAnemiaAnemiaAnemia4444 44440.890.890.890.898.07E8.07E8.07E8.07E----0505050512121212LeukemiasLeukemiasLeukemiasLeukemias3333 33330.720.720.720.721.20E1.20E1.20E1.20E----0404040412121212Cervical CarcinomaCervical CarcinomaCervical CarcinomaCervical Carcinoma2222 33330.800.800.800.807.16E7.16E7.16E7.16E----0505050510101010Gastric CarcinomaGastric CarcinomaGastric CarcinomaGastric Carcinoma1111 Units/Units/Units/Units/PxPxPxPx/Yr/Yr/Yr/YrNeed BloodNeed BloodNeed BloodNeed Blood2004200420042004CliniciansCliniciansCliniciansCliniciansCONDICIONCONDICIONCONDICIONCONDICIONNo.No.No.No. EstimatEstimatEstimatEstimat NeedNeedNeedNeedProp Prop Prop Prop PxPxPxPxPrevalencePrevalencePrevalencePrevalenceParticipatParticipatParticipatParticipat222233332222Y.28Y.28Y.28Y.28StabbingsStabbingsStabbingsStabbings18181818 222233333333Y.24Y.24Y.24Y.24GunGunGunGun----shot woundshot woundshot woundshot wound17171717 222233332222D25D25D25D25MyomasMyomasMyomasMyomas16161616 222233332222S72S72S72S72Fracture of the femurFracture of the femurFracture of the femurFracture of the femur15151515 333344442222S 32.1S 32.1S 32.1S 32.1----32.832.832.832.8Fracture of the pelvisFracture of the pelvisFracture of the pelvisFracture of the pelvis14141414 0.130.130.130.13.13.13.13.130.300.300.300.30P36P36P36P36Prematurity and SepsisPrematurity and SepsisPrematurity and SepsisPrematurity and Sepsis13131313 0.0970.0970.0970.097,10,10,10,100.300.300.300.30P07P07P07P07Premature babiesPremature babiesPremature babiesPremature babies12121212 222222223333O 72O 72O 72O 72Postpartum HemorrhagePostpartum HemorrhagePostpartum HemorrhagePostpartum Hemorrhage11111111 222222222222O 03O 03O 03O 03----06060606Incomplete AbortionIncomplete AbortionIncomplete AbortionIncomplete Abortion10101010 222233332222N93.8N93.8N93.8N93.8----93.993.993.993.9Abnormal Uterine BleedingAbnormal Uterine BleedingAbnormal Uterine BleedingAbnormal Uterine Bleeding9999 333355552222N18N18N18N18Chronic Renal InsufficiencyChronic Renal InsufficiencyChronic Renal InsufficiencyChronic Renal Insufficiency8888 333344443333K25K25K25K25----K29K29K29K29Peptic/ Peptic/ Peptic/ Peptic/ DoudenalDoudenalDoudenalDoudenal UlcerUlcerUlcerUlcer7777 555566664444I85I85I85I85Esophageal Esophageal Esophageal Esophageal VaricesVaricesVaricesVarices6666 333333334444Cardiovascular SurgeryCardiovascular SurgeryCardiovascular SurgeryCardiovascular Surgery5555 444488887777D61D61D61D61AplasticAplasticAplasticAplastic AnemiaAnemiaAnemiaAnemia4444 333366664444C91C91C91C91----C95C95C95C95LeukemiasLeukemiasLeukemiasLeukemias3333 444455553333C53C53C53C53Cervical CarcinomaCervical CarcinomaCervical CarcinomaCervical Carcinoma2222 333344443333C16C16C16C16Gastric CarcinomaGastric CarcinomaGastric CarcinomaGastric Carcinoma1111 TRANSFUSIONSTRANSFUSIONSTRANSFUSIONSTRANSFUSIONSUNITS UNITS UNITS UNITS UNITS REQUIREDUNITS REQUIREDUNITS REQUIREDUNITS REQUIREDCODECODECODECODECONDITIONCONDITIONCONDITIONCONDITIONNo.No.No.No. OBSERVEDOBSERVEDOBSERVEDOBSERVEDREQUESTEDREQUESTEDREQUESTEDREQUESTEDCONSENSUSCONSENSUSCONSENSUSCONSENSUSICDICDICDICDCLINICALCLINICALCLINICALCLINICAL
Results: Prevalence
• Through all the stages, clinicians were
unable to provide any information on prevalence of the selected clinical
conditions.
Verifying Clinical data by chart review
• Based on the national database and
largest reference hospital database a sample was selected for chart review for
all 19 clinical conditions ( 5% of all cases with a minimum sample of 50 charts
• For patients with chronic conditions all hospital admissions for the year 2004
were included
Results - verification
Hospital dataBlood request forms: 1376 forms from the main reference hospital were available for review.
In 41 the cause for transfusion was not documented.
Of the remaining 1335, •68% of the requests indicated conditions that matched one of the final clinical groups••32% requests fell into two categories: unspecified anemia and “others” of which most were anemia, diabetes and solid tumors
Data from Scottish Transfusion Epidemiology database
Other
38%
Solid
Tumours
Surgical
20%
Haematology
18%
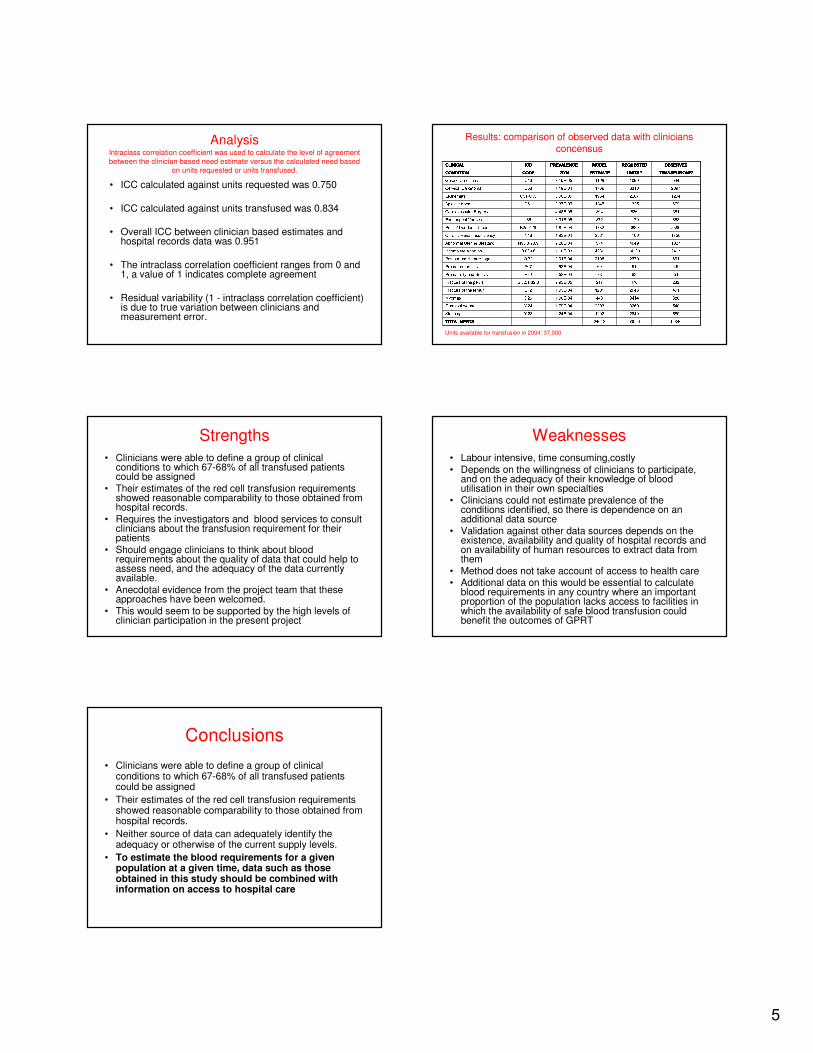
5
AnalysisIntraclass correlation coefficient was used to calculate the level of agreement
between the clinician based need estimate versus the calculated need based on units requested or units transfused.
• ICC calculated against units requested was 0.750
• ICC calculated against units transfused was 0.834
• Overall ICC between clinician based estimates and hospital records data was 0.951
• The intraclass correlation coefficient ranges from 0 and 1, a value of 1 indicates complete agreement
• Residual variability (1 - intraclass correlation coefficient) is due to true variation between clinicians and measurement error.
Results: comparison of observed data with cliniciansconcensus
168465050924612TOTAL NEEDSTOTAL NEEDSTOTAL NEEDSTOTAL NEEDS 580264012922.24E-04Y.28Stabbings 540326923931.79E-04Y.24Gun-shot wound 88634144431.90E-04D25Myomas 491204812011.99E-04S72Fracture of the femur 2324702172.93E-05S 32.1-32.8Fracture of the pelvis 5163782.53E-04P36Prematurity and Sepsis 4551602.63E-04P07Premature babies 661237021082.01E-04O 72Postpartum Hemorrhage 24171420042301.10E-03O 03-06Incomplete Abortion 102740495742.20E-04N93.8-93.9Abnormal Uterine Bleeding 1756410023811.93E-04N18Chronic Renal Insufficiency 2386388917321.87E-04K25-K29Peptic/ Doudenal Ulcer 86811798723.31E-05I85Esophageal Varices 3818268944.46E-05Cardiovascular Surgery 679132512453.37E-05D61Aplastic Anemia 1204220719548.00E-05C91-C95Leukemias 2097331017691.19E-04C53Cervical Carcinoma 544109911697.10E-05C16Gastric Carcinoma TRANSFUSIONS*TRANSFUSIONS*TRANSFUSIONS*TRANSFUSIONS*UNITS *UNITS *UNITS *UNITS *ESTIMATEESTIMATEESTIMATEESTIMATE2004200420042004CODECODECODECODECONDITIONCONDITIONCONDITIONCONDITION OBSERVEDOBSERVEDOBSERVEDOBSERVEDREQUESTEDREQUESTEDREQUESTEDREQUESTEDMODEL MODEL MODEL MODEL PREVALENCEPREVALENCEPREVALENCEPREVALENCEICDICDICDICDCLINICALCLINICALCLINICALCLINICALUnits available for transfusion in 2004: 37,000
Strengths
• Clinicians were able to define a group of clinical conditions to which 67-68% of all transfused patients could be assigned
• Their estimates of the red cell transfusion requirements showed reasonable comparability to those obtained from hospital records.
• Requires the investigators and blood services to consult clinicians about the transfusion requirement for their patients
• Should engage clinicians to think about blood requirements about the quality of data that could help to assess need, and the adequacy of the data currently available.
• Anecdotal evidence from the project team that these approaches have been welcomed.
• This would seem to be supported by the high levels of clinician participation in the present project
Weaknesses
• Labour intensive, time consuming,costly• Depends on the willingness of clinicians to participate,
and on the adequacy of their knowledge of blood utilisation in their own specialties
• Clinicians could not estimate prevalence of the conditions identified, so there is dependence on an additional data source
• Validation against other data sources depends on the existence, availability and quality of hospital records and on availability of human resources to extract data from them
• Method does not take account of access to health care• Additional data on this would be essential to calculate
blood requirements in any country where an important proportion of the population lacks access to facilities in which the availability of safe blood transfusion could benefit the outcomes of GPRT
Conclusions
• Clinicians were able to define a group of clinical conditions to which 67-68% of all transfused patients could be assigned
• Their estimates of the red cell transfusion requirements showed reasonable comparability to those obtained from hospital records.
• Neither source of data can adequately identify the adequacy or otherwise of the current supply levels.
• To estimate the blood requirements for a given population at a given time, data such as those obtained in this study should be combined with information on access to hospital care
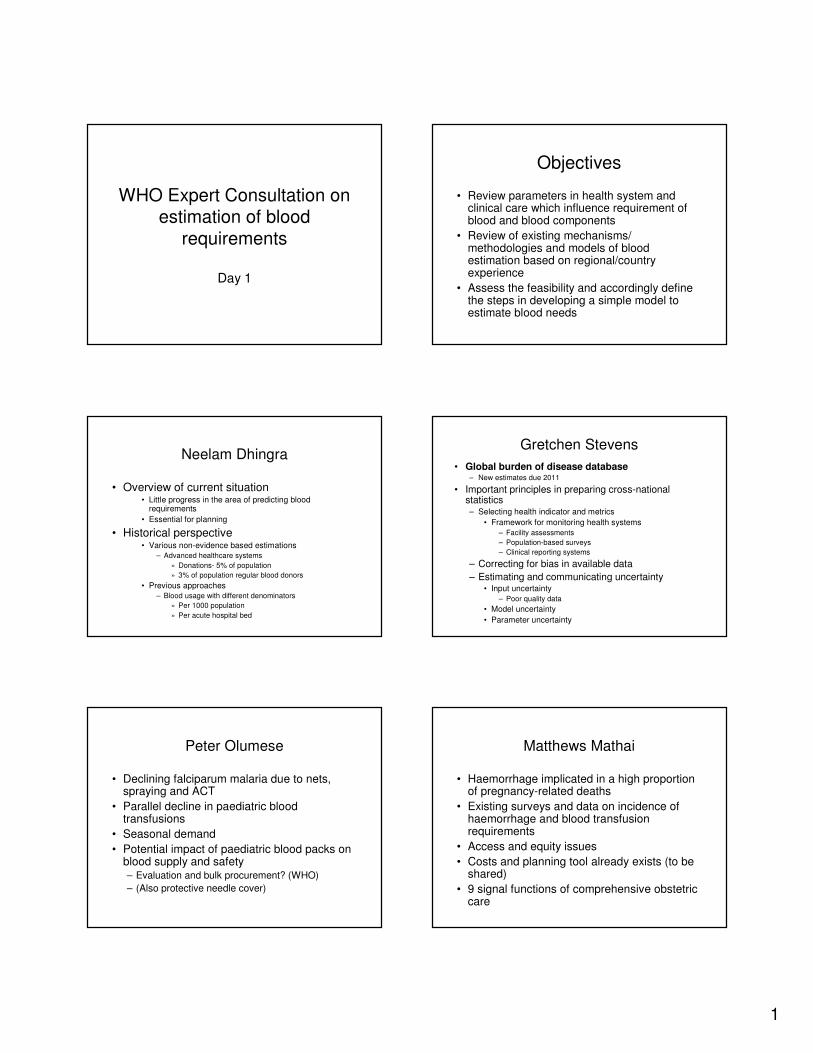
1
WHO Expert Consultation on estimation of blood
requirements
Day 1
Objectives
• Review parameters in health system and clinical care which influence requirement of blood and blood components
• Review of existing mechanisms/ methodologies and models of blood estimation based on regional/country experience
• Assess the feasibility and accordingly define the steps in developing a simple model to estimate blood needs
Neelam Dhingra
• Overview of current situation• Little progress in the area of predicting blood
requirements
• Essential for planning
• Historical perspective• Various non-evidence based estimations
– Advanced healthcare systems
» Donations- 5% of population
» 3% of population regular blood donors
• Previous approaches
– Blood usage with different denominators
» Per 1000 population
» Per acute hospital bed
Gretchen Stevens
• Global burden of disease database– New estimates due 2011
• Important principles in preparing cross-national statistics– Selecting health indicator and metrics
• Framework for monitoring health systems
– Facility assessments
– Population-based surveys
– Clinical reporting systems
– Correcting for bias in available data
– Estimating and communicating uncertainty• Input uncertainty
– Poor quality data
• Model uncertainty
• Parameter uncertainty
Peter Olumese
• Declining falciparum malaria due to nets, spraying and ACT
• Parallel decline in paediatric blood transfusions
• Seasonal demand
• Potential impact of paediatric blood packs on blood supply and safety– Evaluation and bulk procurement? (WHO)
– (Also protective needle cover)
Matthews Mathai
• Haemorrhage implicated in a high proportion of pregnancy-related deaths
• Existing surveys and data on incidence of haemorrhage and blood transfusion requirements
• Access and equity issues
• Costs and planning tool already exists (to be shared)
• 9 signal functions of comprehensive obstetric care
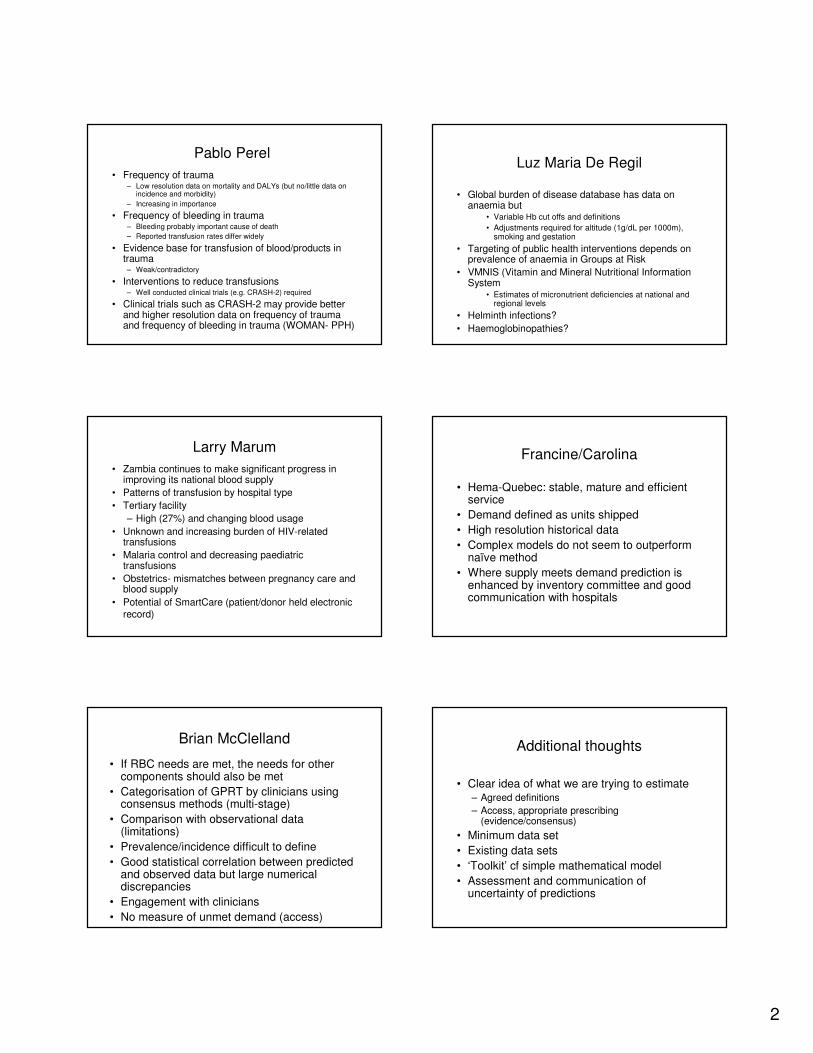
2
Pablo Perel
• Frequency of trauma– Low resolution data on mortality and DALYs (but no/little data on
incidence and morbidity)
– Increasing in importance
• Frequency of bleeding in trauma– Bleeding probably important cause of death
– Reported transfusion rates differ widely
• Evidence base for transfusion of blood/products in trauma– Weak/contradictory
• Interventions to reduce transfusions– Well conducted clinical trials (e.g. CRASH-2) required
• Clinical trials such as CRASH-2 may provide better and higher resolution data on frequency of trauma and frequency of bleeding in trauma (WOMAN- PPH)
Luz Maria De Regil
• Global burden of disease database has data on anaemia but
• Variable Hb cut offs and definitions
• Adjustments required for altitude (1g/dL per 1000m), smoking and gestation
• Targeting of public health interventions depends on prevalence of anaemia in Groups at Risk
• VMNIS (Vitamin and Mineral Nutritional Information System
• Estimates of micronutrient deficiencies at national and regional levels
• Helminth infections?
• Haemoglobinopathies?
Larry Marum
• Zambia continues to make significant progress in improving its national blood supply
• Patterns of transfusion by hospital type
• Tertiary facility
– High (27%) and changing blood usage
• Unknown and increasing burden of HIV-related transfusions
• Malaria control and decreasing paediatric transfusions
• Obstetrics- mismatches between pregnancy care and blood supply
• Potential of SmartCare (patient/donor held electronic
record)
Francine/Carolina
• Hema-Quebec: stable, mature and efficient service
• Demand defined as units shipped
• High resolution historical data
• Complex models do not seem to outperform naïve method
• Where supply meets demand prediction is enhanced by inventory committee and good communication with hospitals
Brian McClelland
• If RBC needs are met, the needs for other components should also be met
• Categorisation of GPRT by clinicians using consensus methods (multi-stage)
• Comparison with observational data (limitations)
• Prevalence/incidence difficult to define
• Good statistical correlation between predicted and observed data but large numerical discrepancies
• Engagement with clinicians
• No measure of unmet demand (access)
Additional thoughts
• Clear idea of what we are trying to estimate– Agreed definitions
– Access, appropriate prescribing (evidence/consensus)
• Minimum data set
• Existing data sets
• ‘Toolkit’ cf simple mathematical model
• Assessment and communication of uncertainty of predictions
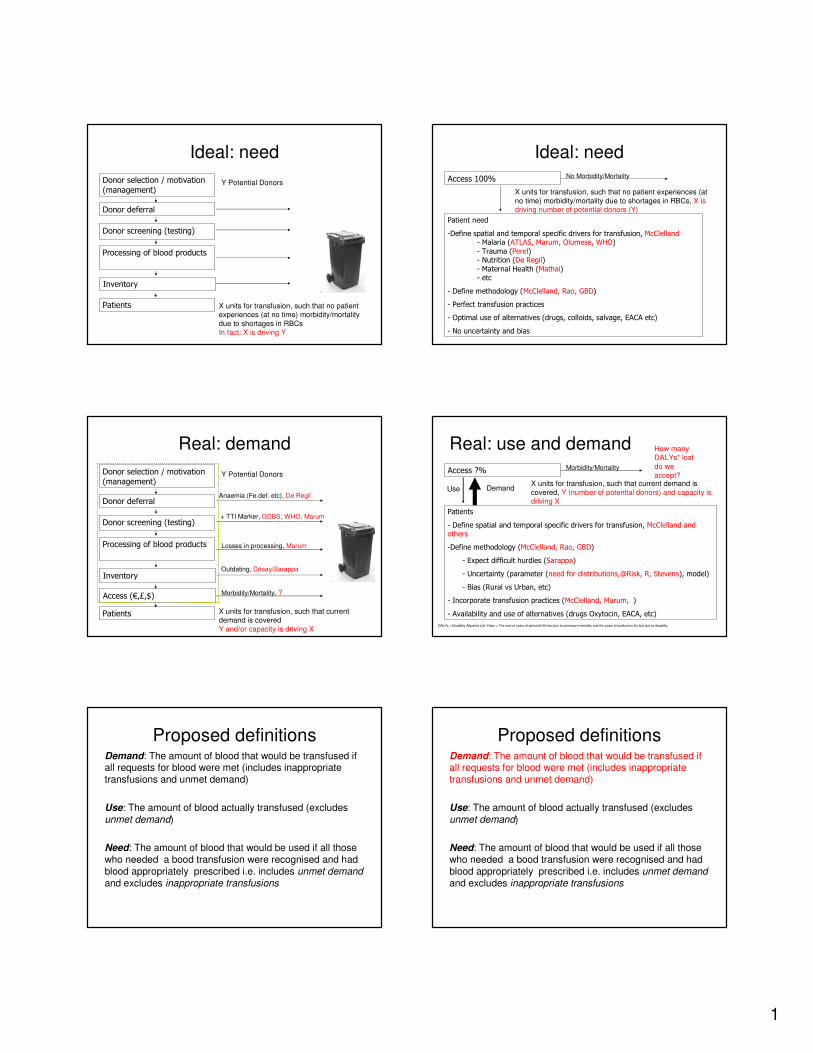
1
Ideal: need
Donor selection / motivation (management)
Donor deferral
Donor screening (testing)
Processing of blood products
Patients
Inventory
Y Potential Donors
X units for transfusion, such that no patient experiences (at no time) morbidity/mortality
due to shortages in RBCsIn fact: X is driving Y
Ideal: need
Patient need
-Define spatial and temporal specific drivers for transfusion, McClelland- Malaria (ATLAS, Marum, Olumese, WHO)- Trauma (Perel)- Nutrition (De Regil)- Maternal Health (Mathai)- etc
- Define methodology (McClelland, Rao, GBD)
- Perfect transfusion practices
- Optimal use of alternatives (drugs, colloids, salvage, EACA etc)
- No uncertainty and bias
X units for transfusion, such that no patient experiences (at
no time) morbidity/mortality due to shortages in RBCs, X is driving number of potential donors (Y)
Access 100% No Morbidity/Mortality
Real: demand
Donor selection / motivation (management)
Donor deferral
Donor screening (testing)
Processing of blood products
Patients
Inventory
Y Potential Donors
X units for transfusion, such that current demand is covered
Y and/or capacity is driving X
Anaemia (Fe def. etc), De Regil
+ TTI Marker, GDBS; WHO, Marum
Losses in processing, Marum
Outdating, Décay/Sarappa
Access (€,£,$) Morbidity/Mortality, ?
Real: use and demand
Patients
- Define spatial and temporal specific drivers for transfusion, McClelland and others
-Define methodology (McClelland, Rao, GBD)
- Expect difficult hurdles (Sarappa)
- Uncertainty (parameter (need for distributions,@Risk, R, Stevens), model)
- Bias (Rural vs Urban, etc)
- Incorporate transfusion practices (McClelland, Marum, )
- Availability and use of alternatives (drugs Oxytocin, EACA, etc)
X units for transfusion, such that current demand is
covered, Y (number of potential donors) and capacity is driving X
Access ?% Morbidity/Mortality
How many DALYs* lost
do we
accept?
DALYs = Disability Adjusted Life Years = The sum of years of potential life lost due to premature mortality and the years of productive life lost due to disability.
Use Demand
Proposed definitionsDemand: The amount of blood that would be transfused if all requests for blood were met (includes inappropriate transfusions and unmet demand)
Use: The amount of blood actually transfused (excludes unmet demand)
Need: The amount of blood that would be used if all those who needed a bood transfusion were recognised and had blood appropriately prescribed i.e. includes unmet demandand excludes inappropriate transfusions
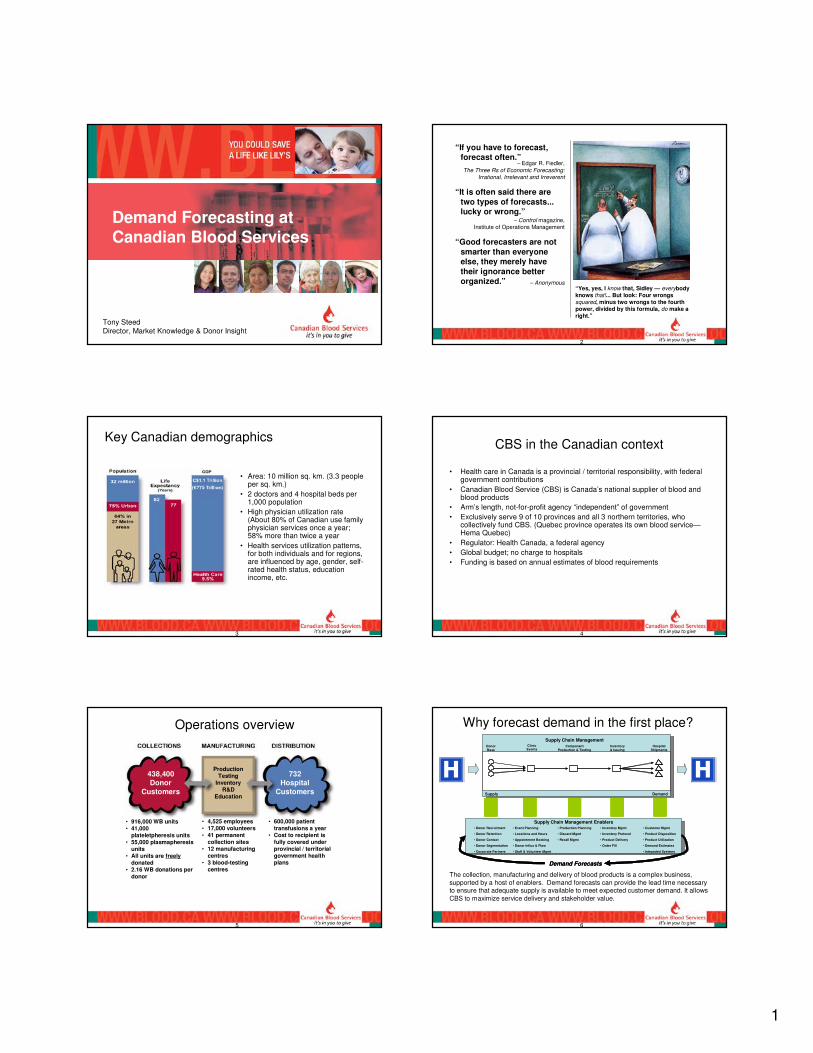
1
1
Demand Forecasting atCanadian Blood Services
Tony SteedDirector, Market Knowledge & Donor Insight
2
Co
pyrig
ht ©
20
03
Fa
rWorks
Inc.
“Yes, yes, I know that, Sidley — everybody knows that!... But look: Four wrongs squared, minus two wrongs to the fourth power, divided by this formula, do make a right.”
“If you have to forecast, forecast often.”
– Edgar R. Fiedler,
The Three Rs of Economic Forecasting: Irrational, Irrelevant and Irreverent
“It is often said there are
two types of forecasts... lucky or wrong.”
– Control magazine, Institute of Operations Management
“Good forecasters are not
smarter than everyone else, they merely have
their ignorance better organized.” – Anonymous
3
Key Canadian demographics
• Area: 10 million sq. km. (3.3 people per sq. km.)
• 2 doctors and 4 hospital beds per 1,000 population
• High physician utilization rate (About 80% of Canadian use family physician services once a year; 58% more than twice a year
• Health services utilization patterns, for both individuals and for regions, are influenced by age, gender, self-rated health status, education income, etc.
4
CBS in the Canadian context
• Health care in Canada is a provincial / territorial responsibility, with federal government contributions
• Canadian Blood Service (CBS) is Canada’s national supplier of blood and blood products
• Arm’s length, not-for-profit agency “independent” of government
• Exclusively serve 9 of 10 provinces and all 3 northern territories, who collectively fund CBS. (Quebec province operates its own blood service—Hema Quebec)
• Regulator: Health Canada, a federal agency
• Global budget; no charge to hospitals
• Funding is based on annual estimates of blood requirements
5
438,400Donor
Customers
732Hospital
Customers
ProductionTesting
InventoryR&D
Education
• 916,000 WB units• 41,000
plateletpheresis units • 55,000 plasmapheresis
units • All units are freely
donated• 2.16 WB donations per
donor
• 600,000 patient transfusions a year
• Cost to recipient is fully covered under provincial / territorial government health plans
• 4,525 employees• 17,000 volunteers• 41 permanent
collection sites• 12 manufacturing
centres• 3 blood-testing
centres
Operations overview
6
Why forecast demand in the first place?
The collection, manufacturing and delivery of blood products is a complex business,
supported by a host of enablers. Demand forecasts can provide the lead time necessary to ensure that adequate supply is available to meet expected customer demand. It allows
CBS to maximize service delivery and stakeholder value.
Supply Chain Management Enablers
Donor Base
Clinic Events
Component Production & Testing
Inventory & Issuing
Hospital Shipments
Supply Chain Management
Supply Demand
Demand Forecasts
• Donor Recruitment
• Donor Retention
• Donor Contact
• Donor Segmentation
• Corporate Partners
• Event Planning
• Locations and Hours
• Appointment Booking
• Donor Influx & Flow
• Staff & Volunteer Mgmt
• Customer Mgmt
• Product Disposition
• Product Utilization
• Demand Estimates
• Integrated Systems
• Inventory Mgmt
• Inventory Protocol
• Product Delivery
• Order Fill
• Production Planning
• Discard Mgmt
• Recall Mgmt
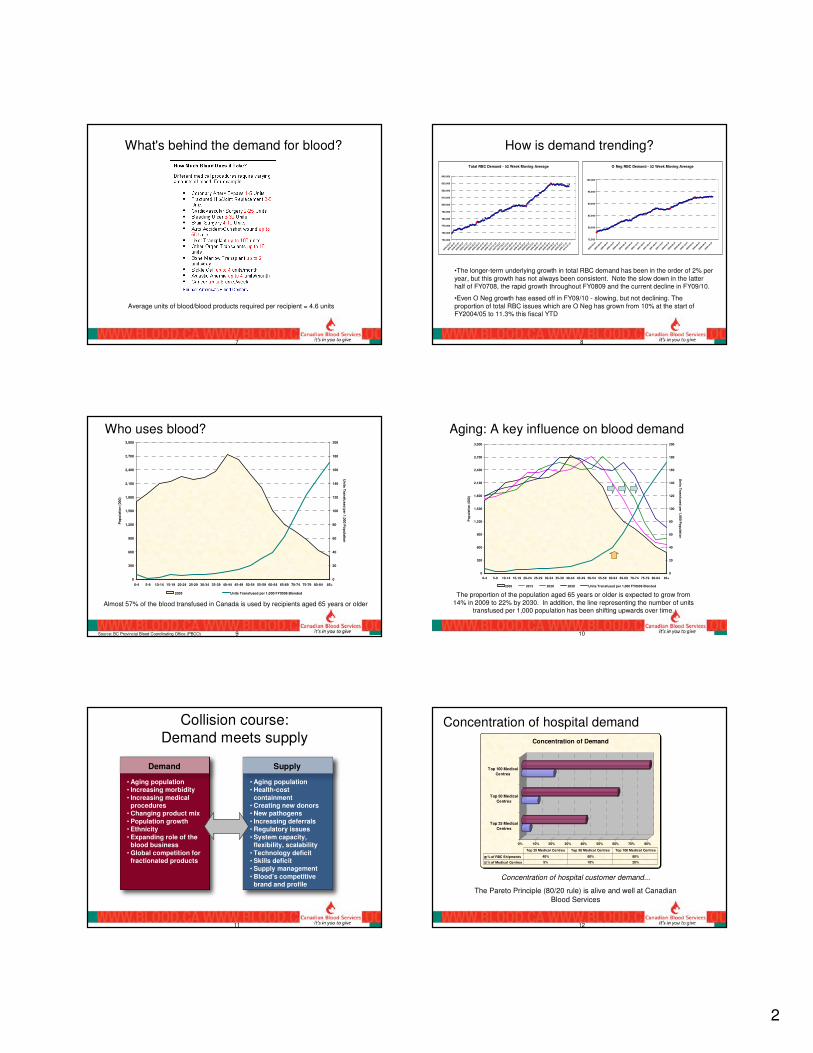
2
7
What's behind the demand for blood?
Average units of blood/blood products required per recipient = 4.6 units
8
How is demand trending?
Total RBC Demand - 52 Week Moving Average
750,000
760,000
770,000
780,000
790,000
800,000
810,000
820,000
830,000
840,000
2005
-03-
27
2005
-05-
27
2005
-07-
27
2005
-09-
27
2005
-11-
27
2006
-01-
27
2006
-03-
27
2006
-05-
27
2006
-07-
27
2006
-09-
27
2006
-11-
27
2007
-01-
27
2007
-03-
27
2007
-05-
27
2007
-07-
27
2007
-09-
27
2007
-11-
27
2008
-01-
27
2008
-03-
27
2008
-05-
27
2008
-07-
27
2008
-09-
27
2008
-11-
27
2009
-01-
27
2009
-03-
27
2009
-05-
27
2009
-07-
27
2009
-09-
27
2009
-11-
27
2010
-01-
27
O Neg RBC Demand - 52 Week Moving Average
75,000
80,000
85,000
90,000
95,000
100,000
2005
-03-
27
2005
-06-
27
2005
-09-
27
2005
-12-
27
2006
-03-
27
2006
-06-
27
2006
-09-
27
2006
-12-
27
2007
-03-
27
2007
-06-
27
2007
-09-
27
2007
-12-
27
2008
-03-
27
2008
-06-
27
2008
-09-
27
2008
-12-
27
2009
-03-
27
2009
-06-
27
2009
-09-
27
2009
-12-
27
•The longer-term underlying growth in total RBC demand has been in the order of 2% per
year, but this growth has not always been consistent. Note the slow down in the latter half of FY0708, the rapid growth throughout FY0809 and the current decline in FY09/10.
•Even O Neg growth has eased off in FY09/10 - slowing, but not declining. The
proportion of total RBC issues which are O Neg has grown from 10% at the start of FY2004/05 to 11.3% this fiscal YTD
9
Almost 57% of the blood transfused in Canada is used by recipients aged 65 years or older
Who uses blood?
0
300
600
900
1,200
1,500
1,800
2,100
2,400
2,700
3,000
0-4 5-9 10-14 15-19 20-24 25-29 30-34 35-39 40-44 45-49 50-54 55-59 60-64 65-69 70-74 75-79 80-84 85+
Po
pu
lati
on
(000)
0
20
40
60
80
100
120
140
160
180
200
Un
its T
ran
sfu
sed
per 1
,000 P
op
ula
tion
2005 Units Transfused per 1,000 FY0506 Blended
Source: BC Provincial Blood Coordinating Office (PBCO) 10
The proportion of the population aged 65 years or older is expected to grow from
14% in 2009 to 22% by 2030. In addition, the line representing the number of units transfused per 1,000 population has been shifting upwards over time.
Aging: A key influence on blood demand
0
300
600
900
1,200
1,500
1,800
2,100
2,400
2,700
3,000
0-4 5-9 10-14 15-19 20-24 25-29 30-34 35-39 40-44 45-49 50-54 55-59 60-64 65-69 70-74 75-79 80-84 85+
Po
pu
lati
on
(000
)
0
20
40
60
80
100
120
140
160
180
200
Un
its T
ran
sfu
sed
per 1
,00
0 P
op
ula
tion
2005 2013 2020 2030 Units Transfused per 1,000 FY0506 Blended
11
Collision course:
Demand meets supply
Supply
• Aging population• Health-cost
containment• Creating new donors• New pathogens
• Increasing deferrals• Regulatory issues
• System capacity, flexibility, scalability
• Technology deficit• Skills deficit• Supply management
• Blood’s competitive brand and profile
Demand
• Aging population• Increasing morbidity
• Increasing medical procedures
• Changing product mix
• Population growth• Ethnicity
• Expanding role of the blood business
• Global competition for fractionated products
12
Concentration of hospital demand
Concentration of hospital customer demand...
The Pareto Principle (80/20 rule) is alive and well at Canadian
Blood Services
0% 10% 20% 30% 40% 50% 60% 70% 80%
Top 25 Medical
Centres
Top 50 Medical
Centres
Top 100 Medical
Centres
Concentration of Demand
% of RBC Shipments 40% 60% 80%
% of Medical Centres 5% 10% 20%
Top 25 Medical Centres Top 50 Medical Centres Top 100 Medical Centres
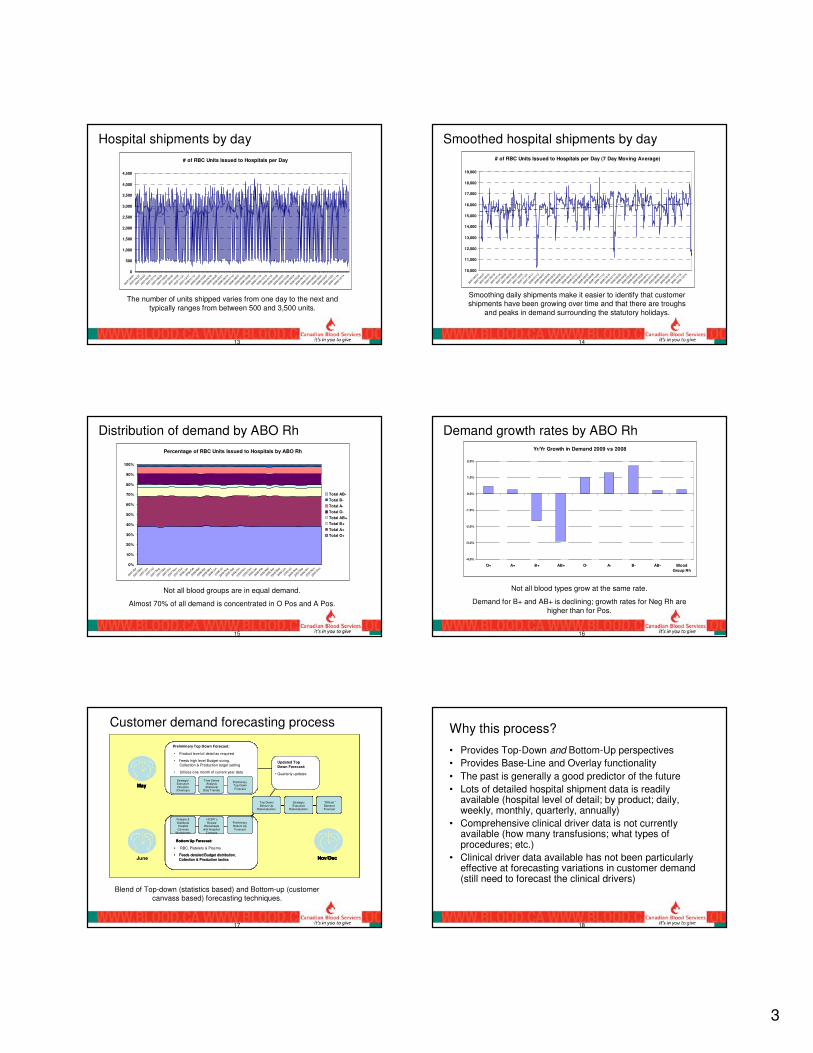
3
13
Hospital shipments by day
The number of units shipped varies from one day to the next and
typically ranges from between 500 and 3,500 units.
# of RBC Units Issued to Hospitals per Day
0
500
1,000
1,500
2,000
2,500
3,000
3,500
4,000
4,500
2007
/04/
01
2007
/04/
27
2007
/05/23
2007
/06/
18
2007
/07/
14
2007
/08/
09
2007
/09/
04
2007
/09/
30
2007
/10/
26
2007
/11/21
2007
/12/
17
2008
/01/
12
2008
/02/
07
2008
/03/
04
2008
/03/
30
2008
/04/
25
2008
/05/21
2008
/06/
16
2008
/07/
12
2008
/08/07
2008
/09/
02
2008
/09/
28
2008
/10/
24
2008
/11/
19
2008
/12/
15
2009
/01/
10
2009
/02/
05
2009
/03/
03
2009
/03/29
2009
/04/24
2009
/05/
20
2009
/06/
15
2009
/07/
11
2009
/08/
06
2009
/09/
01
2009
/09/
27
2009
/10/
23
2009
/11/
18
2009
/12/14
14
Smoothed hospital shipments by day
Smoothing daily shipments make it easier to identify that customer shipments have been growing over time and that there are troughs
and peaks in demand surrounding the statutory holidays.
# of RBC Units Issued to Hospitals per Day (7 Day Moving Average)
10,000
11,000
12,000
13,000
14,000
15,000
16,000
17,000
18,000
19,000
2007
/04/
01
2007
/04/
27
2007
/05/23
2007
/06/
18
2007
/07/
14
2007
/08/09
2007
/09/
04
2007
/09/
30
2007
/10/26
2007
/11/21
2007
/12/
17
2008
/01/12
2008
/02/07
2008
/03/
04
2008
/03/
30
2008
/04/25
2008
/05/
21
2008
/06/
16
2008
/07/12
2008
/08/07
2008
/09/
02
2008
/09/28
2008
/10/24
2008
/11/
19
2008
/12/
15
2009
/01/10
2009
/02/
05
2009
/03/
03
2009
/03/29
2009
/04/24
2009
/05/
20
2009
/06/15
2009
/07/11
2009
/08/
06
2009
/09/
01
2009
/09/27
2009
/10/
23
2009
/11/
18
2009
/12/14
15
Distribution of demand by ABO Rh
Not all blood groups are in equal demand.
Almost 70% of all demand is concentrated in O Pos and A Pos.
Percentage of RBC Units Issued to Hospitals by ABO Rh
0%
10%
20%
30%
40%
50%
60%
70%
80%
90%
100%
2007
/Apr
2007
/May
2007
/Jun
2007
/Jul
2007
/Aug
2007
/Sep
2007
/Oct
2007
/Nov
2007
/Dec
2008
/Jan
2008
/Feb
2008
/Mar
2008
/Apr
2008
/May
2008
/Jun
2008
/Jul
2008
/Aug
2008
/Sep
2008
/Oct
2008
/Nov
2008
/Dec
2009
/Jan
2009
/Feb
2009
/Mar
2009
/Apr
2009
/May
2009
/Jun
2009
/Jul
2009
/Aug
2009
/Sep
2009
/Oct
2009
/Nov
2009
/Dec
Total AB-
Total B-
Total A-
Total O-
Total AB+
Total B+
Total A+
Total O+
16
Demand growth rates by ABO Rh
Not all blood types grow at the same rate.
Demand for B+ and AB+ is declining; growth rates for Neg Rh are
higher than for Pos.
Yr/Yr Growth in Demand 2009 vs 2008
-4.0%
-3.0%
-2.0%
-1.0%
0.0%
1.0%
2.0%
O+ A+ B+ AB+ O- A- B- AB- Blood
Group Rh
17
Customer demand forecasting process
Blend of Top-down (statistics based) and Bottom-up (customer canvass based) forecasting techniques.
May
June & Nov Nov/Dec
• Feeds high level Budget sizing,
Collection & Production target setting
• Utilizes two months of current year data
Preliminary Top Down
Forecast
Preliminary Bottom Up Forecast
Top Down/ Bottom Up
Rationalization
“Official ”Demand Forecast
Prepare &
Distribute Hospital Canvass
Worksheets
HCSR ’s
Review Worksheets
with Hospital Contacts
Strategic/ Executive Direction
(Overlays)
Time Series Analysis
(Historical Data Trends)
Strategic/ Executive
Rationalization
Bottom Up Forecast:
• RBC, Platelets & Plasma
• Feeds detailed Budget distribution,
Collection & Production tactics
Utilizes six months current year data
Top Down Forecast:
• Product level of detail as required
• Feeds high level Budget sizing,
Collection & Production target setting
• Utilizes one month of current year data
Preliminary Top Down
Forecast
Preliminary Bottom Up Forecast
Top Down/ Bottom Up
Rationalization
“Official ”Demand Forecast
Prepare &
Distribute Hospital Canvass
Worksheets
HCSR ’s
Review Worksheets
with Hospital Contacts
Strategic/ Executive Direction
(Overlays)
Time Series Analysis
(Historical Data Trends)
Strategic/ Executive
Rationalization
Bottom Up Forecast:
•
• Feeds detailed Budget distribution,
Collection & Production tactics
Preliminary Top Down Forecast:
• Product level of detail as required
Updated Top
Down Forecast:
• Quarterly updates
May
Ju Nov/Dec
• Feeds high level Budget sizing,
Collection & Production target setting
• Utilizes two months of current year data
Preliminary Top Down
Forecast
Preliminary Bottom Up Forecast
Top Down/ Bottom Up
Rationalization
“Official ”Demand Forecast
Prepare &
Distribute Hospital Canvass
Worksheets
HCSR ’s
Review Worksheets
with Hospital Contacts
Strategic/ Executive Direction
(Overlays)
Time Series Analysis
(Historical Data Trends)
Strategic/ Executive
Rationalization
Bottom Up Forecast:
• RBC, Platelets & Plasma
• Feeds detailed Budget distribution,
Collection & Production tactics
Utilizes six months current year data
Top Down Forecast:
• Product level of detail as required
• Feeds high level Budget sizing,
Collection & Production target setting
• Utilizes one month of current year data
Preliminary Top Down
Forecast
Preliminary Bottom Up Forecast
Top Down/ Bottom Up
Rationalization
“Official ”Demand Forecast
Prepare &
Distribute Hospital Canvass
Worksheets
HCSR ’s
Review Worksheets
with Hospital Contacts
Strategic/ Executive Direction
(Overlays)
Time Series Analysis
(Historical Data Trends)
Strategic/ Executive
Rationalization
Preliminary Top Down
Forecast
Preliminary Bottom Up Forecast
Top Down/ Bottom Up
Rationalization
“Official ”Demand Forecast
Prepare &
Distribute Hospital Canvass
Worksheets
HCSR ’s
Review Worksheets
with Hospital Contacts
Strategic/ Executive Direction
(Overlays)
Time Series Analysis
(Historical Data Trends)
Strategic/ Executive
Rationalization
Bottom Up Forecast:
•
• Feeds detailed Budget distribution,
Collection & Production tactics
Preliminary Top Down Forecast:
• Product level of detail as required
Updated Top
Down Forecast:
• Quarterly updates
May
June Nov/Dec
• Feeds high level Budget sizing,
Collection & Production target setting
• Utilizes two months of current year data
Preliminary Top Down
Forecast
Preliminary Bottom Up Forecast
Top Down/ Bottom Up
Rationalization
“Official ”Demand Forecast
Prepare &
Distribute Hospital Canvass
Worksheets
HCSR ’s
Review Worksheets
with Hospital Contacts
Strategic/ Executive Direction
(Overlays)
Time Series Analysis
(Historical Data Trends)
Strategic/ Executive
Rationalization
Bottom Up Forecast:
• RBC, Platelets & Plasma
• Feeds detailed Budget distribution,
Collection & Production tactics
Utilizes six months current year data
Top Down Forecast:
• Product level of detail as required
• Feeds high level Budget sizing,
Collection & Production target setting
• Utilizes one month of current year data
Preliminary Top Down
Forecast
Preliminary Bottom Up Forecast
Top Down/ Bottom Up
Rationalization
“Official ”Demand Forecast
Prepare &
Distribute Hospital Canvass
Worksheets
HCSR ’s
Review Worksheets
with Hospital Contacts
Strategic/ Executive Direction
(Overlays)
Time Series Analysis
(Historical Data Trends)
Strategic/ Executive
Rationalization
Preliminary Top Down
Forecast
Preliminary Bottom Up Forecast
Top Down/ Bottom Up
Rationalization
“Official ”Demand Forecast
Prepare &
Distribute Hospital Canvass
Worksheets
HCSR ’s
Review Worksheets
with Hospital Contacts
May
Nov/Dec
• Feeds high level Budget sizing,
Collection & Production target setting
• Utilizes two months of current year data
Preliminary Top Down
Forecast
Preliminary Bottom Up Forecast
Top Down/ Bottom Up
Rationalization
“Official ”Demand Forecast
Prepare &
Distribute Hospital Canvass
Worksheets
HCSR ’s
Review Worksheets
with Hospital Contacts
Strategic/ Executive Direction
(Overlays)
Time Series Analysis
(Historical Data Trends)
Strategic/ Executive
Rationalization
Bottom Up Forecast:
• RBC, Platelets & Plasma
• Feeds detailed Budget distribution,
Collection & Production tactics
Utilizes six months current year data
Top Down Forecast:
• Product level of detail as required
• Feeds high level Budget sizing,
Collection & Production target setting
• Utilizes one month of current year data
Preliminary Top Down
Forecast
Preliminary Bottom Up Forecast
Top Down/ Bottom Up
Rationalization
“Official ”Demand Forecast
Prepare &
Distribute Hospital Canvass
Worksheets
HCSR ’s
Review Worksheets
with Hospital Contacts
Strategic/ Executive Direction
(Overlays)
Time Series Analysis
(Historical Data Trends)
Strategic/ Executive
Rationalization
Preliminary Top Down
Forecast
Preliminary Bottom Up Forecast
Top Down/ Bottom Up
Rationalization
“Official ”Demand Forecast
Prepare &
Distribute Hospital Canvass
Worksheets
HCSR ’s
Review Worksheets
with Hospital Contacts
Strategic/ Executive Direction
(Overlays)
Time Series Analysis
(Historical Data Trends)
Strategic/ Executive
Rationalization
Bottom Up Forecast:
•
• Feeds detailed Budget distribution,
Collection & Production tactics
Preliminary Top Down Forecast:
• Product level of detail as required
Updated Top
Down Forecast:
• Quarterly updates
18
Why this process?
• Provides Top-Down and Bottom-Up perspectives
• Provides Base-Line and Overlay functionality
• The past is generally a good predictor of the future
• Lots of detailed hospital shipment data is readily available (hospital level of detail; by product; daily, weekly, monthly, quarterly, annually)
• Comprehensive clinical driver data is not currently available (how many transfusions; what types of procedures; etc.)
• Clinical driver data available has not been particularly effective at forecasting variations in customer demand (still need to forecast the clinical drivers)
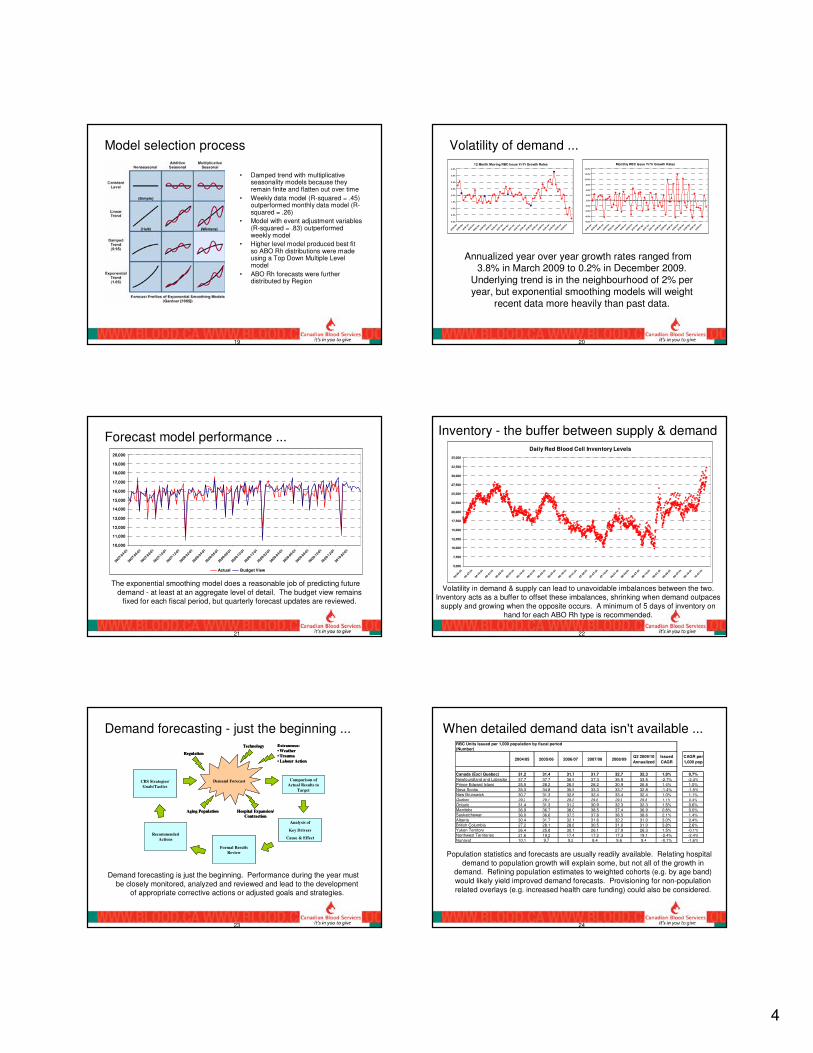
4
19
Model selection process
• Damped trend with multiplicative seasonality models because they remain finite and flatten out over time
• Weekly data model (R-squared = .45) outperformed monthly data model (R-squared = .26)
• Model with event adjustment variables (R-squared = .83) outperformed weekly model
• Higher level model produced best fit so ABO Rh distributions were made using a Top Down Multiple Level model
• ABO Rh forecasts were further distributed by Region
20
Volatility of demand ...
Annualized year over year growth rates ranged from 3.8% in March 2009 to 0.2% in December 2009.
Underlying trend is in the neighbourhood of 2% per year, but exponential smoothing models will weight
recent data more heavily than past data.
12 Month Moving RBC Issue Yr/Yr Growth Rates
0.0%
0.5%
1.0%
1.5%
2.0%
2.5%
3.0%
3.5%
4.0%
2005
/Jan
2005
/Apr
2005
/Jul
2005
/Oct
2006
/Jan
2006
/Apr
2006
/Jul
2006
/Oct
2007
/Jan
2007
/Apr
2007
/Jul
2007
/Oct
2008
/Jan
2008
/Apr
2008
/Jul
2008
/Oct
2009
/Jan
2009
/Apr
2009
/Jul
2009
/Oct
Monthly RBC Issue Yr/Yr Growth Rates
-6.0%
-4.0%
-2.0%
0.0%
2.0%
4.0%
6.0%
8.0%
10.0%
12.0%
14.0%
2005
/Jan
2005
/Apr
2005
/Jul
2005
/Oct
2006
/Jan
2006
/Apr
2006
/Jul
2006
/Oct
2007
/Jan
2007
/Apr
2007
/Jul
2007
/Oct
2008
/Jan
2008
/Apr
2008
/Jul
2008
/Oct
2009
/Jan
2009
/Apr
2009
/Jul
2009
/Oct
21
Forecast model performance ...
The exponential smoothing model does a reasonable job of predicting future
demand - at least at an aggregate level of detail. The budget view remains fixed for each fiscal period, but quarterly forecast updates are reviewed.
10,000
11,000
12,000
13,000
14,000
15,000
16,000
17,000
18,000
19,000
20,000
2007
-04-
01
2007
-06-
01
2007
-08-
01
2007
-10-
01
2007
-12-
01
2008
-02-
01
2008
-04-
01
2008
-06-
01
2008
-08-
01
2008-
10-01
2008
-12-
01
2009
-02-
01
2009
-04-
01
2009
-06-
01
2009
-08-
01
2009
-10-
01
2009
-12-
01
2010
-02-
01
Actual Budget View
22
Inventory - the buffer between supply & demand
Volatility in demand & supply can lead to unavoidable imbalances between the two. Inventory acts as a buffer to offset these imbalances, shrinking when demand outpaces
supply and growing when the opposite occurs. A minimum of 5 days of inventory on hand for each ABO Rh type is recommended.
Daily Red Blood Cell Inventory Levels
5,000
7,500
10,000
12,500
15,000
17,500
20,000
22,500
25,000
27,500
30,000
32,500
35,000
04-0
4-01
04-0
7-01
04-1
0-01
05-0
1-01
05-0
4-01
05-0
7-01
05-1
0-01
06-0
1-01
06-0
4-01
06-0
7-01
06-1
0-01
07-0
1-01
07-0
4-01
07-0
7-01
07-1
0-01
08-0
1-01
08-0
4-01
08-0
7-01
08-1
0-01
09-0
1-01
09-0
4-01
09-0
7-01
09-1
0-01
10-0
1-01
23
Demand forecasting - just the beginning ...
Demand forecasting is just the beginning. Performance during the year must
be closely monitored, analyzed and reviewed and lead to the development of appropriate corrective actions or adjusted goals and strategies.
Aging Population Hospital Expansion/
Contraction
Extraneous:
• Weather
• Trauma
• Labour Action
Analysis of
Key Drivers
Cause & Effect
Demand Forecast
Formal Results
Review
Recommended
Actions
Regulation
Technology
CBS Strategies/
Goals/Tactics
Comparison of
Actual Results to
Target
Aging Population Hospital Expansion/
Contraction
Extraneous:
• Weather
• Trauma
• Labour Action
Analysis of
Key Drivers
Cause & Effect
Demand Forecast
Formal Results
Review
Recommended
Actions
Regulation
Technology
CBS Strategies/
Goals/Tactics
Comparison of
Actual Results to
Target
24
When detailed demand data isn't available ...
Population statistics and forecasts are usually readily available. Relating hospital
demand to population growth will explain some, but not all of the growth in demand. Refining population estimates to weighted cohorts (e.g. by age band)
would likely yield improved demand forecasts. Provisioning for non-population
related overlays (e.g. increased health care funding) could also be considered.
2004/05 2005/06 2006/07 2007/08 2008/09Q2 2009/10
Annualized
Issued
CAGR
CAGR per
1,000 pop
Canada (Excl Quebec) 31.2 31.4 31.7 31.7 32.7 32.3 1.8% 0.7%
Newfoundland and Labrador 37.7 37.7 36.9 37.3 35.9 33.5 -2.7% -2.4%
Prince Edward Island 25.5 28.2 26.5 28.2 30.9 26.8 1.4% 1.0%
Nova Scotia 35.3 34.8 35.9 33.3 33.7 32.8 -1.4% -1.5%
New Brunswick 30.7 31.3 32.8 32.4 33.4 32.4 1.0% 1.1%Quebec 29.2 29.1 29.2 29.6 29.9 29.8 1.1% 0.4%
Ontario 31.4 31.3 31.2 30.9 32.3 32.3 1.5% 0.6%
Manitoba 36.9 36.7 38.0 38.5 37.4 36.9 0.8% 0.0%
Saskatchewan 36.0 36.6 37.3 37.8 38.5 38.6 2.1% 1.4%
Alberta 30.4 31.7 32.1 31.6 32.2 31.0 3.0% 0.4%
British Columbia 27.2 28.1 28.8 30.5 31.0 31.0 3.8% 2.6%
Yukon Territory 26.4 25.8 30.1 26.1 27.9 26.3 1.5% -0.1%
Northwest Territories 21.6 19.2 17.4 17.2 17.3 19.1 -2.4% -2.4%
Nunavut 10.1 9.7 9.2 8.4 9.6 9.4 -0.1% -1.6%
RBC Units Issued per 1,000 population by fiscal period
(Number)
1
Estimating blood demand Estimating blood demand ––
methodology practiced in HKmethodology practiced in HK
WHO ExpertsWHO Experts’’ Consultation on Consultation on ‘‘Estimation of Blood RequirementsEstimation of Blood Requirements’’
0303--05 February 2010, WHO, HQ, 05 February 2010, WHO, HQ, GenevaGeneva
CheChe--Kit LinKit Lin
Hong Kong Red Cross Blood Transfusion Service, Hospital Authority
Background Background –– Hong KongHong Kong
�� Area: 1,103 square kmArea: 1,103 square km
�� Population: Population: 77 millionmillion
�� Chinese 95%Chinese 95%
�� Overall density: 6,300 peopleOverall density: 6,300 people// kmkm22
�� Total health expenditure: 5.1% of GDPTotal health expenditure: 5.1% of GDP
�� Public Public health expenditurehealth expenditure::
2.6% 2.6% (2005(2005//06) (US$4.13 billion)06) (US$4.13 billion)
�� Birth rate: 11.3 live births per 1000 populationBirth rate: 11.3 live births per 1000 population
�� Infant mortality rate: 1.8 per 1000 live birthsInfant mortality rate: 1.8 per 1000 live births
�� Life expectancy: male 79.3 yr, female 85.5 yrLife expectancy: male 79.3 yr, female 85.5 yr
Hong Kong Red Cross Blood Transfusion Service, Hospital Authority
Background Background -- BTSBTS
�� Hong Kong Red Cross initiated the voluntary Hong Kong Red Cross initiated the voluntary nonnon--remunerated blood donation remunerated blood donation programmeprogramme in in 19521952
�� BTS established in 1984BTS established in 1984
�� SServing 20 public & 12 private hospitalserving 20 public & 12 private hospitals
�� Since 1991, Since 1991, BTS BTS has become has become part of the public part of the public hospital system (Hospital Authority)hospital system (Hospital Authority)
�� Public hospitals account for 90% of blood Public hospitals account for 90% of blood consumptionconsumption
�� Supply of blood components Supply of blood components is is free of chargefree of charge
Hong Kong Red Cross Blood Transfusion Service, Hospital Authority
Yr 2008 Blood Collection StatisticsYr 2008 Blood Collection Statistics
�� WB collection = 206636 unitsWB collection = 206636 units
�� PlasmapheresisPlasmapheresis = 2114 units= 2114 units
�� PlateletpheresisPlateletpheresis = 868 units= 868 units
�� AutologousAutologous WB = 130 unitsWB = 130 units
�� % of age eligible trade population donating = % of age eligible trade population donating = 3.3%3.3%
�� Donor deferral rate = 13%Donor deferral rate = 13%
�� Average age of donor Average age of donor �� Male = 39 , Female = 36 Male = 39 , Female = 36
Hong Kong Red Cross Blood Transfusion Service, Hospital Authority
Annual Blood Collection
Hong Kong Red Cross Blood Transfusion Service, Hospital Authority
2
Hong Kong Red Cross Blood Transfusion Service, Hospital Authority Hong Kong Red Cross Blood Transfusion Service, Hospital Authority
Hong Kong Red Cross Blood Transfusion Service, Hospital Authority
Yr 2008 Blood Supply StatisticsYr 2008 Blood Supply Statistics
�� WB derived Red Cell issued = 192,467 units; WB derived Red Cell issued = 192,467 units;
�� Standard Red Cell (derived from 470ml of WB) issued Standard Red Cell (derived from 470ml of WB) issued per 1000 population = 25.0 unitsper 1000 population = 25.0 units
�� WB derived WB derived PltPlt issued = 127,152 unitsissued = 127,152 units
�� One adult equivalent One adult equivalent pltplt dose issued /1,000 population dose issued /1,000 population = 4.54 units= 4.54 units
�� WB derived FFP issued = 57,330 unitsWB derived FFP issued = 57,330 units
�� 250250--300 300 mLmL equivalent FFP issued /1,000 population = equivalent FFP issued /1,000 population = 6.25 units6.25 units
�� Average age of WB+RBC on issue Average age of WB+RBC on issue == 14.7 days14.7 days
Hong Kong Red Cross Blood Transfusion Service, Hospital Authority
Hong Kong Red Cross Blood Transfusion Service, Hospital Authority
Frozen Plasma For Fractionation
Hong Kong Red Cross Blood Transfusion Service, Hospital Authority
Blood Blood Inventory and Inventory and DDistribution istribution
MManagementanagement
�� MMaintain optimal inventory levelsaintain optimal inventory levels in BTS and HBB in BTS and HBB
at all times with minimal expirationat all times with minimal expiration
�� FirstFirst--inin--firstfirst--out out -- based on the work of Cohen based on the work of Cohen
and and PierskellaPierskella 1975: application of management 1975: application of management
science and mathematical inventory theory to science and mathematical inventory theory to
control blood inventory management in a regional control blood inventory management in a regional
blood bankblood bank((Cohen MA, Cohen MA, PierskellaPierskella WP: Management policies for a regional WP: Management policies for a regional blood bank. Transfusion 1975;15:58blood bank. Transfusion 1975;15:58--67)67)
3
Hong Kong Red Cross Blood Transfusion Service, Hospital Authority
Inventory Inventory in BTS and in BTS and HBBsHBBs
�� BTS aims to maintain inventory of WB/RBC BTS aims to maintain inventory of WB/RBC ≥≥5 5
days of supply days of supply
�� Stock holding of WB+RBC (all blood groups) at BTSStock holding of WB+RBC (all blood groups) at BTS
-- 8.89 days (8.89 days (yr 2008 annual yr 2008 annual average)average)
�� Each Each HBB holdHBB holdss about 3about 3--5 days of 5 days of hospital hospital
consumptionconsumption
�� Inventory level in HBB is set out in the Inventory level in HBB is set out in the ““Blood Blood
Supply AgreementSupply Agreement”” which is reviewed annuallywhich is reviewed annually
Hong Kong Red Cross Blood Transfusion Service, Hospital Authority
BTS WB/RBC inventory levels
< 200< 200< 350DangerousV
200 - 399200 - 399350 - 599AlarmIV
400 - 599400 - 599600 -
1099
ActionIII
600 - 799600 - 7991100 -
1399
SafeII
Not applicable
as patient can
receive RBC of
any ABO group
≥≥≥≥ 800≥≥≥≥ 800≥≥≥≥ 1400DesirableI
Group AB+Group B+Group A+Group O+DescriptionLevel
Hong Kong Red Cross Blood Transfusion Service, Hospital Authority
HBB HBB Inventory Inventory AAllocation llocation PPolicyolicy
�� If BTS inventory dropped below safe levelIf BTS inventory dropped below safe level, , all HBB all HBB
inventories inventories will be reduced will be reduced on a proon a pro--rata basis rata basis with with
extra requests extra requests to be considered on to be considered on casecase--byby--casecase basisbasis
Further reduce stock supply and handle difference by case requests.< II< II< III
Top up Client’s RBC stock to ≥70% of agreed level.III
Top up Client’s RBC, platelet & FFP stocks to at least 90%, 70% &
70% of agreed levels respectively.
IIIIII
Top up Client’s stock as requested, provided that Client’s RBC,
Platelet & FFP stocks do not exceed 110%, 100% and 100% of
agreed levels respectively.
III
BTS CommitmentFFPPltRBC
Hong Kong Red Cross Blood Transfusion Service, Hospital Authority
Electronic Blood Transfusion Network SystemElectronic Blood Transfusion Network System
�� Connect with Connect with blood banks in blood banks in all public hospitalsall public hospitals––
enable viewing of realenable viewing of real--time inventories time inventories inin both both
BTS and BTS and HBBsHBBs
�� The system also enables:The system also enables:
�� Blood ordering & shipment Blood ordering & shipment
�� Product trackingProduct tracking
�� CChecking of patientshecking of patients’’ previous cross match resultsprevious cross match results
Hong Kong Red Cross Blood Transfusion Service, Hospital Authority
Client Client SSatisfactionatisfaction
0
50000
100000
150000
200000
250000
Re
d c
ell
Pla
tele
tP
las
ma
Re
d C
ell
Pla
tele
tP
las
ma
Re
d C
ell
Pla
tele
tP
las
ma
Re
d C
ell
Pla
tele
tP
las
ma
Re
d C
ell
Pla
tele
tP
las
ma
Re
d C
ell
Pla
tele
tP
las
ma
Re
d C
ell
Pla
tele
tP
las
ma
Re
d C
ell
Pla
tele
tP
las
ma
Re
d C
ell
Pla
tele
tP
las
ma
2001 2002 2003 2004 2005 2006 2007 2008 2009
An
nu
al
Ta
rge
r (U
nit
)
0
20
40
60
80
100
120
Pe
rce
nta
ge
Annual Target
Achievement (%)
Client Satisfaction (%)
Hong Kong Red Cross Blood Transfusion Service, Hospital Authority
Blood Utilization StatisticsBlood Utilization Statistics
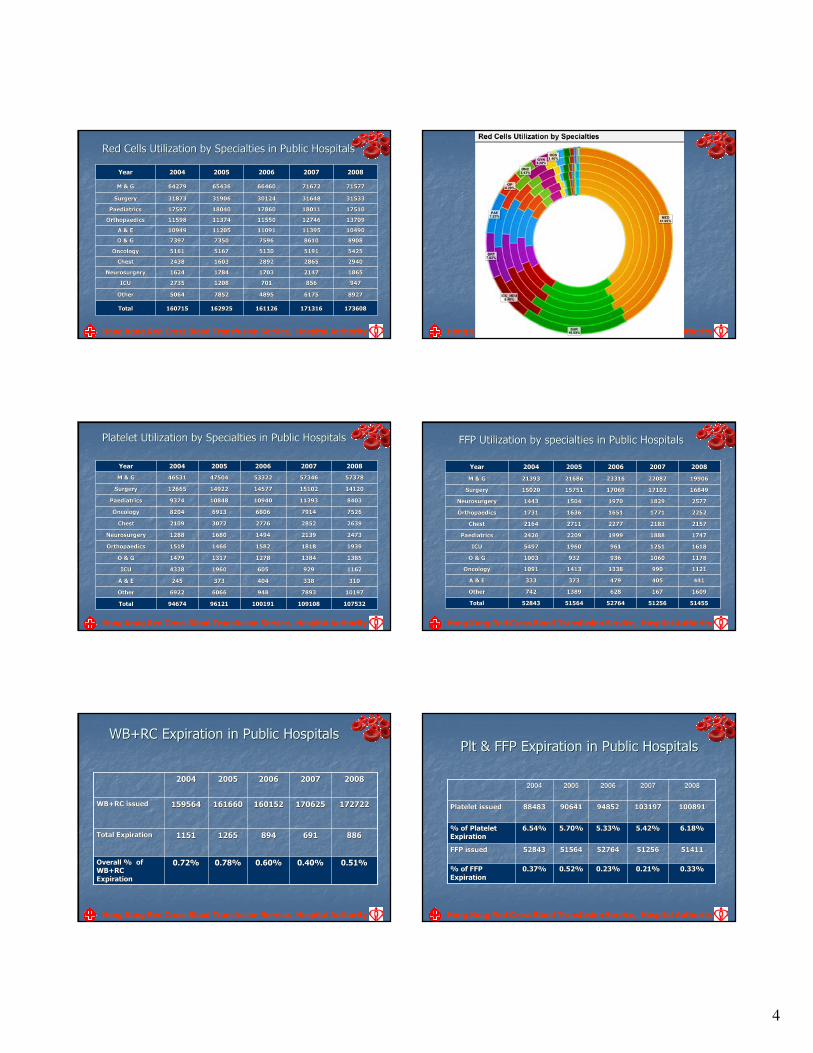
4
Hong Kong Red Cross Blood Transfusion Service, Hospital Authority
Red Cells Utilization by Red Cells Utilization by SSpecialtiespecialties in Public Hospitalsin Public Hospitals
8927892761756175489548957852785250645064OtherOther
17510175101801118011178601786018040180401759717597PaediatricsPaediatrics
171316171316
856856
21472147
28652865
51915191
86108610
1139511395
1274612746
3164831648
7167271672
20072007
161126161126
701701
17031703
28922892
51305130
75967596
1109111091
1155011550
3012430124
6646066460
20062006
162925162925
12081208
17841784
16031603
51675167
73507350
1120511205
1137411374
3190631906
6543665436
20052005
160715160715
27352735
16241624
24382438
51615161
73977397
1094910949
1159811598
3187331873
6427964279
20042004
173608173608TotalTotal
947947ICUICU
18651865NeurosurgeryNeurosurgery
29402940ChestChest
54255425OncologyOncology
89088908O & GO & G
1049010490A & EA & E
1370913709OrthopaedicsOrthopaedics
3153331533SurgerySurgery
7157771577M & GM & G
20082008YearYear
Hong Kong Red Cross Blood Transfusion Service, Hospital Authority
Hong Kong Red Cross Blood Transfusion Service, Hospital Authority
Platelet Utilization by Platelet Utilization by SSpecialtiespecialties in Public Hospitalsin Public Hospitals
1019710197789378939489486066606669226922OtherOther
109108109108
338338
929929
13841384
18181818
21392139
28522852
79147914
1139311393
1510215102
5734657346
20072007
100191100191
404404
605605
12781278
15821582
14941494
27762776
68066806
1094010940
1457714577
5332253322
20062006
9612196121
373373
19601960
13171317
14661466
16801680
30723072
69136913
1084810848
1492214922
4750447504
20052005
9467494674
245245
43384338
14791479
15191519
12881288
21092109
82048204
93749374
1266512665
4653146531
20042004
107532107532TotalTotal
310310A & EA & E
11621162ICUICU
13851385O & GO & G
19391939OrthopaedicsOrthopaedics
24732473NeurosurgeryNeurosurgery
26392639ChestChest
75267526OncologyOncology
84038403PaediatricsPaediatrics
1412014120SurgerySurgery
5737857378M & GM & G
20082008YearYear
Hong Kong Red Cross Blood Transfusion Service, Hospital Authority
FFP Utilization by specialtiesFFP Utilization by specialties in Public Hospitalsin Public Hospitals
441441405405479479373373333333A & EA & E
1609160916716762862813891389742742OtherOther
5125651256
990990
10601060
12511251
18881888
21832183
17711771
18291829
1710217102
2208222082
20072007
5276452764
13381338
936936
961961
19991999
22772277
16511651
19701970
1706917069
2331623316
20062006
5156451564
14131413
932932
19601960
22092209
27112711
16361636
15041504
1575115751
2168621686
20052005
5284352843
10911091
10031003
54975497
24262426
21642164
17311731
14431443
1502015020
2139321393
20042004
5145551455TotalTotal
11211121OncologyOncology
11781178O & GO & G
16181618ICUICU
17471747PaediatricsPaediatrics
21572157ChestChest
22522252OrthopaedicsOrthopaedics
25772577NeurosurgeryNeurosurgery
1684916849SurgerySurgery
1990619906M & GM & G
20082008YearYear
Hong Kong Red Cross Blood Transfusion Service, Hospital Authority
WB+RCWB+RC Expiration Expiration in Publicin Public HospitalsHospitals
0.51%0.51%0.40%0.40%0.60%0.60%0.78%0.78%0.72%0.72%Overall % of Overall % of WB+RC WB+RC
ExpirationExpiration
691691
170625170625
20072007
894 894
160152160152
20062006
11511151
159564159564
20042004
12651265
161660161660
20052005
172722172722WB+RC issuedWB+RC issued
886886Total ExpirationTotal Expiration
20082008
Hong Kong Red Cross Blood Transfusion Service, Hospital Authority
PltPlt & FFP& FFP Expiration Expiration in Publicin Public HospitalsHospitals
0.21%0.21%
5125651256
5.42%5.42%
103197103197
20072007
0.23%0.23%
5276452764
5.33%5.33%
9485294852
20062006
0.52%0.52%
5156451564
5.70%5.70%
9064190641
20052005
0.37%0.37%
5284352843
6.54%6.54%
8848388483
20042004
100891100891Platelet issuedPlatelet issued
0.33%0.33%% of FFP % of FFP
ExpirationExpiration
5141151411FFP FFP issuedissued
6.18%6.18%% of Platelet % of Platelet ExpirationExpiration
20082008
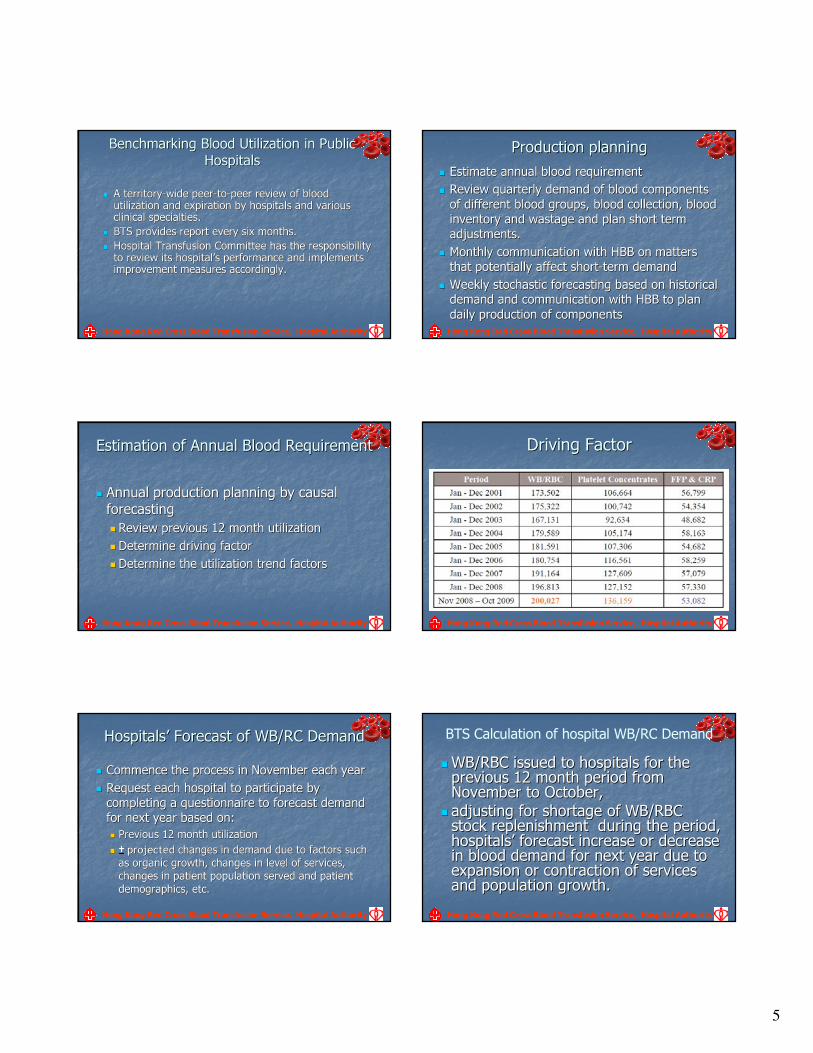
5
Hong Kong Red Cross Blood Transfusion Service, Hospital Authority
Benchmarking Benchmarking BBlood lood UUtilizationtilization in Public in Public
HospitalsHospitals
�� A territoryA territory--wide peerwide peer--toto--peer review of blood peer review of blood utilization and expiration by hospitals and various utilization and expiration by hospitals and various clinical specialties.clinical specialties.
�� BTS provides report every six months.BTS provides report every six months.
�� Hospital Transfusion Committee has the responsibility Hospital Transfusion Committee has the responsibility to review its hospitalto review its hospital’’s performance and implements s performance and implements improvement measures accordingly.improvement measures accordingly.
Hong Kong Red Cross Blood Transfusion Service, Hospital Authority
Production planningProduction planning
�� Estimate annual blood requirementEstimate annual blood requirement
�� Review qReview quarterly demand of blood components uarterly demand of blood components
of different blood groupsof different blood groups, , blood collection, blood blood collection, blood
inventory and wastage and inventory and wastage and planplan short term short term
adjustments.adjustments.
�� Monthly communication with HBBMonthly communication with HBB on matters on matters
that potentially affect shortthat potentially affect short--term demandterm demand
�� WWeekly stochastic forecasting based on historical eekly stochastic forecasting based on historical
demand and communication with HBBdemand and communication with HBB to plan to plan
daily daily productionproduction of componentsof components
Hong Kong Red Cross Blood Transfusion Service, Hospital Authority
Estimation of Annual Blood RequirementEstimation of Annual Blood Requirement
�� Annual production planningAnnual production planning by cby causal ausal
forecastingforecasting
�� Review previous 12 month utilizationReview previous 12 month utilization
�� DeterminDeterminee driving factordriving factor
�� DeterminDeterminee the the utilizationutilization trend factortrend factorss
Hong Kong Red Cross Blood Transfusion Service, Hospital Authority
Driving FactorDriving Factor
Hong Kong Red Cross Blood Transfusion Service, Hospital Authority
HospitalsHospitals’’ Forecast of WB/RC DemandForecast of WB/RC Demand
�� Commence the process in November each yearCommence the process in November each year
�� Request each hospital to participate by Request each hospital to participate by
completing a questionnaire to forecast demand completing a questionnaire to forecast demand
for next year based on:for next year based on:
�� Previous 12 month utilizationPrevious 12 month utilization
�� ±± projected projected changes in demand due to factors such changes in demand due to factors such
as organic growth, changes in level of services, as organic growth, changes in level of services,
changes in patient population served and patient changes in patient population served and patient
demographics, etc. demographics, etc.
Hong Kong Red Cross Blood Transfusion Service, Hospital Authority
BTS Calculation of hospital WB/RC Demand
�� WB/RBC issued to WB/RBC issued to hospitalshospitals for the for the previous 12 month previous 12 month period period from from November to OctoberNovember to October, ,
�� adjustadjustinging for for shortage shortage of WB/RBC of WB/RBC stock replenishment stock replenishment during the period,during the period,hospitalshospitals’’ forecast increase or decrease forecast increase or decrease in blood demand in blood demand for next year for next year due to due to expansion or contraction of servicesexpansion or contraction of servicesand and population growthpopulation growth..
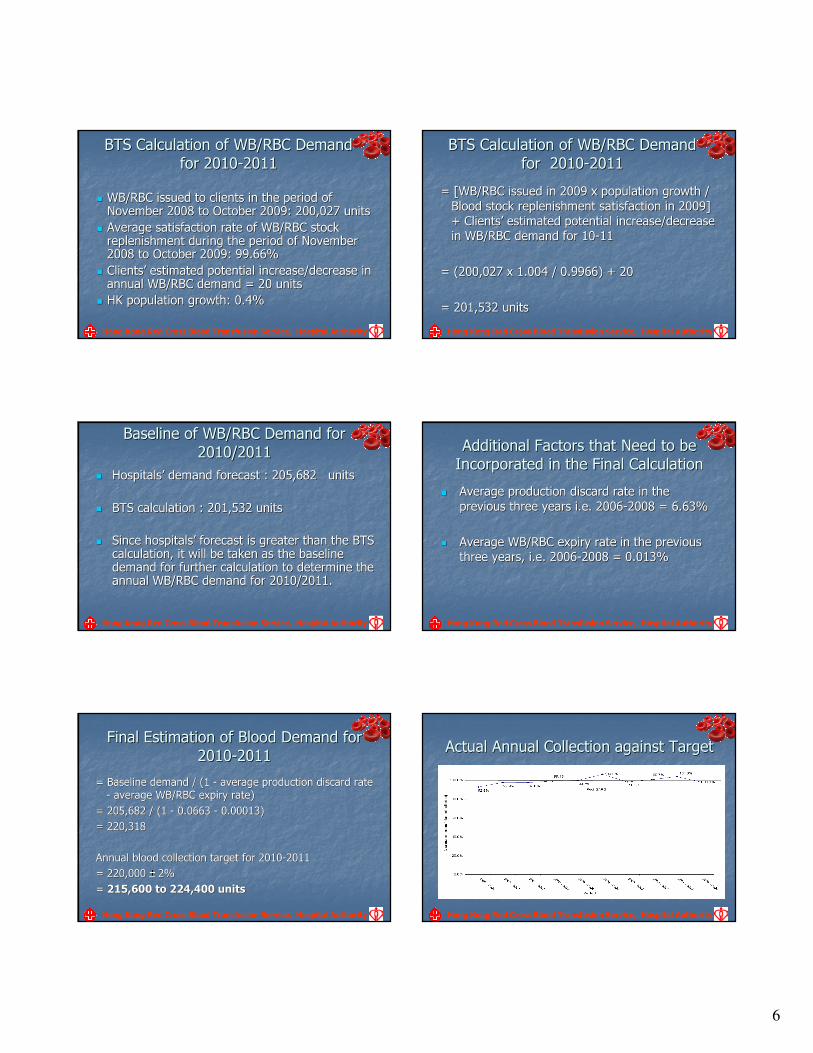
6
Hong Kong Red Cross Blood Transfusion Service, Hospital Authority
BTS Calculation of WB/RBC Demand BTS Calculation of WB/RBC Demand
for 2010for 2010--2011 2011
�� WB/RBC issued to clients in the period of WB/RBC issued to clients in the period of November 2008 to October 2009: 200,027 units November 2008 to October 2009: 200,027 units
�� Average satisfaction rate of WB/RBC stock Average satisfaction rate of WB/RBC stock replenishment during the period of November replenishment during the period of November 2008 to October 2009: 99.66%2008 to October 2009: 99.66%
�� ClientsClients’’ estimated potential increase/decrease in estimated potential increase/decrease in annual WB/RBC demand = 20 units annual WB/RBC demand = 20 units
�� HK population growth: 0.4% HK population growth: 0.4%
Hong Kong Red Cross Blood Transfusion Service, Hospital Authority
BTS Calculation of WB/RBC Demand BTS Calculation of WB/RBC Demand
for for 20102010--2011 2011
= [WB/RBC issued in 2009 x population growth / = [WB/RBC issued in 2009 x population growth /
Blood stock replenishment satisfaction in 2009] Blood stock replenishment satisfaction in 2009]
+ Clients+ Clients’’ estimated potential increase/decrease estimated potential increase/decrease
in WB/RBC demand for 10in WB/RBC demand for 10--11 11
= (200,027 x 1.004 / 0.9966) + 20 = (200,027 x 1.004 / 0.9966) + 20
= 201,532 units = 201,532 units
Hong Kong Red Cross Blood Transfusion Service, Hospital Authority
Baseline of WB/RBC DBaseline of WB/RBC Demandemand for for
2010/20112010/2011
�� HospitalsHospitals’’ demand forecast : 205,682 demand forecast : 205,682 unitsunits
�� BTS calculation : BTS calculation : 201,532 units 201,532 units
�� Since hospitalsSince hospitals’’ forecast isforecast is greatergreater than the BTS than the BTS calculationcalculation, , it will be it will be taken as the taken as the baseline baseline demanddemand for for further calculation to determine the further calculation to determine the annual annual WB/RBC demandWB/RBC demand for 2010/2011for 2010/2011. .
Hong Kong Red Cross Blood Transfusion Service, Hospital Authority
Additional Factors that Need to be Additional Factors that Need to be
Incorporated in the Final CalculationIncorporated in the Final Calculation
�� Average production discard rate in Average production discard rate in the the
previous three years i.e. previous three years i.e. 20062006--2008 = 6.63% 2008 = 6.63%
�� Average WB/RBC expiry rate Average WB/RBC expiry rate in the previous in the previous
three years, i.e. three years, i.e. 20062006--2008 = 0.013% 2008 = 0.013%
Hong Kong Red Cross Blood Transfusion Service, Hospital Authority
Final Estimation of Blood Demand Final Estimation of Blood Demand for for
20102010--20112011
= Baseline= Baseline demand / (1demand / (1 -- average average production discard rate production discard rate
-- average WB/RBC expiry rate) average WB/RBC expiry rate)
= 205,682 / (1= 205,682 / (1 -- 0.06630.0663 -- 0.00013) 0.00013)
= 220,318 = 220,318
AAnnual nnual blood blood collection target for 2010collection target for 2010--2011 2011
= 220,000 = 220,000 ±± 2% 2%
= = 215,600 to 224,400 units 215,600 to 224,400 units
Hong Kong Red Cross Blood Transfusion Service, Hospital Authority
Actual Annual Collection against Target Actual Annual Collection against Target
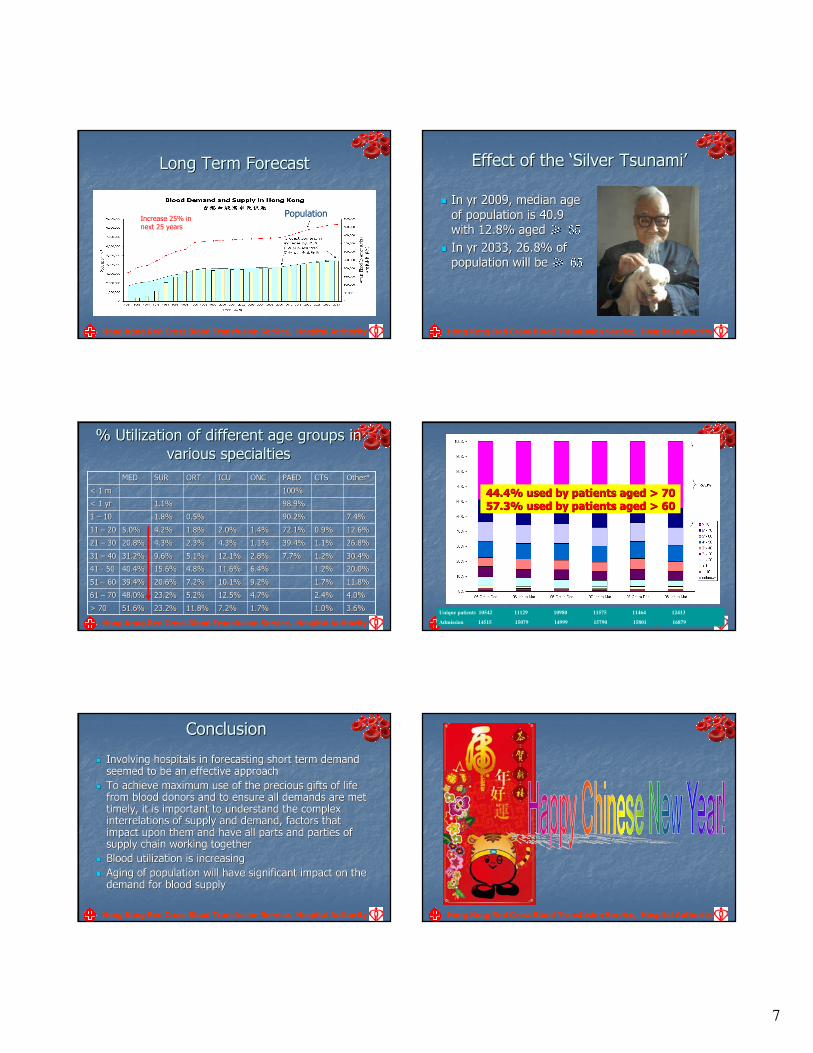
7
Hong Kong Red Cross Blood Transfusion Service, Hospital Authority
Long Term FLong Term Forecastorecast
Increase 25% in next 25 years
Population
Hong Kong Red Cross Blood Transfusion Service, Hospital Authority
Effect of the Effect of the ‘‘Silver TsunamiSilver Tsunami’’
�� In yr 2009, median age In yr 2009, median age
of population is 40.9 of population is 40.9
with 12.8% aged with 12.8% aged ≥≥ 6565�� In yr 2033, 26.8% of In yr 2033, 26.8% of
population will be population will be ≥≥ 6565
Hong Kong Red Cross Blood Transfusion Service, Hospital Authority
% Utilization of different a% Utilization of different age groupsge groups in in
variousvarious specialtiesspecialties
3.6%3.6%1.0%1.0%1.7%1.7%7.2%7.2%11.8%11.8%23.2%23.2%51.6%51.6%> 70> 70
4.0%4.0%2.4%2.4%4.7%4.7%12.5%12.5%5.2%5.2%23.2%23.2%48.0%48.0%61 61 –– 7070
11.8%11.8%1.7%1.7%9.2%9.2%10.1%10.1%7.2%7.2%20.6%20.6%39.4%39.4%51 51 –– 6060
20.0%20.0%1.2%1.2%6.4%6.4%11.6%11.6%4.8%4.8%15.6%15.6%40.4%40.4%41 41 -- 5050
30.4%30.4%1.2%1.2%7.7%7.7%2.8%2.8%12.1%12.1%5.1%5.1%9.6%9.6%31.2%31.2%31 31 –– 4040
26.8%26.8%1.1%1.1%39.4%39.4%1.1%1.1%4.3%4.3%2.3%2.3%4.3%4.3%20.8%20.8%21 21 –– 3030
12.6%12.6%0.9%0.9%72.1%72.1%1.4%1.4%2.0%2.0%1.8%1.8%4.2%4.2%5.0%5.0%11 11 –– 2020
7.4%7.4%90.2%90.2%0.5%0.5%1.8%1.8%1 1 –– 1010
98.9%98.9%1.1%1.1%< 1 yr< 1 yr
100%100%< 1 m< 1 m
Other*Other*CTSCTSPAEDPAEDONCONCICUICUORTORTSURSURMEDMED
Hong Kong Red Cross Blood Transfusion Service, Hospital Authority
Unique patients 10542 11129 10980 11575 11464 12413
Admission 14515 15079 14999 15790 15801 16879
44.4% used by patients aged > 7044.4% used by patients aged > 70
57.3% used by patients aged > 6057.3% used by patients aged > 60
Hong Kong Red Cross Blood Transfusion Service, Hospital Authority
ConclusionConclusion
�� Involving hospitals in forecasting short term demand Involving hospitals in forecasting short term demand seemed to be an effective approachseemed to be an effective approach
�� To achieve maximum use of the precious gifts of life To achieve maximum use of the precious gifts of life from blood donorsfrom blood donors and to ensure all demands are met and to ensure all demands are met timelytimely, it is important to understand the complex , it is important to understand the complex interrelations of supply and demand, factors that interrelations of supply and demand, factors that impact upon them and have all parts impact upon them and have all parts and parties and parties of of supply chain working togethersupply chain working together
�� BBlood utilization lood utilization is increasingis increasing
�� Aging of population will have significant impact on the Aging of population will have significant impact on the demand for blood supplydemand for blood supply
Hong Kong Red Cross Blood Transfusion Service, Hospital Authority
1
WHO Needs assessment Feb 2010
1
Epidemiology of Transfusion in
ScotlandWho gets transfused and why?
WHO Workshop on Estimation of needs for transfusion
Geneva February 3 – 5
2010
WHO Needs assessment Feb 2010
2
Needs Assessment:
How can we use this data
• in UK or similar setting
• in resource restricted setting
WHO Needs assessment Feb 2010
3
It should be part of our job to know who gets the blood, why and how much…
Develop a sustainable system providing
information about the clinical use of blood
Estimate current requirements
Predict future requirements
Identify variations in practice
Encourage clinical review of blood use
Understand demographic, socioeconomic and epidemiological influences
on blood use
WHO Needs assessment Feb 2010
4
Presentation
• Evolution and why
• AIMS
• Methods
• Results
• What next
WHO Needs assessment Feb 2010
5
Evolution
2000: STEP
Scottish Transfusion Epidemiology Project
WHO Needs assessment Feb 2010
6
Introduction of tailored information system software to enable the easy collection and analysis of transfusion data for prompt feedback to clinicians and Hospital Transfusion Committees. This would involve the construction of a merged record that is a by-product of routine clinical practice (held on the existing hospital patient administration system) and data extracts from the local hospital laboratory system (and in some cases operating theatre).
2005: STED
Scottish Transfusion
Epidemiology database
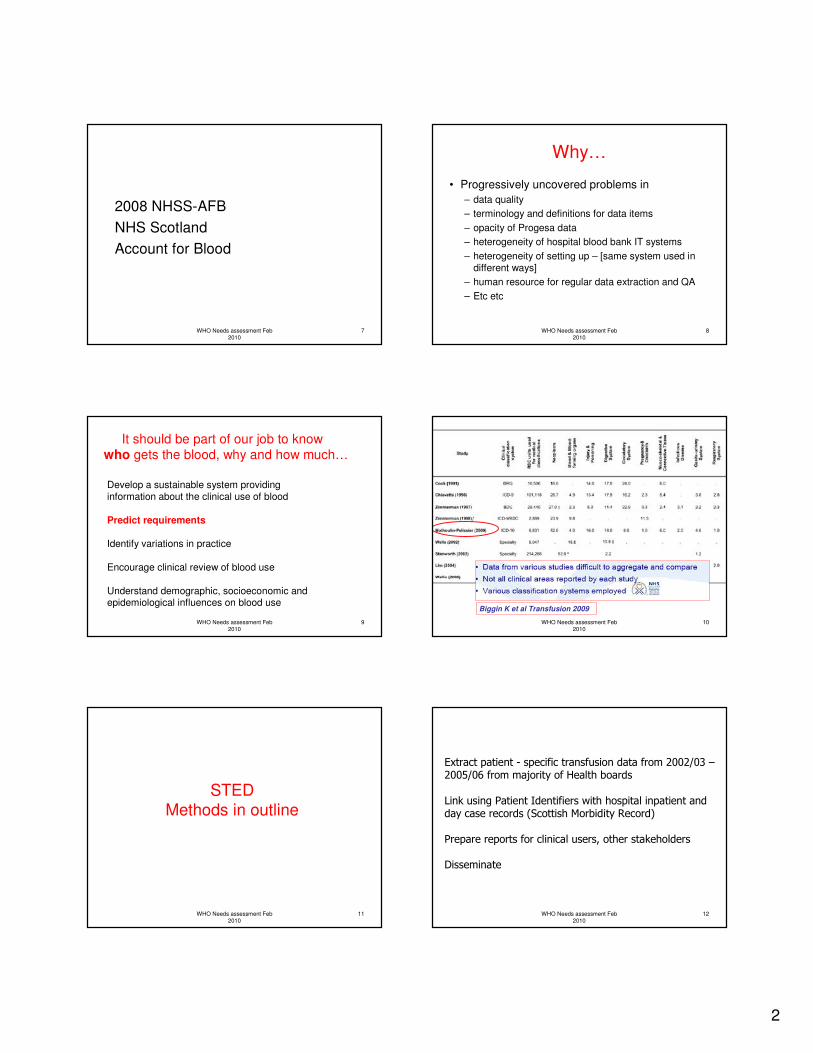
2
WHO Needs assessment Feb 2010
7
2008 NHSS-AFB
NHS Scotland
Account for Blood
WHO Needs assessment Feb 2010
8
Why…
• Progressively uncovered problems in
– data quality
– terminology and definitions for data items
– opacity of Progesa data
– heterogeneity of hospital blood bank IT systems
– heterogeneity of setting up – [same system used in different ways]
– human resource for regular data extraction and QA
– Etc etc
WHO Needs assessment Feb 2010
9
It should be part of our job to know who gets the blood, why and how much…
Develop a sustainable system providinginformation about the clinical use of blood
Predict requirements
Identify variations in practice
Encourage clinical review of blood use
Understand demographic, socioeconomic and epidemiological influences on blood use
WHO Needs assessment Feb 2010
10
Biggin K et al Transfusion 2009
WHO Needs assessment Feb 2010
11
STEDMethods in outline
WHO Needs assessment Feb 2010
12
Extract patient - specific transfusion data from 2002/03 –2005/06 from majority of Health boards
Link using Patient Identifiers with hospital inpatient and day case records (Scottish Morbidity Record)
Prepare reports for clinical users, other stakeholders
Disseminate
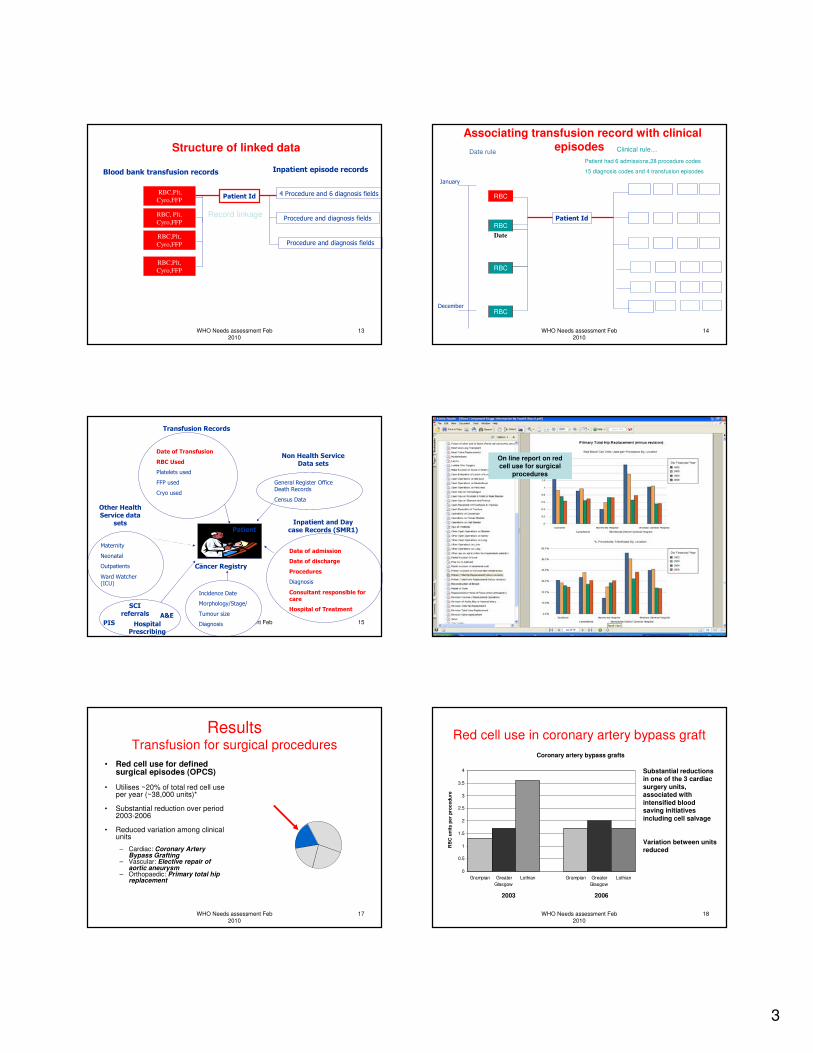
3
WHO Needs assessment Feb 2010
13
Structure of linked data
Patient Id 4 Procedure and 6 diagnosis fields
Procedure and diagnosis fields
Procedure and diagnosis fields
RBC, Plt,
Cyro,FFP
RBC,Plt,
Cyro,FFP
RBC,Plt,
Cyro,FFP
Inpatient episode recordsBlood bank transfusion records
Record linkage
RBC,Plt,
Cyro,FFP
WHO Needs assessment Feb 2010
14
Associating transfusion record with clinical episodes
Patient IdRBC
RBC
January
December
RBC
Date
RBC
Date rule Clinical rule…
Patient had 6 admissions,28 procedure codes
15 diagnosis codes and 4 transfusion episodes
WHO Needs assessment Feb 2010
15
PatientInpatient and Day
case Records (SMR1)
Date of admission
Date of discharge
Procedures
Diagnosis
Consultant responsible for care
Hospital of Treatment
Transfusion Records
Date of Transfusion
RBC Used
Platelets used
FFP used
Cryo used
Maternity
Neonatal
Outpatients
Ward Watcher (ICU)
Other Health Service data
sets
Incidence Date
Morphology/Stage/
Tumour size
Diagnosis
Cancer Registry
General Register Office Death Records
Census Data
Non Health Service Data sets
PIS Hospital Prescribing
A&E
SCI referrals
WHO Needs assessment Feb 2010
16
On line report on red cell use for surgical
procedures
WHO Needs assessment Feb 2010
17
ResultsTransfusion for surgical procedures
• Red cell use for defined surgical episodes (OPCS)
• Utilises ~20% of total red cell use per year (~38,000 units)*
• Substantial reduction over period 2003-2006
• Reduced variation among clinical units
– Cardiac: Coronary Artery Bypass Grafting
– Vascular: Elective repair of aortic aneurysm
– Orthopaedic: Primary total hip replacement
WHO Needs assessment Feb 2010
18
Red cell use in coronary artery bypass graft
0
0.5
1
1.5
2
2.5
3
3.5
4
Grampian Greater
Glasgow
Lothian Grampian Greater
Glasgow
Lothian
RB
C u
nit
s p
er
pro
ce
du
re
2003 2006
Coronary artery bypass grafts
Substantial reductions in one of the 3 cardiac
surgery units, associated with
intensified blood saving initiatives
including cell salvage
Variation between units reduced
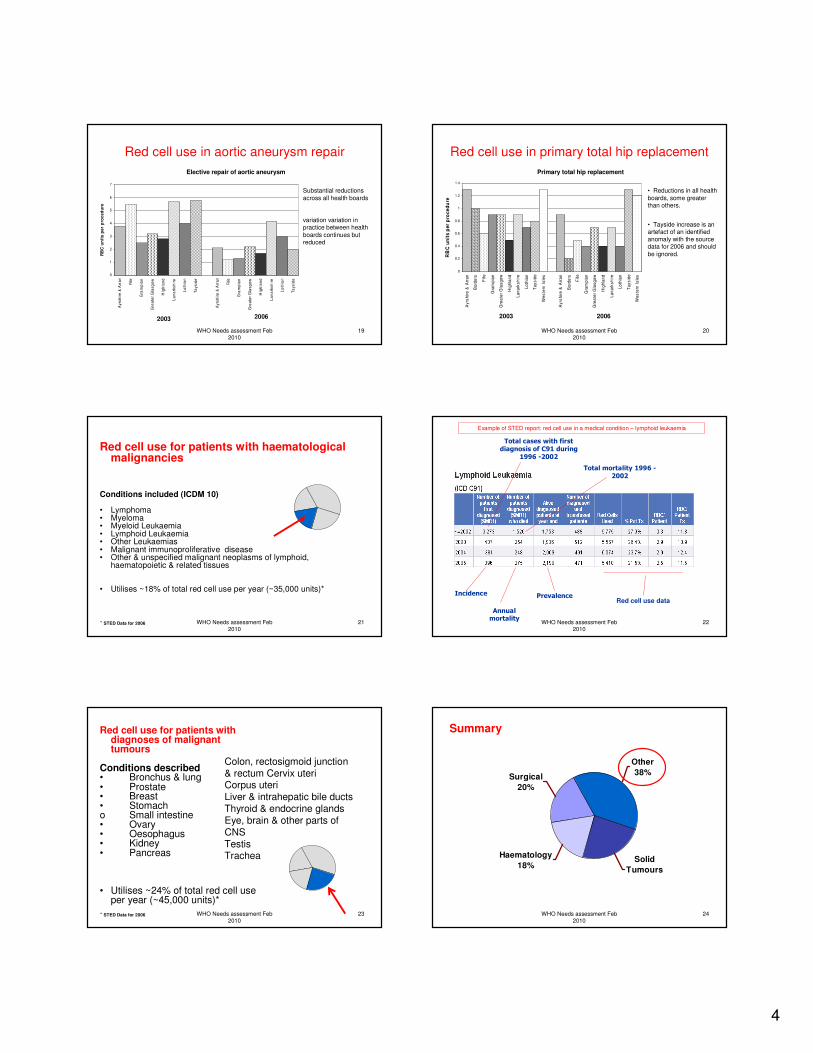
4
WHO Needs assessment Feb 2010
19
Red cell use in aortic aneurysm repair
0
1
2
3
4
5
6
7
Ayrs
hir
e &
Arr
an
Fife
Gra
mp
ian
Gre
ate
r G
lasg
ow
Hig
hla
nd
La
na
rksh
ire
Lo
thia
n
Ta
ysid
e
Ayrs
hir
e &
Arr
an
Fife
Gra
mp
ian
Gre
ate
r G
lasg
ow
Hig
hla
nd
La
na
rksh
ire
Lo
thia
n
Ta
ysid
e
RB
C u
nit
s p
er
pro
ce
du
re
2003 2006
Elective repair of aortic aneurysm
Substantial reductions
across all health boards
variation variation in practice between health
boards continues but reduced
WHO Needs assessment Feb 2010
20
Red cell use in primary total hip replacement
0
0.2
0.4
0.6
0.8
1
1.2
1.4
Ay
rsh
ire
& A
rra
n
Bo
rde
rs
Fif
e
Gra
mp
ian
Gre
ate
r G
las
go
w
Hig
hla
nd
La
na
rks
hir
e
Lo
thia
n
Ta
ys
ide
We
ste
rn I
sle
s
Ay
rsh
ire
& A
rra
n
Bo
rde
rs
Fif
e
Gra
mp
ian
Gre
ate
r G
las
go
w
Hig
hla
nd
La
na
rks
hir
e
Lo
thia
n
Ta
ys
ide
We
ste
rn I
sle
s
RB
C u
nit
s p
er
pro
ce
du
re
2003 2006
Primary total hip replacement
• Reductions in all health
boards, some greater than others.
• Tayside increase is an artefact of an identified anomaly with the source data for 2006 and should
be ignored.
WHO Needs assessment Feb 2010
21
Red cell use for patients with haematological malignancies
Conditions included (ICDM 10)
• Lymphoma• Myeloma• Myeloid Leukaemia • Lymphoid Leukaemia• Other Leukaemias• Malignant immunoproliferative disease • Other & unspecified malignant neoplasms of lymphoid,
haematopoietic & related tissues
• Utilises ~18% of total red cell use per year (~35,000 units)*
* STED Data for 2006 WHO Needs assessment Feb 2010
22
Incidence Prevalence
Annual mortality
Total cases with first diagnosis of C91 during
1996 -2002
Total mortality 1996 -2002
Example of STED report: red cell use in a medical condition – lymphoid leukaemia
Red cell use data
WHO Needs assessment Feb 2010
23
Red cell use for patients with diagnoses of malignant tumours
Conditions described• Bronchus & lung• Prostate• Breast• Stomacho Small intestine• Ovary• Oesophagus• Kidney• Pancreas
• Utilises ~24% of total red cell use per year (~45,000 units)*
Colon, rectosigmoid junction & rectum Cervix uteriCorpus uteriLiver & intrahepatic bile ductsThyroid & endocrine glandsEye, brain & other parts of CNSTestisTrachea
* STED Data for 2006 WHO Needs assessment Feb 2010
24
Summary
Other
38%
Solid
Tumours
Surgical
20%
Haematology
18%
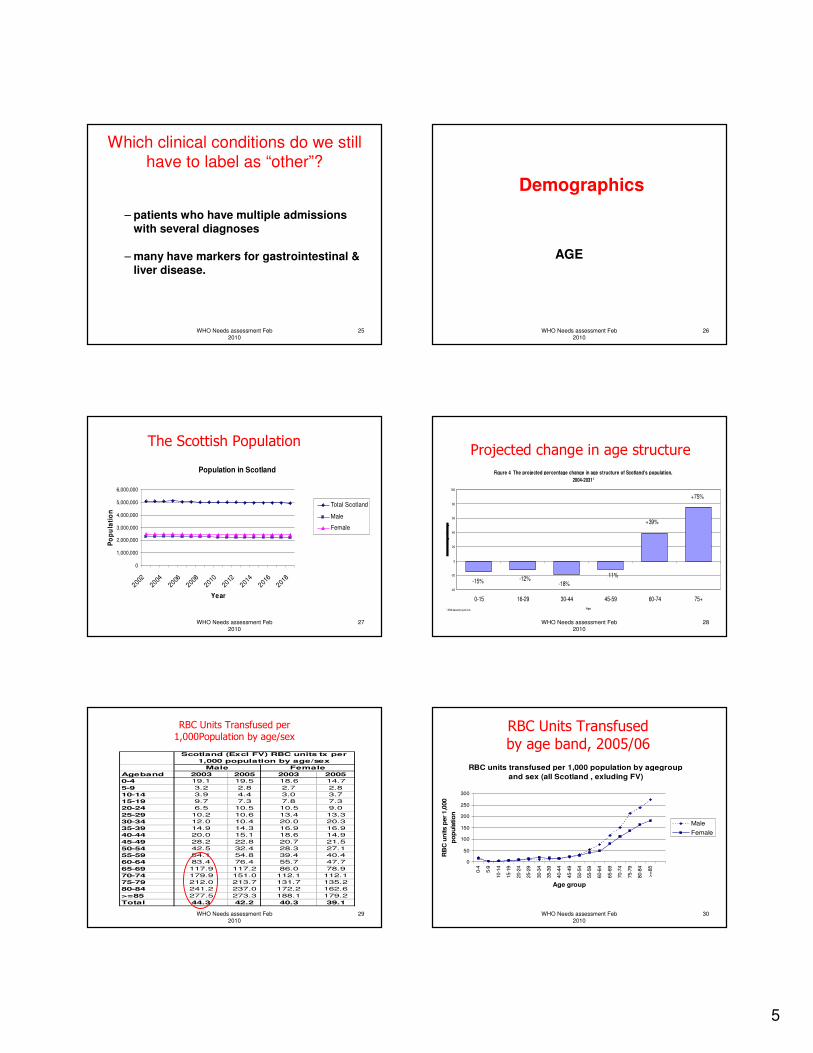
5
WHO Needs assessment Feb 2010
25
Which clinical conditions do we still have to label as “other”?
– patients who have multiple admissions with several diagnoses
– many have markers for gastrointestinal & liver disease.
WHO Needs assessment Feb 2010
26
Demographics
AGE
WHO Needs assessment Feb 2010
27
The Scottish Population
Population in Scotland
0
1,000,000
2,000,000
3,000,000
4,000,000
5,000,000
6,000,000
2002
2004
2006
2008
2010
2012
2014
2016
2018
Year
Po
pu
lati
on
Total Scotland
Male
Female
WHO Needs assessment Feb 2010
28
Projected change in age structure
Figure 4 The projected percentage change in age structure of Scotland's population,
2004-20311
-40
-20
0
20
40
60
80
100
0-15 16-29 30-44 45-59 60-74 75+
Age1 2004-based pr ojections
-15% -12%-18%
-11%
+39%
+75%
WHO Needs assessment Feb 2010
29
RBC Units Transfused per 1,000Population by age/sex
Ageband 2003 2005 2003 2005
0-4 19.1 19.5 18.6 14.7
5-9 3.2 2.8 2.7 2.8
10-14 3.9 4.4 3.0 3.7
15-19 9.7 7.3 7.8 7.3
20-24 6.5 10.5 10.5 9.0
25-29 10.2 10.6 13.4 13.3
30-34 12.0 10.4 20.0 20.3
35-39 14.9 14.3 16.9 16.9
40-44 20.0 15.1 18.6 14.9
45-49 28.2 22.8 20.7 21.5
50-54 42.5 32.4 28.3 27.1
55-59 54.1 54.8 39.4 40.4
60-64 83.4 76.4 55.7 47.7
65-69 117.9 117.2 86.0 78.9
70-74 179.9 151.0 112.1 112.1
75-79 212.0 213.7 131.7 135.2
80-84 241.2 237.0 172.2 162.6
>=85 277.5 273.3 188.1 179.2
Total 44.3 42.2 40.3 39.1
Male Female
Scotland (Excl FV) RBC units tx per
1,000 population by age/sex
WHO Needs assessment Feb 2010
30
RBC Units Transfused
by age band, 2005/06
RBC units transfused per 1,000 population by agegroup
and sex (all Scotland , exluding FV)
0
50
100
150
200
250
300
0-4
5-9
10-1
4
15-1
9
20-2
4
25-2
9
30-3
4
35-3
9
40-4
4
45-4
9
50-5
4
55-5
9
60-6
4
65-6
9
70-7
4
75-7
9
80-8
4
>=
85
Age group
RB
C u
nits p
er
1,0
00
po
pu
latio
n
Male
Female
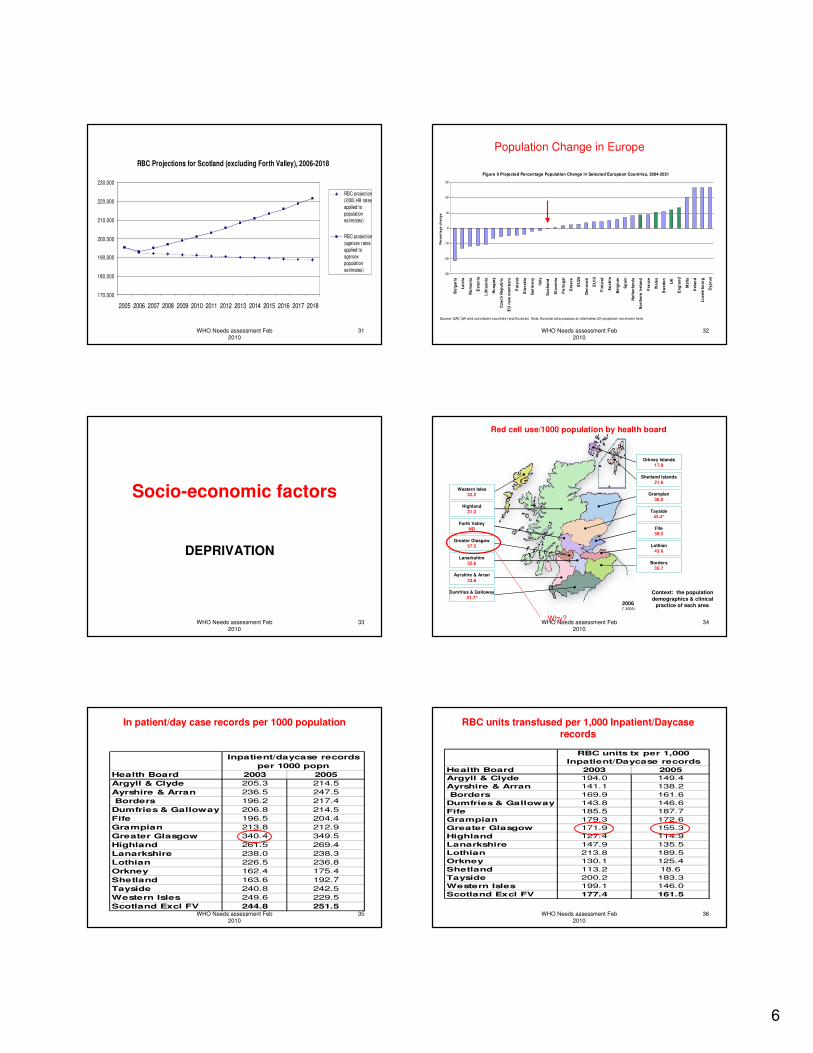
6
WHO Needs assessment Feb 2010
31
RBC Projections for Scotland (excluding Forth Valley), 2006-2018
170,000
180,000
190,000
200,000
210,000
220,000
230,000
2005 2006 2007 2008 2009 2010 2011 2012 2013 2014 2015 2016 2017 2018
RBC projection
(2005 HB rates
applied to
population
estimates)
RBC projection
(age/sex rates
applied to
age/sex
population
estimates)
WHO Needs assessment Feb 2010
32
Population Change in Europe
Figure 9 Projected Percentage Population Change in Selected European Countries, 2004-2031
-30
-20
-10
0
10
20
30
Bu
lga
ria
La
tvia
Ro
ma
nia
Es
ton
ia
Lit
hu
an
ia
Hu
ng
ary
Cz
ec
h R
ep
ub
lic
EU
ne
w m
em
be
rs
Po
lan
d
Slo
va
kia
Ge
rma
ny
Ita
ly
Sc
otl
an
d
Slo
ve
nia
Po
rtu
ga
l
Gre
ec
e
EU
25
De
nm
ark
EU
15
Fin
lan
d
Au
str
ia
Be
lgiu
m
Sp
ain
Ne
the
rla
nd
s
No
rth
ern
Ire
lan
d
Fra
nc
e
Wa
les
Sw
ed
en
UK
En
gla
nd
Ma
lta
Ire
lan
d
Lu
xe
mb
ou
rg
Cy
pru
s
Pe
rce
nta
ge
ch
an
ge
Source: GAD (UK and constituent countries) and Eurostat. Note: Eurostat also produce an alternative UK projection not shown here.
WHO Needs assessment Feb 2010
33
Socio-economic factors
DEPRIVATION
WHO Needs assessment Feb 2010
34
Ayrshire & Arran
33.8
Borders
35.7
Dumfries & Galloway
31.7*
Fife
39.2
Forth Valley
ND
Grampian
36.0
Greater Glasgow
57.3
Lanarkshire
32.6
Lothian
43.6
Orkney Islands
17.9
Shetland Islands
21.6
Tayside
45.4*
Western Isles
32.2
Highland
31.2
2006(* 2005)
Red cell use/1000 population by health board
Context: the population
demographics & clinical
practice of each area.
Why?
WHO Needs assessment Feb 2010
35
In patient/day case records per 1000 population
Health Board 2003 2005
Argyll & Clyde 205.3 214.5
Ayrshire & Arran 236.5 247.5
Borders 196.2 217.4
Dumfries & Galloway 206.8 214.5
Fife 196.5 204.4
Grampian 213.8 212.9
Greater Glasgow 340.4 349.5
Highland 261.5 269.4
Lanarkshire 238.0 238.3
Lothian 226.5 236.8
Orkney 162.4 175.4
Shetland 163.6 192.7
Tayside 240.8 242.5
Western Isles 249.6 229.5
Scotland Excl FV 244.8 251.5
Inpatient/daycase records
per 1000 popn
WHO Needs assessment Feb 2010
36
RBC units transfused per 1,000 Inpatient/Daycase records
Health Board 2003 2005
Argyll & Clyde 194.0 149.4
Ayrshire & Arran 141.1 138.2
Borders 169.9 161.6
Dumfries & Galloway 143.8 146.6
Fife 185.5 187.7
Grampian 179.3 172.6
Greater Glasgow 171.9 155.3
Highland 127.4 114.9
Lanarkshire 147.9 135.5
Lothian 213.8 189.5
Orkney 130.1 125.4
Shetland 113.2 18.6
Tayside 200.2 183.3
Western Isles 199.1 146.0
Scotland Excl FV 177.4 161.5
RBC units tx per 1,000
Inpatient/Daycase records
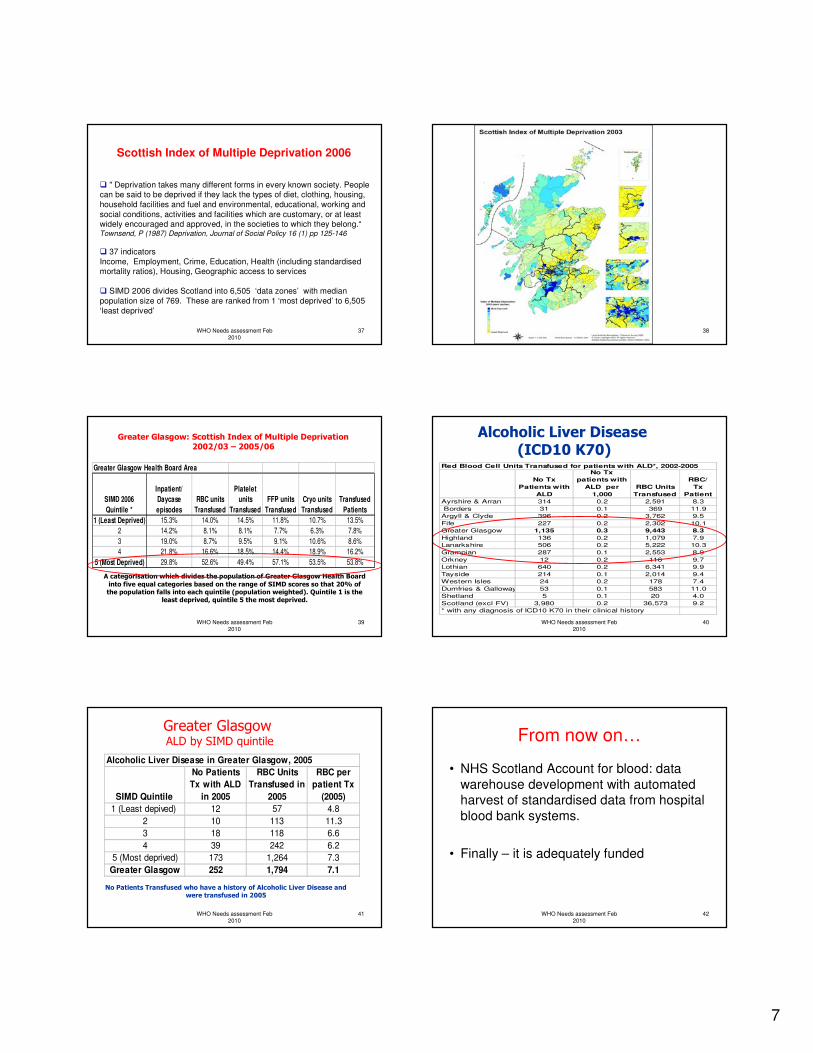
7
WHO Needs assessment Feb 2010
37
Scottish Index of Multiple Deprivation 2006
� " Deprivation takes many different forms in every known society. People can be said to be deprived if they lack the types of diet, clothing, housing,
household facilities and fuel and environmental, educational, working and
social conditions, activities and facilities which are customary, or at least widely encouraged and approved, in the societies to which they belong.“Townsend, P (1987) Deprivation, Journal of Social Policy 16 (1) pp 125-146
� 37 indicators
Income, Employment, Crime, Education, Health (including standardised mortality ratios), Housing, Geographic access to services
� SIMD 2006 divides Scotland into 6,505 ‘data zones’ with median
population size of 769. These are ranked from 1 ‘most deprived’ to 6,505
‘least deprived’
WHO Needs assessment Feb 2010
38
WHO Needs assessment Feb 2010
39
Greater Glasgow: Scottish Index of Multiple Deprivation2002/03 – 2005/06
A categorisation which divides the population of Greater Glasgow Health Board
into five equal categories based on the range of SIMD scores so that 20% of the population falls into each quintile (population weighted). Quintile 1 is the
least deprived, quintile 5 the most deprived.
Greater Glasgow Health Board Area
SIMD 2006
Quintile *
Inpatient/
Daycase
episodes
RBC units
Transfused
Platelet
units
Transfused
FFP units
Transfused
Cryo units
Transfused
Transfused
Patients
1 (Least Deprived) 15.3% 14.0% 14.5% 11.8% 10.7% 13.5%
2 14.2% 8.1% 8.1% 7.7% 6.3% 7.8%
3 19.0% 8.7% 9.5% 9.1% 10.6% 8.6%
4 21.8% 16.6% 18.5% 14.4% 18.9% 16.2%
5 (Most Deprived) 29.8% 52.6% 49.4% 57.1% 53.5% 53.8%
WHO Needs assessment Feb 2010
40
Alcoholic Liver Disease (ICD10 K70)
Red Blood Cell Units Transfused for patients with ALD*, 2002-2005
No Tx
Patients with
ALD
No Tx
patients with
ALD per
1,000
RBC Units
Transfused
RBC/
Tx
Patient
Ayrshire & Arran 314 0.2 2,591 8.3
Borders 31 0.1 369 11.9
Argyll & Clyde 396 0.2 3,762 9.5
Fife 227 0.2 2,302 10.1
Greater Glasgow 1,135 0.3 9,443 8.3
Highland 136 0.2 1,079 7.9
Lanarkshire 506 0.2 5,222 10.3
Grampian 287 0.1 2,553 8.9
Orkney 12 0.2 116 9.7
Lothian 640 0.2 6,341 9.9
Tayside 214 0.1 2,014 9.4
Western Isles 24 0.2 178 7.4
Dumfries & Galloway 53 0.1 583 11.0
Shetland 5 0.1 20 4.0
Scotland (excl FV) 3,980 0.2 36,573 9.2
* with any diagnosis of ICD10 K70 in their clinical history
WHO Needs assessment Feb 2010
41
Greater Glasgow ALD by SIMD quintile
No Patients Transfused who have a history of Alcoholic Liver Disease and were transfused in 2005
Alcoholic Liver Disease in Greater Glasgow, 2005
SIMD Quintile
No Patients
Tx with ALD
in 2005
RBC Units
Transfused in
2005
RBC per
patient Tx
(2005)
1 (Least depived) 12 57 4.8
2 10 113 11.3
3 18 118 6.6
4 39 242 6.2
5 (Most deprived) 173 1,264 7.3
Greater Glasgow 252 1,794 7.1
WHO Needs assessment Feb 2010
42
From now on…
• NHS Scotland Account for blood: data
warehouse development with automated harvest of standardised data from hospital
blood bank systems.
• Finally – it is adequately funded
8
WHO Needs assessment Feb 2010
43
Needs Assessment:
• How can we use this data - in UK or
similar setting
WHO Needs assessment Feb 2010
44
Needs Assessment:
How can we use this data - in resource
restricted setting
1
National Blood Collection and UtilizationNational Blood Collection and Utilization
andand
Blood Availability and Safety Information System Blood Availability and Safety Information System
(BASIS)(BASIS)
Jerry A. Holmberg, Jerry A. Holmberg, Ph.DPh.D, MT(ASCP)SBB, MT(ASCP)SBB
Senior Advisor for Blood PolicySenior Advisor for Blood Policy
Office of the SecretaryOffice of the Secretary
Office of Public Health and ScienceOffice of Public Health and Science
Aggregated Blood Report from Aggregated Blood Report from
AABB (ARC and ABC facilities)AABB (ARC and ABC facilities)
US Blood Centers Estimated Days of Supply
January 29, 2010
6.8
4.0
6.7
3.1 4.6
6.9
14.2
7.2
0.0
2.0
4.0
6.0
8.0
10.0
12.0
14.0
16.0
Blood Groups/Types
Esti
mate
d D
ays
O +
O -
A +
A -
B +
B -
AB +
AB -
Aggregated Blood Report from Aggregated Blood Report from
AABB (ARC and ABC facilities)AABB (ARC and ABC facilities)
Estimated Quantity In Blood Centers and Hospital
January 29, 2010
0
20,000
40,000
60,000
80,000
100,000
120,000
140,000
O + O - A + A - B + B - AB + AB -
Blood Type
Qu
an
tity
of
Blo
od
Estimated In Blood Center
307,450
Fixed estimate In hospital
based on assumption of
constant 6 day supply, i.e.,
281,731
Estimated US Blood SupplyEstimated US Blood Supply
Jan 29, 2010Jan 29, 2010
589,181589,181281,731281,731307,450307,450TotalTotal
6,1816,1812,8172,8173,3643,3647.27.2ABAB--
28,40128,4018,4528,45219,94919,94914.214.2AB+AB+
9,3599,3595,6355,6353,7243,7244.04.0BB--
54,68754,68725,35625,35629,33129,3316.96.9B+B+
29,96029,96016,90416,90413,05613,0564.64.6AA--
204,124204,12495,78895,788108,336108,3366.86.8A+A+
30,05330,05319,72119,72110,33210,3323.13.1OO--
226,416226,416107,058107,058119,359119,3596.76.7O+O+
Estimated Estimated
US Blood US Blood
Supply Supply
(RBC)(RBC)
Estimated Estimated
Hospital Hospital
Inventory: Inventory:
constant 6 constant 6
day supplyday supply
BloodBlood
Distribution Distribution
InventoryInventory
Estimated Estimated
Days of Days of
SupplySupply
Blood Blood
Groups/ Groups/
TypeType
ImpressionImpression
The blood supply is adequate to meet needs with The blood supply is adequate to meet needs with just over 6 just over 6 ½½ days supply of O Positive blood days supply of O Positive blood and just over 3 days supply of O Negative blood and just over 3 days supply of O Negative blood available at blood centers across the nation.available at blood centers across the nation.
Hospital inventory shortage reporting in the Blood Hospital inventory shortage reporting in the Blood Availability and Safety Information System Availability and Safety Information System (BASIS) continue to reflect instances of RBC (BASIS) continue to reflect instances of RBC and platelet shortages; however, alternate and platelet shortages; however, alternate source purchases remain relatively low.source purchases remain relatively low.
Platelet inventories continue to appear tight as a Platelet inventories continue to appear tight as a national aggregate.national aggregate.
BASIS ReportBASIS Report
Represents approximately 95 Sentinel Hospitals reporting consistently
2
BASIS ReportBASIS Report
Represents approximately 95 Sentinel Hospitals reporting consistently
BASIS Hospital Red Cell SupplyBASIS Hospital Red Cell Supply
(All Group/Types)(All Group/Types)
Represents approximately 95 Sentinel Hospitals reporting consistently
BASIS Hospital Platelet SupplyBASIS Hospital Platelet Supply
Represents approximately 95 Sentinel Hospitals reporting consistently
BASIS ShortagesBASIS Shortages
Represents approximately 95 Sentinel Hospitals reporting consistently
BASIS ShortagesBASIS Shortages
Represents approximately 95 Sentinel Hospitals reporting consistently
BASIS ShortagesBASIS Shortages
Represents approximately 95 Sentinel Hospitals reporting consistently
3
National Blood Collection and National Blood Collection and
Utilization Survey OverviewUtilization Survey Overview�� IntroductionIntroduction
�� MethodsMethods
�� Key FindingsKey Findings
�� BiovigilanceBiovigilance
�� Hospital Costs of BloodHospital Costs of Blood
�� Collection and Processing Collection and Processing ExperienceExperience
�� Transfusion Experience Transfusion Experience
�� Cellular Therapy ProductsCellular Therapy Products
�� Historical PerspectivesHistorical Perspectives
�� Current Issues in Transfusion and Current Issues in Transfusion and TransplantationTransplantation
www.hhs.gov/bloodsafety
Whole Blood and Whole Blood and
Red Blood Cell ApheresisRed Blood Cell Apheresis
-- 27.6%*27.6%*463,000463,000335,000335,00093,00093,000242,000242,000WB WB
AutologousAutologous
93.7% *93.7% *836,000836,0001,619,0001,619,00016,00016,0001,603,0001,603,000RBC RBC
ApheresisApheresis
0.5% 0.5% 14,087,00014,087,00014,151,00014,151,000665,000665,00013,486,00013,486,000WB WB
AllogeneicAllogeneic
4.3%4.3%15,503,00015,503,00016,174,00016,174,000796,000796,00015,378,00015,378,000TotalTotal
-- 40.3%*40.3%*117,000117,00070,00070,00022,00022,00047,00047,000WB DirectedWB Directed
Per Cent Per Cent
Difference Difference
((∆∆) ) TotalTotalTotalTotalHospitalHospitalBlood Blood
CenterCenter
2004200420062006Type of Type of
RBC RBC
CollectionCollection
Estimated Collections by Blood Centers and HospitalsEstimated Collections by Blood Centers and Hospitals
• May not be a appreciable increase due to blood centers were not weighted in 2004
• Significant Difference (*) from 2004 to 2006• 95% Confidence Intervals calculated
2006 Key Findings: Donors2006 Key Findings: Donors
�� 12,142,000 donors presented12,142,000 donors presented
�� 9,554,000 allogeneic donors9,554,000 allogeneic donors
��2,726,000 first2,726,000 first--time donors (28.5%)time donors (28.5%)
��6,828,000 repeat donors (71.5%)6,828,000 repeat donors (71.5%)
�� Repeat donors provided 11,697,000 Repeat donors provided 11,697,000
donations donations –– 1.7 donations/donor1.7 donations/donor
2006 Key Findings2006 Key Findings
�� 30,044,000 components transfused30,044,000 components transfused
�� 14,650,000 red cells14,650,000 red cells
�� 10,388,000 platelet concentrate eq.10,388,000 platelet concentrate eq.
�� 4,010,000 plasma4,010,000 plasma
�� 993,000 cryoprecipitate993,000 cryoprecipitate
Whole Blood and Whole Blood and
Red Blood Cell ApheresisRed Blood Cell Apheresis
-- 44.9%*44.9%*274,000274,000151,000151,00014,00014,000137,000137,000Rejected on Rejected on
TestingTesting
4.3%4.3%15,503,00015,503,00016,174,00016,174,000796,000796,00015,378,00015,378,000TotalTotal
5.2%5.2%15,299,00015,299,00016,023,00016,023,000782,000782,00015,241,00015,241,000Available Available
SupplySupply
Per Cent Per Cent
Difference Difference
((∆∆) ) TotalTotalTotalTotalHospitalHospitalBlood Blood
CenterCenter
2004200420062006Type of Type of
RBC RBC
CollectionCollection
Estimated Collections by Blood Centers and HospitalsEstimated Collections by Blood Centers and Hospitals
• Significant Difference (*) from 2004 to 2006
• 95% Confidence Intervals calculated
4
Red Blood Cell TransfusionsRed Blood Cell Transfusions
-- 30.3%*30.3%*271,000271,000189,000*189,000*182,000182,0007,0007,000AutologousAutologous
504.8%*504.8%*59,00059,000357,000*357,000*352,000352,0005,0005,000PediatricPediatric
1.8%1.8%13,728,00013,728,00013,978.00013,978.00013,262,00013,262,000716,000716,000Allogeneic Allogeneic
(not (not
directed)directed)
3.2%3.2%14,191,00014,191,00014,650,00014,650,00013,921,00013,921,000729,000729,000TotalTotal
-- 4.6%4.6%132,000132,000126,000126,000126,000126,00000DirectedDirected
Per Cent Per Cent
Difference Difference
((∆∆) ) TotalTotalTotalTotalHospitalHospitalBlood Blood
CenterCenter
2004200420062006Type of Type of
RBC RBC
TransfusionTransfusion
Estimated Transfusions by Blood Centers and HospitalsEstimated Transfusions by Blood Centers and Hospitals
• Significant Difference (*) from 2004 to 2006
• 95% Confidence Intervals calculated
WB and RBC RecipientsWB and RBC Recipients
�� 3.0 units per recipient (3.0 units per recipient (unweightedunweighted))
�� 8,275,000 allogeneic units (8,275,000 allogeneic units (inclincl directed)directed)
�� 2,740,000 recipients 2,740,000 recipients
�� 2004: 2004: 2.7 units per recipient2.7 units per recipient
�� Extrapolation of ratio of Extrapolation of ratio of transfused/recipient transfused/recipient
�� Estimated 5 M recipientEstimated 5 M recipient
�� 6.6% decrease in transfusion recipients 6.6% decrease in transfusion recipients (compared to 2004)(compared to 2004)
Platelets TransfusedPlatelets Transfused
9.0%9.0%8,343,0008,343,0009,092,000 9,092,000
(1,515,000)(1,515,000)8,681,0008,681,000411,000411,000Apheresis Apheresis
PlateletsPlatelets
--15.7%15.7%1,537,0001,537,0001,296,0001,296,0001,073,0001,073,000223,000223,000WB Derived WB Derived
PlateletsPlatelets
5.1%5.1%9,881,0009,881,00010,388,000*10,388,000*9,754,0009,754,000634,000634,000TotalTotal
Per Cent Per Cent
Difference Difference
((∆∆) ) TotalTotalTotalTotalHospitalHospitalBlood Blood
CenterCenter
2004200420062006Type of Type of
Product Product
TransfusedTransfused
Estimated Transfusions by Blood Centers and HospitalsEstimated Transfusions by Blood Centers and Hospitals
• Parenthesis notation is apheresis units including splits
• Significant Difference (*) from 2004 to 2006• 95% Confidence Intervals calculated
Apheresis
83%
WBDP
17%
WBDP
Apheresis
Platelet Dose for TransfusionsPlatelet Dose for Transfusions
0
10
20
30
40
50
60
Per Cent
of
Hospitals
5 or
less
7 9 >10
Dose of Platelet
Concentrate
2001
2004
2006
FFP
77%
Jumbo
Plasma
2%
Pediatric
1%
Plasma w/i 24
hours
15%
Cryo-
Reduced
Plasma
5%FFP
Plasma w/i 24 hours
Jumbo Plasma
Pediatric
Cryo- ReducedPlasma
Plasma Type TransfusedPlasma Type Transfused
3%3%13,00013,000Whole BloodWhole Blood
1%1%5,0005,000DirectedDirected
401,000401,00016,745,00016,745,000WB/RBCWB/RBC
63%63%252,000252,000AllogeneicAllogeneic
Outdate of Red CellsOutdate of Red Cells
Processed/ Processed/
producedproduced
33%33%131.000131.000AutologousAutologous
Per Cent Per Cent
OutdateOutdateTotal Total
OutdateOutdateComponentComponent
Allogeneic
63%
Directed
1%
Whole Blood
3%
Autologous
33%
Allogeneic
Autologous
Directed
Whole Blood
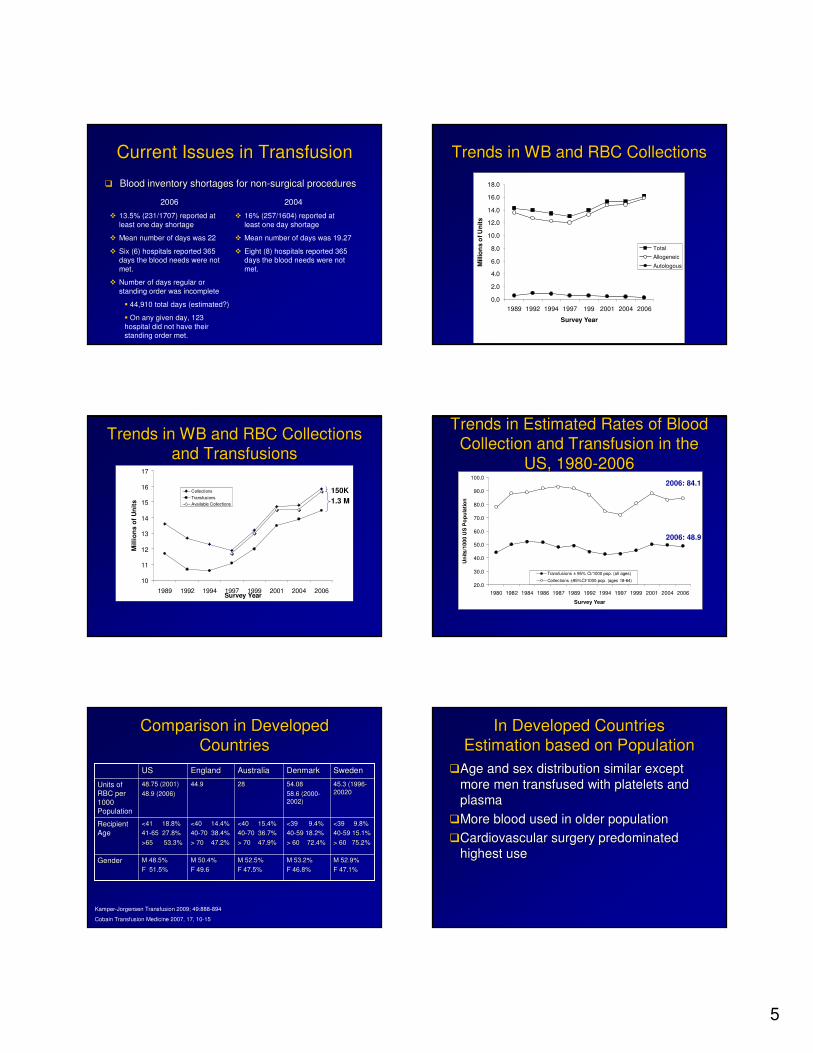
5
Current Issues in TransfusionCurrent Issues in Transfusion
�� Blood inventory shortages for nonBlood inventory shortages for non--surgical proceduressurgical procedures
2006
� 13.5% (231/1707) reported at
least one day shortage
� Mean number of days was 22
� Six (6) hospitals reported 365 days the blood needs were not
met.
� Number of days regular or
standing order was incomplete
� 44,910 total days (estimated?)
� On any given day, 123
hospital did not have their standing order met.
2004
� 16% (257/1604) reported at
least one day shortage
� Mean number of days was 19.27
� Eight (8) hospitals reported 365 days the blood needs were not
met.
Trends in WB and RBC Collections Trends in WB and RBC Collections
0.0
2.0
4.0
6.0
8.0
10.0
12.0
14.0
16.0
18.0
1989 1992 1994 1997 199 2001 2004 2006
Survey Year
Millio
ns o
f U
nit
s
Total
Allogeneic
Autologous
Trends in WB and RBC Collections Trends in WB and RBC Collections
and Transfusionsand Transfusions
10
11
12
13
14
15
16
17
1989 1992 1994 1997 1999 2001 2004 2006Survey Year
Mil
lio
ns o
f U
nit
s
Collections
Transfusions
Available Collections1.3 M
150K
Trends in Estimated Rates of Blood Trends in Estimated Rates of Blood
Collection and Transfusion in the Collection and Transfusion in the
US, 1980US, 1980--20062006
20.0
30.0
40.0
50.0
60.0
70.0
80.0
90.0
100.0
1980 1982 1984 1986 1987 1989 1992 1994 1997 1999 2001 2004 2006
Survey Year
Un
its
/10
00
US
Po
pu
lati
on
Transfusions ± 95% Cl/1000 pop. (all ages)
Collections ±95%CI/1000 pop. (ages 18-64)
2006: 48.9
2006: 84.1
Comparison in Developed Comparison in Developed
Countries Countries
M 53.2%M 53.2%
F 46.8%F 46.8%
<39 9.4%<39 9.4%
4040--59 18.2%59 18.2%
> 60 72.4%> 60 72.4%
54.0854.08
58.6 (200058.6 (2000--
2002)2002)
DenmarkDenmark
M 52.9%M 52.9%
F 47.1%F 47.1%
M 52.5%M 52.5%
F 47.5%F 47.5%
M 50.4%M 50.4%
F 49.6F 49.6
M 48.5%M 48.5%
F 51.5%F 51.5%
GenderGender
<39 9.8%<39 9.8%
4040--59 15.1%59 15.1%
> 60 75.2%> 60 75.2%
<40 15.4%<40 15.4%
4040--70 36.7%70 36.7%
> 70 47.9%> 70 47.9%
<40 14.4%<40 14.4%
4040--70 38.4%70 38.4%
> 70 47.2%> 70 47.2%
<41 18.8%<41 18.8%
4141--65 27.8%65 27.8%
>65 53.3%>65 53.3%
Recipient Recipient
AgeAge
45.3 (199645.3 (1996--
2002020020282844.944.948.75 (2001)48.75 (2001)
48.9 (2006)48.9 (2006)
Units of Units of
RBC per RBC per
1000 1000
PopulationPopulation
SwedenSwedenAustraliaAustraliaEnglandEnglandUSUS
Kamper-Jorgensen Transfusion 2009; 49:888-894
Cobain Transfusion Medicine 2007, 17, 10-15
In Developed CountriesIn Developed Countries
Estimation based on PopulationEstimation based on Population
��Age and sex distribution similar except Age and sex distribution similar except
more men transfused with platelets and more men transfused with platelets and
plasmaplasma
��More blood used in older populationMore blood used in older population
��Cardiovascular surgery predominated Cardiovascular surgery predominated
highest usehighest use
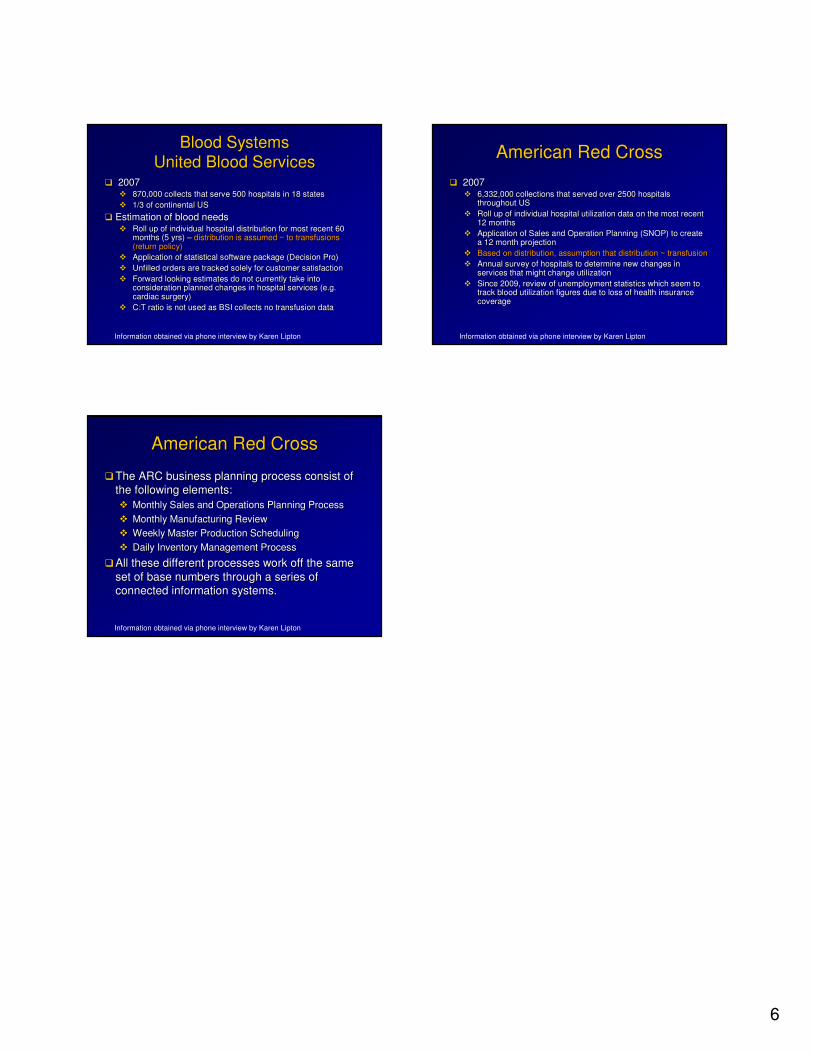
6
Blood SystemsBlood Systems
United Blood ServicesUnited Blood Services�� 2007 2007
�� 870,000 collects that serve 500 hospitals in 18 states 870,000 collects that serve 500 hospitals in 18 states
�� 1/3 of continental US1/3 of continental US
�� Estimation of blood needsEstimation of blood needs�� Roll up of individual hospital distribution for most recent 60 Roll up of individual hospital distribution for most recent 60
months (5 yrs) months (5 yrs) –– distribution is assumed ~ to transfusions distribution is assumed ~ to transfusions (return policy)(return policy)
�� Application of statistical software package (Decision Pro)Application of statistical software package (Decision Pro)
�� Unfilled orders are tracked solely for customer satisfactionUnfilled orders are tracked solely for customer satisfaction
�� Forward looking estimates do not currently take into Forward looking estimates do not currently take into consideration planned changes in hospital services (e.g. consideration planned changes in hospital services (e.g. cardiac surgery)cardiac surgery)
�� C:T ratio is not used as BSI collects no transfusion dataC:T ratio is not used as BSI collects no transfusion data
Information obtained via phone interview by Karen Lipton
American Red CrossAmerican Red Cross
�� 20072007�� 6,332,000 collections that served over 2500 hospitals 6,332,000 collections that served over 2500 hospitals
throughout USthroughout US
�� Roll up of individual hospital utilization data on the most receRoll up of individual hospital utilization data on the most recent nt 12 months12 months
�� Application of Sales and Operation Planning (SNOP) to create Application of Sales and Operation Planning (SNOP) to create a 12 month projectiona 12 month projection
�� Based on distribution, assumption that distribution ~ transfusioBased on distribution, assumption that distribution ~ transfusion n
�� Annual survey of hospitals to determine new changes in Annual survey of hospitals to determine new changes in services that might change utilization services that might change utilization
�� Since 2009, review of unemployment statistics which seem to Since 2009, review of unemployment statistics which seem to track blood utilization figures due to loss of health insurance track blood utilization figures due to loss of health insurance coverage coverage
Information obtained via phone interview by Karen Lipton
American Red CrossAmerican Red Cross
�� The ARC business planning process consist of The ARC business planning process consist of
the following elements:the following elements:
�� Monthly Sales and Operations Planning ProcessMonthly Sales and Operations Planning Process
�� Monthly Manufacturing ReviewMonthly Manufacturing Review
�� Weekly Master Production SchedulingWeekly Master Production Scheduling
�� Daily Inventory Management ProcessDaily Inventory Management Process
�� All these different processes work off the same All these different processes work off the same
set of base numbers through a series of set of base numbers through a series of
connected information systems.connected information systems.
Information obtained via phone interview by Karen Lipton
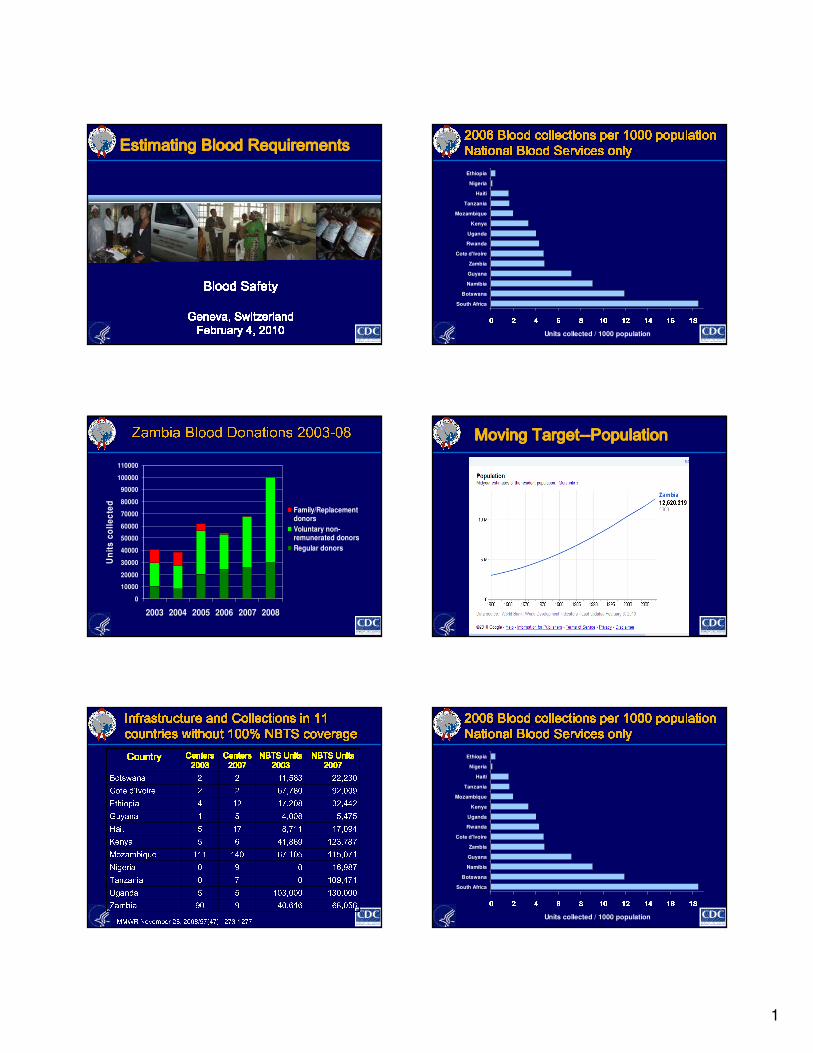
1
Estimating Blood RequirementsEstimating Blood RequirementsEstimating Blood RequirementsEstimating Blood Requirements
Blood SafetyBlood SafetyBlood SafetyBlood SafetyGeneva, SwitzerlandGeneva, SwitzerlandGeneva, SwitzerlandGeneva, SwitzerlandFebruary 4, 2010February 4, 2010February 4, 2010February 4, 20102006 Blood collections per 1000 population 2006 Blood collections per 1000 population 2006 Blood collections per 1000 population 2006 Blood collections per 1000 population 2006 Blood collections per 1000 population 2006 Blood collections per 1000 population 2006 Blood collections per 1000 population 2006 Blood collections per 1000 population National Blood Services onlyNational Blood Services onlyNational Blood Services onlyNational Blood Services onlyNational Blood Services onlyNational Blood Services onlyNational Blood Services onlyNational Blood Services only
0000 2222 4444 6666 8888 10101010 12121212 14141414 16161616 18181818South Africa
Botswana
Namibia
Guyana
Zambia
Cote d'Ivoire
Rwanda
Uganda
Kenya
Mozambique
Tanzania
Haiti
Nigeria
Ethiopia
Units collected / 1000 population
Zambia Blood Donations 2003Zambia Blood Donations 2003--08080
10000
20000
30000
40000
50000
60000
70000
80000
90000
100000
110000
2003 2004 2005 2006 2007 2008
Un
its
co
lle
cte
d
Family/Replacementdonors
Voluntary non-remunerated donors
Regular donors
Moving TargetMoving TargetMoving TargetMoving Target--------PopulationPopulationPopulationPopulation
Infrastructure and Collections in 11 Infrastructure and Collections in 11 Infrastructure and Collections in 11 Infrastructure and Collections in 11 Infrastructure and Collections in 11 Infrastructure and Collections in 11 Infrastructure and Collections in 11 Infrastructure and Collections in 11 countries without 100% NBTS coveragecountries without 100% NBTS coveragecountries without 100% NBTS coveragecountries without 100% NBTS coveragecountries without 100% NBTS coveragecountries without 100% NBTS coveragecountries without 100% NBTS coveragecountries without 100% NBTS coverage68,05640,616990Zambia 130,000103,00055Uganda 109,471070Tanzania 16,987090Nigeria 115,07167,105140111Mozambique 123,78741,86965Kenya 17,0948,711175Haiti 5,4754,00851Guyana 32,44217,208124Ethiopia 92,00967,78022Cote d’Ivoire 22,23011,58322Botswana NBTS Units NBTS Units NBTS Units NBTS Units 2007200720072007NBTS Units NBTS Units NBTS Units NBTS Units 2003200320032003Centers Centers Centers Centers 2007200720072007Centers Centers Centers Centers 2003200320032003CountryCountryCountryCountry
MMWR November 28, 2008/57(47):1273-1277
2006 Blood collections per 1000 population 2006 Blood collections per 1000 population 2006 Blood collections per 1000 population 2006 Blood collections per 1000 population 2006 Blood collections per 1000 population 2006 Blood collections per 1000 population 2006 Blood collections per 1000 population 2006 Blood collections per 1000 population National Blood Services onlyNational Blood Services onlyNational Blood Services onlyNational Blood Services onlyNational Blood Services onlyNational Blood Services onlyNational Blood Services onlyNational Blood Services only0000 2222 4444 6666 8888 10101010 12121212 14141414 16161616 18181818South Africa
Botswana
Namibia
Guyana
Zambia
Cote d'Ivoire
Rwanda
Uganda
Kenya
Mozambique
Tanzania
Haiti
Nigeria
Ethiopia
Units collected / 1000 population
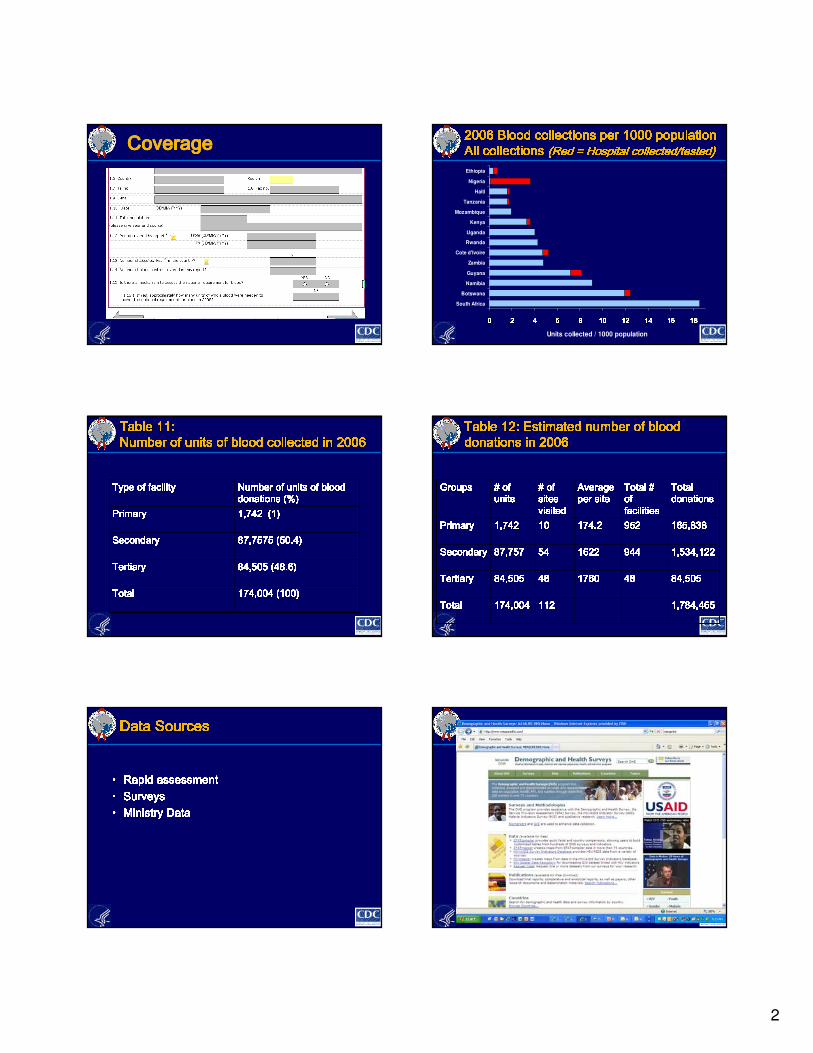
2
CoverageCoverageCoverageCoverage 2006 Blood collections per 1000 population 2006 Blood collections per 1000 population 2006 Blood collections per 1000 population 2006 Blood collections per 1000 population 2006 Blood collections per 1000 population 2006 Blood collections per 1000 population 2006 Blood collections per 1000 population 2006 Blood collections per 1000 population All collections All collections All collections All collections All collections All collections All collections All collections (Red = Hospital collected/tested)(Red = Hospital collected/tested)(Red = Hospital collected/tested)(Red = Hospital collected/tested)(Red = Hospital collected/tested)(Red = Hospital collected/tested)(Red = Hospital collected/tested)(Red = Hospital collected/tested)0000 2222 4444 6666 8888 10101010 12121212 14141414 16161616 18181818South Africa
Botswana
Namibia
Guyana
Zambia
Cote d'Ivoire
Rwanda
Uganda
Kenya
Mozambique
Tanzania
Haiti
Nigeria
Ethiopia
Units collected / 1000 population
Table 11: Table 11: Table 11: Table 11: Table 11: Table 11: Table 11: Table 11: Number of units of blood collected in 2006Number of units of blood collected in 2006Number of units of blood collected in 2006Number of units of blood collected in 2006Number of units of blood collected in 2006Number of units of blood collected in 2006Number of units of blood collected in 2006Number of units of blood collected in 2006174,004 (100)174,004 (100)174,004 (100)174,004 (100)TotalTotalTotalTotal 84,505 (48.6)84,505 (48.6)84,505 (48.6)84,505 (48.6)TertiaryTertiaryTertiaryTertiary 87,7575 (50.4)87,7575 (50.4)87,7575 (50.4)87,7575 (50.4)SecondarySecondarySecondarySecondary 1,742 (1)1,742 (1)1,742 (1)1,742 (1)PrimaryPrimaryPrimaryPrimary Number of units of blood Number of units of blood Number of units of blood Number of units of blood donations (%)donations (%)donations (%)donations (%)Type of facilityType of facilityType of facilityType of facility Table 12: Estimated number of blood Table 12: Estimated number of blood Table 12: Estimated number of blood Table 12: Estimated number of blood Table 12: Estimated number of blood Table 12: Estimated number of blood Table 12: Estimated number of blood Table 12: Estimated number of blood donations in 2006donations in 2006donations in 2006donations in 2006donations in 2006donations in 2006donations in 2006donations in 2006
1,784,4651,784,4651,784,4651,784,465112112112112174,004174,004174,004174,004TotalTotalTotalTotal 84,50584,50584,50584,5054848484817601760176017604848484884,50584,50584,50584,505TertiaryTertiaryTertiaryTertiary 1,534,1221,534,1221,534,1221,534,12294494494494416221622162216225454545487,75787,75787,75787,757SecondarySecondarySecondarySecondary 165,838165,838165,838165,838952952952952174.2174.2174.2174.2101010101,7421,7421,7421,742PrimaryPrimaryPrimaryPrimary Total Total Total Total donationsdonationsdonationsdonationsTotal # Total # Total # Total # of of of of facilitiesfacilitiesfacilitiesfacilitiesAverage Average Average Average per siteper siteper siteper site# of # of # of # of sites sites sites sites visitedvisitedvisitedvisited# of # of # of # of unitsunitsunitsunitsGroupsGroupsGroupsGroups
Data SourcesData SourcesData SourcesData SourcesData SourcesData SourcesData SourcesData Sources• Rapid assessmentRapid assessmentRapid assessmentRapid assessment• SurveysSurveysSurveysSurveys• Ministry DataMinistry DataMinistry DataMinistry Data
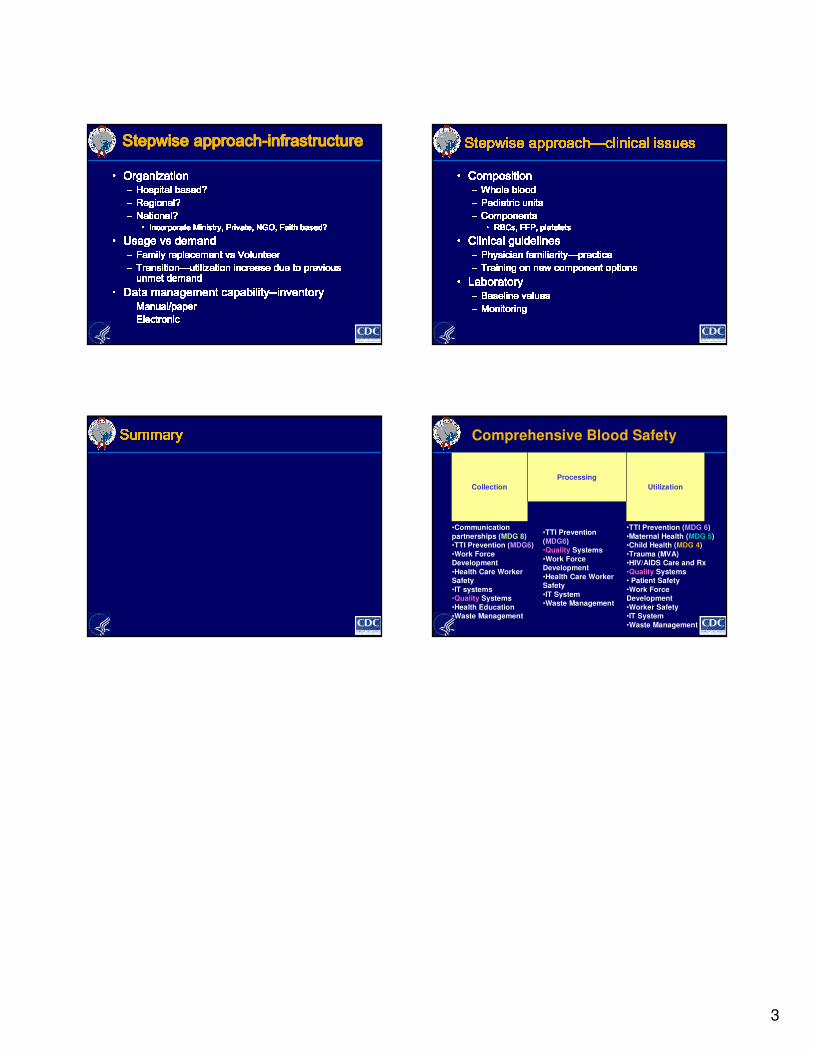
3
Stepwise Stepwise Stepwise Stepwise approachapproachapproachapproach----infrastructureinfrastructureinfrastructureinfrastructure• OrganizationOrganizationOrganizationOrganization– Hospital based?Hospital based?Hospital based?Hospital based?– Regional?Regional?Regional?Regional?– National?National?National?National?• Incorporate Ministry, Private, NGO, Faith based?Incorporate Ministry, Private, NGO, Faith based?Incorporate Ministry, Private, NGO, Faith based?Incorporate Ministry, Private, NGO, Faith based?• Usage Usage Usage Usage vsvsvsvs demanddemanddemanddemand– Family replacement Family replacement Family replacement Family replacement vsvsvsvs VolunteerVolunteerVolunteerVolunteer– TransitionTransitionTransitionTransition————utilization increase due to previous utilization increase due to previous utilization increase due to previous utilization increase due to previous unmet demandunmet demandunmet demandunmet demand• Data management capabilityData management capabilityData management capabilityData management capability--------inventoryinventoryinventoryinventory– Manual/paperManual/paperManual/paperManual/paper– ElectronicElectronicElectronicElectronicStepwise approachStepwise approachStepwise approachStepwise approach————clinical issuesclinical issuesclinical issuesclinical issues• CompositionCompositionCompositionComposition– Whole bloodWhole bloodWhole bloodWhole blood– Pediatric unitsPediatric unitsPediatric unitsPediatric units– ComponentsComponentsComponentsComponents• RBCsRBCsRBCsRBCs, FFP, platelets, FFP, platelets, FFP, platelets, FFP, platelets• Clinical guidelinesClinical guidelinesClinical guidelinesClinical guidelines– Physician familiarityPhysician familiarityPhysician familiarityPhysician familiarity————practicepracticepracticepractice– Training on new component optionsTraining on new component optionsTraining on new component optionsTraining on new component options• LaboratoryLaboratoryLaboratoryLaboratory– Baseline valuesBaseline valuesBaseline valuesBaseline values– MonitoringMonitoringMonitoringMonitoring
SummarySummarySummarySummarySummarySummarySummarySummaryCollection Utilization
Processing
Comprehensive Blood Safety
•Communication
partnerships (MDG 8)•TTI Prevention (MDG6)
•Work Force Development
•Health Care Worker Safety
•IT systems•Quality Systems
•Health Education•Waste Management
•TTI Prevention
(MDG6)•Quality Systems
•Work Force Development
•Health Care Worker Safety
•IT System•Waste Management
•TTI Prevention (MDG 6)
•Maternal Health (MDG 5)•Child Health (MDG 4)
•Trauma (MVA)•HIV/AIDS Care and Rx
•Quality Systems• Patient Safety
•Work Force Development
•Worker Safety•IT System
•Waste Management
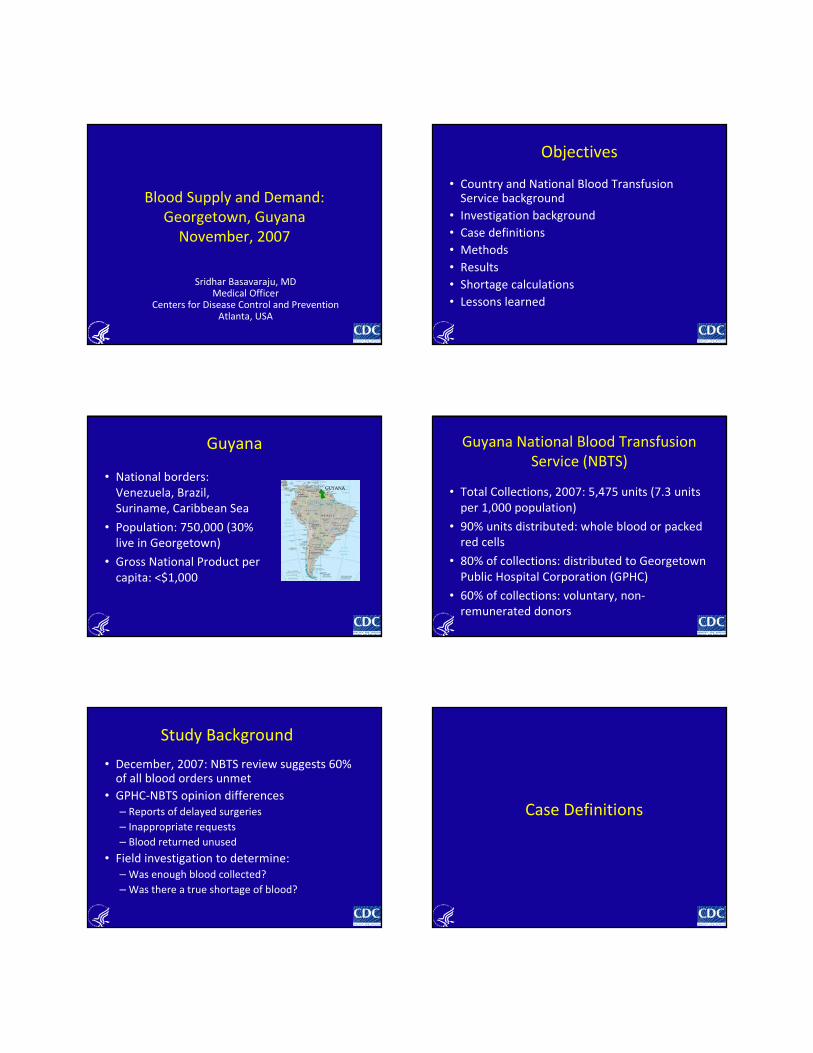
Blood Supply and Demand:
Georgetown, Guyana
November, 2007
Sridhar Basavaraju, MDMedical Officer
Centers for Disease Control and PreventionAtlanta, USA
Objectives
• Country and National Blood Transfusion Service background
• Investigation background
• Case definitions
• Methods
• Results
• Shortage calculations
• Lessons learned
Guyana
• National borders:
Venezuela, Brazil,
Suriname, Caribbean Sea
• Population: 750,000 (30%
live in Georgetown)
• Gross National Product per
capita: <$1,000
Guyana National Blood Transfusion
Service (NBTS)
• Total Collections, 2007: 5,475 units (7.3 units
per 1,000 population)
• 90% units distributed: whole blood or packed
red cells
• 80% of collections: distributed to Georgetown
Public Hospital Corporation (GPHC)
• 60% of collections: voluntary, non-
remunerated donors
Study Background
• December, 2007: NBTS review suggests 60% of all blood orders unmet
• GPHC-NBTS opinion differences
– Reports of delayed surgeries
– Inappropriate requests
– Blood returned unused
• Field investigation to determine:
– Was enough blood collected?
– Was there a true shortage of blood?
Case Definitions
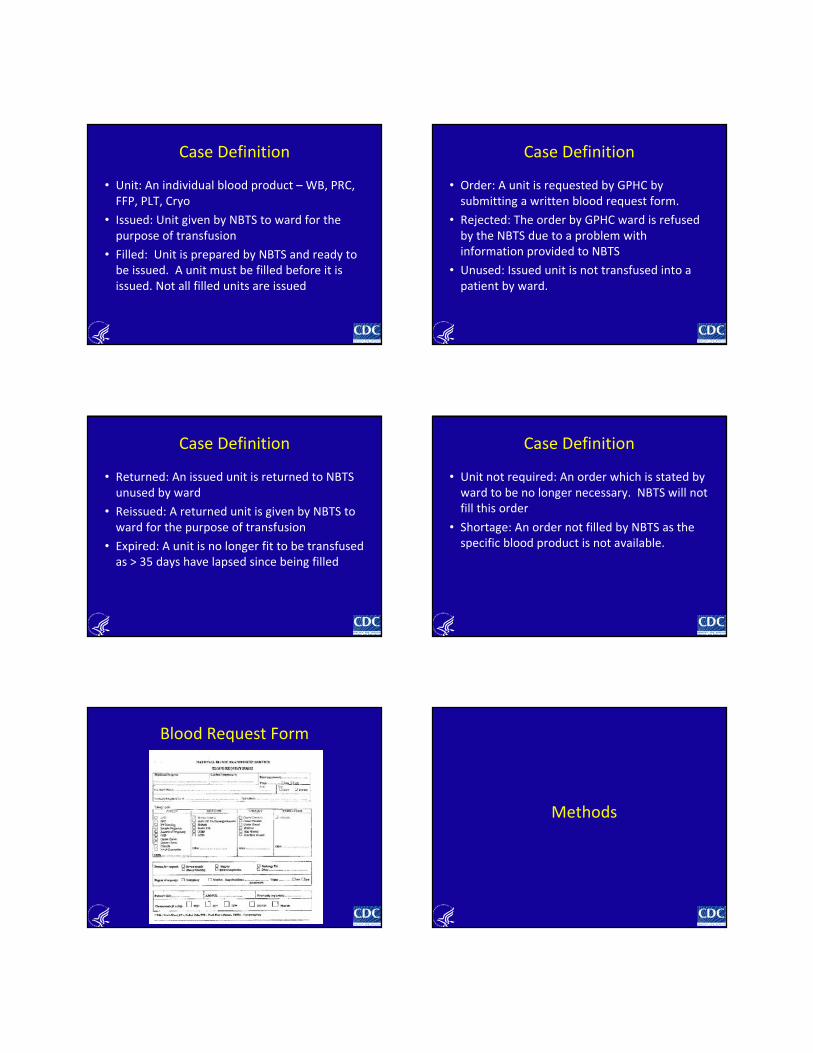
Case Definition
• Unit: An individual blood product – WB, PRC,
FFP, PLT, Cryo
• Issued: Unit given by NBTS to ward for the
purpose of transfusion
• Filled: Unit is prepared by NBTS and ready to
be issued. A unit must be filled before it is
issued. Not all filled units are issued
Case Definition
• Order: A unit is requested by GPHC by
submitting a written blood request form.
• Rejected: The order by GPHC ward is refused
by the NBTS due to a problem with
information provided to NBTS
• Unused: Issued unit is not transfused into a
patient by ward.
Case Definition
• Returned: An issued unit is returned to NBTS
unused by ward
• Reissued: A returned unit is given by NBTS to
ward for the purpose of transfusion
• Expired: A unit is no longer fit to be transfused
as > 35 days have lapsed since being filled
Case Definition
• Unit not required: An order which is stated by
ward to be no longer necessary. NBTS will not
fill this order
• Shortage: An order not filled by NBTS as the
specific blood product is not available.
Blood Request Form
Methods
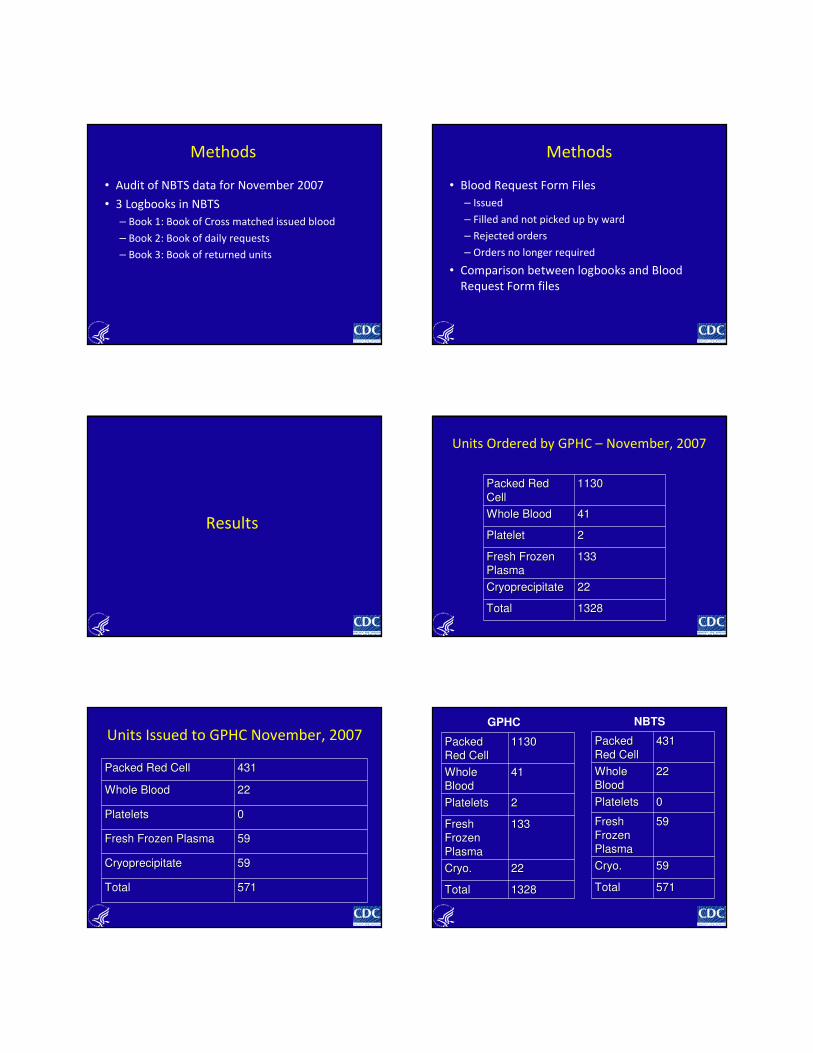
Methods
• Audit of NBTS data for November 2007
• 3 Logbooks in NBTS
– Book 1: Book of Cross matched issued blood
– Book 2: Book of daily requests
– Book 3: Book of returned units
Methods
• Blood Request Form Files
– Issued
– Filled and not picked up by ward
– Rejected orders
– Orders no longer required
• Comparison between logbooks and Blood
Request Form files
Results
Units Ordered by GPHC – November, 2007
Packed Red Packed Red
CellCell11301130
Whole BloodWhole Blood 4141
PlateletPlatelet 22
Fresh Frozen Fresh Frozen
PlasmaPlasma133133
CryoprecipitateCryoprecipitate 2222
TotalTotal 13281328
Units Issued to GPHC November, 2007
Packed Red CellPacked Red Cell 431431
Whole BloodWhole Blood 2222
PlateletsPlatelets 00
Fresh Frozen PlasmaFresh Frozen Plasma 5959
CryoprecipitateCryoprecipitate 5959
TotalTotal 571571
Packed Packed
Red CellRed Cell11301130
Whole Whole
BloodBlood4141
PlateletsPlatelets 22
Fresh Fresh
Frozen Frozen
PlasmaPlasma
133133
CryoCryo.. 2222
TotalTotal 13281328
Packed Packed
Red CellRed Cell431431
Whole Whole
BloodBlood2222
PlateletsPlatelets 00
Fresh Fresh
Frozen Frozen
PlasmaPlasma
5959
CryoCryo.. 5959
TotalTotal 571571
GPHC NBTS
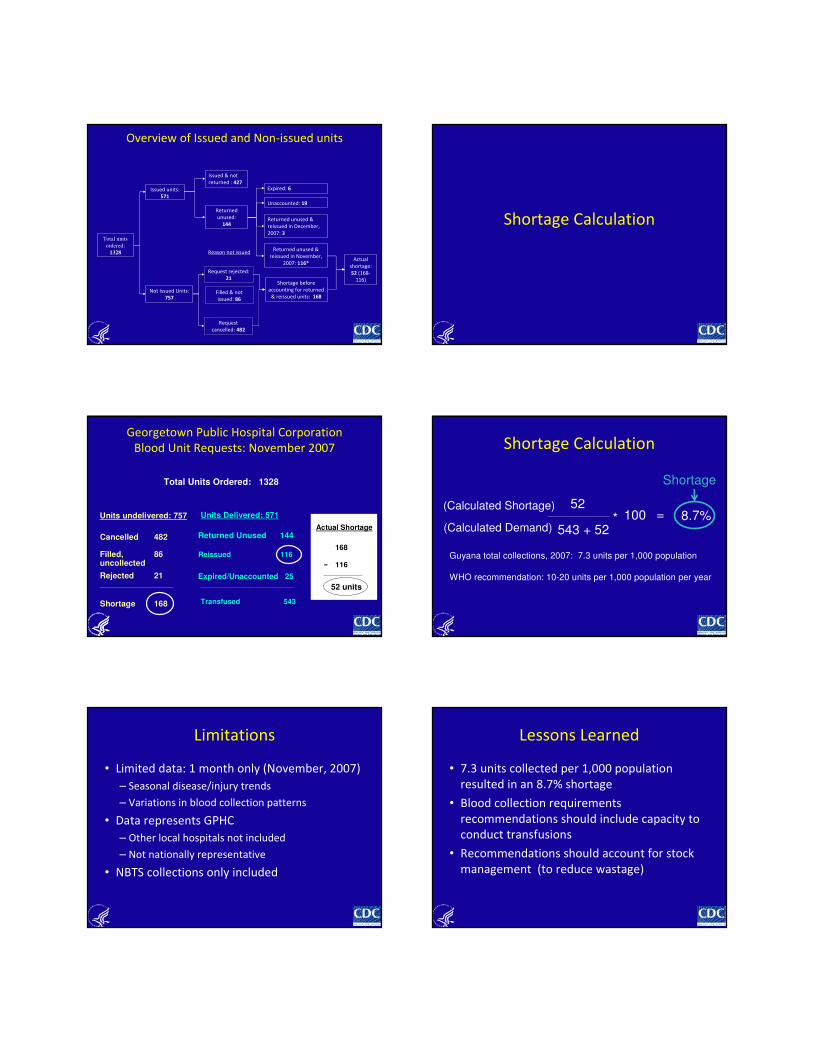
Overview of Issued and Non-issued units
Total units
ordered:
1328
Issued units:
571
Not Issued Units:
757
Issued & not
returned : 427
Request
cancelled: 482
Filled & not
issued: 86
Request rejected:
21
Returned
unused:
144
Expired: 6
Returned unused &
reissued in December,
2007: 3
Returned unused &
reissued in November,
2007: 116*
Shortage before
accounting for returned
& reissued units: 168
Actual
shortage:
52 (168-
116)
Reason not issued
Unaccounted: 19
Shortage Calculation
Georgetown Public Hospital Corporation
Blood Unit Requests: November 2007
Total Units Ordered: 1328
Units undelivered: 757
Cancelled 482
Filled, uncollected
86
Rejected 21
Shortage 168
Units Delivered: 571
Returned Unused 144
Reissued 116
Expired/Unaccounted 25
Transfused 543
Actual Shortage
168
116-
52 units
Shortage Calculation
52
543 + 52* 100 = 8.7%
Guyana total collections, 2007: 7.3 units per 1,000 population
WHO recommendation: 10-20 units per 1,000 population per year
(Calculated Shortage)
(Calculated Demand)
Shortage
Limitations
• Limited data: 1 month only (November, 2007)
– Seasonal disease/injury trends
– Variations in blood collection patterns
• Data represents GPHC
– Other local hospitals not included
– Not nationally representative
• NBTS collections only included
Lessons Learned
• 7.3 units collected per 1,000 population
resulted in an 8.7% shortage
• Blood collection requirements
recommendations should include capacity to
conduct transfusions
• Recommendations should account for stock
management (to reduce wastage)
Acknowledgements
• Guyana NBTS
– Clem McEwan
– Olwyn John
– Bonita Richards
• CDC
– Claudette Harry
– LaMar Hasbrouck
– Nicolette Henry
– Lawrence Marum
– John P. PitmanThe findings and conclusions in this presentation are those of
the author(s) and do not necessarily represent the views of the Centers for Disease Control and Prevention
Questions/Discussion
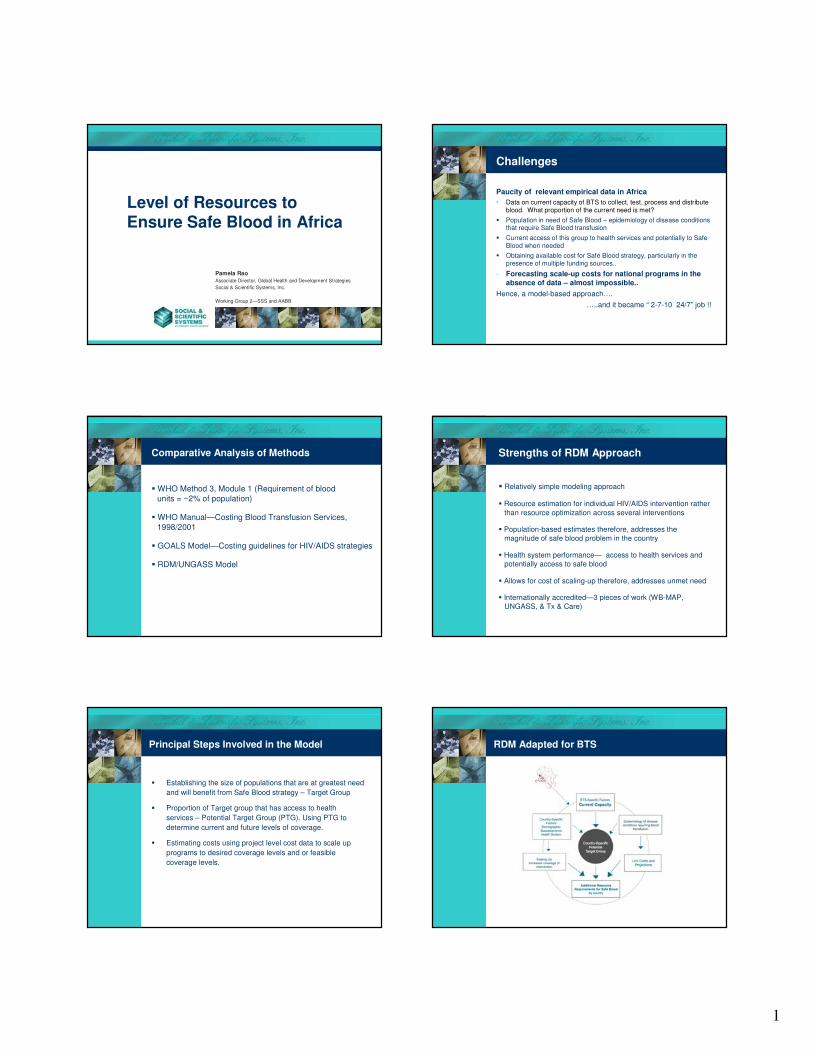
1
Level of Resources to Ensure Safe Blood in Africa
Pamela Rao
Associate Director, Global Health and Development Strategies
Social & Scientific Systems, Inc.
Working Group 2—SSS and AABB
Challenges
Paucity of relevant empirical data in Africa
• Data on current capacity of BTS to collect, test, process and distribute blood. What proportion of the current need is met?
� Population in need of Safe Blood – epidemiology of disease conditions that require Safe Blood transfusion
� Current access of this group to health services and potentially to Safe Blood when needed
� Obtaining available cost for Safe Blood strategy, particularly in the presence of multiple funding sources..
- Forecasting scale-up costs for national programs in the
absence of data – almost impossible..
Hence, a model-based approach….
…..and it became “ 2-7-10 24/7” job !!
Comparative Analysis of Methods
� WHO Method 3, Module 1 (Requirement of blood
units = ~2% of population)
� WHO Manual—Costing Blood Transfusion Services,
1998/2001
� GOALS Model—Costing guidelines for HIV/AIDS strategies
� RDM/UNGASS Model
Strengths of RDM Approach
� Relatively simple modeling approach
� Resource estimation for individual HIV/AIDS intervention rather
than resource optimization across several interventions
� Population-based estimates therefore, addresses the
magnitude of safe blood problem in the country
� Health system performance— access to health services and
potentially access to safe blood
� Allows for cost of scaling-up therefore, addresses unmet need
� Internationally accredited—3 pieces of work (WB-MAP,
UNGASS, & Tx & Care)
Principal Steps Involved in the Model
� Establishing the size of populations that are at greatest need
and will benefit from Safe Blood strategy – Target Group
� Proportion of Target group that has access to health
services – Potential Target Group (PTG). Using PTG to
determine current and future levels of coverage.
� Estimating costs using project level cost data to scale up
programs to desired coverage levels and or feasible
coverage levels.
RDM Adapted for BTS
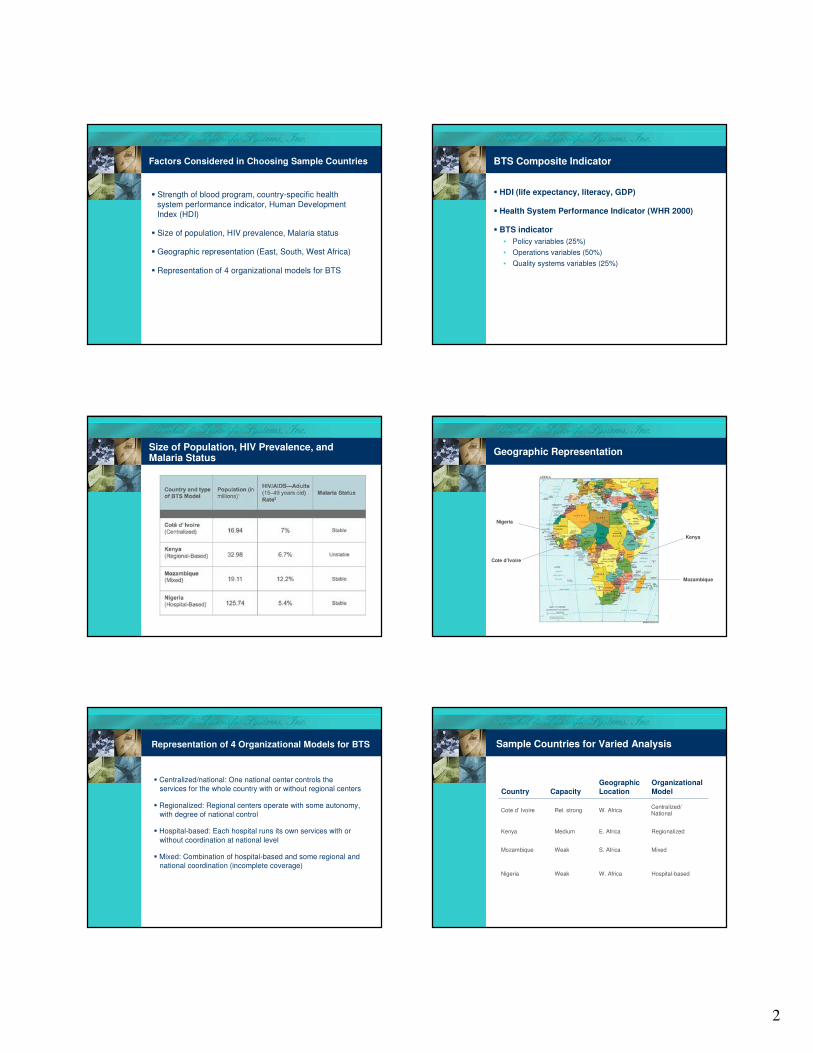
2
Factors Considered in Choosing Sample Countries
� Strength of blood program, country-specific health
system performance indicator, Human Development
Index (HDI)
� Size of population, HIV prevalence, Malaria status
� Geographic representation (East, South, West Africa)
� Representation of 4 organizational models for BTS
BTS Composite Indicator
� HDI (life expectancy, literacy, GDP)
� Health System Performance Indicator (WHR 2000)
� BTS indicator
• Policy variables (25%)
• Operations variables (50%)
• Quality systems variables (25%)
Size of Population, HIV Prevalence, and Malaria Status
Geographic Representation
Nigeria
Cote d’Ivoire
Kenya
Mozambique
Representation of 4 Organizational Models for BTS
� Centralized/national: One national center controls the
services for the whole country with or without regional centers
� Regionalized: Regional centers operate with some autonomy,
with degree of national control
� Hospital-based: Each hospital runs its own services with or
without coordination at national level
� Mixed: Combination of hospital-based and some regional and
national coordination (incomplete coverage)
Sample Countries for Varied Analysis
Hospital-basedW. AfricaWeakNigeria
MixedS. AfricaWeakMozambique
RegionalizedE. AfricaMediumKenya
Centralized/National
W. AfricaRel. strongCote d’ Ivoire
Organizational
Model
Geographic
LocationCapacityCountry
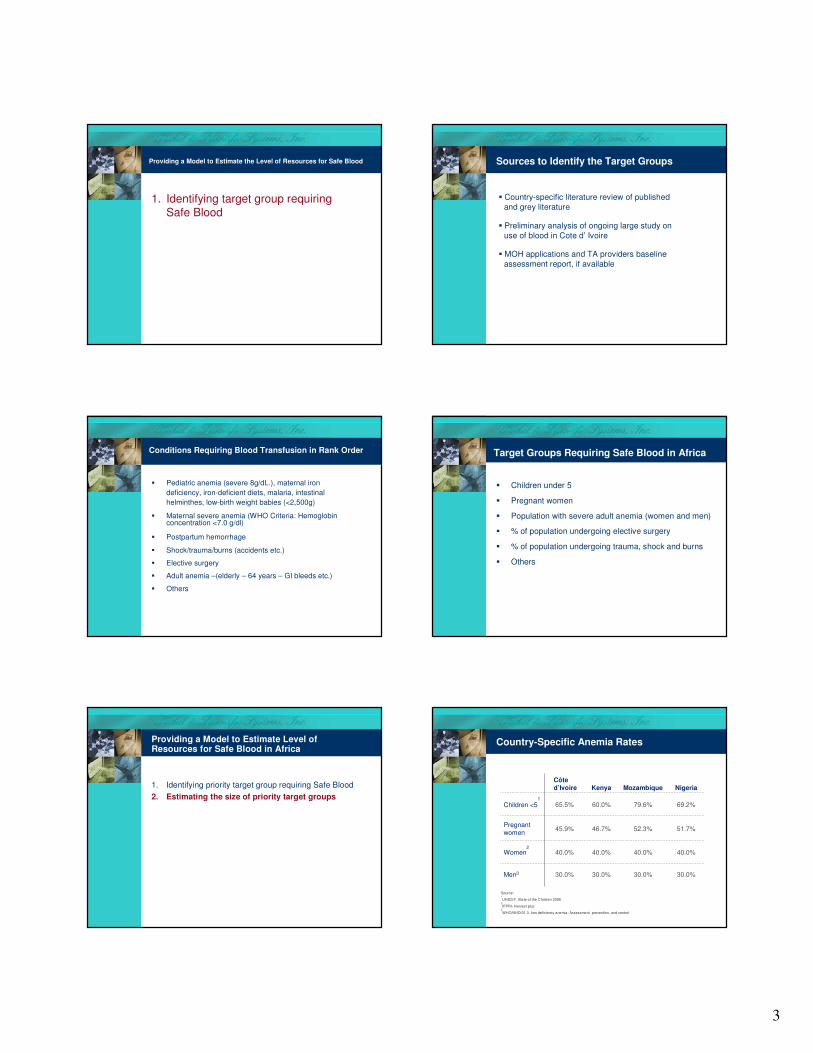
3
Providing a Model to Estimate the Level of Resources for Safe Blood
1. Identifying target group requiring Safe Blood
Sources to Identify the Target Groups
� Country-specific literature review of published
and grey literature
� Preliminary analysis of ongoing large study on
use of blood in Cote d’ Ivoire
� MOH applications and TA providers baseline
assessment report, if available
� Pediatric anemia (severe 8g/dL.), maternal iron
deficiency, iron-deficient diets, malaria, intestinal
helminthes, low-birth weight babies (<2,500g)
� Maternal severe anemia (WHO Criteria: Hemoglobin concentration <7.0 g/dl)
� Postpartum hemorrhage
� Shock/trauma/burns (accidents etc.)
� Elective surgery
� Adult anemia –(elderly – 64 years – GI bleeds etc.)
� Others
Conditions Requiring Blood Transfusion in Rank Order
� Children under 5
� Pregnant women
� Population with severe adult anemia (women and men)
� % of population undergoing elective surgery
� % of population undergoing trauma, shock and burns
� Others
Target Groups Requiring Safe Blood in Africa
Providing a Model to Estimate Level of Resources for Safe Blood in Africa
1. Identifying priority target group requiring Safe Blood
2. Estimating the size of priority target groups
Country-Specific Anemia Rates
30.0%
40.0%
51.7%
69.2%
Nigeria
30.0%30.0%30.0%Men3
40.0%40.0%40.0%Women2
52.3%46.7%45.9%Pregnant women
79.6%60.0%65.5%Children <51
MozambiqueKenyaCôte d’Ivoire
Source: 1
UNICEF. State of the Children 20062
IFPRI- Harvest plus3
WHO/NHD/01.3. Iron deficiency anemia: Assessment, prevention, and control
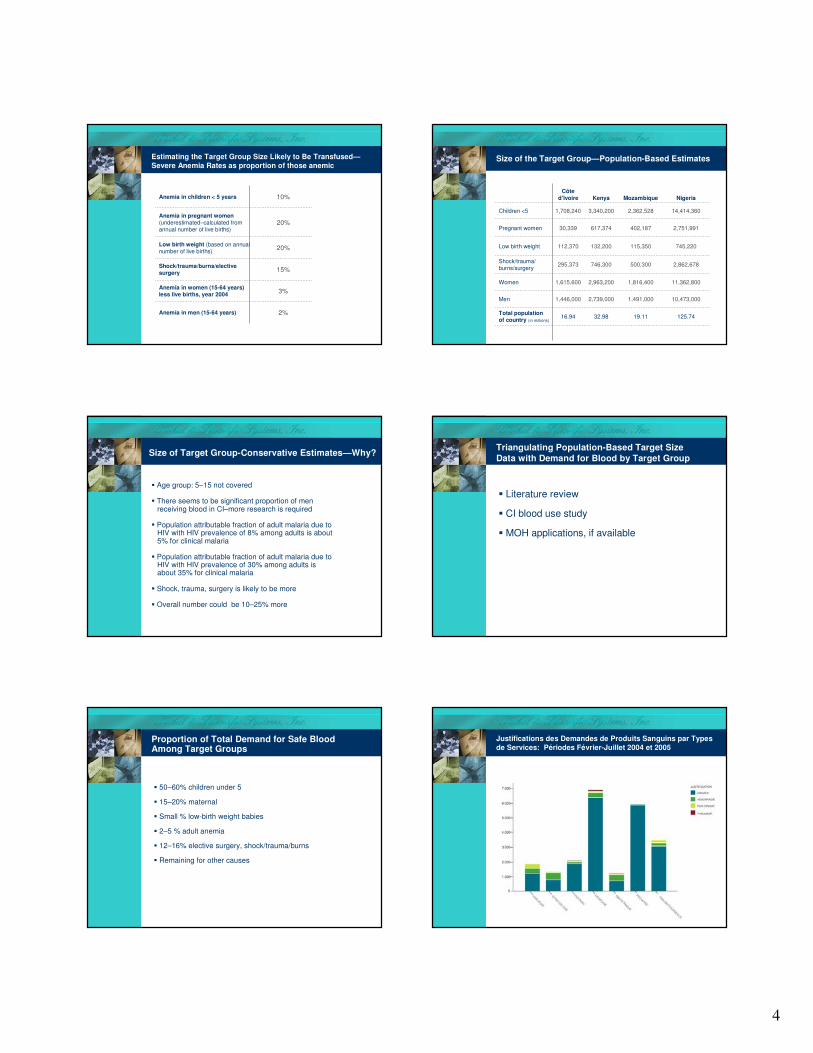
4
Estimating the Target Group Size Likely to Be Transfused—
Severe Anemia Rates as proportion of those anemic
3%Anemia in women (15-64 years) less live births, year 2004
15%Shock/trauma/burns/elective surgery
2%Anemia in men (15-64 years)
20%Low birth weight (based on annual number of live births)
20%Anemia in pregnant women (underestimated–calculated from annual number of live births)
10%Anemia in children < 5 years
Size of the Target Group—Population-Based Estimates
125.7419.1132.9816.94Total population of country (in millions)
2,862,678500,300746,300295,373Shock/trauma/ burns/surgery
745,220115,350132,200112,370Low birth weight
10,473,000
11,362,800
2,751,991
14,414,360
Nigeria
1,491,0002,739,0001,446,000Men
1,816,4002,963,2001,615,600Women
402,187617,37430,339Pregnant women
2,362,5283,340,2001,708,240Children <5
MozambiqueKenyaCôte
d’Ivoire
Size of Target Group-Conservative Estimates—Why?
� Age group: 5–15 not covered
� There seems to be significant proportion of men receiving blood in CI–more research is required
� Population attributable fraction of adult malaria due to HIV with HIV prevalence of 8% among adults is about 5% for clinical malaria
� Population attributable fraction of adult malaria due to HIV with HIV prevalence of 30% among adults is about 35% for clinical malaria
� Shock, trauma, surgery is likely to be more
� Overall number could be 10–25% more
Triangulating Population-Based Target Size
Data with Demand for Blood by Target Group
� Literature review
� CI blood use study
� MOH applications, if available
Proportion of Total Demand for Safe Blood Among Target Groups
� 50–60% children under 5
� 15–20% maternal
� Small % low-birth weight babies
� 2–5 % adult anemia
� 12–16% elective surgery, shock/trauma/burns
� Remaining for other causes
Justifications des Demandes de Produits Sanguins par Types
de Services: Périodes Février-Juillet 2004 et 2005
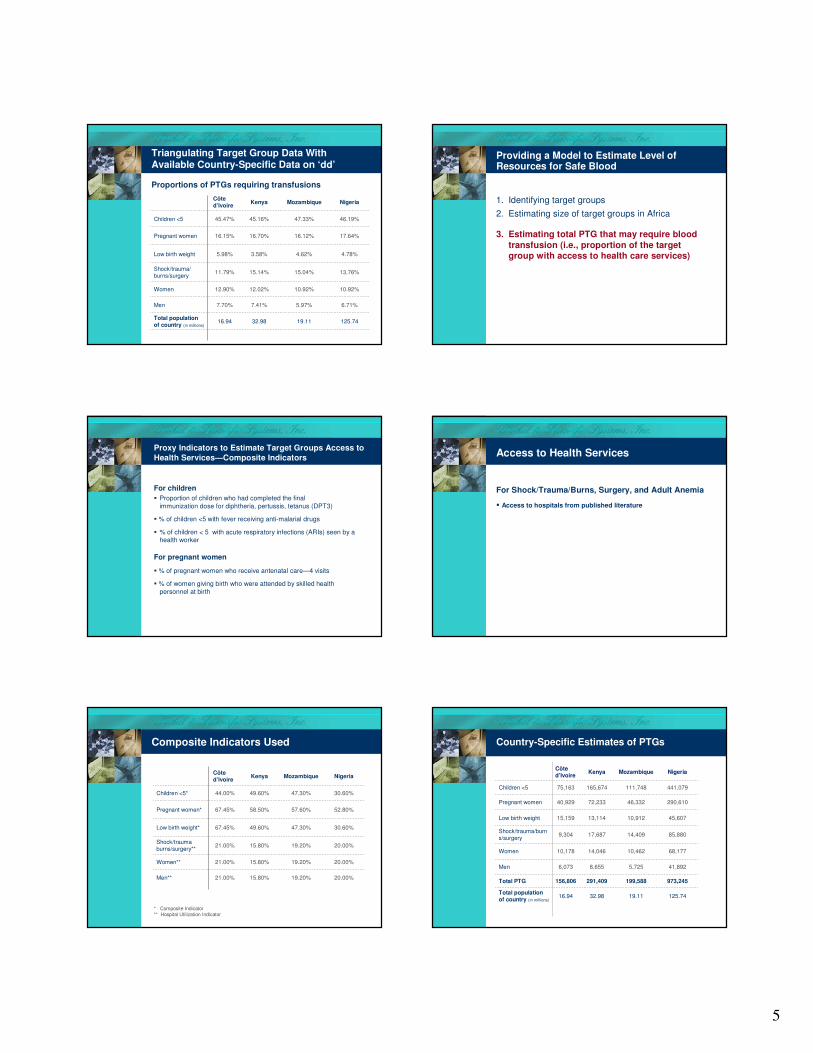
5
Triangulating Target Group Data With Available Country-Specific Data on ‘dd’
Proportions of PTGs requiring transfusions
125.7419.1132.9816.94Total population of country (in millions)
13.76%15.04%15.14%11.79%Shock/trauma/burns/surgery
4.78%4.62%3.58%5.98%Low birth weight
6.71%
10.92%
17.64%
46.19%
Nigeria
5.97%7.41%7.70%Men
10.92%12.02%12.90%Women
16.12%16.70%16.15%Pregnant women
47.33%45.16%45.47%Children <5
MozambiqueKenyaCôte d’Ivoire
Providing a Model to Estimate Level of Resources for Safe Blood
1. Identifying target groups
2. Estimating size of target groups in Africa
3. Estimating total PTG that may require blood
transfusion (i.e., proportion of the target group with access to health care services)
Proxy Indicators to Estimate Target Groups Access to
Health Services—Composite Indicators
For children
� Proportion of children who had completed the final
immunization dose for diphtheria, pertussis, tetanus (DPT3)
� % of children <5 with fever receiving anti-malarial drugs
� % of children < 5 with acute respiratory infections (ARIs) seen by a health worker
For pregnant women
� % of pregnant women who receive antenatal care—4 visits
� % of women giving birth who were attended by skilled health
personnel at birth
Access to Health Services
For Shock/Trauma/Burns, Surgery, and Adult Anemia
� Access to hospitals from published literature
Composite Indicators Used
20.00%19.20%15.80%21.00%Shock/trauma burns/surgery**
30.60%47.30%49.60%67.45%Low birth weight*
20.00%
20.00%
52.80%
30.60%
Nigeria
19.20%15.80%21.00%Men**
19.20%15.80%21.00%Women**
57.60%58.50%67.45%Pregnant women*
47.30%49.60%44.00%Children <5*
MozambiqueKenyaCôte d’Ivoire
* Composite Indicator** Hospital Utilization Indicator
Country-Specific Estimates of PTGs
973,245199,588291,409156,806Total PTG
41,8925,7258,6556,073Men
85,88014,40917,6879,304Shock/trauma/burns/surgery
45,60710,91213,11415,159Low birth weight
125.74
68,177
290,610
441,079
Nigeria
19.1132.9816.94Total population of country (in millions)
10,46214,04610,178Women
46,33272,23340,929Pregnant women
111,748165,67475,163Children <5
MozambiqueKenyaCôte d’Ivoire
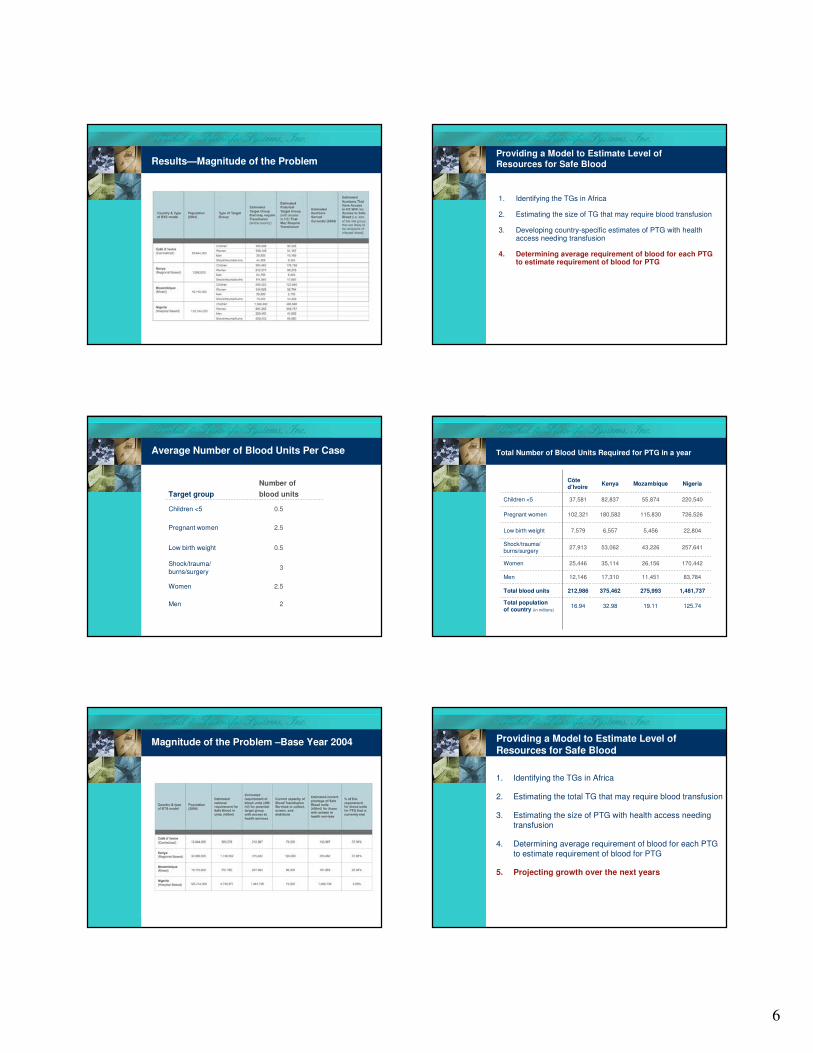
6
Results—Magnitude of the ProblemProviding a Model to Estimate Level of Resources for Safe Blood
1. Identifying the TGs in Africa
2. Estimating the size of TG that may require blood transfusion
3. Developing country-specific estimates of PTG with health access needing transfusion
4. Determining average requirement of blood for each PTG to estimate requirement of blood for PTG
Average Number of Blood Units Per Case
Number of
blood unitsTarget group
2Men
2.5Women
3Shock/trauma/
burns/surgery
0.5Low birth weight
2.5Pregnant women
0.5Children <5
Total Number of Blood Units Required for PTG in a year
125.7419.1132.9816.94Total population of country (in millions)
1,481,737275,993375,462212,986Total blood units
83,78411,45117,31012,146Men
257,64143,22653,06227,913Shock/trauma/burns/surgery
22,8045,4566,5577,579Low birth weight
170,442
726,526
220,540
Nigeria
26,15635,11425,446Women
115,830180,582102,321Pregnant women
55,87482,83737,581Children <5
MozambiqueKenyaCôte d’Ivoire
Magnitude of the Problem –Base Year 2004 Providing a Model to Estimate Level of Resources for Safe Blood
1. Identifying the TGs in Africa
2. Estimating the total TG that may require blood transfusion
3. Estimating the size of PTG with health access needing
transfusion
4. Determining average requirement of blood for each PTG
to estimate requirement of blood for PTG
5. Projecting growth over the next years
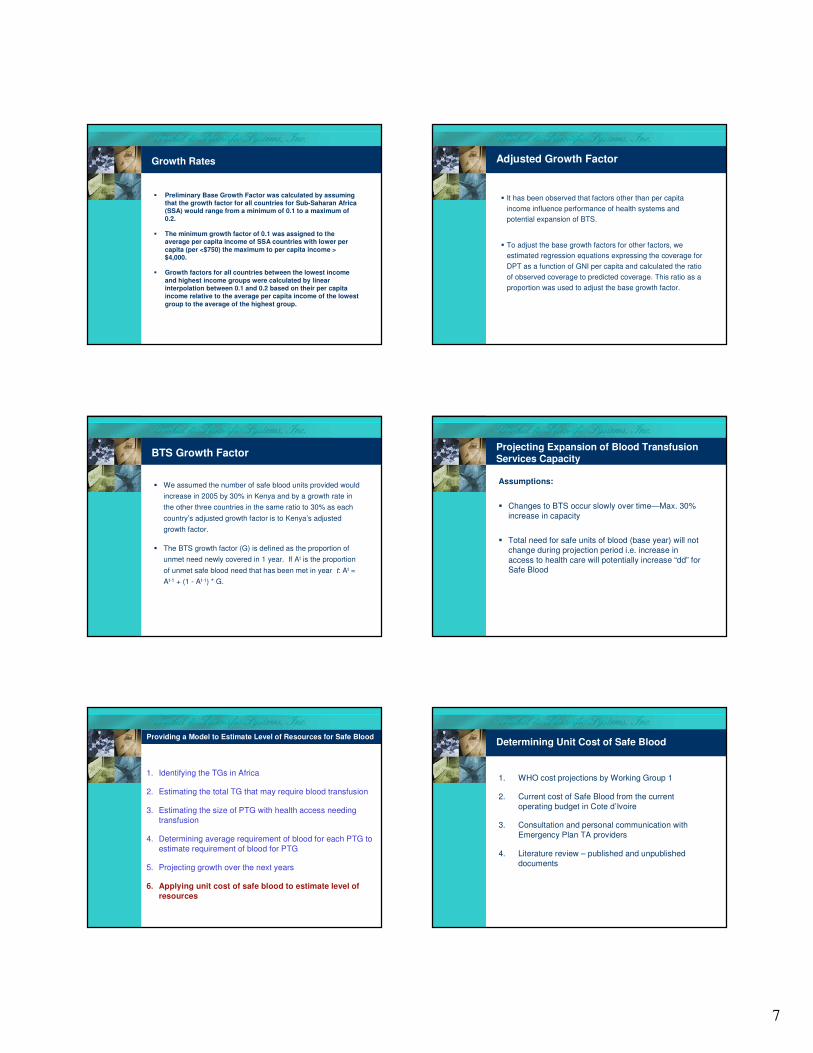
7
Growth Rates
� Preliminary Base Growth Factor was calculated by assuming that the growth factor for all countries for Sub-Saharan Africa (SSA) would range from a minimum of 0.1 to a maximum of 0.2.
� The minimum growth factor of 0.1 was assigned to the average per capita income of SSA countries with lower per
capita (per <$750) the maximum to per capita income > $4,000.
� Growth factors for all countries between the lowest income
and highest income groups were calculated by linear interpolation between 0.1 and 0.2 based on their per capita income relative to the average per capita income of the lowest
group to the average of the highest group.
Adjusted Growth Factor
� It has been observed that factors other than per capita
income influence performance of health systems and
potential expansion of BTS.
� To adjust the base growth factors for other factors, we
estimated regression equations expressing the coverage for
DPT as a function of GNI per capita and calculated the ratio
of observed coverage to predicted coverage. This ratio as a
proportion was used to adjust the base growth factor.
BTS Growth Factor
� We assumed the number of safe blood units provided would
increase in 2005 by 30% in Kenya and by a growth rate in
the other three countries in the same ratio to 30% as each
country’s adjusted growth factor is to Kenya’s adjusted
growth factor.
� The BTS growth factor (G) is defined as the proportion of
unmet need newly covered in 1 year. If At is the proportion
of unmet safe blood need that has been met in year t: At =
At-1 + (1 - At-1) * G.
Projecting Expansion of Blood Transfusion Services Capacity
Assumptions:
� Changes to BTS occur slowly over time—Max. 30%
increase in capacity
� Total need for safe units of blood (base year) will not
change during projection period i.e. increase in
access to health care will potentially increase “dd” for Safe Blood
Providing a Model to Estimate Level of Resources for Safe Blood
1. Identifying the TGs in Africa
2. Estimating the total TG that may require blood transfusion
3. Estimating the size of PTG with health access needing
transfusion
4. Determining average requirement of blood for each PTG to
estimate requirement of blood for PTG
5. Projecting growth over the next years
6. Applying unit cost of safe blood to estimate level of
resources
Determining Unit Cost of Safe Blood
1. WHO cost projections by Working Group 1
2. Current cost of Safe Blood from the current
operating budget in Cote d’Ivoire
3. Consultation and personal communication with
Emergency Plan TA providers
4. Literature review – published and unpublished
documents
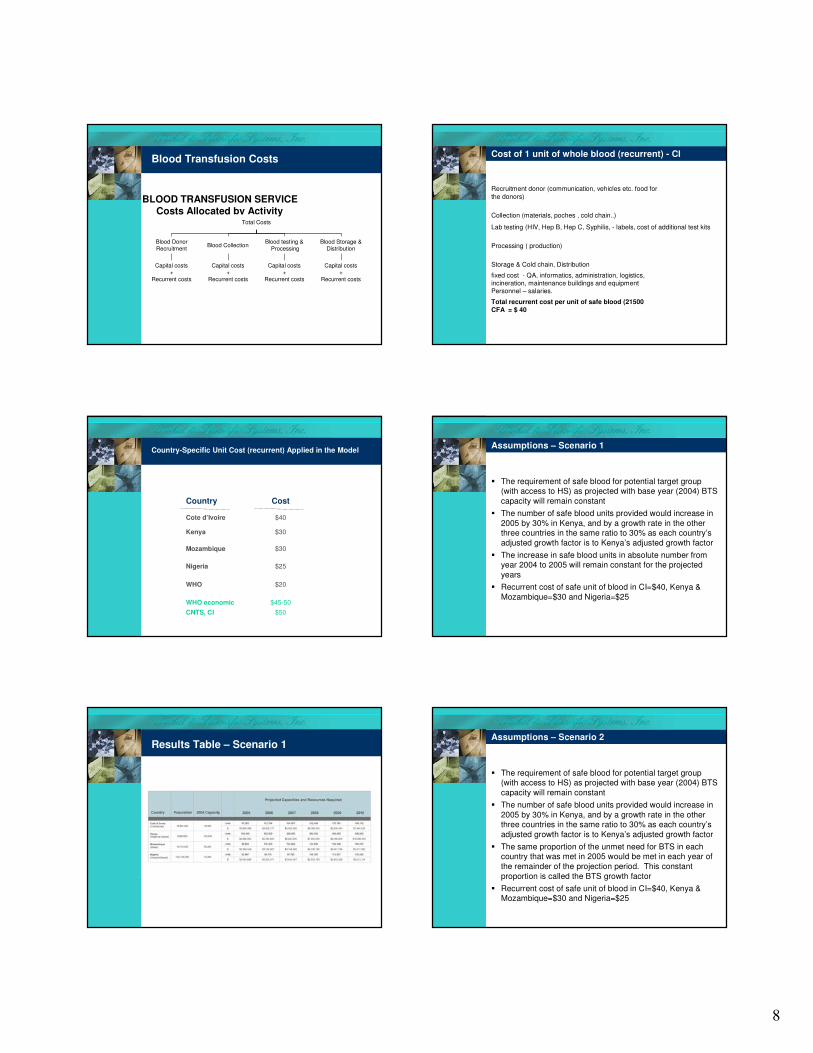
8
Blood Transfusion Costs
BLOOD TRANSFUSION SERVICECosts Allocated by Activity
Total Costs
Blood DonorRecruitment
Blood CollectionBlood testing &
ProcessingBlood Storage &
Distribution
Capital costs+
Recurrent costs
Capital costs+
Recurrent costs
Capital costs+
Recurrent costs
Capital costs+
Recurrent costs
Cost of 1 unit of whole blood (recurrent) - CI
Total recurrent cost per unit of safe blood (21500
CFA = $ 40
fixed cost - QA, informatics, administration, logistics, incineration, maintenance buildings and equipmentPersonnel – salaries.
Storage & Cold chain, Distribution
Processing ( production)
Lab testing (HIV, Hep B, Hep C, Syphilis, - labels, cost of additional test kits
Collection (materials, poches , cold chain..)
Recruitment donor (communication, vehicles etc. food for
the donors)
Country-Specific Unit Cost (recurrent) Applied in the Model
$20WHO
$25Nigeria
$45-50
$50
WHO economic
CNTS, CI
$30Mozambique
$30Kenya
$40Cote d’Ivoire
CostCountry
Assumptions – Scenario 1
� The requirement of safe blood for potential target group (with access to HS) as projected with base year (2004) BTS
capacity will remain constant
� The number of safe blood units provided would increase in
2005 by 30% in Kenya, and by a growth rate in the other three countries in the same ratio to 30% as each country’s
adjusted growth factor is to Kenya’s adjusted growth factor
� The increase in safe blood units in absolute number from year 2004 to 2005 will remain constant for the projected
years
� Recurrent cost of safe unit of blood in CI=$40, Kenya &
Mozambique=$30 and Nigeria=$25
Results Table – Scenario 1Assumptions – Scenario 2
� The requirement of safe blood for potential target group (with access to HS) as projected with base year (2004) BTS
capacity will remain constant
� The number of safe blood units provided would increase in
2005 by 30% in Kenya, and by a growth rate in the other three countries in the same ratio to 30% as each country’s
adjusted growth factor is to Kenya’s adjusted growth factor
� The same proportion of the unmet need for BTS in each country that was met in 2005 would be met in each year of
the remainder of the projection period. This constant
proportion is called the BTS growth factor
� Recurrent cost of safe unit of blood in CI=$40, Kenya & Mozambique=$30 and Nigeria=$25
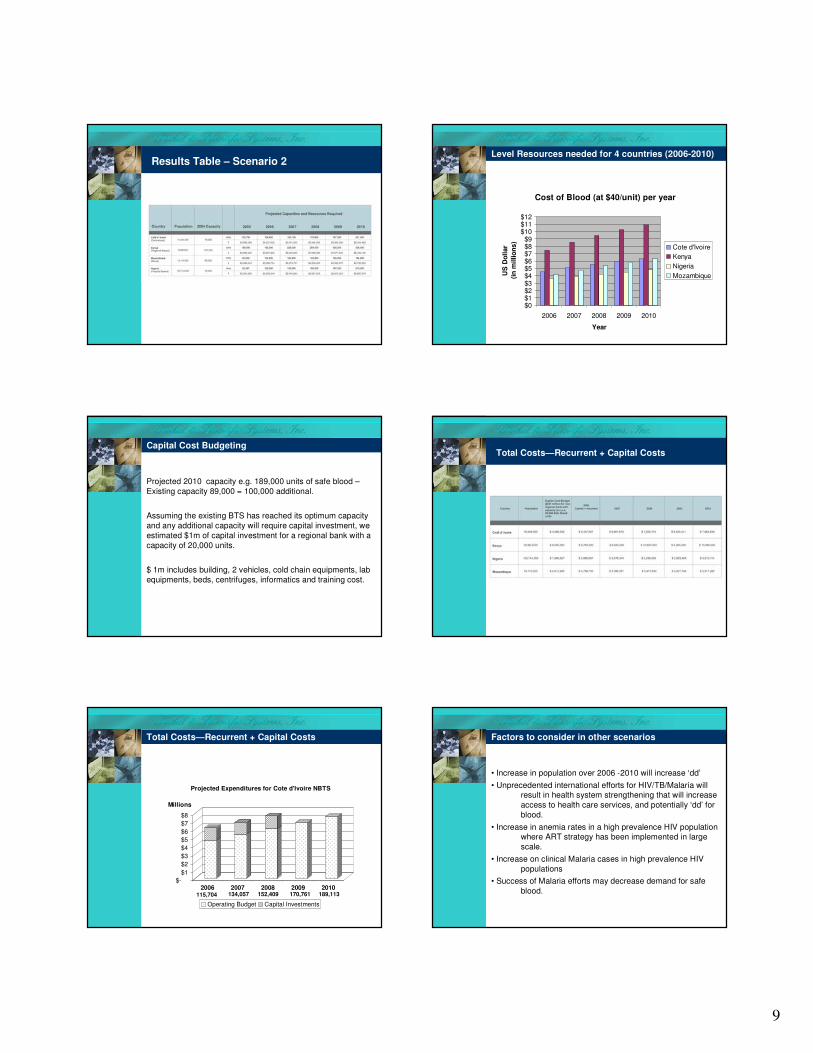
9
Results Table – Scenario 2Level Resources needed for 4 countries (2006-2010)
Cost of Blood (at $40/unit) per year
$0$1$2$3$4$5$6$7$8$9
$10$11$12
2006 2007 2008 2009 2010
Year
US
Do
llar
(in
millio
ns
)
Cote d'Ivoire
Kenya
Nigeria
Mozambique
Capital Cost Budgeting
Projected 2010 capacity e.g. 189,000 units of safe blood –
Existing capacity 89,000 = 100,000 additional.
Assuming the existing BTS has reached its optimum capacity
and any additional capacity will require capital investment, we
estimated $1m of capital investment for a regional bank with a
capacity of 20,000 units.
$ 1m includes building, 2 vehicles, cold chain equipments, lab
equipments, beds, centrifuges, informatics and training cost.
Total Costs—Recurrent + Capital Costs
Total Costs—Recurrent + Capital Costs
$-
$1
$2
$3
$4
$5
$6
$7
$8
Millions
2006 2007 2008 2009 2010
Projected Expenditures for Cote d'Ivoire NBTS
Operating Budget Capital Investments
115,704 134,057 152,409 189,113170,761
Factors to consider in other scenarios
• Increase in population over 2006 -2010 will increase ‘dd’
• Unprecedented international efforts for HIV/TB/Malaria will result in health system strengthening that will increase
access to health care services, and potentially ‘dd’ for
blood.
• Increase in anemia rates in a high prevalence HIV population where ART strategy has been implemented in large
scale.
• Increase on clinical Malaria cases in high prevalence HIV
populations
• Success of Malaria efforts may decrease demand for safe
blood.
10
Points for Discussion and Recommendations
� There is a desperate need for complete and accurate data for better
planning, budgeting, and forecasting resources required to ensure
Safe Blood in African countries.
� Strengthening Safe Blood supply in isolation without an
understanding of levels of development in health system in the
country should be avoided. Strengthening should be coherent to the
level of sophistication in the overall health system.
� Major international efforts such as Roll Back Malaria, Safe
Motherhood Initiative, and Family Planning can help avoid risks in
transfusion by decreasing demand for Safe Blood in Africa.
Points for discussion
• Increase in HIV among adult population will decrease the potential supply
of safe blood and increase the ‘dd’ for blood due to increase in clinical malaria among HIV positive (Mozambique) and anemia resulting from ART (Botswana)
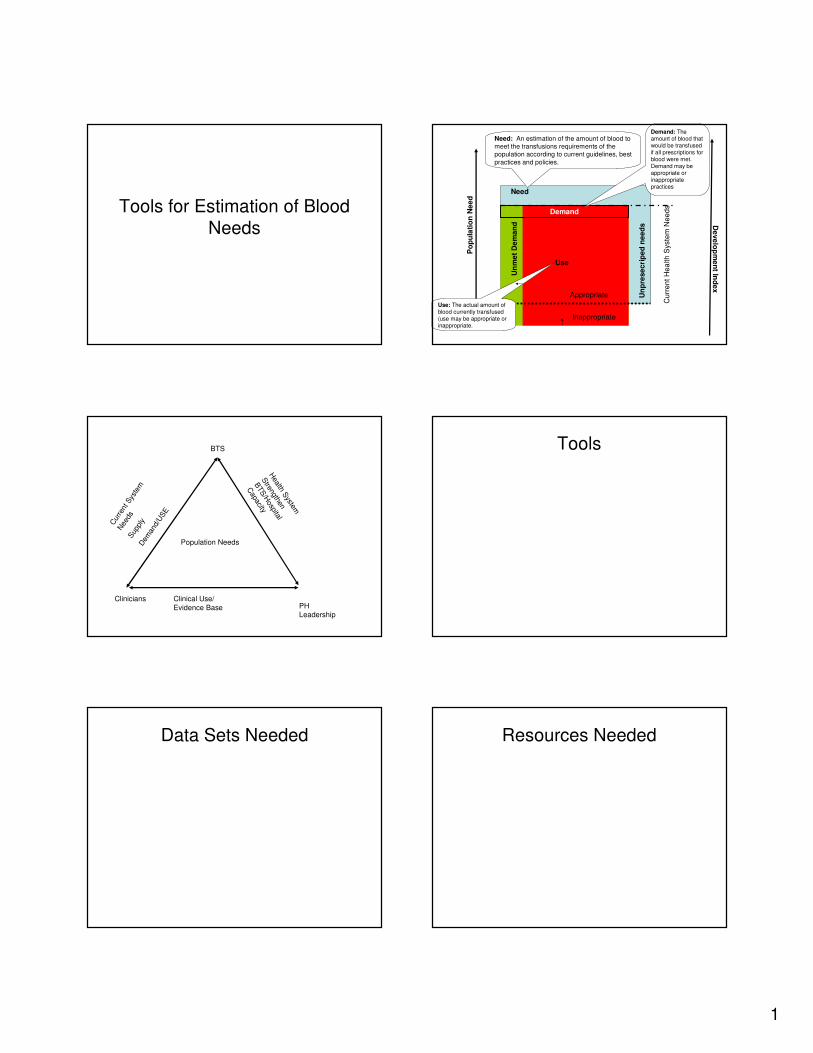
1
Tools for Estimation of Blood
Needs
Inappropriate
Appropriate
Un
me
t D
em
an
d
Demand
Need
Need: An estimation of the amount of blood to meet the transfusions requirements of the population according to current guidelines, best
practices and policies.
Demand: The amount of blood that would be transfused if all prescriptions for blood were met. Demand may be appropriate or inappropriate practices
Po
pu
lati
on
Ne
ed
Use
Use: The actual amount of blood currently transfused (use may be appropriate or inappropriate.
Cu
rre
nt
He
alth
Syste
m N
ee
ds
Un
pre
se
cri
pe
dn
ee
ds D
eve
lop
me
nt In
de
x
PH Leadership
BTS
Clinicians
Population NeedsH
ealth System
Strengthen
BTS
/Hospital
Capacity
Clinical Use/
Evidence Base
Cur
rent
Sys
tem
Nee
dsSup
ply
Dem
and/
USE
Tools
Data Sets Needed Resources Needed
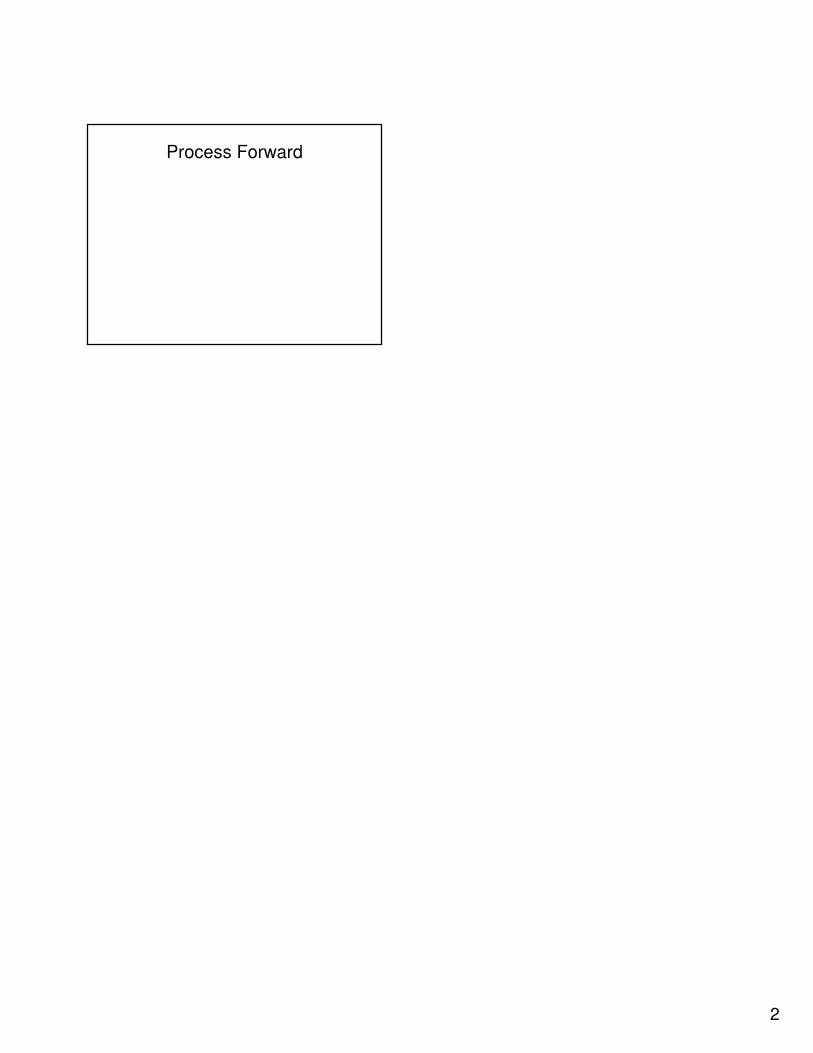
2
Process Forward
1
Objective:
To provide resources that will assist
authorities to estimate the current and future blood transfusion needs for patients
treated in their health systems.
Need
The amount of blood that would be used if all those patients who could benefit* from transfusion were recognised and if blood was prescribed according to appropriate guidelines.
*All those patients who could benefit” implies 100% access to health services but where access to the health system is restricted to a part of the population, need is in effect limited to those who have
access.
Demand
• This term may reflect numerous additional
factors such as the reliability of the blood supply and delivery system, relationships
between clinic and blood bank etc,etc
Need, use and demand
Quantity to met need Optimum prescribing and use
[Conditioned by access to care]
Use Observed quantity actually transfused OR
Surrogate for transfused – eg delivered
DemandObserved quantity that is requested from blood
providers
Target population composed of Groups of patients at risk of transfusion GPART
[Groups of patients needing blood,GPNB]
Patients at risk of transfusion
Defined as:
Patients with conditions that may require blood transfusion, but for whom transfusion may be avoided by preventive or alternative interventions
Identifying target population 1Case definitions could be built around…
Age /gender Over 80
Under 5 in high incidence malaria zone
Combinations of diagnosis and intervention HIV on HARTT
Diagnosis ICD 10
Intervention
OPCS
Specialty – basedSurgery, paediatrics
DRG Geography or Institution
2
Identification
of target populations 2
• From existing sources in country or countries with similar demography etc
• Primary data collection
• Professional concensus
• Published or grey literature
• Burden of disease databases
• New systematic reviews may be needed
Size of the target populationsIncidence, Prevalence
• Sources of epidemiological data
• Burden of disease data
• Review the RAO model in detail
Data on blood use for target
populations
• From existing sources in country or countries with similar demography etc
• Primary data collection
• Professional concensus
• Published literature
Data sets and definitions for describing
hospital blood use
Is supply sufficient?
– Georgetown model,
Which conditions receive how much blood?
– Zambia model
How many patients per time period?
Examples of practical guidance,
training materials
• Sources of existing data – where to look
• Practical issues in accessing data
• Recording
• Analysing
• Uncertainty…importance of factoring in
• Estimates how to develop and use
• Worked examples
Worked example
Maternity
• Haemorrhage
• Other deliver complications
• Puerperal sepsis
• Maternal anaemia
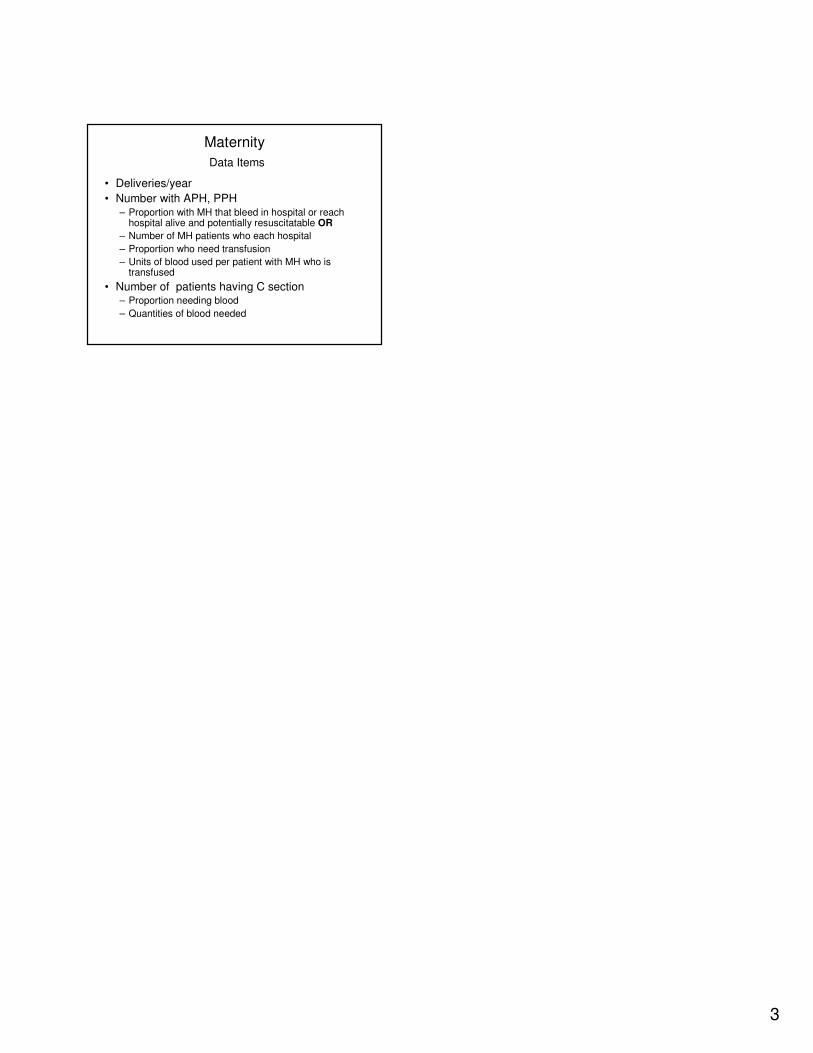
3
Maternity
Data Items
• Deliveries/year
• Number with APH, PPH– Proportion with MH that bleed in hospital or reach
hospital alive and potentially resuscitatable OR
– Number of MH patients who each hospital
– Proportion who need transfusion
– Units of blood used per patient with MH who is transfused
• Number of patients having C section– Proportion needing blood
– Quantities of blood needed