Embed Size (px)
Citation preview

PATS 2017 Pollutant Modeling Summary
Portland Air Toxics Solutions Advisory Committee
January 25, 2011
1/25/11 Draft PAGE 3
Modeled Distribution of 1,3 Butadiene
Concentrations
0%
10%
20%
30%
40%
50%
60%
70%
80%
90%
100%
0.1 1 10
Pe
rce
nti
le
Concentration/ABC
1,3-Butadiene 2017: Times Over Benchmark
1,3-Butadiene no BG/ABC
1,3-Butadiene with BG/ABC
ABC/ABC
1,3 Butadiene Overview
Benchmark Value: 0.03 ug/m3
Primary health effects: Probable human carcinogen, possible association with heart diseases
Total emissions in PATS study area:
74.07 tons/year
Average reduction needed for all receptors above ABC:
85%, All receptors above benchmark
Pertinent information: 1,3-butadiene is a colorless gas with a mild gasoline-like odor. 1,3-butadiene comes from incomplete combustion of fuels from cars and trucks, and off-road engines like lawn mowers and boats. Additional sources include petroleum refining, production of rubber and plastics, forest fires and cigarette smoke.
Most Significant Sources of 1,3 Butadiene
Source TPY % of Poll Quality Rating
Area
1. Res. Wood Comb 23.8 32 C
2. Open Burning/Fires 3.6 5 C
Non-road
1. Non-road 4-Stroke 13.3 18 D
2. Non-road 2-Stroke 3.2 4 D
3. Aircraft 2.7 4 B
4. Non-road Diesel 0.9 1 D
On-road
1. On-road Mobile 23.5 32 B/C
2. On-road Diesel 2.1 3 B/C
Point - <1% of Pollutant
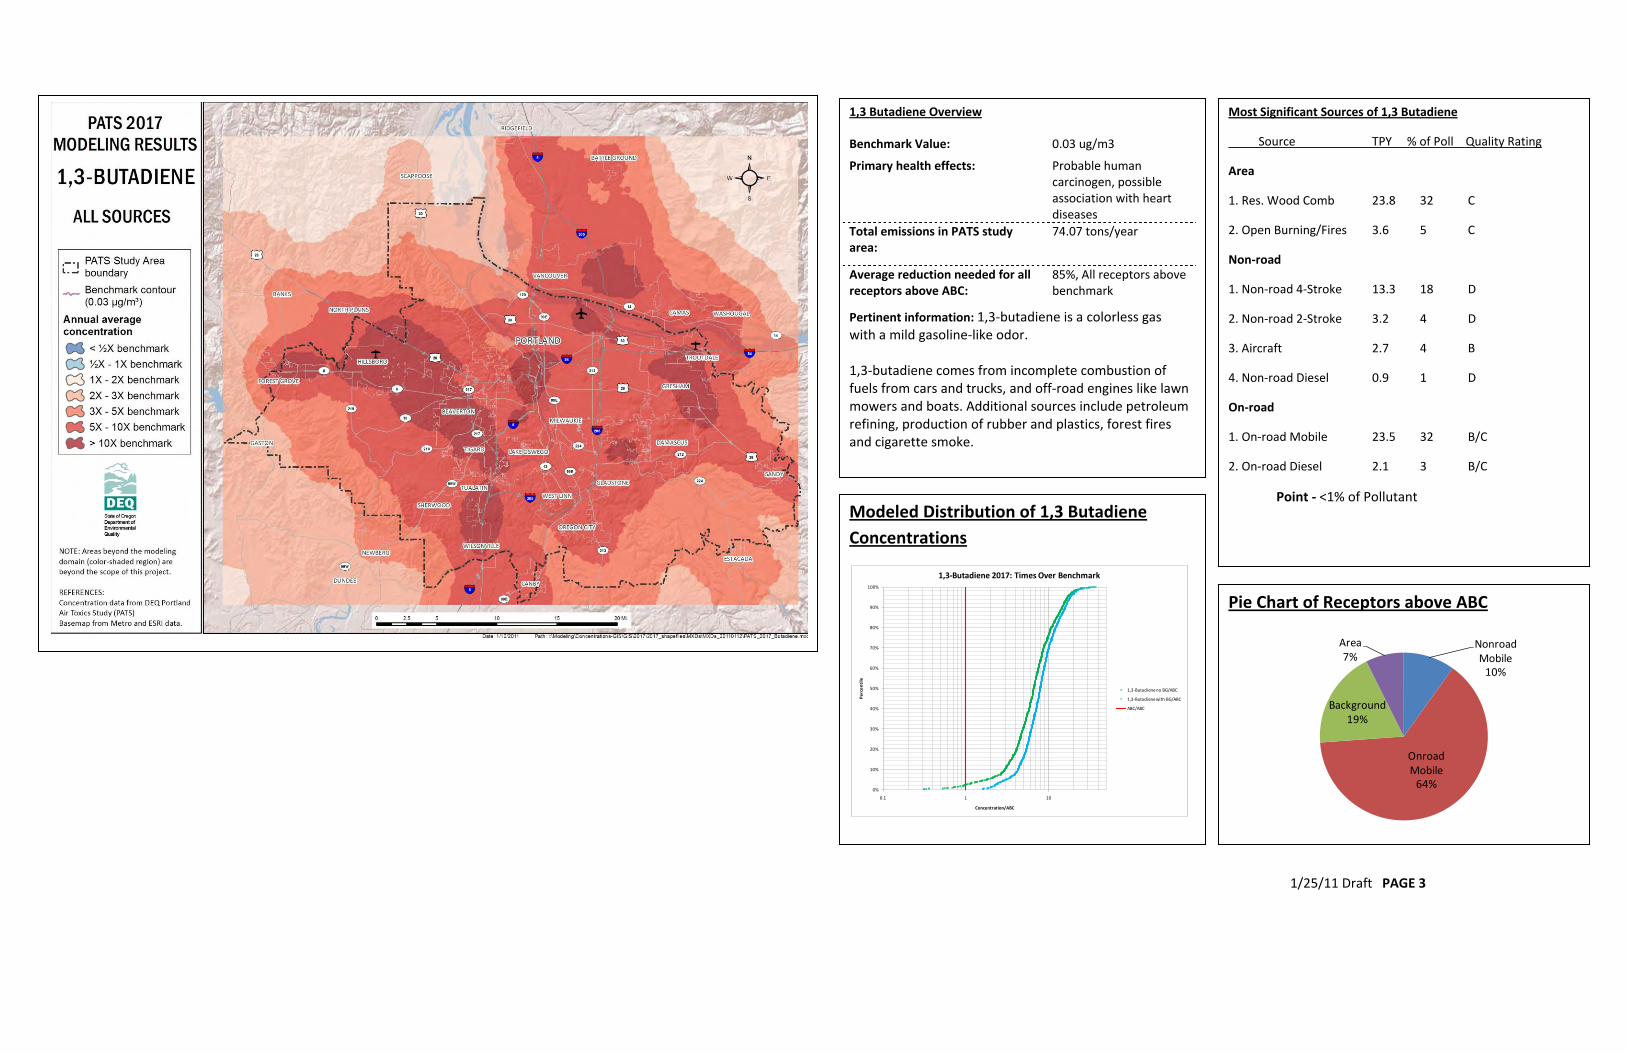
Pie Chart of Receptors above ABC
Nonroad Mobile
10%
Onroad Mobile
64%
Background19%
Area7%

1/25/11 Draft PAGE 4
Modeled Distribution of Benzene
Concentrations
0%
10%
20%
30%
40%
50%
60%
70%
80%
90%
100%
0.1 1 10 100
Pe
rce
nti
le
Concentration/ABC
Benzene 2017: Times Over Benchmark
Benz no BG/ABC
Benz with BG/ABC
ABC/ABC
Pie Chart of Receptors above ABC
Nonroad Mobile
15%
Onroad Mobile
14%
Background51%
Area18%
Point2%
Benzene Overview
Benchmark Value: 0.13 ug/m3
Primary health effects: Known (Class A) human carcinogen, blood disorders, may cause anemia and genetic damage
Total emissions in PATS study area:
559.9 tons/year
Average reduction needed for all receptors above ABC:
88%, all receptors above benchmark
Pertinent information: Benzene is a colorless liquid with a sweet odor. It evaporates into the air very quickly and dissolves slightly in water. It is highly flammable and is formed from both natural processes and human activities. Benzene is found in emissions from cars and trucks, wood smoke, evaporation from service stations, and industrial solvents. Tobacco smoke contains benzene.
Most Significant Sources of Benzene
Source TPY % of Poll Quality Rating
Area
1. Res Wood Comb 126.6 23 C
2. Miscellaneous 39.8 7 D
3. Open Burn/Fires 21.7 4 C
4. Consumer Products 11.1 2 D
Non-road
1. Non-road 4-Stroke 77.8 14 D
2. Non-road Diesel 10.0 2 D
On-road
1. On-road Mobile 189.1 34 B/C
2. On-road Diesel 16.9 3 B/C
Point - <1% of Pollutant

1/25/11 Draft PAGE 5
Modeled Distribution of Ethylbenzene
Concentrations
0%
10%
20%
30%
40%
50%
60%
70%
80%
90%
100%
0.1 1 10 100
Pe
rce
nti
le
Concentration/ABC
Ethyl Benzene 2017: Times Over Benchmark
Ethyl benzene no BG/ABC
ABC/ABC
Pie Chart of Receptors above ABC
Nonroad Mobile
28%
Onroad Mobile
32%
Area35%
Point5%
Ethylbenzene Overview
Benchmark Value: 0.40 ug/m3
Primary health effects: Possible human carcinogen, effects on blood, liver, and kidneys
Total emissions in PATS study area:
294.2 tons/year
Average reduction needed for all receptors above ABC:
42%, 738 receptors above benchmark
Pertinent information: Ethylbenzene is a colorless, flammable liquid that smells like gasoline. It is naturally found in coal tar and petroleum and is also found in manufactured products such as inks, pesticides, and paints. The main sources of ethylbenzene in the Portland area are gasoline engines, gasoline evaporation and painting operations. Ethylbenzene is also used in the production of styrene (used to make polystyrene plastic).
Most Significant Sources of Ethylbenzene
Source TPY % of Poll Quality Rating
Point
1. Surface Coating 12.4 4 A
Area
1. Solvent/Coating Use 83.0 28 C
2. Consumer Products 16.8 6 D
Non-road
1. Non-road 2-Stroke 41.6 14 D
2. Non-road 4-Stroke 29.5 10 D
On-road
1. On-road Mobile 78.6 27 B/C
2. On-road Diesel 7.0 2 B/C

1/25/11 Draft PAGE 6
Modeled Distribution of Diesel PM
Concentrations
0%
10%
20%
30%
40%
50%
60%
70%
80%
90%
100%
0.1 1 10
Pe
rce
nti
le
Concentration/ABC
Diesel PM 2017: Times Over Benchmark
Diesel PM no BG/ABC
ABC/ABC
Pie Chart of Receptors above ABC
Nonroad Mobile
74%
Onroad Mobile
16%
Area10%
Diesel PM Overview
Benchmark Value: 0.1 ug/m3
Primary health effects: Associated with increased lung cancer, breathing and heart problems
Total emissions in PATS study area:
528.7 tons/year
Average reduction needed for all receptors above ABC:
86%, 2049 receptors above benchmark
Pertinent information: Diesel particulate matter is not a specific chemical. It is a complex mixture of particles and various chemical compounds in, on, or around the particles. Diesel particulate matter comes mainly from on and off road diesel engines, including cars and trucks, construction equipment, ships, and rail sources.
Most Significant Sources of Diesel PM
Source TPY % of Poll Quality Rating
Area
1. Industrial Fuel Use 24.7 5 D
2. Commercial Fuel Use 14.1 3 D
3. Residential Heating 8.8 2 D
Non-road
1. Non-road Diesel 344.8 65 D
2. Rail 38.8 7 B/C
3. Boats – Commercial 7.5 1 B
On-road
1. On-road Diesel 81.7 15 B/C
Point - <1% of Pollutant

1/25/11 Draft PAGE 7
Modeled Distribution of 15-PAH
Concentrations
0%
10%
20%
30%
40%
50%
60%
70%
80%
90%
100%
0.1 1 10 100
Pe
rce
nti
le
Concentration/ABC
15 PAH 2017: Times Over Benchmark
15 PAH no BG/ABC
ABC/ABC
Pie Chart of Receptors above ABC
Nonroad Mobile
11% Onroad Mobile
10%
RWC (Area)79%
15-PAH Overview
Benchmark Value: 0.0009 ug/m3
Primary health effects: One known carcinogen, seven probable (Class B2) human carcinogens
Total emissions in PATS study area:
16.68 tons/year
Average reduction needed for all receptors above ABC:
94%, 2372 receptors above benchmark
Pertinent information: Polycyclic aromatic hydrocarbons, also called PAHs, are a group of chemicals that are formed during the incomplete burning of carbon-containing substances: wood, coal, oil and gas, garbage, or other organic substances like tobacco or charbroiled meat. PAHs, which are 4,000 or more individual chemical compounds, are usually found as a mixture containing two or more of these compounds.
Most Significant Sources of 15-PAH
Source TPY % of Poll Quality Rating
Area
1. Res Wood Comb 12.4 74 C
2. Miscellaneous 0.8 5 D
3. Open Burn/Fires 0.8 5 C
Non-road
1. Non-road 4-Stroke 0.6 3 D
2. Non-road 2-Stroke 0.3 2 D
3. Non-road Diesel 0.2 1 D
4. Aircraft 0.15 1 B
On-road
1. On-road Mobile 1.0 6 B/C
Point - <1% of Pollutant

1/25/11 Draft PAGE 8
Modeled Distribution of Naphthalene
Concentrations
0%
10%
20%
30%
40%
50%
60%
70%
80%
90%
100%
0.1 1 10
Pe
rce
nti
le
Concentration/ABC
Naphthalene 2017: Times Over Benchmark
Naphthalene no BG/ABC
Naphthalene with BG/ABC
ABC/ABC
Pie Chart of Receptors above ABC
Nonroad Mobile
5%Onroad Mobile
10%
Background8%
Area (Solvent,
Other, RWC)68%
Point9%
Naphthalene Overview
Benchmark Value: 0.03 ug/m3
Primary health effects: Possible (Group C) carcinogen
Total emissions in PATS study area:
111.3 tons/year
Average reduction needed for all receptors above ABC:
77%, 2032 receptors above benchmark
Pertinent information: Naphthalene is a white solid that evaporates easily. Fuels such as petroleum and coal contain naphthalene. Burning tobacco or wood produces naphthalene. It has a strong, but not unpleasant smell. The major commercial use of naphthalene is in the manufacture of polyvinyl chloride (PVC) plastics. Its major consumer use is in moth repellents and toilet deodorant blocks. Naphthalene is released to the air from the burning of coal and oil and from the use of mothballs.
Most Significant Sources of Naphthalene
Source TPY % of Poll Quality Rating
Point
1. Surface Coating 1.2 1 A
Area
1. Consumer Products 43.2 39 D
2. Res Wood Comb 24.9 22 C
3. Asphalt 22.5 20 D
Non-road
1. Non-road 4-Stroke 4.1 4 D
2. Aircraft 1.5 1 B
On-road
1. On-road Mobile 8.4 8 B/C

1/25/11 Draft PAGE 9
Modeled Distribution of Arsenic
Concentrations
0%
10%
20%
30%
40%
50%
60%
70%
80%
90%
100%
0.1 1 10
Pe
rce
nti
le
Concentration/ABC
Arsenic 2017: Times Over Benchmark
Arsenic no BG/ABC
Arsenic with BG/ABC
ABC/ABC
Pie Chart of Receptors above ABC
Nonroad Mobile
6%
Onroad Mobile
28%
Background56%
Area8%
Point2%
Arsenic Overview
Benchmark Value: 0.0002 ug/m3
Primary health effects: Known (Class A) human carcinogen
Total emissions in PATS study area:
0.22 tons/year
Average reduction needed for all receptors above ABC:
66%, all receptors above benchmark
Pertinent information: Sources of arsenic are both human caused and natural. Our soils in the Pacific Northwest are naturally high in arsenic because of their volcanic origins. In Oregon, metal processing, agricultural pesticides, and soil dust are sources of arsenic. Oil and natural gas combustion and on-road and non-road engines are important sources of arsenic.
Most Significant Sources of Arsenic
Source TPY % of Poll Quality Rating
Point
1. Metals 0.01 5 A
2. Industrial Fuel Use 0.007 4 A
Area
1. Residential Heating 0.015 7 D
2. Industrial Fuel Use 0.015 7 D
Non-road
1. Aircraft 0.006 3 B
On-road
1. On-road Mobile 0.12 53 B/C
2. On-road Diesel 0.01 5 B/C

1/25/11 Draft PAGE 10
Modeled Distribution of Cadmium
Concentrations
0%
10%
20%
30%
40%
50%
60%
70%
80%
90%
100%
0.01 0.1 1 10
Pe
rce
nti
le
Concentration/ABC
Cadmium 2017: Times Over Benchmark
Cadmium no BG/ABC
Cadmium with BG/ABC
ABC/ABC
Pie Chart of Receptors above ABC
Background2%
Area (other)28%
Point70%
Cadmium Overview
Benchmark Value: 0.0006 ug/m3
Primary health effects: Probable (Class B2) human carcinogen
Total emissions in PATS study area:
0.187 tons/year
Average reduction needed for all receptors above ABC:
70%, 62 receptors above benchmark
Pertinent information: Cadmium is a relatively abundant soft, bluish-white metal. It is usually found as a mineral combined with other elements. Burning natural gas for both residential and industrial use and prescribed forest burning are major sources of cadmium in Portland’s air. Cadmium is also used to make batteries, pigments, metal coatings, and plastic.
Most Significant Sources of Cadmium
Source TPY % of Poll Quality Rating
Point
1. Metals 0.030 16 A
2. Industrial Fuel Use 0.013 7 A
3. Glass Manufacturing 0.010 6 A
Area
1. Residential Heating 0.057 30 D
2. Open Burn/Fires 0.037 19 -
3. Industrial Fuel Use 0.022 12 D
4. Commercial Fuel Use 0.013 7 D
Non-road
1. Rail 0.002 1 B/C
On-road - <1% of Pollutant

1/25/11 Draft PAGE 11
Modeled Distribution of Chromium VI
Concentrations
0%
10%
20%
30%
40%
50%
60%
70%
80%
90%
100%
0.1 1 10
Pe
rce
nti
le
Concentration/ABC
Chromium VI 2017: Times Over Benchmark
Chromium VI no BG/ABC
ABC/ABC
Pie Chart of Receptors above ABC
Nonroad Mobile (Lawn and Garden,
other)2%
Onroad Mobile
59%
Background32%
Point7%
Chromium VI Overview
Benchmark Value: 0.00008 ug/m3
Primary health effects: Known (Class A) human carcinogen, damage to the respiratory tract
Total emissions in PATS study area:
0.047 tons/year
Average reduction needed for all receptors above ABC:
37%, 1155 receptors above benchmark
Pertinent information: Chromium is a naturally occurring metal found in rocks, animals, plants, soil, and volcanic dust and gases. Because of its ability to react with other elements, it can produce hard coatings, which is why it is used in paints for cars, boats and airplanes. Chromium comes in several forms. Hexavalent Chromium - also called chromium VI - is a form of chromium that can occur naturally but is most commonly produced by industrial processes.
Most Significant Sources of Chromium VI
Source TPY % of Poll Quality Rating
Point
1. Metals 0.0074 16 A
2. Industrial Fuel Use 0.0043 9 A
Non-road
1. Non-road 4-Stroke 0.0013 3 D
On-road
1. On-road Mobile 0.031 65 B/C
2. On-road Diesel 0.0027 6 B/C
Area - <1% of Pollutant

1/25/11 Draft PAGE 12
Modeled Distribution of Manganese
Concentrations
0%
10%
20%
30%
40%
50%
60%
70%
80%
90%
100%
0.001 0.01 0.1 1 10
Pe
rce
nti
le
Concentration/ABC
Manganese 2017: Times Over Benchmark
Manganese no BG/ABC
Manganese with BG/ABC
ABC/ABC
Pie Chart of Receptors above ABC
Point100%
Manganese Overview
Benchmark Value: 0.09 ug/m3
Primary health effects: May result in central nervous system problems
Total emissions in PATS study area:
4.36 tons/year
Average reduction needed for all receptors above ABC:
84%, 8 receptors above benchmark
Pertinent information: Manganese is a metal used primarily in steel production to improve hardness, stiffness, and strength. Manganese dioxide is used in the production of dry-cell batteries, matches, fireworks, and the production of other manganese compounds. The main source of manganese pollution in Portland comes from the smelting of steel and iron. Manganese is also emitted from power plants, coke ovens and dust from mining operations. It is also a component of some pesticides and is used as a fuel additive in some gasoline.
Most Significant Sources of Manganese
Source TPY % of Poll Quality Rating
Point
1. Surface Coating 2.04 47 A
2. Metals 1.68 38 A
3. Industrial Fuel Use 0.45 10 A
4. Asphalt Manufacturing 0.04 1 A
Area
1. Industrial Fuel Use 0.07 2 D
2. Residential Heating 0.03 1 D
On-road
1. On-road Mobile 0.03 1 B/C
Non-road - <1% of Pollutant

1/25/11 Draft PAGE 13
Modeled Distribution of Nickel
Concentrations
0%
10%
20%
30%
40%
50%
60%
70%
80%
90%
100%
0.001 0.01 0.1 1 10
Pe
rce
nti
le
Concentration/ABC
Nickel 2017: Times Over Benchmark
Nickel no BG/ABC
Nickel with BG/ABC
ABC/ABC
Pie Chart of Receptors above ABC
Point100%
Nickel Overview
Benchmark Value: 0.05 ug/m3
Primary health effects: Two forms are known (Class A) human carcinogens, toxic to the respiratory system
Total emissions in PATS study area:
2.64 tons/year
Average reduction needed for all receptors above ABC:
90%, 3 receptors above benchmark
Pertinent information: Nickel is an abundant natural element found in soil and emitted from volcanoes. Nickel is most often used to make stainless steel and nickel compounds are used for nickel plating, to make some batteries, and as catalysts. Nickel is released into the air by industries that make or use nickel or nickel compounds. It is also released by oil- and coal-burning power plants and trash incinerators.
Most Significant Sources of Nickel
Source TPY % of Poll Quality Rating
Point
1. Metals 2.0 76 A
2. Industrial Fuel Use 0.08 3 A
3. Surface Coating 0.08 3 A
Area
1. Industrial Fuel Use 0.21 8 D
2. Residential Heating 0.11 4 D
3. Commercial Fuel Use 0.08 3 D
On-road
1. On-road Mobile 0.06 2 B/C
Non-road - <1% of Pollutant

1/25/11 Draft PAGE 14
Modeled Distribution of Dichlorobenzene
Concentrations
0%
10%
20%
30%
40%
50%
60%
70%
80%
90%
100%
0.1 1 10 100
Pe
rce
nti
le
Concentration/ABC
Dichlorobenzene 2017: Times Over Benchmark
Dichlorobenzene no BG/ABC
Dichlorobenzene with BG/ABC
ABC/ABC
Pie Chart of Receptors above ABC
Background28%
Area72%
Dichlorobenzene Overview
Benchmark Value: 0.09 ug/m3
Primary health effects: Possible (Group C) human carcinogen, can result in liver, skin, and central nervous system problems
Total emissions in PATS study area:
80.8 tons/year
Average reduction needed for all receptors above ABC:
45%, 1216 receptors above benchmark
Pertinent information: 1,4-Dichlorobenzene, also called para-dichlorobenzene, is a colorless solid with a strong, distinctive smell. 1,4-Dichlorobenzene is used as a fumigant to control moths, molds and mildew. It is also used as a disinfectant in waste containers and restrooms and is the characteristic smell associated with urinal cakes.
Most Significant Sources of Dichlorobenzene
Source TPY % of Poll Quality Rating
Area
1. Consumer Products 80.7 100 -
Point - <1% of Pollutant
On-road - <1% of Pollutant
Non-road - <1% of Pollutant

1/25/11 Draft PAGE 15
Modeled Distribution of Acetaldehyde
Concentrations
0%
10%
20%
30%
40%
50%
60%
70%
80%
90%
100%
0.01 0.1 1 10
Pe
rce
nti
le
Concentration/ABC
Acetaldehyde 2017: Times Over Benchmark
Acetaldehyde no secondary/ABC
Acetaldehyde with secondary/ABC
ABC/ABC
Pie Chart of Receptors above ABC
Nonroad Mobile
3%Onroad Mobile
3%
Secondary91%
Area3%
Acetaldehyde Overview
Benchmark Value: 0.45 ug/m3
Primary health effects: Probable (Class B2) human carcinogen
Total emissions in PATS study area:
220.9 tons/year
Average reduction needed for all receptors above ABC:
81%, all receptors above benchmark
Pertinent information: Acetaldehyde is a colorless, flammable liquid that evaporates easily into the air. It is a product of incomplete combustion of fuels and wood, and is also used in the manufacture of other chemicals and products including perfumes and dyes. The dominant source of acetaldehyde in the Portland area is smoke from residential wood stoves and fireplaces, but much is also produced by engines.
Most Significant Sources of Acetaldehyde
Source TPY % of Poll Quality Rating
Point
1. Wood Products 15.9 7 A
2. Metals 3.4 2 A
Area
1. Res Wood Comb 74.7 34 C
2. Open Burn/Fires 7.9 4 C
Non-road
2. Non-road Diesel 26.2 12 D
1. Non-road 4-Stroke 11.5 5 D
On-road
1. On-road Mobile 54.2 25 B/C
2. On-road Diesel 4.9 2 B/C

1/25/11 Draft PAGE 16
Modeled Distribution of Formaldehyde
Concentrations
0%
10%
20%
30%
40%
50%
60%
70%
80%
90%
100%
0.01 0.1 1 10
Pe
rce
nti
le
Concentration/ABC
Formaldehyde 2017: Times Over Benchmark
Formaldehyde no secondary/ABC
Formaldehyde with secondary/ABC
ABC/ABC
Pie Chart of Receptors above ABC
Nonroad Mobile
13%
Onroad Mobile
8%
Secondary 69%
Area9%
Point1%
Formaldehyde Overview
Benchmark Value: 0.009 ug/m3 (EPA) 3.0 ug/m3 (DEQ)
Primary health effects: Probable (Class B1) human carcinogen
Total emissions in PATS study area:
426.1 tons/year
Average reduction needed for all receptors above ABC:
10%, 325 receptors above benchmark
Pertinent information: Formaldehyde comes from incomplete fuel combustion from industry, on and off-road engines, construction equipment, diesel fuel combustion, railroads, and airports, as well as from wood burning. It is used as a concrete and plaster additive, as a disinfectant, and as a wood preservative. The highest levels of airborne formaldehyde have been detected in indoor air, where it is released from various consumer products including paneling and carpets.
Most Significant Sources of Formaldehyde
Source TPY % of Poll Quality Rating
Point
1. Industrial Fuel Use 10.6 3 A
Area
1. Res Wood Comb 159.8 37 C
2. Open Burn/Fires 32.8 8 C
3. Miscellaneous 10.8 3 D
Non-road
1. Non-road Diesel 58.2 14 D
2. Non-road 4-Stroke 22.3 5 D
On-road
1. On-road Mobile 74.2 17 B/C
NOTE: Graph represents all sources of Formaldehyde with respect to
the DEQ benchmark concentration.

1/25/11 Draft PAGE 17
Modeled Distribution of Acrolein
Concentrations
0%
10%
20%
30%
40%
50%
60%
70%
80%
90%
100%
0.1 1 10
Pe
rce
nti
le
Concentration/ABC
Acrolein 2017: Times Over Benchmark
Acrolein no secondary/ABC
Acrolein with secondary/ABC
ABC/ABC
Pie Chart of Receptors above ABC
Nonroad Mobile
3%
Onroad Mobile
3%
Secondary53%
Area40%
Point1%
Acrolein Overview
Benchmark Value: 0.02 ug/m3
Primary health effects: General respiratory congestion and eye, nose, and throat irritation
Total emissions in PATS study area:
78.9 tons/year
Average reduction needed for all receptors above ABC:
88%, all receptors above benchmark
Pertinent information: Acrolein is a colorless or yellow liquid that evaporates quickly and burns easily. Acrolein has a strong, unpleasant odor. It reacts quickly when exposed to other substances. Acrolein enters the air mainly from wood burning, structural (house and building) fires and construction. Tobacco smoke is another source of acrolein.
Most Significant Sources of Acrolein
Source TPY % of Poll Quality Rating
Point
1. Industrial Fuel Use 2.5 3 A
Area
1. Open Burn/Fires 59.9 76 C
2. Res Wood Comb 8.2 10 C
Non-road
1. Non-road Diesel 1.5 2 D
2. Non-road 4-Stroke 1.0 1 D
3. Non-road 2-Stroke 0.6 1 D
On-road
1. On-road Mobile 3.8 5 B/C