Embed Size (px)
Citation preview
Patrick [email protected]
Mission & Purpose
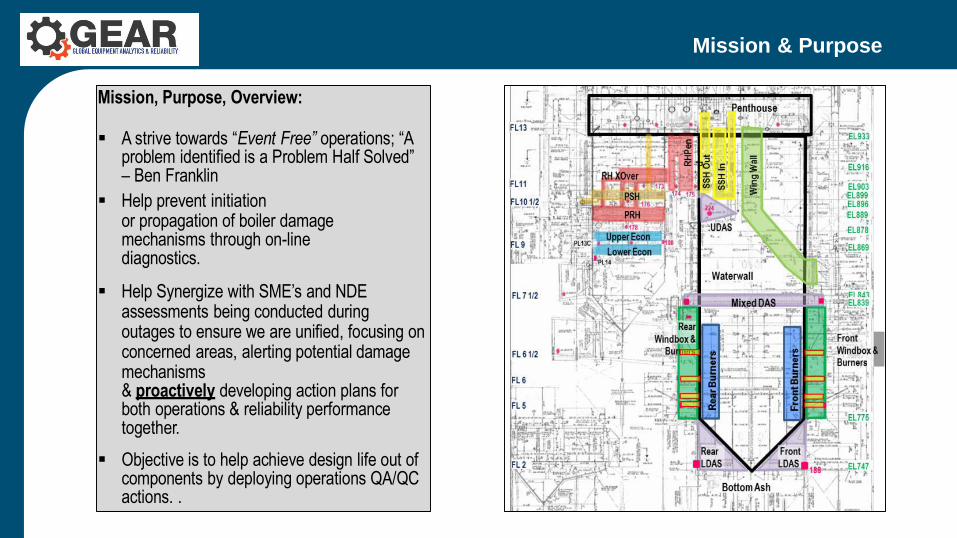
Mission, Purpose, Overview:
A strive towards “Event Free” operations; “Aproblem identified is a Problem Half Solved”– Ben Franklin
Help prevent initiationor propagation of boiler damagemechanisms through on-line diagnostics.
Help Synergize with SME’s and NDEassessments being conducted during outages to ensure we are unified, focusing onconcerned areas, alerting potential damagemechanisms& proactively developing action plans forboth operations & reliability performancetogether.
Objective is to help achieve design life out ofcomponents by deploying operations QA/QCactions. .
Current Pilot Project
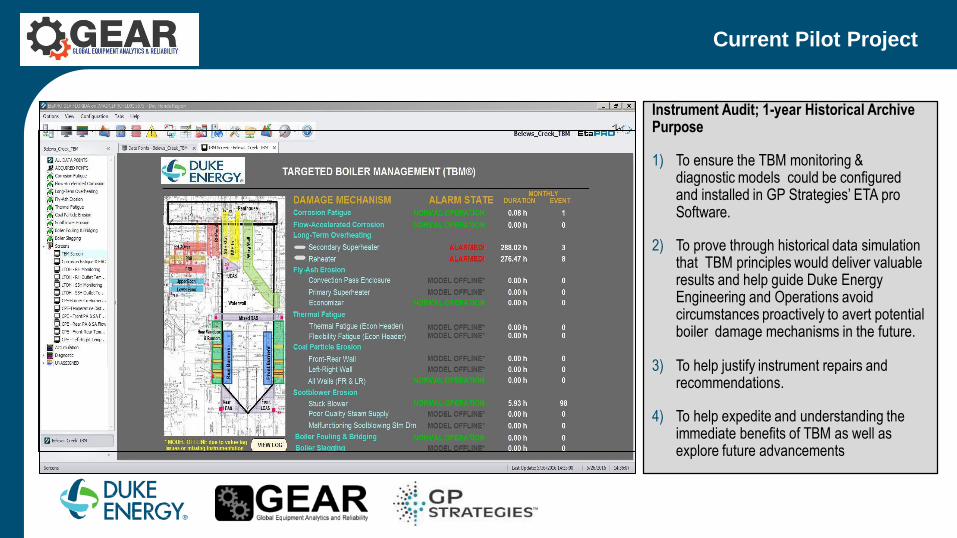
Instrument Audit; 1-year Historical Archive Purpose
1) To ensure the TBM monitoring & diagnostic models could be configured and installed in GP Strategies’ ETA pro Software.
2) To prove through historical data simulation that TBM principles would deliver valuable results and help guide Duke Energy Engineering and Operations avoid circumstances proactively to avert potential boiler damage mechanisms in the future.
3) To help justify instrument repairs and recommendations.
4) To help expedite and understanding the immediate benefits of TBM as well as explore future advancements
Boiler Team Coordination & Support
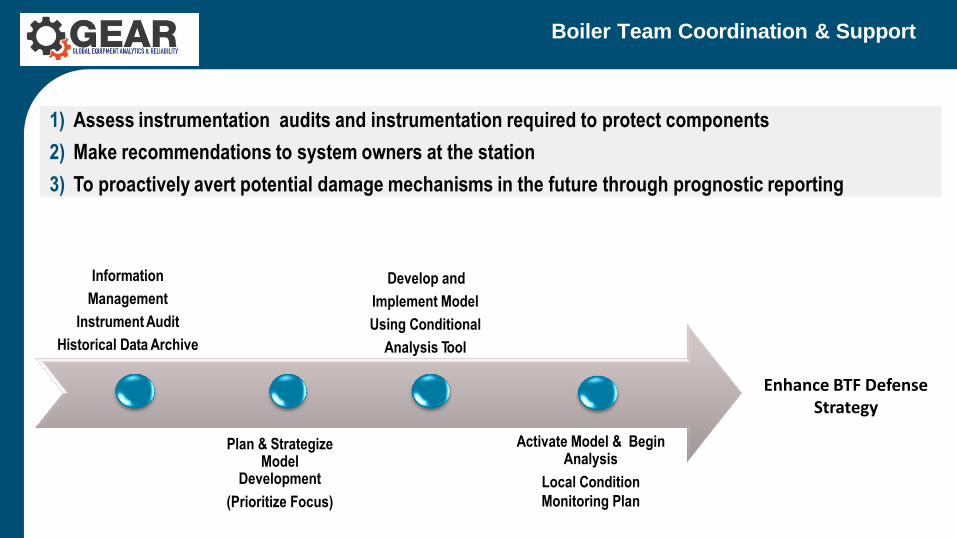
1) Assess instrumentation audits and instrumentation required to protect components
2) Make recommendations to system owners at the station
3) To proactively avert potential damage mechanisms in the future through prognostic reporting
Information
Management
Instrument Audit
Historical Data Archive
Plan & StrategizeModel
Development
(Prioritize Focus)
Develop and
Implement Model
Using Conditional
Analysis Tool
Activate Model & BeginAnalysis
Local Condition
Monitoring Plan
Enhance BTF Defense Strategy
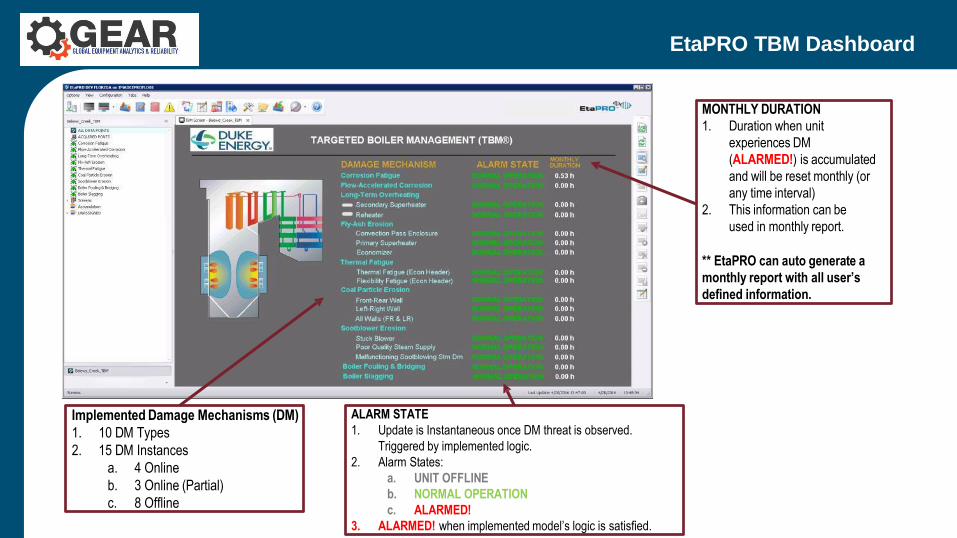
EtaPRO TBM Dashboard
Implemented Damage Mechanisms (DM)
1. 10 DM Types
2. 15 DM Instances
a. 4 Online
b. 3 Online (Partial)
c. 8 Offline
ALARM STATE
1. Update is Instantaneous once DM threat is observed.
Triggered by implemented logic.
2. Alarm States:
a. UNIT OFFLINE
b. NORMAL OPERATION
c. ALARMED!
3. ALARMED! when implemented model’s logic is satisfied.
MONTHLY DURATION
1. Duration when unit
experiences DM
(ALARMED!) is accumulated
and will be reset monthly (or
any time interval)
2. This information can be
used in monthly report.
** EtaPRO can auto generate a
monthly report with all user’s
defined information.
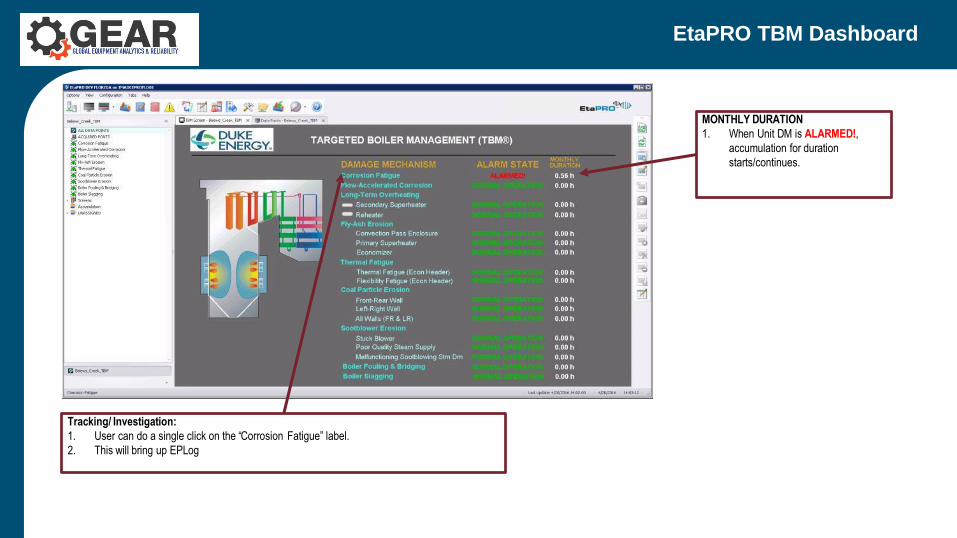
EtaPRO TBM Dashboard
Tracking/ Investigation:
1. User can do a single click on the “Corrosion Fatigue” label.
2. This will bring up EPLog
MONTHLY DURATION
1. When Unit DM is ALARMED!,
accumulation for duration
starts/continues.
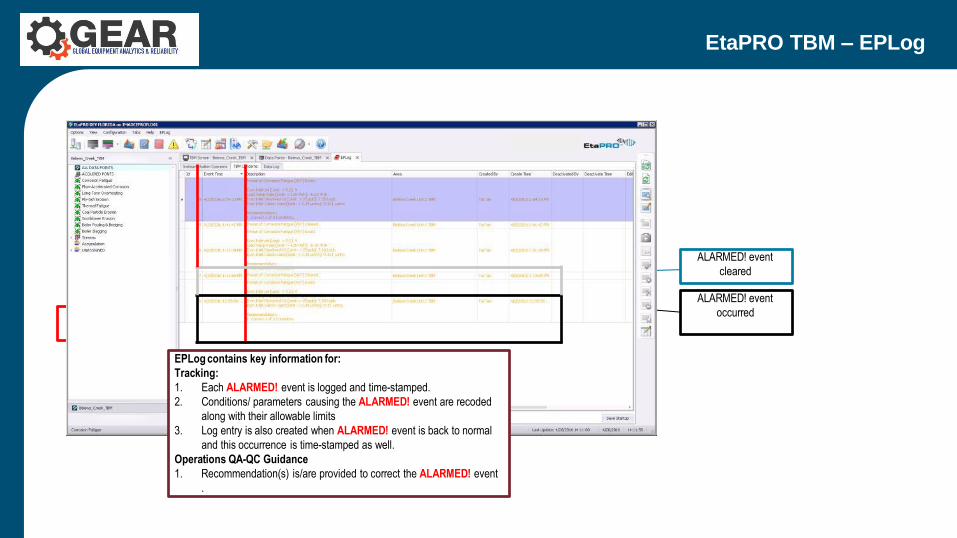
EtaPRO TBM – EPLog
ALARMED! event
occurred
ALARMED! event
cleared
Timestamp
EPLog contains key information for:
Tracking:
1. Each ALARMED! event is logged and time-stamped.
2. Conditions/ parameters causing the ALARMED! event are recoded
along with their allowable limits
3. Log entry is also created when ALARMED! event is back to normal
and this occurrence is time-stamped as well.
Operations QA-QC Guidance
1. Recommendation(s) is/are provided to correct the ALARMED! event
.
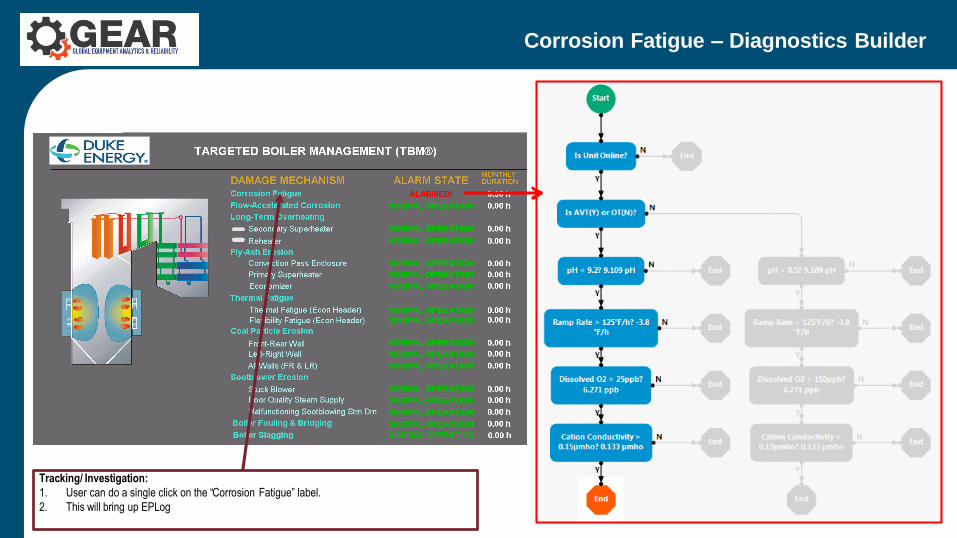
Corrosion Fatigue – Diagnostics Builder
Tracking/ Investigation:
1. User can do a single click on the “Corrosion Fatigue” label.
2. This will bring up EPLog
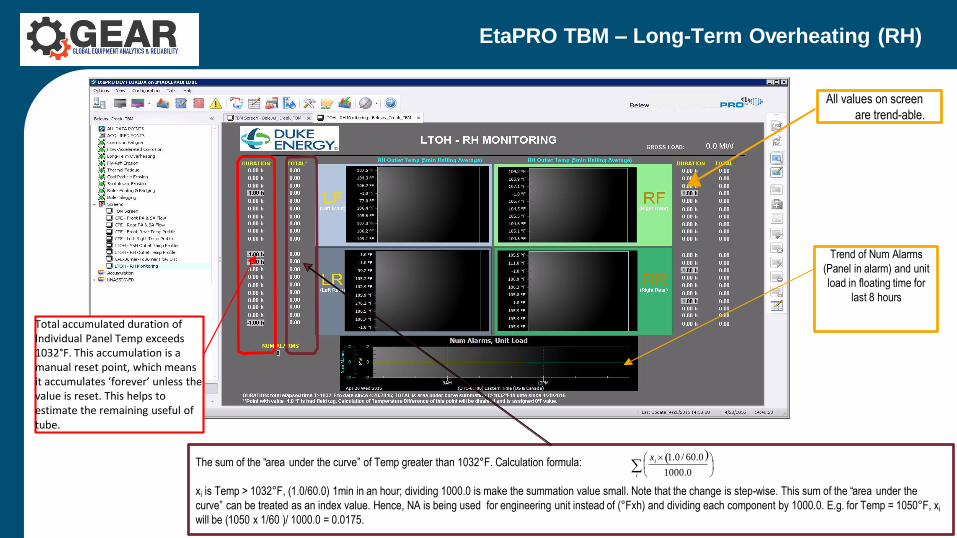
EtaPRO TBM – Long-Term Overheating (RH)
The sum of the “area under the curve” of Temp greater than 1032°F. Calculation formula:
xi is Temp > 1032°F, (1.0/60.0) 1min in an hour; dividing 1000.0 is make the summation value small. Note that the change is step-wise. This sum of the “area under the
curve” can be treated as an index value. Hence, NA is being used for engineering unit instead of (°Fxh) and dividing each component by 1000.0. E.g. for Temp = 1050°F, xi
will be (1050 x 1/60 )/ 1000.0 = 0.0175.
i 1000.0
x 1.0 / 60.0
i
Trend of Num Alarms
(Panel in alarm) and unit
load in floating time for
last 8 hours
All values on screen
are trend-able.
Total accumulated duration of Individual Panel Temp exceeds 1032°F. This accumulation is a manual reset point, which means it accumulates ‘forever’ unless the value is reset. This helps to estimate the remaining useful of tube.
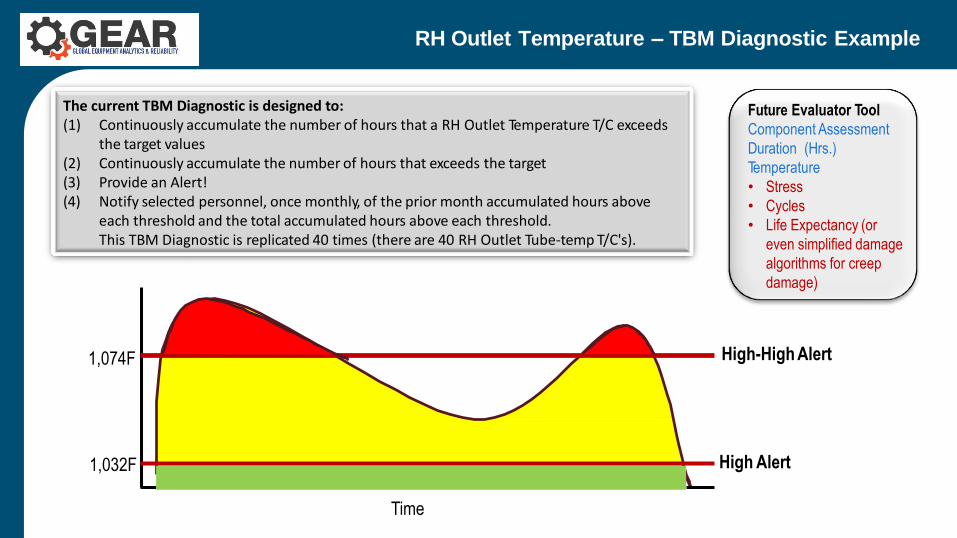
RH Outlet Temperature – TBM Diagnostic Example
The current TBM Diagnostic is designed to:(1) Continuously accumulate the number of hours that a RH Outlet Temperature T/C exceeds
the target values(2) Continuously accumulate the number of hours that exceeds the target(3) Provide an Alert!(4) Notify selected personnel, once monthly, of the prior month accumulated hours above
each threshold and the total accumulated hours above each threshold.This TBM Diagnostic is replicated 40 times (there are 40 RH Outlet Tube-temp T/C's).
Time
High Alert
High-High Alert
1,032F
1,074F
Future Evaluator Tool
Component Assessment
Duration (Hrs.)
Temperature
• Stress
• Cycles
• Life Expectancy (or
even simplified damage
algorithms for creep
damage)
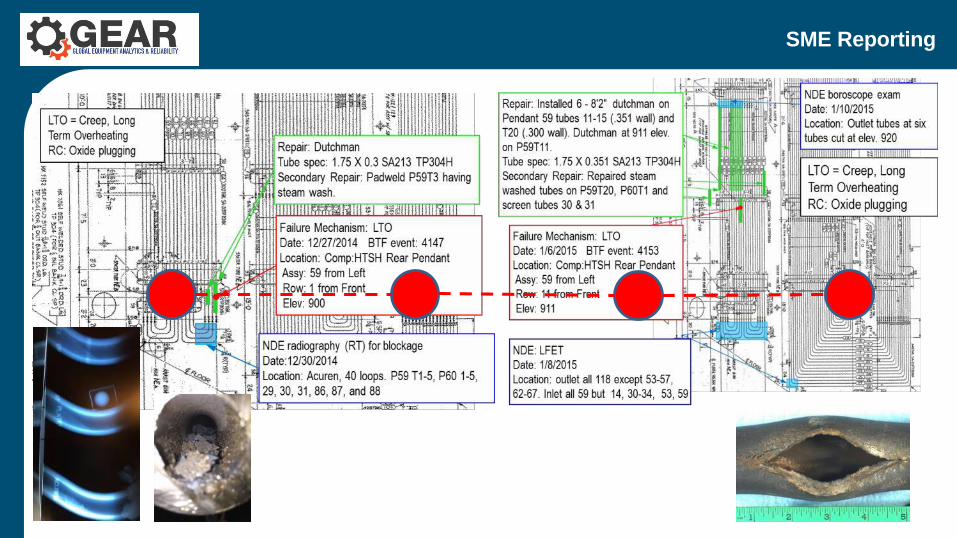
SME Reporting
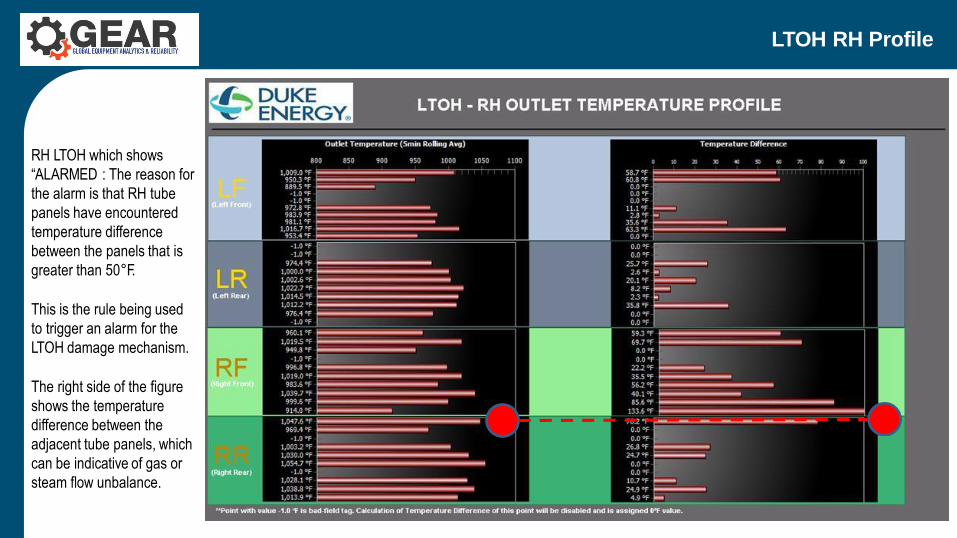
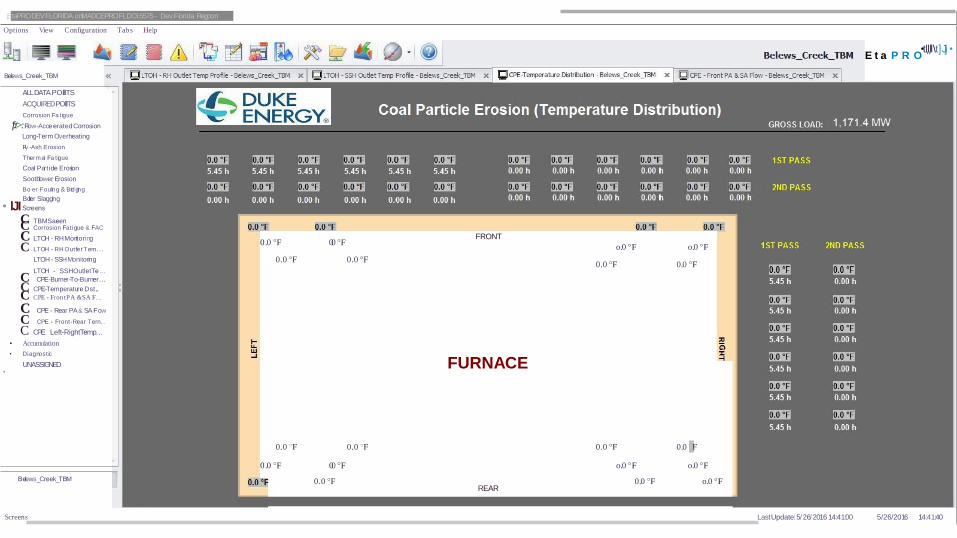
LTOH RH Profile
RH LTOH which shows
“ALARMED : The reason for
the alarm is that RH tube
panels have encountered
temperature difference
between the panels that is
greater than 50°F.
This is the rule being used
to trigger an alarm for the
LTOH damage mechanism.
The right side of the figure
shows the temperature
difference between the
adjacent tube panels, which
can be indicative of gas or
steam flow unbalance.
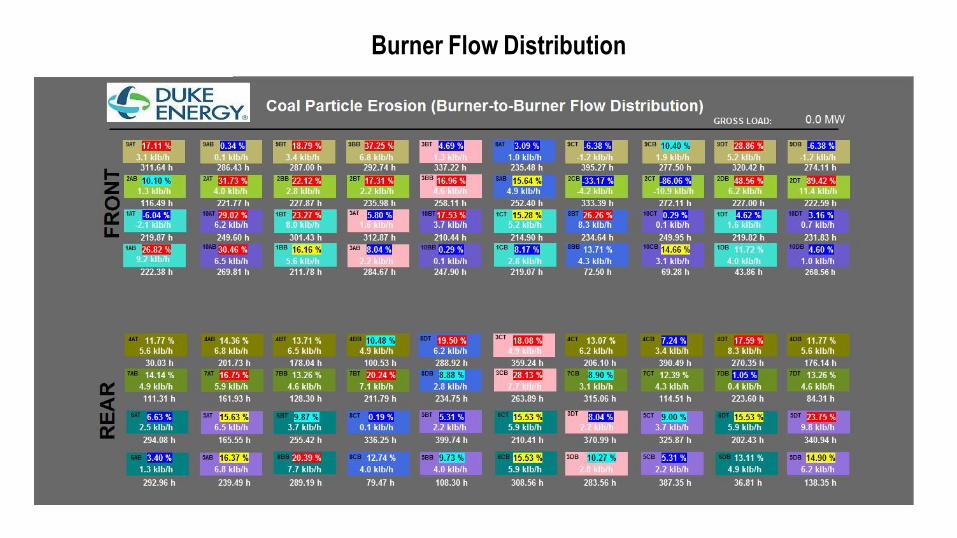
Burner Flow Distribution
,EtaPRODEVFLORIDA onIMADCEPROFLDOl.5575- DevFlorida Regoon
Options View Configuration Tabs Help
0.0 °F
0.0 °F
FRONT
•tllll\t]Jj •E t a P R O "
Belews_Creek_TBM
ALLDATAPOilllTS
ACQUIREDPOlllTS
Corrosion Fa tigue
'f:t>:Flow-AcceeratedCorrosion
Long-Term Overheating
Fly -Ash Erosion
Thermal Fa tigue
Coal Partide Erosion
Sootblower Erosion
Bo er Fouling & Bridging
Boiler Slagging
• lJIScreens
C TBMSaeenC Corrosion Fatigue & FAC
C LTOH - RHMonitoring
C LTOH - RH Outfet T em. . .
LTOH - SSHMonitoring
LTOH - SSHOutletTe. ..
C CPE-Burner-To-Burner. ..
C CPE-Temperature Dst...
C CPE - FrontPA &SA F. .
C CPE - Rear PA& SA Fow
C CPE - Front-Rear Tern. .
C CPE Left-RightTemp...
• Accumulation
• Diagnostic
UNASSIGNED•
Belews_Creek_TBM
Screens
0.0 °F
0.0 °F
o.0 °F
0.0 °F
o.0 °F
0.0 °F
FURNACE
0.0 °F 0.0 °F 0.0 °F 0.0 °F
0.0 °F 0.0 °F
0.0 °F
o.0 °F
0.0 °F
o.0 °F
o.0 °FREAR
LastUpdate:5/26/2016 14:41:00 5/26/2016 14:41:40
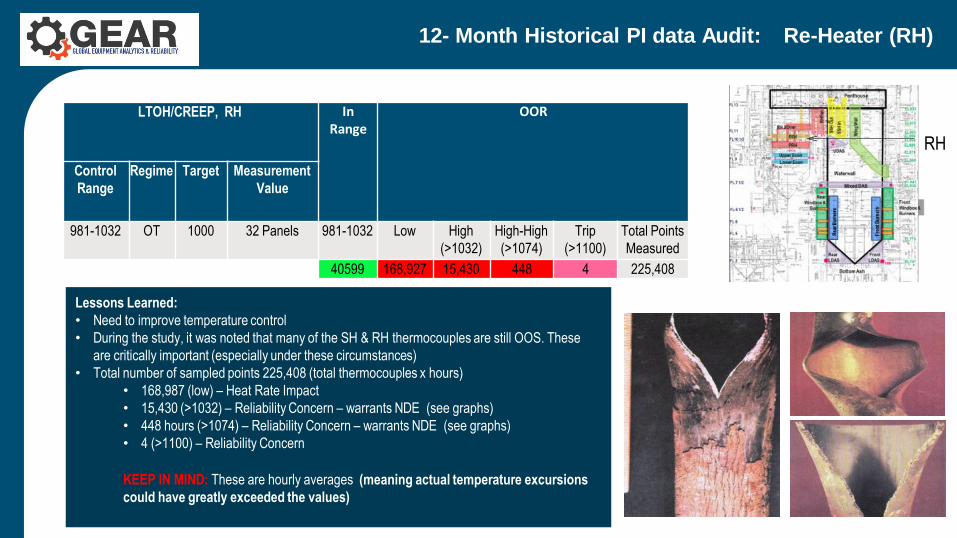
Lessons Learned:
• Need to improve temperature control
• During the study, it was noted that many of the SH & RH thermocouples are still OOS. These
are critically important (especially under these circumstances)
• Total number of sampled points 225,408 (total thermocouples x hours)
• 168,987 (low) – Heat Rate Impact
• 15,430 (>1032) – Reliability Concern – warrants NDE (see graphs)
• 448 hours (>1074) – Reliability Concern – warrants NDE (see graphs)
• 4 (>1100) – Reliability Concern
KEEP IN MIND: These are hourly averages (meaning actual temperature excursions
could have greatly exceeded the values)
12- Month Historical PI data Audit: Re-Heater (RH)
RH
LTOH/CREEP, RH InRange
OOR
Control
Range
Regime Target Measurement
Value
981-1032 OT 1000 32 Panels 981-1032 Low High
(>1032)
High-High
(>1074)
Trip
(>1100)
Total Points
Measured
40599 168,927 15,430 448 4 225,408
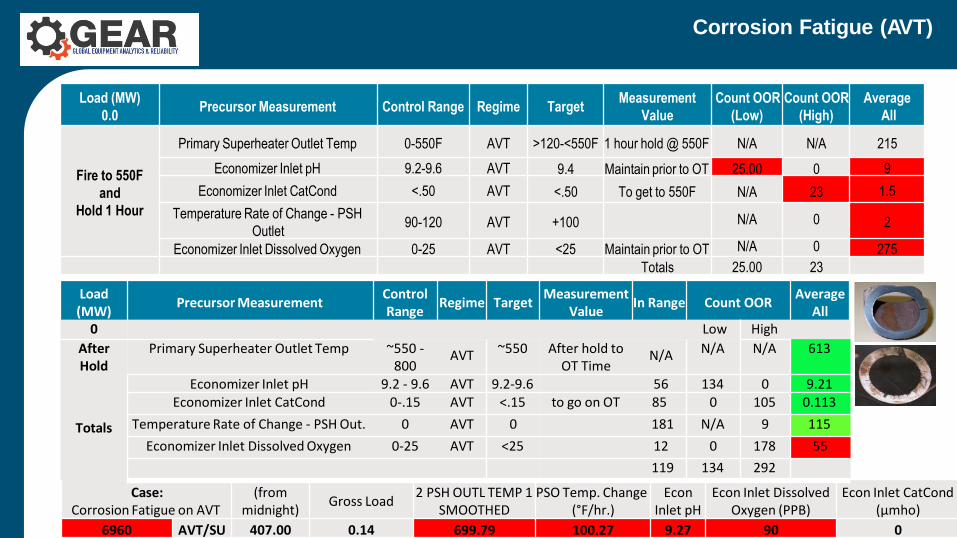
Corrosion Fatigue (AVT)
Load (MW)
0.0Precursor Measurement Control Range Regime Target
Measurement
Value
Count OOR Count OOR
(Low) (High)
N/A N/A
25.00 0
N/A 23
N/A 0
N/A 0
25.00 23
Average
All
Fire to 550F
and
Hold 1 Hour
Primary Superheater Outlet Temp 0-550F AVT >120-<550F 1 hour hold @ 550F
9.4 Maintain prior to OT
<.50 To get to 550F
215
Economizer Inlet pH 9.2-9.6 AVT 9
Economizer Inlet CatCond <.50 AVT 1.5
Temperature Rate of Change - PSH
Outlet90-120 AVT +100 2
Economizer Inlet Dissolved Oxygen 0-25 AVT <25 Maintain prior to OT 275
Totals
Load(MW)
Precursor MeasurementControlRange
Regime TargetMeasurement
ValueIn Range Count OOR
AverageAll
Case:Corrosion Fatigue on AVT
6960 AVT/SU
(from midnight)
Gross Load2 PSH OUTL TEMP 1 PSO Temp. Change
SMOOTHED (°F/hr.)
699.79 100.27
Econ Inlet pH
Econ Inlet Dissolved Oxygen (PPB)
Econ Inlet CatCond (µmho)
407.00 0.14 9.27 90 0
0 Low High
AfterHold
Totals
Primary Superheater Outlet Temp ~550 - AVT 800
~550 After hold to N/A OT Time
N/A N/A 613
Economizer Inlet pH 9.2 - 9.6 AVT 9.2-9.6 56 134 0 9.21Economizer Inlet CatCond 0-.15 AVT <.15 to go on OT 85 0 105 0.113
Temperature Rate of Change - PSH Out. 0 AVT 0 181 N/A 9 115
Economizer Inlet Dissolved Oxygen 0-25 AVT <25 12 0 178 55
119 134 292
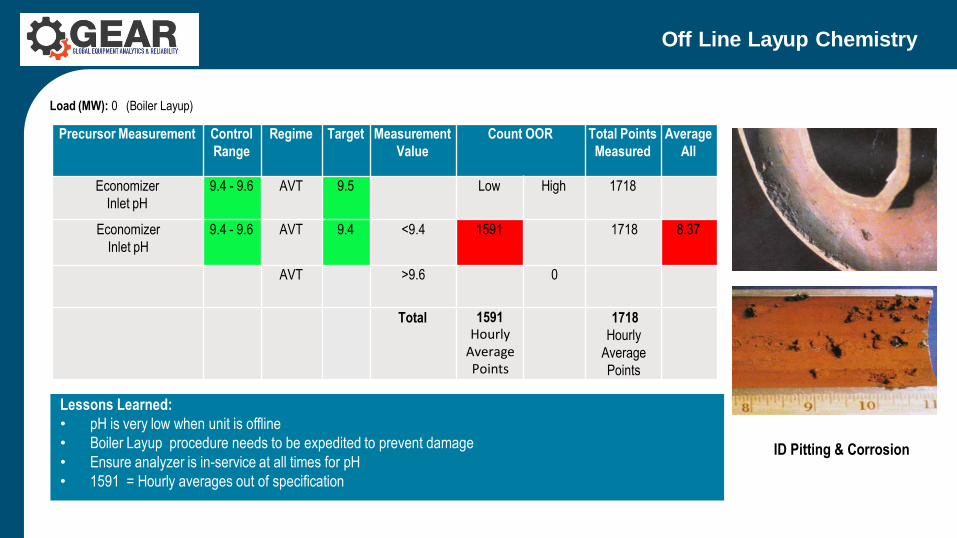
Off Line Layup Chemistry
Lessons Learned:
• pH is very low when unit is offline
• Boiler Layup procedure needs to be expedited to prevent damage
• Ensure analyzer is in-service at all times for pH
• 1591 = Hourly averages out of specification
Load (MW): 0 (Boiler Layup)
ID Pitting & Corrosion
Precursor Measurement Control
Range
Regime Target Measurement
Value
Count OOR Total Points
Measured
Average
All
Economizer
Inlet pH
9.4 - 9.6 AVT 9.5 Low High 1718
Economizer
Inlet pH
9.4 - 9.6 AVT 9.4 <9.4 1591 1718 8.37
AVT >9.6 0
Total 1591Hourly
Average Points
1718
Hourly
Average
Points
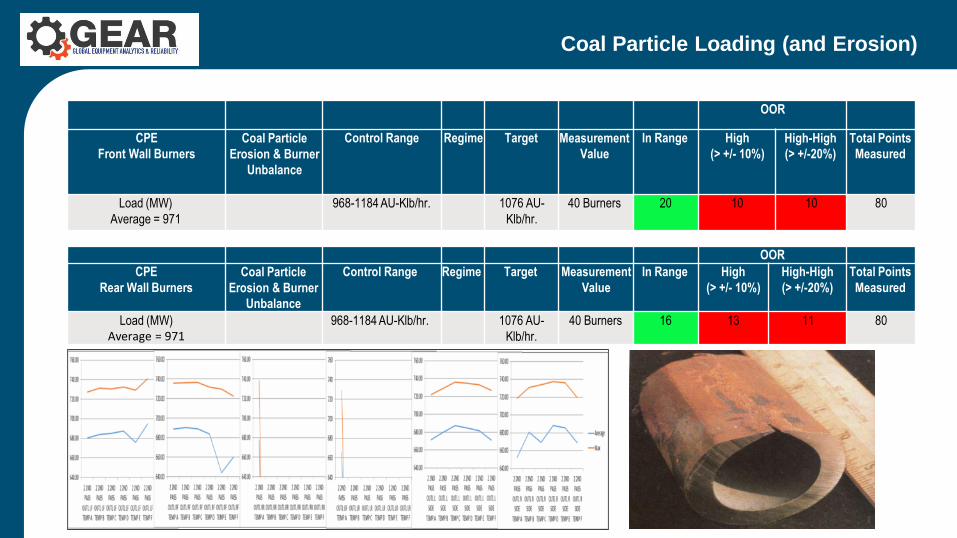
Coal Particle Loading (and Erosion)
OOR
CPE
Front Wall Burners
Coal Particle
Erosion & Burner
Unbalance
Control Range Regime Target Measurement
Value
In Range High
(> +/- 10%)
High-High
(> +/-20%)
Total Points
Measured
Load (MW)
Average = 971
968-1184 AU-Klb/hr. 1076 AU-
Klb/hr.
40 Burners 20 10 10 80
OOR
CPE
Rear Wall Burners
Coal Particle
Erosion & Burner
Unbalance
Control Range Regime Target Measurement
Value
In Range High
(> +/- 10%)
High-High
(> +/-20%)
Total Points
Measured
Load (MW)Average = 971
968-1184 AU-Klb/hr. 1076 AU-
Klb/hr.
40 Burners 16 13 11 80
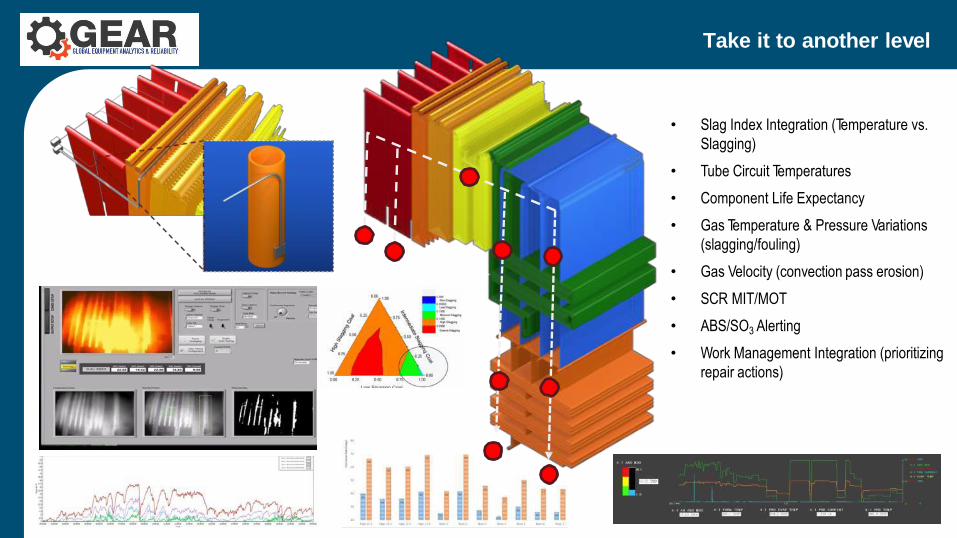
Take it to another level
• Slag Index Integration (Temperature vs.
Slagging)
• Tube Circuit Temperatures
• Component Life Expectancy
• Gas Temperature & Pressure Variations
(slagging/fouling)
• Gas Velocity (convection pass erosion)
• SCR MIT/MOT
• ABS/SO3 Alerting
• Work Management Integration (prioritizing
repair actions)
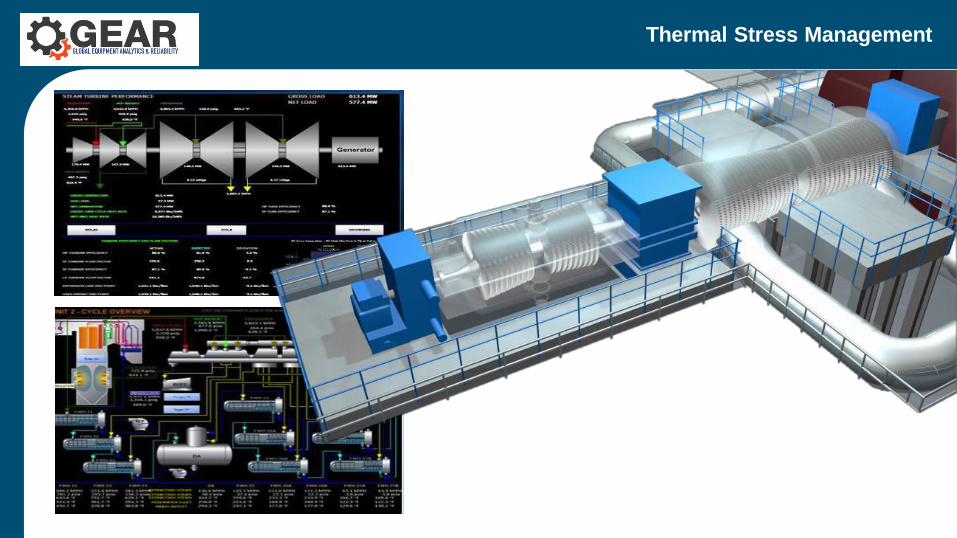
Thermal Stress Management
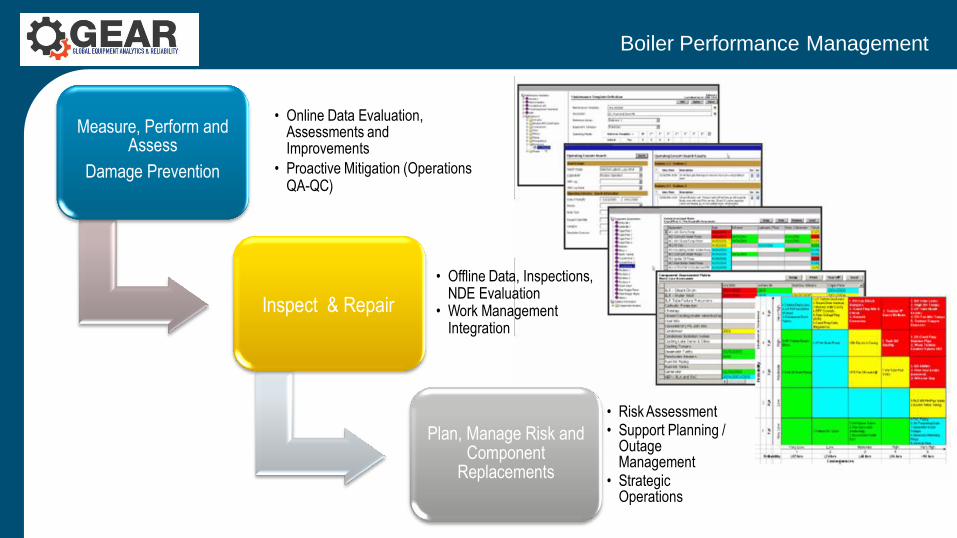
Measure, Perform and Assess
Damage Prevention
• Online Data Evaluation, Assessments and Improvements
• Proactive Mitigation (Operations QA-QC)
Inspect & Repair
• Offline Data, Inspections, NDE Evaluation
• Work ManagementIntegration
Plan, Manage Risk and Component
Replacements
• Risk Assessment• Support Planning /
Outage Management
• Strategic Operations
Boiler Performance Management

Patrick D. Abbott
President529 Mourning Dove Circle,
Lake Mary, FL 32746
C: (407) 399-3235
O: (407) 321-3586
E-mail: [email protected]

• LTOH RH & SH Outlet Temperature Monitoring - Temperature Difference, +/- Range, 900----1007----1100F
• Accumulation - Count # Events/Given Timeframe? Count Type of Event in Given Timeframe?
• Can We Perform Regression of Complex Trends?
• LTOH RH & SH Screens are cramped (May Be Others). Hard to see details. Can we Open up View to Fill Screen Area Available?
• Idea: Build a Condensate Chemistry Screen for Use When Unit is Off-Line to Assure Parameter Compliance (pH, Dissolved O2)
• Accumulation: We Should Reconcile Difference Between Total Hours of Unit Operation/Timeframe and Time on OT and Time on AVT. Not Equal
• Accumulation: Must Combine Duration and Amplitude to Measure “Total Area under Curve” with Unit-less Index (TBD). Replace All Instances Where “Duration” is Used.
• Idea: Flyash Erosion: We have Economizer TC’s for use in determining where Gas is Flowing (High Temp’s.) and Where it is Not Low Temp’s.). Gas Flow Matrix set up
Left/Right/Front/Rear May Be Better.
• LTOH-RH & SH – Change “Num Alrm” Vs. Unit Load to Average Temp
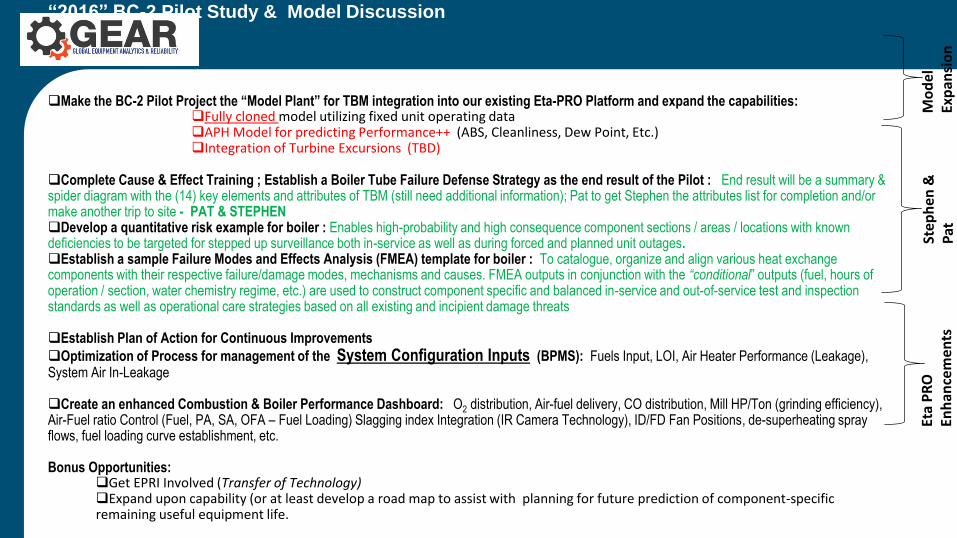
“2016” BC-2 Pilot Study & Model Discussion
Make the BC-2 Pilot Project the “Model Plant” for TBM integration into our existing Eta-PRO Platform and expand the capabilities: Fully cloned model utilizing fixed unit operating dataAPH Model for predicting Performance++ (ABS, Cleanliness, Dew Point, Etc.) Integration of Turbine Excursions (TBD)
Complete Cause & Effect Training ; Establish a Boiler Tube Failure Defense Strategy as the end result of the Pilot : End result will be a summary & spider diagram with the (14) key elements and attributes of TBM (still need additional information); Pat to get Stephen the attributes list for completion and/or make another trip to site - PAT & STEPHEN Develop a quantitative risk example for boiler : Enables high-probability and high consequence component sections / areas / locations with known deficiencies to be targeted for stepped up surveillance both in-service as well as during forced and planned unit outages. Establish a sample Failure Modes and Effects Analysis (FMEA) template for boiler : To catalogue, organize and align various heat exchange components with their respective failure/damage modes, mechanisms and causes. FMEA outputs in conjunction with the “conditional” outputs (fuel, hours of operation / section, water chemistry regime, etc.) are used to construct component specific and balanced in-service and out-of-service test and inspection standards as well as operational care strategies based on all existing and incipient damage threats
Establish Plan of Action for Continuous Improvements
Optimization of Process for management of the System Configuration Inputs (BPMS): Fuels Input, LOI, Air Heater Performance (Leakage), System Air In-Leakage
Create an enhanced Combustion & Boiler Performance Dashboard: O2 distribution, Air-fuel delivery, CO distribution, Mill HP/Ton (grinding efficiency), Air-Fuel ratio Control (Fuel, PA, SA, OFA – Fuel Loading) Slagging index Integration (IR Camera Technology), ID/FD Fan Positions, de-superheating spray flows, fuel loading curve establishment, etc.
Bonus Opportunities: Get EPRI Involved (Transfer of Technology)Expand upon capability (or at least develop a road map to assist with planning for future prediction of component-specific remaining useful equipment life.
Step
hen
&
Pat
Eta
PR
O
Enh
ance
men
tsM
od
el
Exp
ansi
on
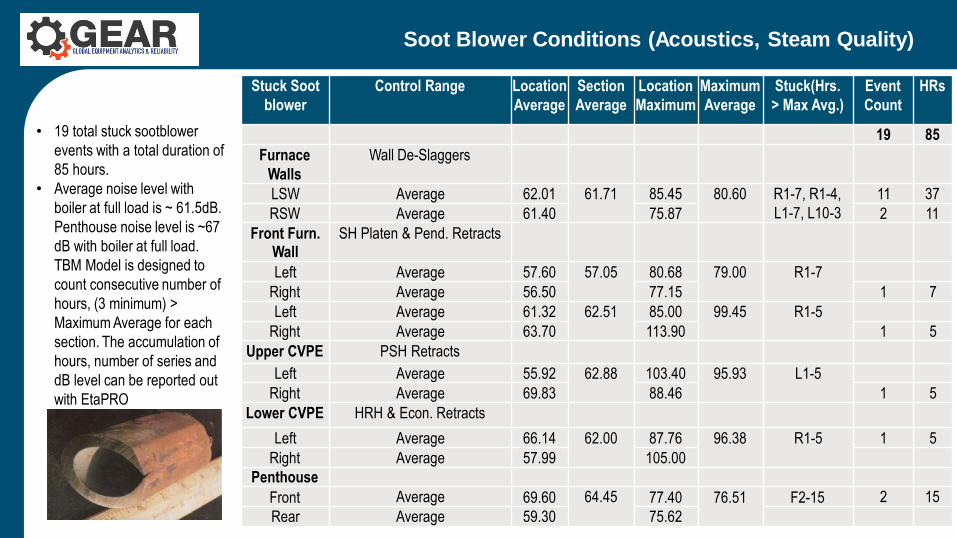
• 19 total stuck sootblower
events with a total duration of
85 hours.
• Average noise level with
boiler at full load is ~ 61.5dB.
Penthouse noise level is ~67
dB with boiler at full load.
TBM Model is designed to
count consecutive number of
hours, (3 minimum) >
Maximum Average for each
section. The accumulation of
hours, number of series and
dB level can be reported out
with EtaPRO
Soot Blower Conditions (Acoustics, Steam Quality)
Stuck Soot
blower
Control Range Location
Average
Section
Average
Location
Maximum
Maximum
Average
Stuck(Hrs.
> Max Avg.)
Event
Count
HRs
19 85
Furnace
Walls
Wall De-Slaggers
LSW Average 62.01 61.71 85.45 80.60 R1-7, R1-4,
L1-7, L10-3
11 37
RSW Average 61.40 75.87 2 11
Front Furn.Wall
SH Platen & Pend. Retracts
Left Average 57.60 57.05 80.68 79.00 R1-7
Right Average 56.50 77.15 1 7
Left Average 61.32 62.51 85.00 99.45 R1-5
Right Average 63.70 113.90 1 5
Upper CVPE PSH Retracts
Left Average 55.92 62.88 103.40 95.93 L1-5
Right Average 69.83 88.46 1 5
Lower CVPE HRH & Econ. Retracts
Left Average 66.14 62.00 87.76 96.38 R1-5 1 5
Right Average 57.99 105.00
Penthouse
Front Average 69.60 64.45 77.40 76.51 F2-15 2 15
Rear Average 59.30 75.62

![Controller/Evaluator Handbook Template · Web viewHomeland Security Exercise and Evaluation Program (HSEEP) [Exercise Name] Controller/Evaluator Handbook [Date] The Controller/Evaluator](https://img.pdfslide.us/doc/110x75/613ca9d64c23507cb6358754/controllerevaluator-handbook-template-web-view-homeland-security-exercise-and-evaluation.jpg)