Embed Size (px)
Citation preview
Patient Safety Culture
Andrea McGuinness
© 2014 AQuA
‘A safety culture is where staff within an organisation have a constant and active awareness of the potential for things to go wrong. Both the staff and the organisation are able to acknowledge mistakes, learn from them, and take action to put things right.’
http://www.nrls.npsa.nhs.uk/resources/patient-safety-topics/human-factors-patient-safety-culture/
‘The safety culture of an organisation is the product of individual and group values, attitudes, perceptions, competencies, and patterns of behaviour that determine the commitment to, and the style and proficiency of, an organisation’s health and safety management. Organisations with a positive safety culture are characterised by communications founded on mutual trust, by shared perceptions of the importance of safety, and by confidence in the efficacy of preventive measures.’
Organising for Safety: Third Report of the ACSNI
(Advisory Committee on the Safety of Nuclear Installations)
Study Group on Human Factors. Health and Safety Commission
(of Great Britain). Sudbury, England: HSE Books, 1993.
© 2014 AQuA
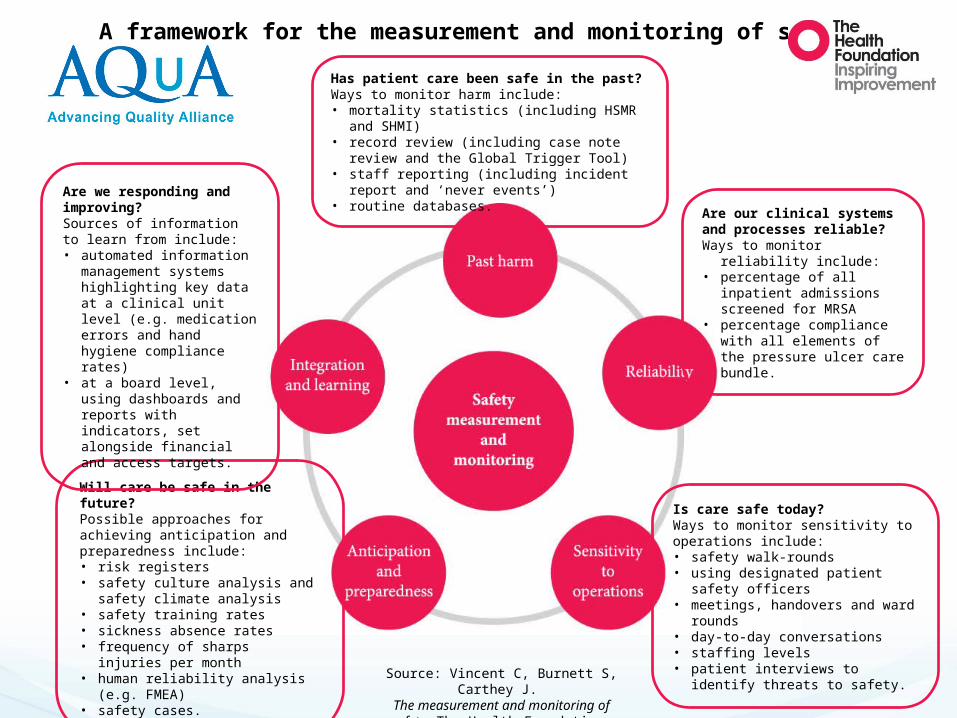
Has patient care been safe in the past? Ways to monitor harm include:• mortality statistics (including HSMR and SHMI)• record review (including case note review and the
Global Trigger Tool)• staff reporting (including incident report and ‘never
events’)• routine databases.
Are our clinical systems and processes reliable? Ways to monitor reliability include:• percentage of all inpatient
admissions screened for MRSA • percentage compliance with all
elements of the pressure ulcer care bundle.
Is care safe today? Ways to monitor sensitivity to operations include:• safety walk-rounds • using designated patient safety officers• meetings, handovers and ward rounds • day-to-day conversations• staffing levels• patient interviews to identify threats to
safety.
Will care be safe in the future? Possible approaches for achieving anticipation and preparedness include:• risk registers• safety culture analysis and safety
climate analysis• safety training rates• sickness absence rates• frequency of sharps injuries per month• human reliability analysis (e.g. FMEA)• safety cases.
Are we responding and improving? Sources of information to learn from include: • automated information
management systems highlighting key data at a clinical unit level (e.g. medication errors and hand hygiene compliance rates)
• at a board level, using dashboards and reports with indicators, set alongside financial and access targets.
A framework for the measurement and monitoring of safety
Source: Vincent C, Burnett S, Carthey J.
The measurement and monitoring of safety. The Health Foundation,
2013
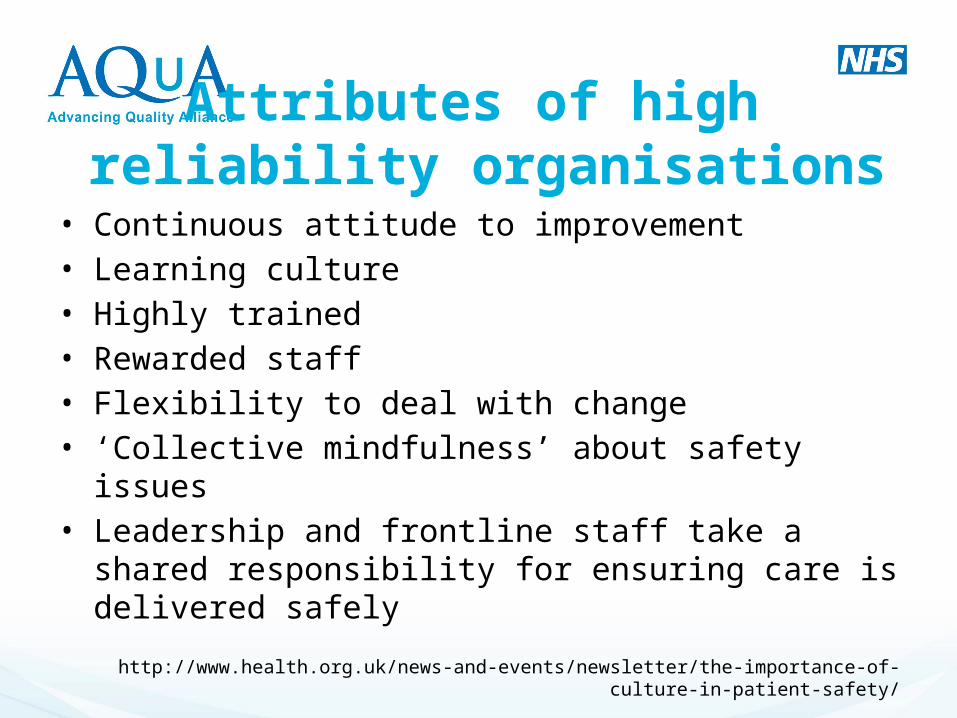
Attributes of high reliability organisations
• Continuous attitude to improvement• Learning culture• Highly trained • Rewarded staff• Flexibility to deal with change• ‘Collective mindfulness’ about safety issues• Leadership and frontline staff take a shared responsibility
for ensuring care is delivered safely
http://www.health.org.uk/news-and-events/newsletter/the-importance-of-culture-in-patient-safety/
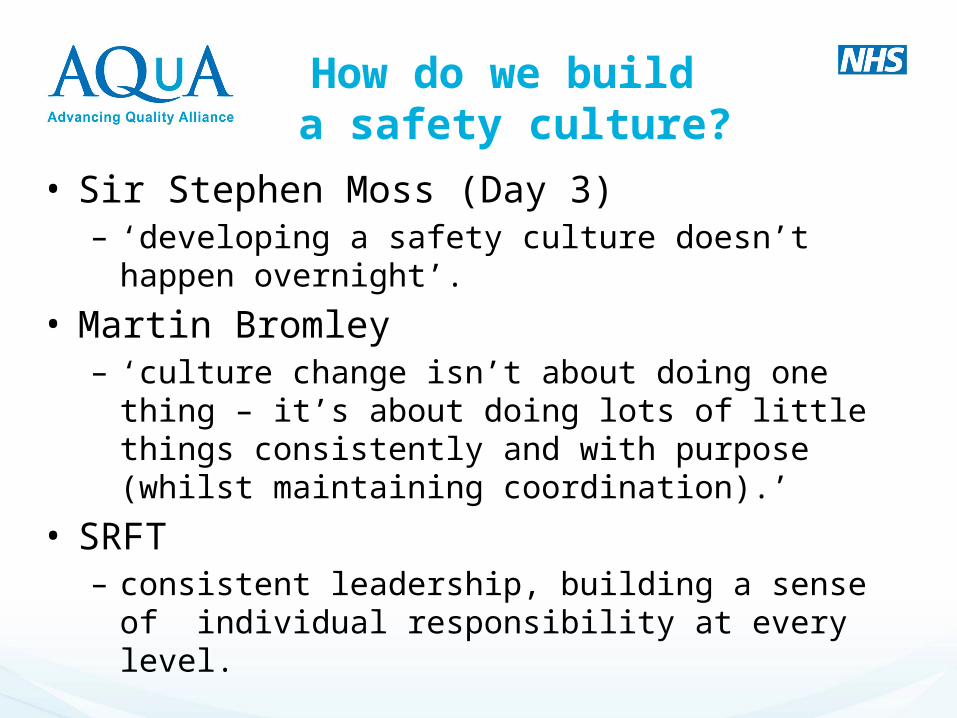
How do we build a safety culture?
• Sir Stephen Moss (Day 3)– ‘developing a safety culture doesn’t happen overnight’.
• Martin Bromley– ‘culture change isn’t about doing one thing – it’s about
doing lots of little things consistently and with purpose (whilst maintaining coordination).’
• SRFT– consistent leadership, building a sense of individual
responsibility at every level.
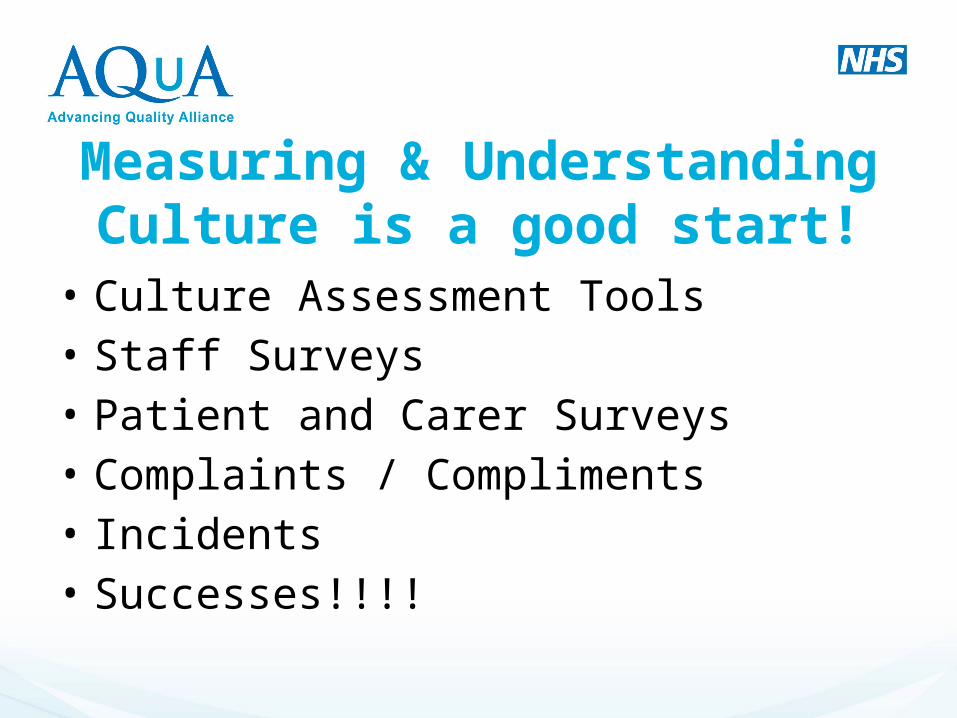
Measuring & Understanding Culture is a good start!
• Culture Assessment Tools• Staff Surveys• Patient and Carer Surveys• Complaints / Compliments• Incidents• Successes!!!!

Patient Safety Culture Assessment Tools
Patient Safety Culture Survey
© 2014 AQuA
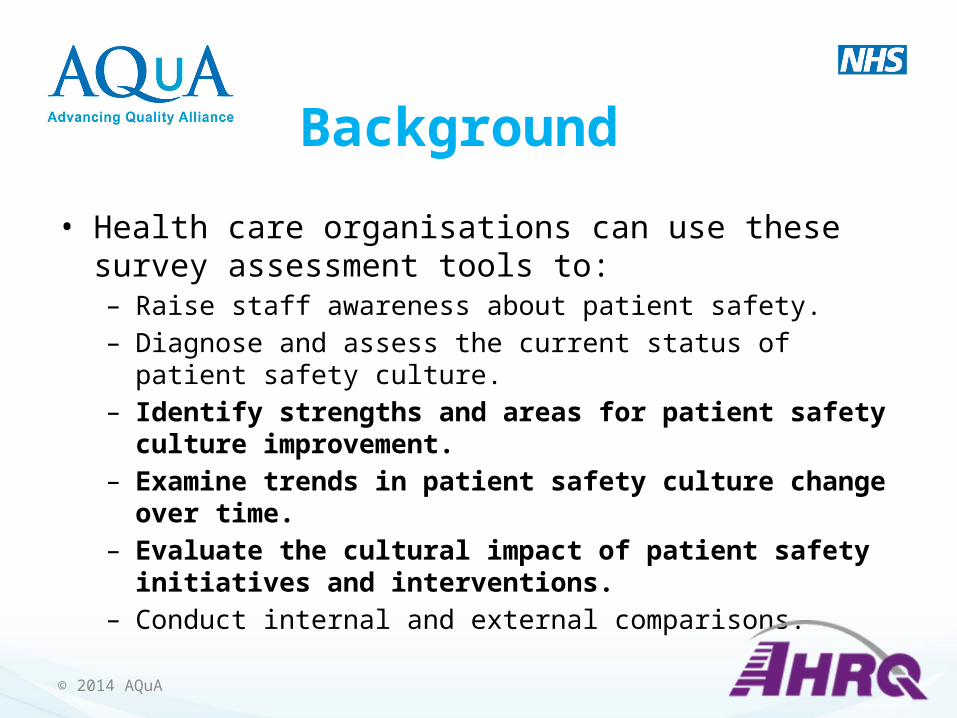
• Health care organisations can use these survey assessment tools to:– Raise staff awareness about patient safety.– Diagnose and assess the current status of patient safety culture.– Identify strengths and areas for patient safety culture
improvement.– Examine trends in patient safety culture change over time.– Evaluate the cultural impact of patient safety initiatives and
interventions.– Conduct internal and external comparisons.
© 2014 AQuA
Background

• To support patient safety and quality improvement they sponsored the development of patient safety culture assessment tools.
• Bespoke AQuA member access (3 tools):– Acute (Hospitals)– Community– Mental Health
Why use the tool?
• To support patient safety and quality improvement they sponsored the development of patient safety culture assessment tools.
• Bespoke AQuA member access (3 tools):– Acute (Hospitals)– Community– Mental Health
Why use the tool?
© 2014 AQuA
Safety DimensionsSupervisor/Manager expectations and actions promoting safety No Yes NoOrganisational Learning - Continous Improvement Yes Yes YesTeamwork with Units No Yes NoCommunication Openness No No NoFeedback and Communication About Error No Yes NoNonpunitive Response to Error No Yes NoStaffi ng Yes Yes YesHospital Management Support for Patient Safety No No NoTeamwork Across Units No No YesHandoffs & Transitions Yes Yes YesEvent Reporting Yes No YesOverall Perceptions of Safety Yes Yes Yes
Safety DimensionsCombined Yes Yes Yes
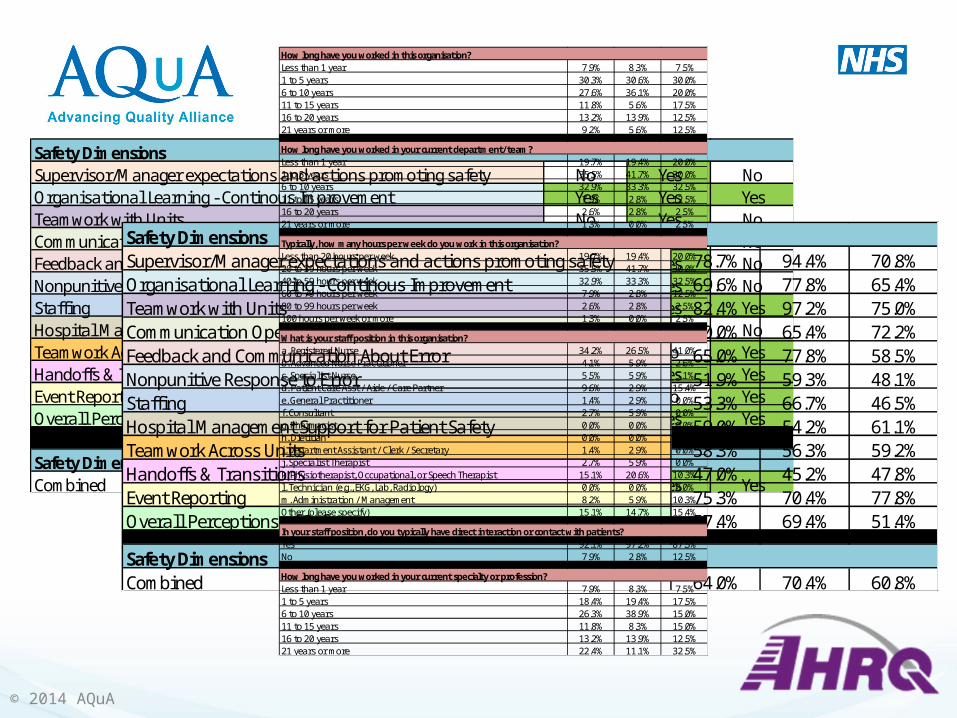
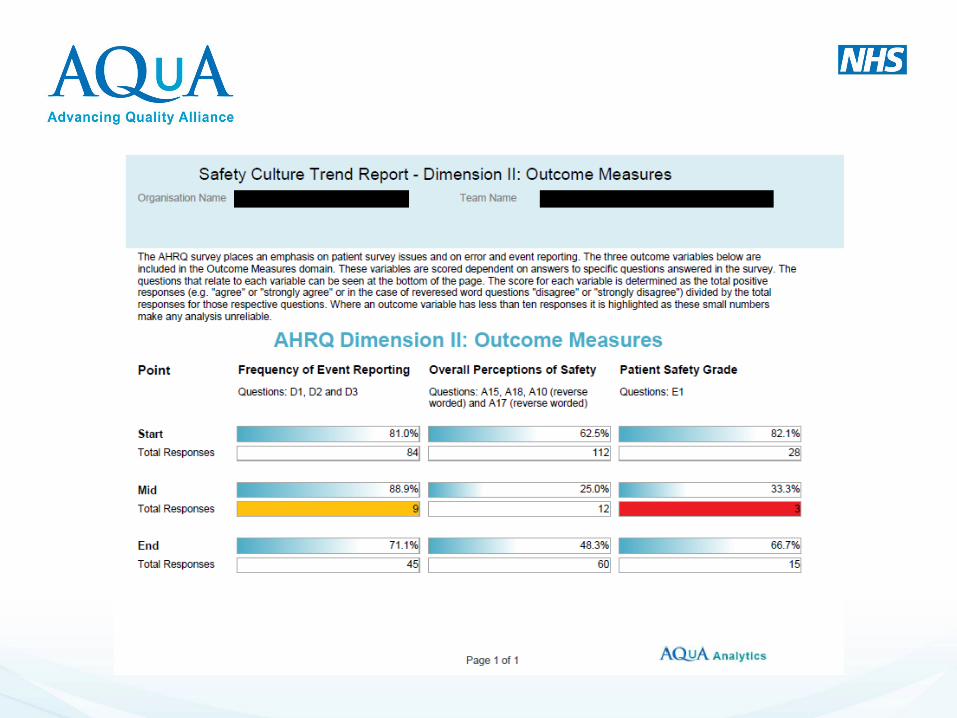
Safety DimensionsSupervisor/Manager expectations and actions promoting safety 78.7% 94.4% 70.8%Organisational Learning - Continous Improvement 69.6% 77.8% 65.4%Teamwork with Units 82.4% 97.2% 75.0%Communication Openness 70.0% 65.4% 72.2%Feedback and Communication About Error 65.0% 77.8% 58.5%Nonpunitive Response to Error 51.9% 59.3% 48.1%Staffi ng 53.3% 66.7% 46.5%Hospital Management Support for Patient Safety 59.0% 54.2% 61.1%Teamwork Across Units 58.3% 56.3% 59.2%Handoffs & Transitions 47.0% 45.2% 47.8%Event Reporting 75.3% 70.4% 77.8%Overall Perceptions of Safety 57.4% 69.4% 51.4%
Safety DimensionsCombined 64.0% 70.4% 60.8%
How long have you worked in this organisation?Less than 1 year 7.9% 8.3% 7.5%1 to 5 years 30.3% 30.6% 30.0%6 to 10 years 27.6% 36.1% 20.0%11 to 15 years 11.8% 5.6% 17.5%16 to 20 years 13.2% 13.9% 12.5%21 years or more 9.2% 5.6% 12.5%
How long have you worked in your current department/team?Less than 1 year 19.7% 19.4% 20.0%1 to 5 years 35.5% 41.7% 30.0%6 to 10 years 32.9% 33.3% 32.5%11 to 15 years 7.9% 2.8% 12.5%16 to 20 years 2.6% 2.8% 2.5%21 years or more 1.3% 0.0% 2.5%
Typically, how many hours per week do you work in this organisation?Less than 20 hours per week 19.7% 19.4% 20.0%20 to 39 hours per week 35.5% 41.7% 30.0%40 to 59 hours per week 32.9% 33.3% 32.5%60 to 79 hours per week 7.9% 2.8% 12.5%80 to 99 hours per week 2.6% 2.8% 2.5%100 hours per week or more 1.3% 0.0% 2.5%
What is your staff position in this organisation?a. Registered Nurse 34.2% 26.5% 41.0%b. Advanced Nurse Practitioner 4.1% 5.9% 2.6%c. Specialist Nurse 5.5% 5.9% 5.1%d. Patient Care Asst / Aide / Care Partner 9.6% 2.9% 15.4%e. General Practitioner 1.4% 2.9% 0.0%f. Consultant 2.7% 5.9% 0.0%g. Pharmacist 0.0% 0.0% 0.0%h. Dietitian 0.0% 0.0% 0.0%i. Department Assistant / Clerk / Secretary 1.4% 2.9% 0.0%j. Specialist Therapist 2.7% 5.9% 0.0%k. Physiotherapist, Occupational, or Speech Therapist 15.1% 20.6% 10.3%l. Technician (e.g., EKG, Lab, Radiology) 0.0% 0.0% 0.0%m. Administration / Management 8.2% 5.9% 10.3%Other (please specify) 15.1% 14.7% 15.4%
In your staff position, do you typically have direct interaction or contact with patients?Yes 92.1% 97.2% 87.5%No 7.9% 2.8% 12.5%
How long have you worked in your current specialty or profession?Less than 1 year 7.9% 8.3% 7.5%1 to 5 years 18.4% 19.4% 17.5%6 to 10 years 26.3% 38.9% 15.0%11 to 15 years 11.8% 8.3% 15.0%16 to 20 years 13.2% 13.9% 12.5%21 years or more 22.4% 11.1% 32.5%
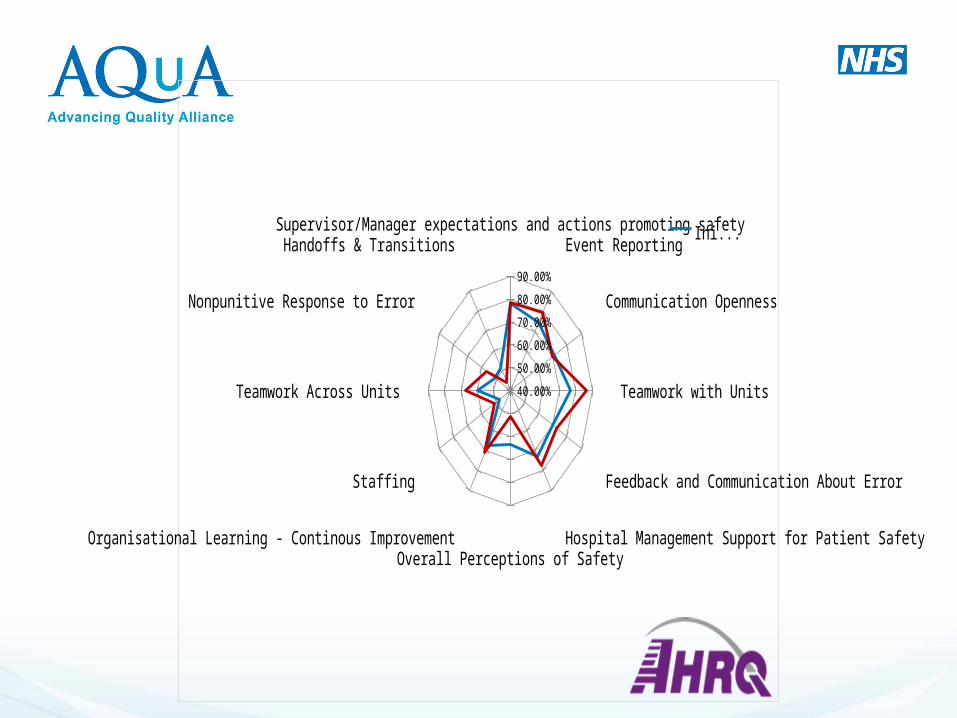
Supervisor/Manager expectations and actions promoting safetyEvent Reporting
Communication Openness
Teamwork with Units
Feedback and Communication About Error
Hospital Management Support for Patient SafetyOverall Perceptions of Safety
Organisational Learning - Continous Improvement
Staffing
Teamwork Across Units
Nonpunitive Response to Error
Handoffs & Transitions
40.00%
50.00%
60.00%
70.00%
80.00%
90.00%
Initial
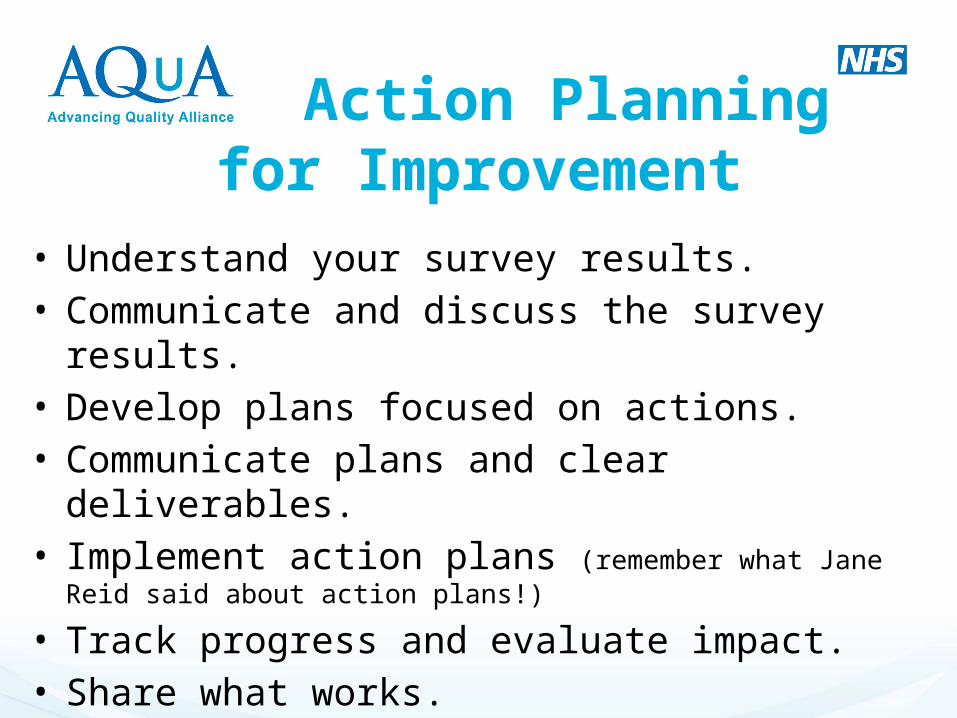
Action Planning for Improvement
• Understand your survey results.• Communicate and discuss the survey results.• Develop plans focused on actions.• Communicate plans and clear deliverables.• Implement action plans (remember what Jane Reid said
about action plans!)
• Track progress and evaluate impact.• Share what works.
PSC AQuA AHRQ Demo
https://www.surveymonkey.com/r/TZ8VXWT
http://www.ahrq.gov/professionals/quality-patient-safety/patientsafetyculture/index.html
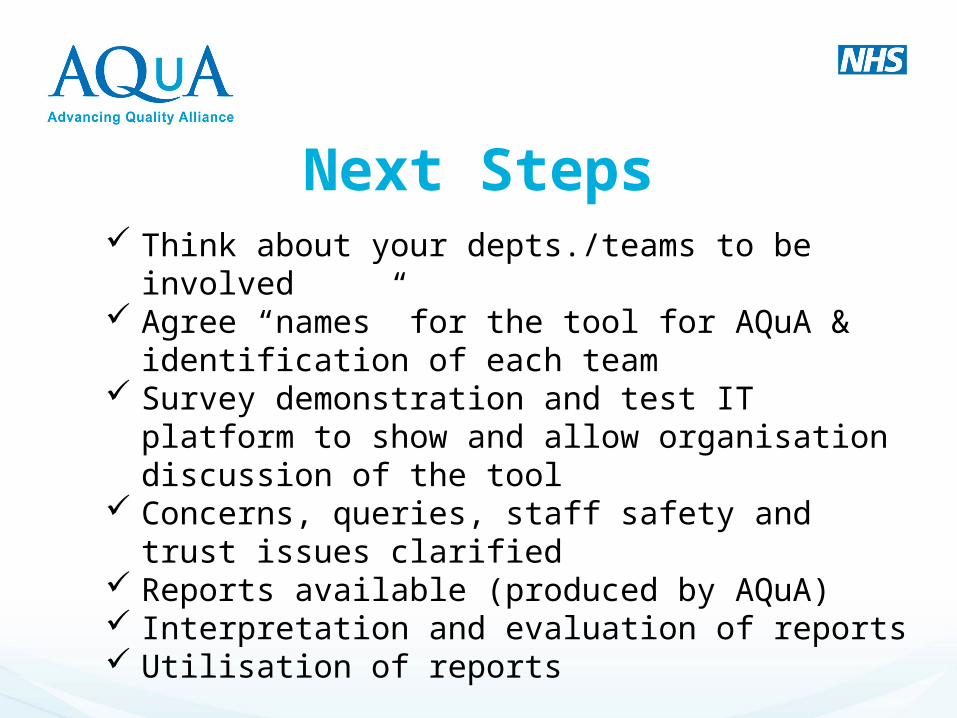
Next Steps Think about your depts./teams to be involved Agree “names” for the tool for AQuA & identification of
each team Survey demonstration and test IT platform to show and
allow organisation discussion of the tool Concerns, queries, staff safety and trust issues
clarified Reports available (produced by AQuA) Interpretation and evaluation of reports Utilisation of reports
Top Tips
• Start small• Clarify your purpose• Choose carefully• Use holistically• Don’t mandate
Evaluation & Next Steps
To do list
• Please watch the DVD’s as these will help you in the further modules
• DVD’s to be returned on the last day – 22nd May 2015
• Please liaise with Rose regarding your site visits (if not already done so)
• Sign in sheet!


![New Aqua Key Aqua Facts - Earth Observing System · 2017. 1. 26. · Earth Science Reference Handbook [ Missions: Aqua ] 73 Aqua Summary Aqua is a major international Earth Science](https://img.pdfslide.us/doc/110x75/604176e56ec9bf22204cde4b/new-aqua-key-aqua-facts-earth-observing-system-2017-1-26-earth-science-reference.jpg)


![CRM on Demand Architecture - McGuinness v03[1]](https://img.pdfslide.us/doc/110x75/55cf9d0f550346d033ac159d/crm-on-demand-architecture-mcguinness-v031.jpg)
