Embed Size (px)
Citation preview

Patient-Reported Outcomes:
Measurement, Implementation and Interpretation
Joseph C. Cappelleri and Andrew Bushmakin
Pfizer Inc
[email protected] [email protected]
4-hour short course at the New York City Metropolitan Area Chapter,
American Statistical Association, New York, NY,
April 1, 2014
1

Acknowledgment:
Book Reference
Cappelleri JC, Zou KH, Bushmakin AG, Alvir JMJ,
Alemayehu D, Symonds T.
Patient-Reported Outcomes:
Measurement, Implementation and Interpretation
Boca Raton, Florida: Chapman & Hall/CRC; 2014
2
Outline
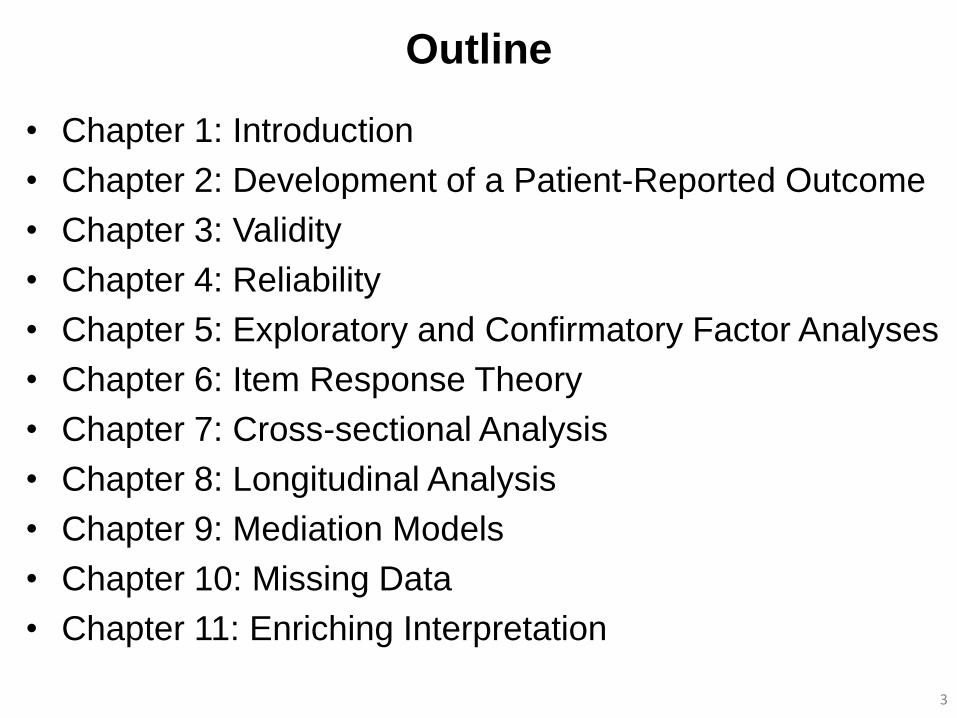
• Chapter 1: Introduction
• Chapter 2: Development of a Patient-Reported Outcome
• Chapter 3: Validity
• Chapter 4: Reliability
• Chapter 5: Exploratory and Confirmatory Factor Analyses
• Chapter 6: Item Response Theory
• Chapter 7: Cross-sectional Analysis
• Chapter 8: Longitudinal Analysis
• Chapter 9: Mediation Models
• Chapter 10: Missing Data
• Chapter 11: Enriching Interpretation
3

Chapter 1:
Introduction
4
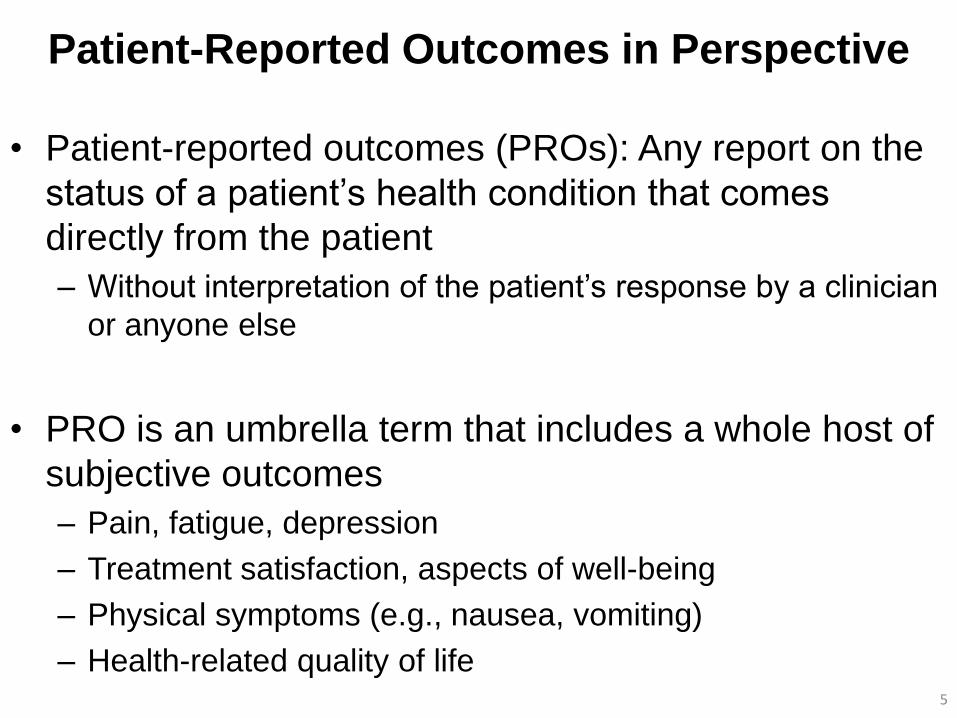
Patient-Reported Outcomes in Perspective
• Patient-reported outcomes (PROs): Any report on the
status of a patient’s health condition that comes
directly from the patient
– Without interpretation of the patient’s response by a clinician
or anyone else
• PRO is an umbrella term that includes a whole host of
subjective outcomes
– Pain, fatigue, depression
– Treatment satisfaction, aspects of well-being
– Physical symptoms (e.g., nausea, vomiting)
– Health-related quality of life
5
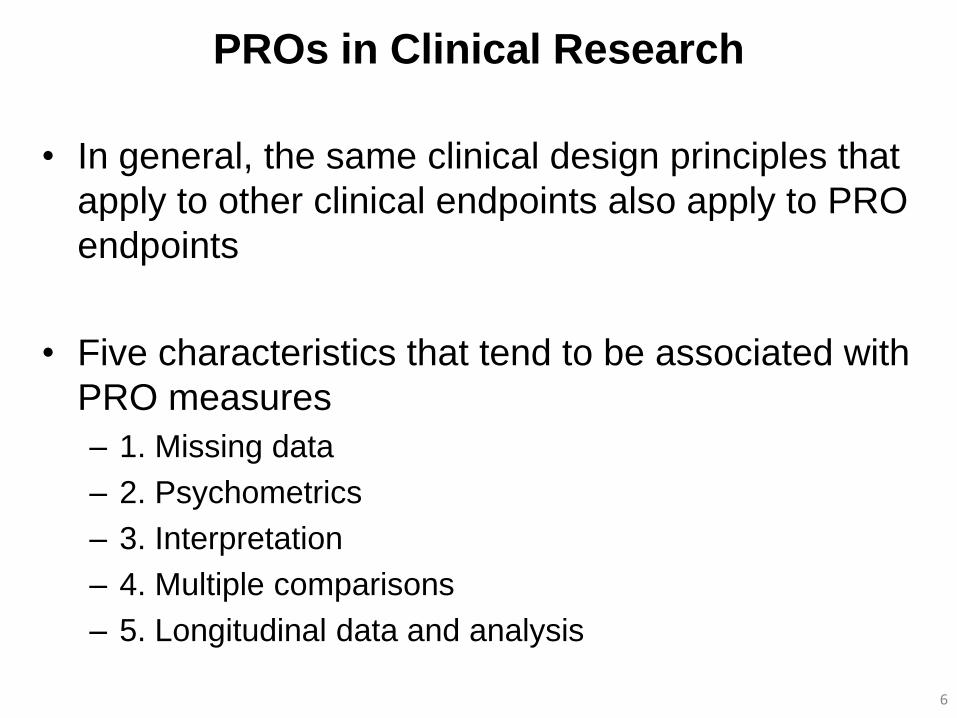
PROs in Clinical Research
• In general, the same clinical design principles that
apply to other clinical endpoints also apply to PRO
endpoints
• Five characteristics that tend to be associated with
PRO measures
– 1. Missing data
– 2. Psychometrics
– 3. Interpretation
– 4. Multiple comparisons
– 5. Longitudinal data and analysis
6
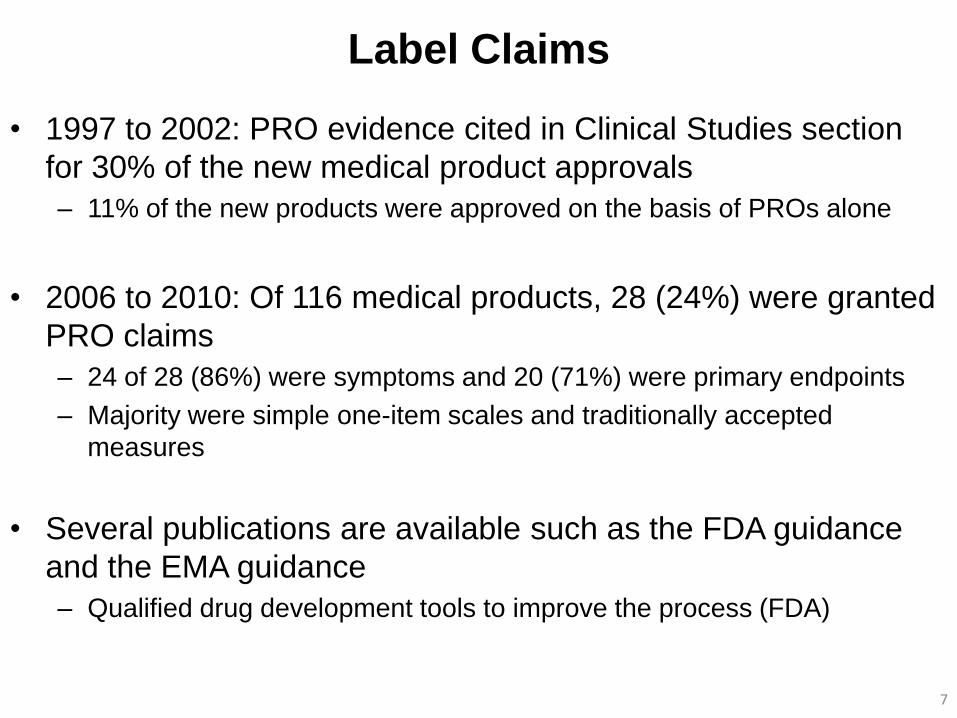
Label Claims
• 1997 to 2002: PRO evidence cited in Clinical Studies section
for 30% of the new medical product approvals
– 11% of the new products were approved on the basis of PROs alone
• 2006 to 2010: Of 116 medical products, 28 (24%) were granted
PRO claims
– 24 of 28 (86%) were symptoms and 20 (71%) were primary endpoints
– Majority were simple one-item scales and traditionally accepted
measures
• Several publications are available such as the FDA guidance
and the EMA guidance
– Qualified drug development tools to improve the process (FDA)
7

8
Chapter 2:
Development of a Patient-Reported Outcome
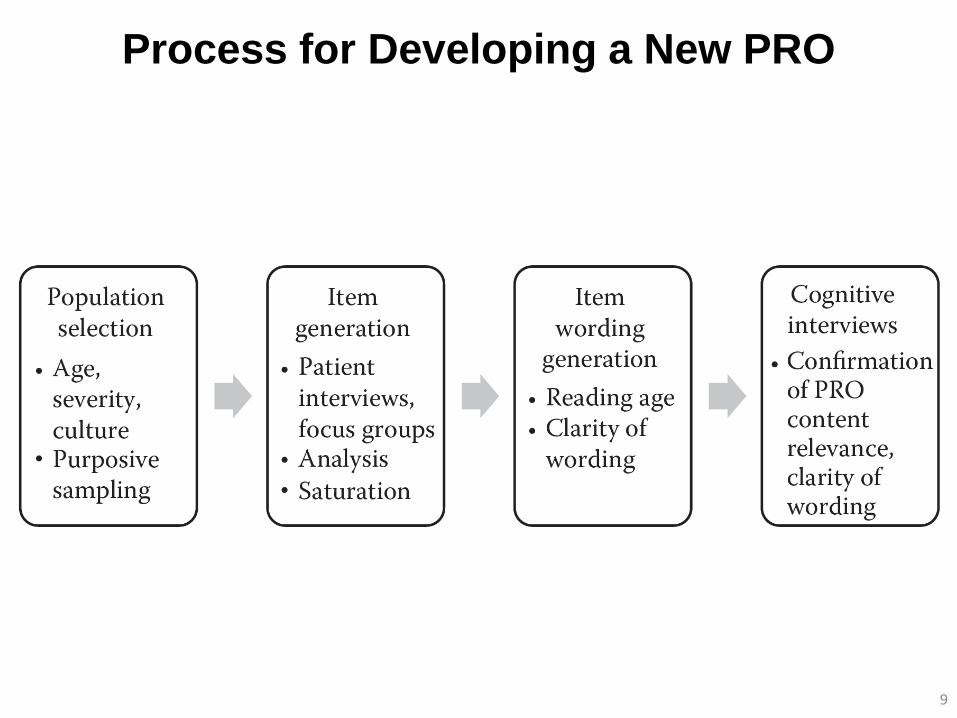
Process for Developing a New PRO
9
Item Generation:
Patient Interviews and Focus Groups
• To generate the content of a PRO measure, either individual interviews or
group discussion with patients will be required
– Choice of the two depends on sensitivity of the topic and whether there is a need to
react and feed off each other
– Focus groups require a skilled moderator
– Individual interviews allow more in-depth discussion and are easier to analyze but
take longer to collect data
– Generally a mixture of the two approaches is beneficial
• Qualitative research is a scientific technique which requires a protocol
outlining the study details (e.g., inclusion/exclusion criteria, number of
subjects, pre-specification if particular subgroups are to be recruited)
– Development of interview guide for the right and consistent questions
– Questions open-ended and broad: “What kinds of sleep difficulties do you
experience?”
– Followed by more detailed or specific questions: “You said that you had problems with
staying asleep, can you describe in more detail what specifically these problems
are?”
10

Analysis of Qualitative Data
• Once data are collected, analysis of the verbatim transcripts is then conducted – Develop coding whereby similar concepts are given a code name
(for fatigue, concepts might be tiredness and unrested)
– List of patient statements per code and their frequency
– Develop codes, group them into concepts, and from these concepts a theory about data is developed
• From this process a conceptual framework will emerge – Based on clinical input and literature review along with qualitative
interviews
11
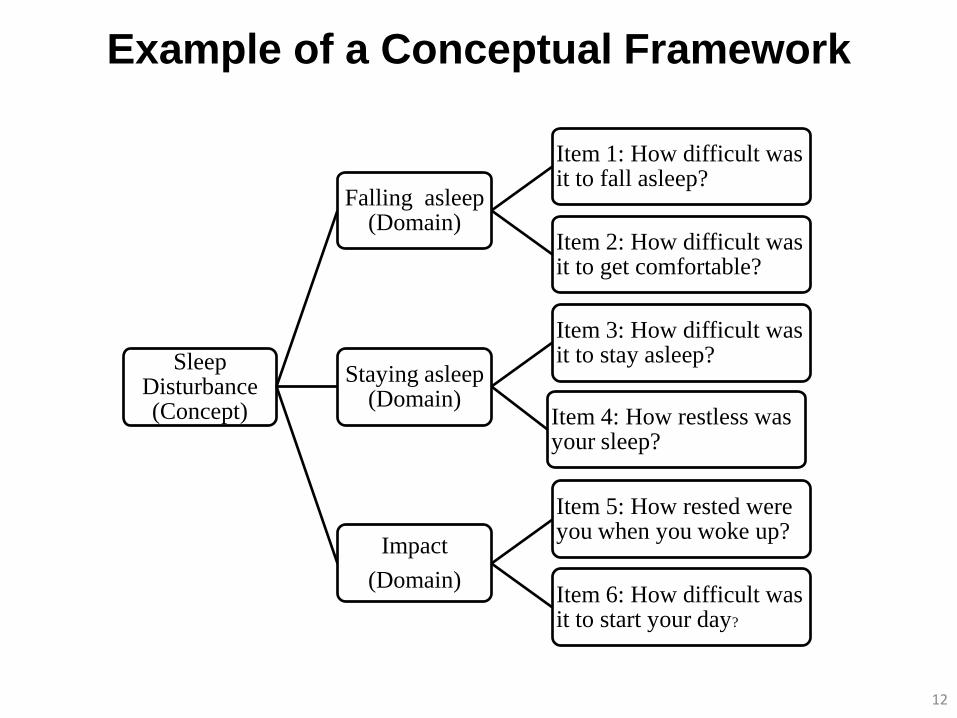
Example of a Conceptual Framework
12
Sleep Disturbance (Concept)
Falling asleep (Domain)
Item 1: How difficult was it to fall asleep?
Item 2: How difficult was it to get comfortable?
Staying asleep (Domain)
Item 3: How difficult was it to stay asleep?
Item 4: How restless was your sleep?
Impact
(Domain)
Item 5: How rested were you when you woke up?
Item 6: How difficult was it to start your day?
Other Considerations
• Recall period should be considered
• Consider most appropriate response options
• Saturation
• Item wording
• Cognitive interviews
13

Chapter 3:
Validity
14

Content Validity
• Content validity is the degree to which the content of a
measurement instrument is an adequate reflection of the
concept (construct) to be measured
– Qualitative work is central
• Reflects the instruments ability to measure the stated concepts
in the relevant population
• How well does the PRO instrument capture all of the important
aspects of the concept from the patient’s perspective?
• Face validity, a component of content validity, is the degree to
which a measurement looks as though it is an adequate
reflection of the construct to be measured 15
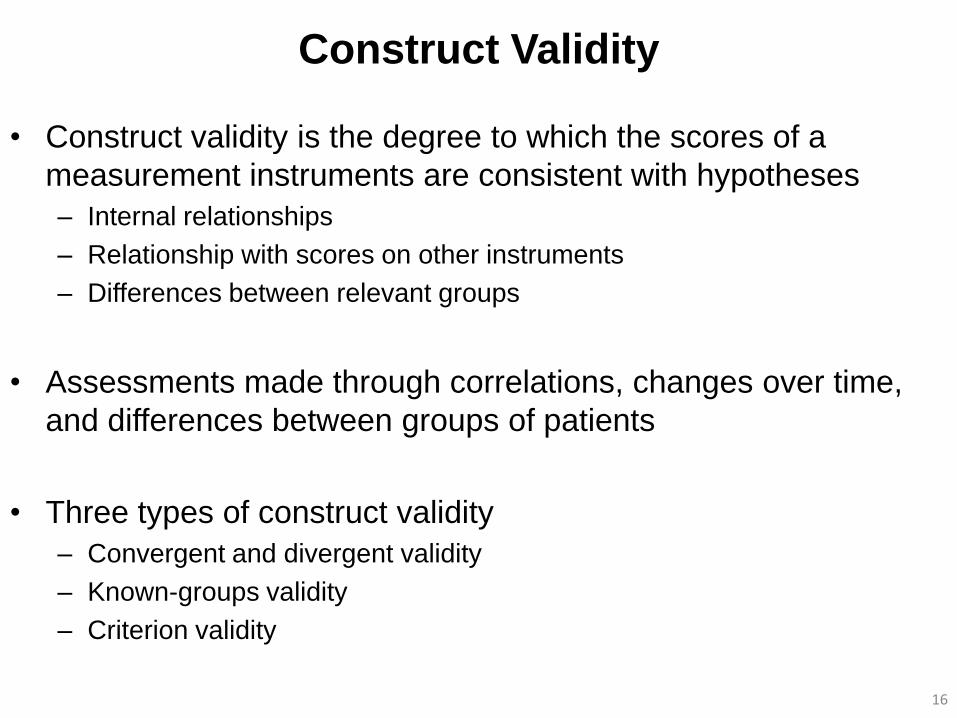
Construct Validity
• Construct validity is the degree to which the scores of a
measurement instruments are consistent with hypotheses
– Internal relationships
– Relationship with scores on other instruments
– Differences between relevant groups
• Assessments made through correlations, changes over time,
and differences between groups of patients
• Three types of construct validity
– Convergent and divergent validity
– Known-groups validity
– Criterion validity
16
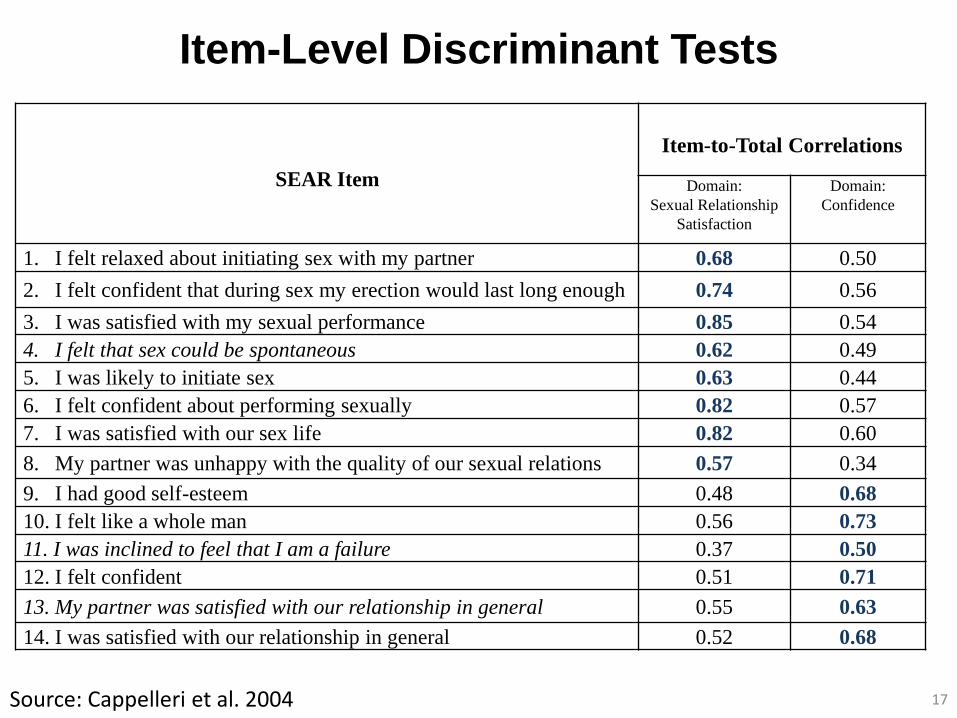
Item-Level Discriminant Tests
17
SEAR Item
Item-to-Total Correlations
Domain:
Sexual Relationship
Satisfaction
Domain:
Confidence
1. I felt relaxed about initiating sex with my partner 0.68 0.50
2. I felt confident that during sex my erection would last long enough 0.74 0.56
3. I was satisfied with my sexual performance 0.85 0.54
4. I felt that sex could be spontaneous 0.62 0.49
5. I was likely to initiate sex 0.63 0.44
6. I felt confident about performing sexually 0.82 0.57
7. I was satisfied with our sex life 0.82 0.60
8. My partner was unhappy with the quality of our sexual relations 0.57 0.34
9. I had good self-esteem 0.48 0.68
10. I felt like a whole man 0.56 0.73
11. I was inclined to feel that I am a failure 0.37 0.50
12. I felt confident 0.51 0.71
13. My partner was satisfied with our relationship in general 0.55 0.63
14. I was satisfied with our relationship in general 0.52 0.68
Source: Cappelleri et al. 2004
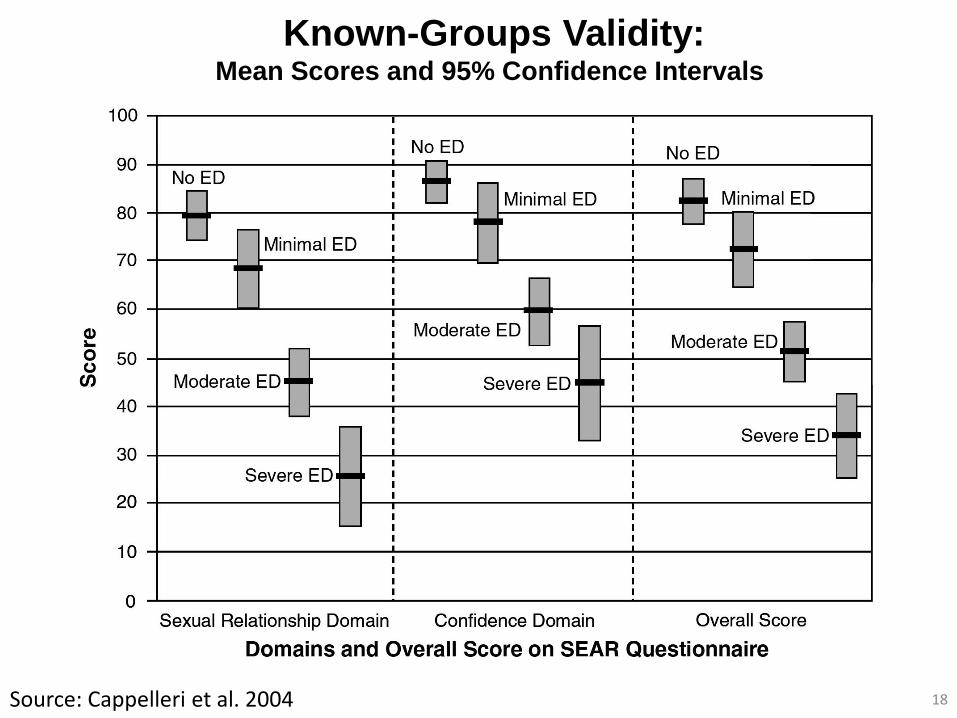
Known-Groups Validity: Mean Scores and 95% Confidence Intervals
18 Source: Cappelleri et al. 2004
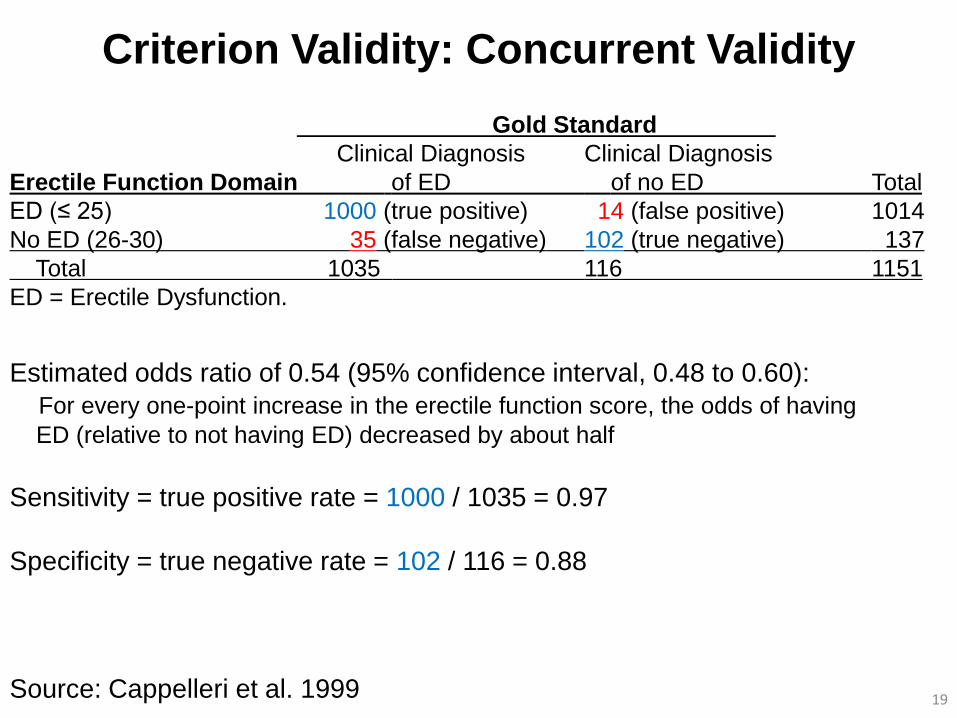
Criterion Validity: Concurrent Validity
19
Gold Standard
Clinical Diagnosis Clinical Diagnosis
Erectile Function Domain of ED of no ED Total
ED (≤ 25) 1000 (true positive) 14 (false positive) 1014
No ED (26-30) 35 (false negative) 102 (true negative) 137
Total 1035 116 1151
ED = Erectile Dysfunction.
Estimated odds ratio of 0.54 (95% confidence interval, 0.48 to 0.60):
For every one-point increase in the erectile function score, the odds of having
ED (relative to not having ED) decreased by about half
Sensitivity = true positive rate = 1000 / 1035 = 0.97
Specificity = true negative rate = 102 / 116 = 0.88
Source: Cappelleri et al. 1999

Concurrent Validity: Receiver Operating Characteristic Curve
20
Area Under Curve = 0.97 97% chance that a randomly selected subject with ED had a lower erectile function score (and hence more likely to be diagnose with ED) than a randomly chosen subject without ED
Source: Cappelleri et al. 1999

Chapter 4:
Reliability
21
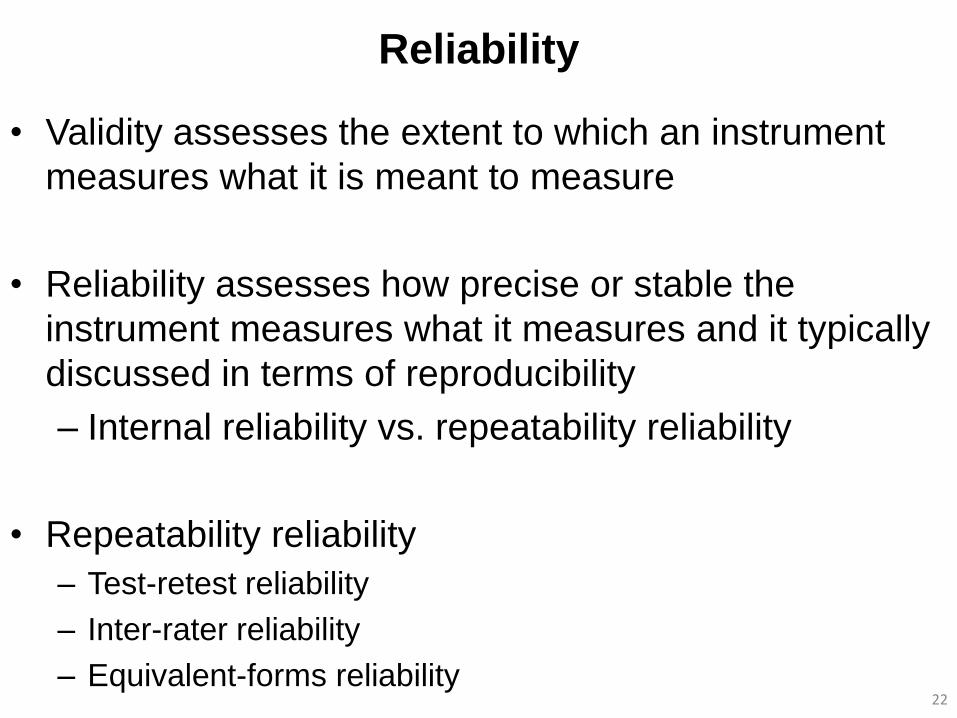
Reliability
• Validity assesses the extent to which an instrument
measures what it is meant to measure
• Reliability assesses how precise or stable the
instrument measures what it measures and it typically
discussed in terms of reproducibility
– Internal reliability vs. repeatability reliability
• Repeatability reliability
– Test-retest reliability
– Inter-rater reliability
– Equivalent-forms reliability
22

Intraclass Correlation Coefficient (ICC):
Continuous Variables • Reliability expresses how well patients with true systematic
differences can be distinguished from each other (after
accounting for measurement error)
• ICC is a reliability parameter that measures the strength of
agreement between repeated measurements on the same set
of patients
23
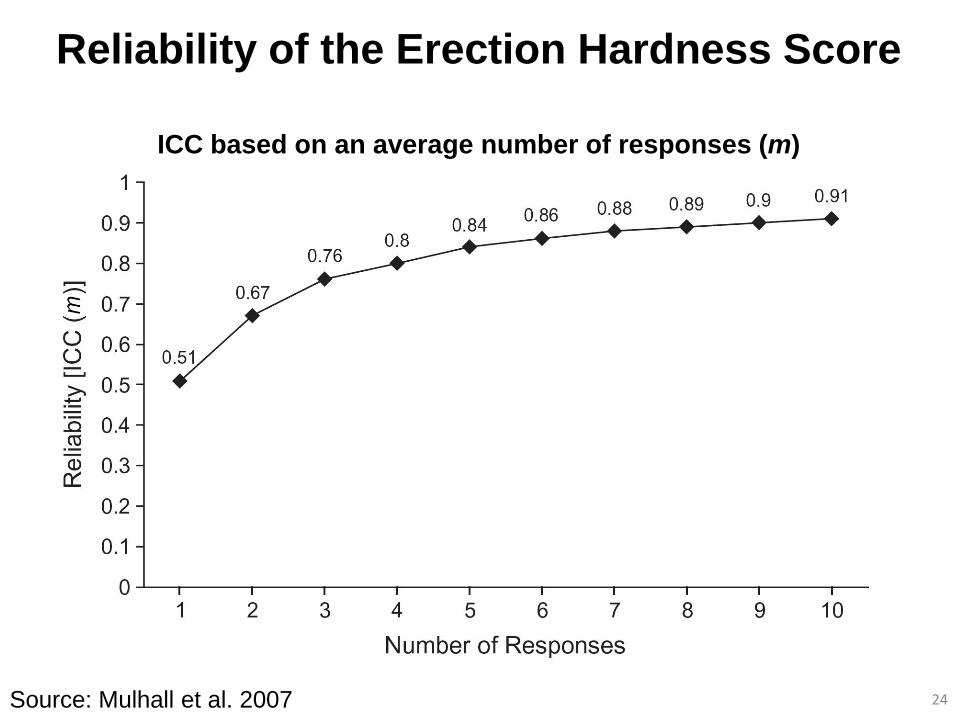
Reliability of the Erection Hardness Score
24 Source: Mulhall et al. 2007
ICC based on an average number of responses (m)
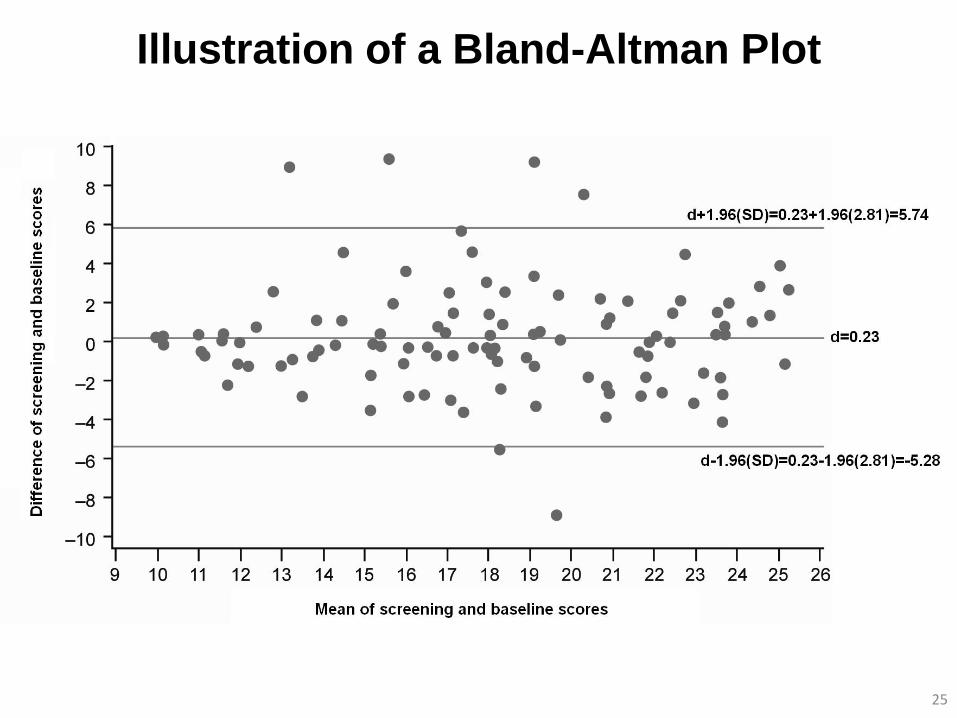
Illustration of a Bland-Altman Plot
25
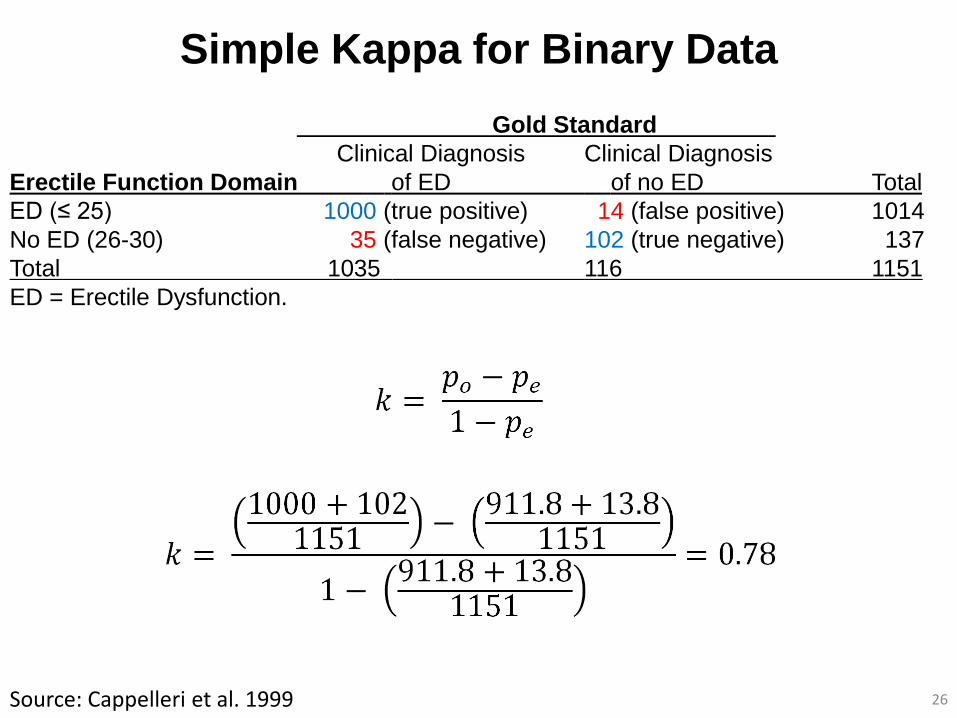
Simple Kappa for Binary Data
26 Source: Cappelleri et al. 1999
Gold Standard
Clinical Diagnosis Clinical Diagnosis
Erectile Function Domain of ED of no ED Total
ED (≤ 25) 1000 (true positive) 14 (false positive) 1014
No ED (26-30) 35 (false negative) 102 (true negative) 137
Total 1035 116 1151
ED = Erectile Dysfunction.
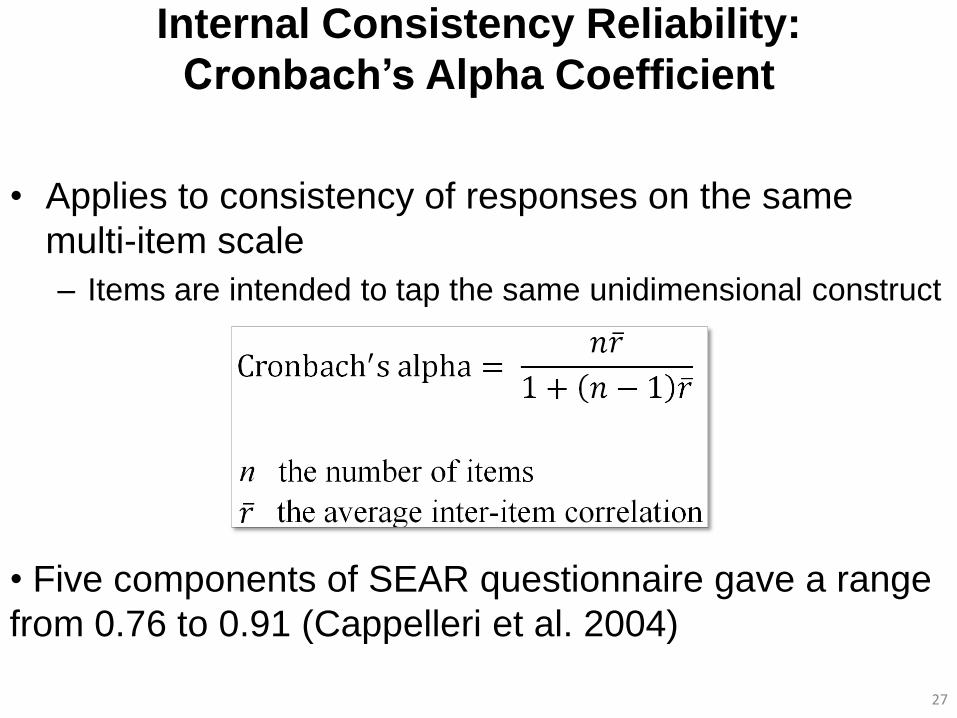
Internal Consistency Reliability:
Cronbach’s Alpha Coefficient
• Applies to consistency of responses on the same
multi-item scale
– Items are intended to tap the same unidimensional construct
27
• Five components of SEAR questionnaire gave a range
from 0.76 to 0.91 (Cappelleri et al. 2004)

Chapter 5:
Exploratory and Confirmatory Factor Analyses
28
Chapter 6:
Item Response Theory
29
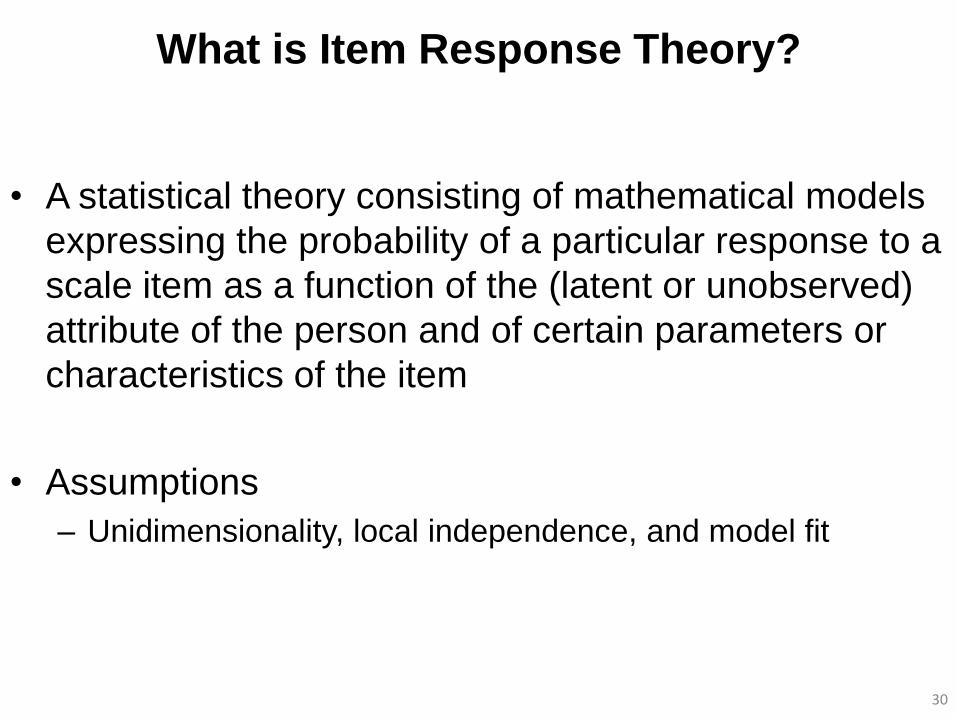
What is Item Response Theory?
• A statistical theory consisting of mathematical models
expressing the probability of a particular response to a
scale item as a function of the (latent or unobserved)
attribute of the person and of certain parameters or
characteristics of the item
• Assumptions
– Unidimensionality, local independence, and model fit
30
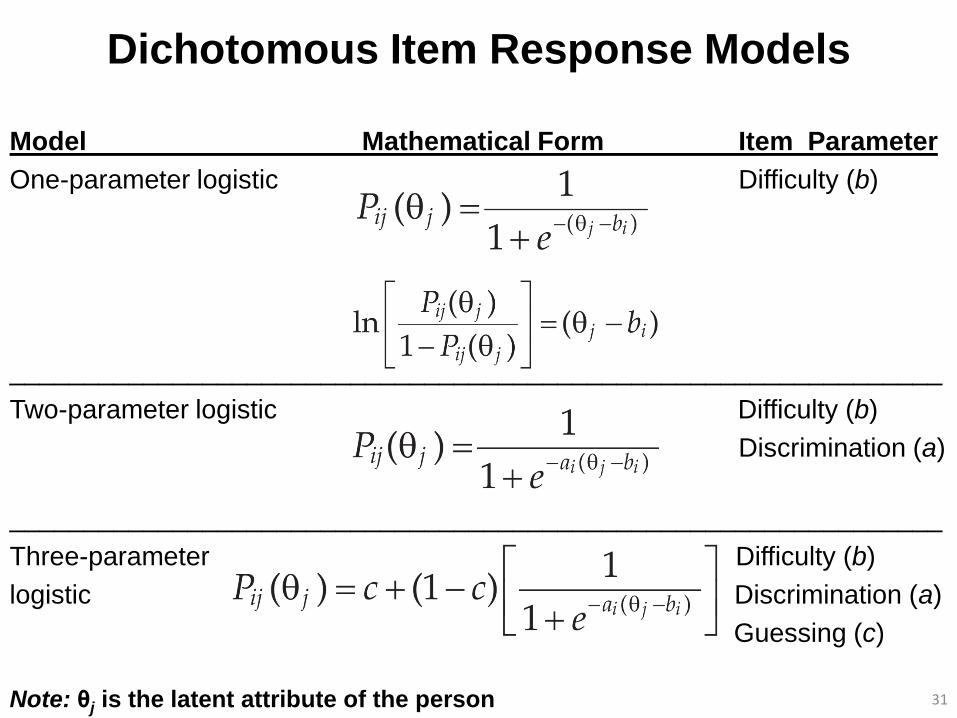
Dichotomous Item Response Models
Model Mathematical Form Item Parameter
One-parameter logistic Difficulty (b)
_______________________________________________________________
Two-parameter logistic Difficulty (b)
Discrimination (a)
_______________________________________________________________
Three-parameter Difficulty (b)
logistic Discrimination (a)
Guessing (c)
31 Note: θj is the latent attribute of the person
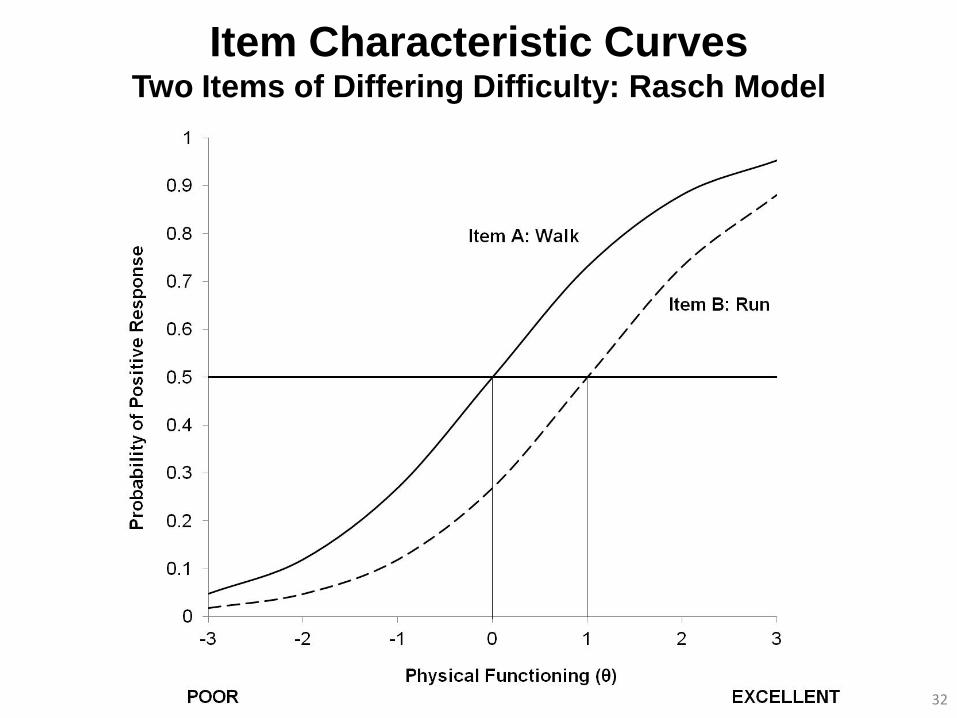
Item Characteristic Curves Two Items of Differing Difficulty: Rasch Model
32
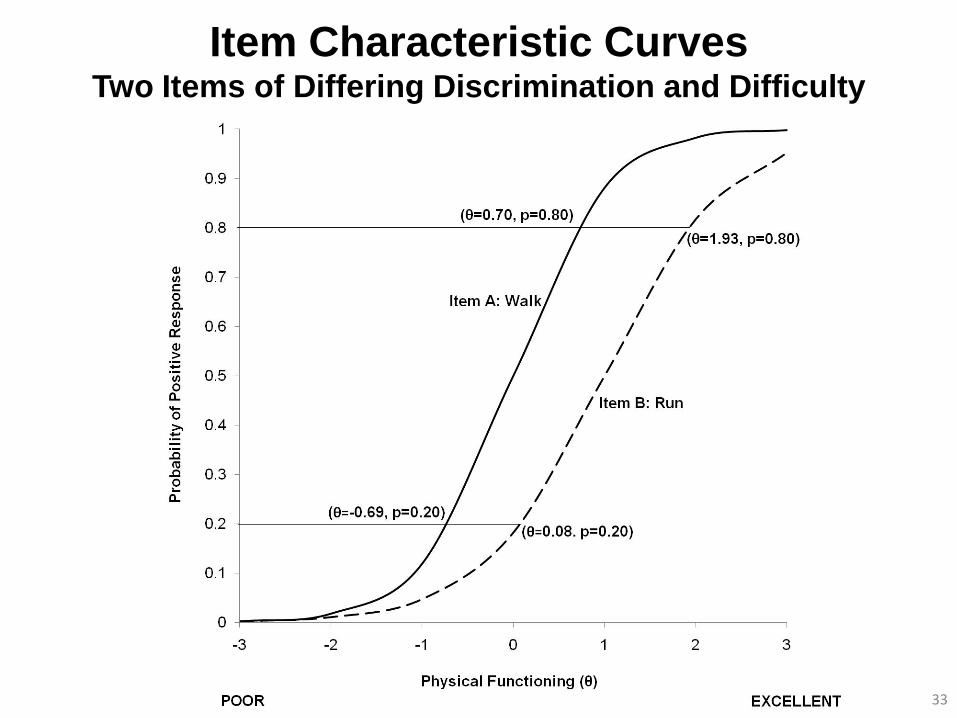
Item Characteristic Curves Two Items of Differing Discrimination and Difficulty
33
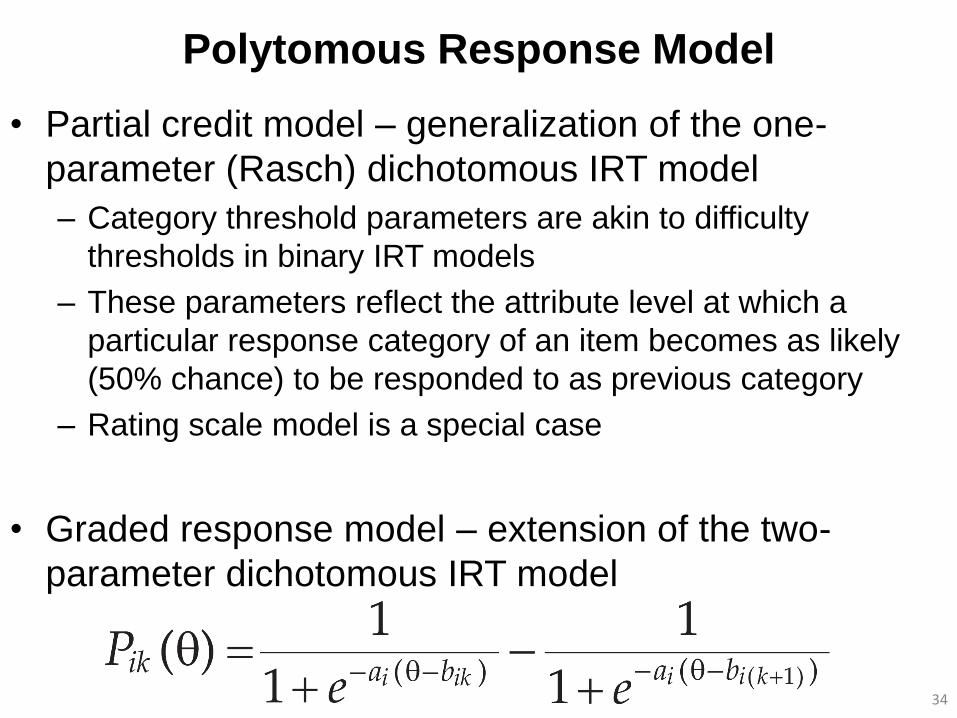
Polytomous Response Model
• Partial credit model – generalization of the one-
parameter (Rasch) dichotomous IRT model
– Category threshold parameters are akin to difficulty
thresholds in binary IRT models
– These parameters reflect the attribute level at which a
particular response category of an item becomes as likely
(50% chance) to be responded to as previous category
– Rating scale model is a special case
• Graded response model – extension of the two-
parameter dichotomous IRT model
34
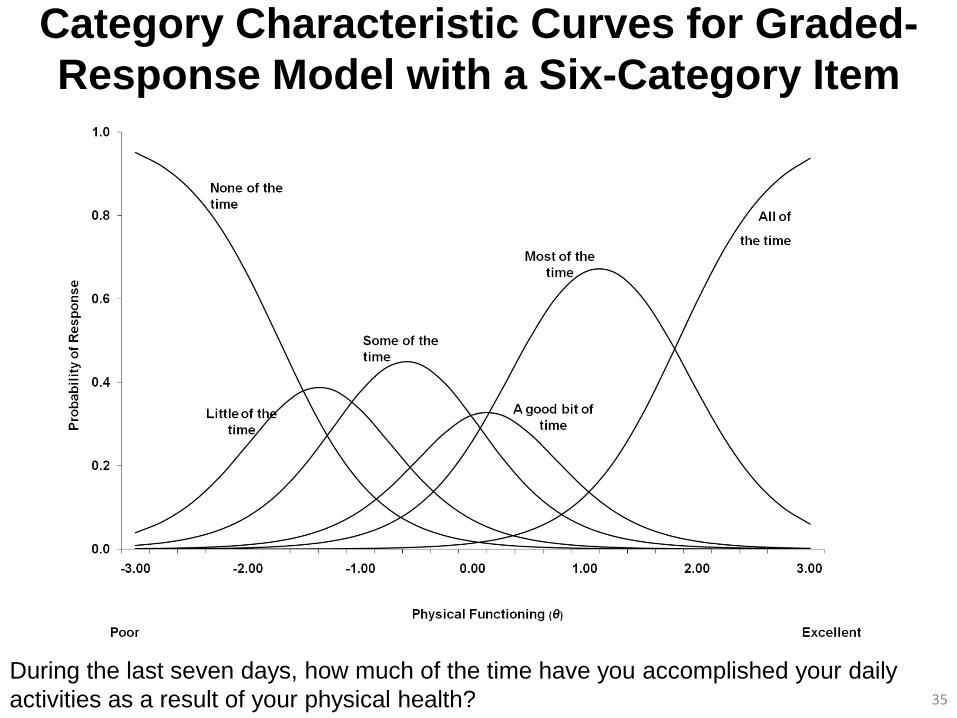
Category Characteristic Curves for Graded-
Response Model with a Six-Category Item
35
During the last seven days, how much of the time have you accomplished your daily
activities as a result of your physical health?
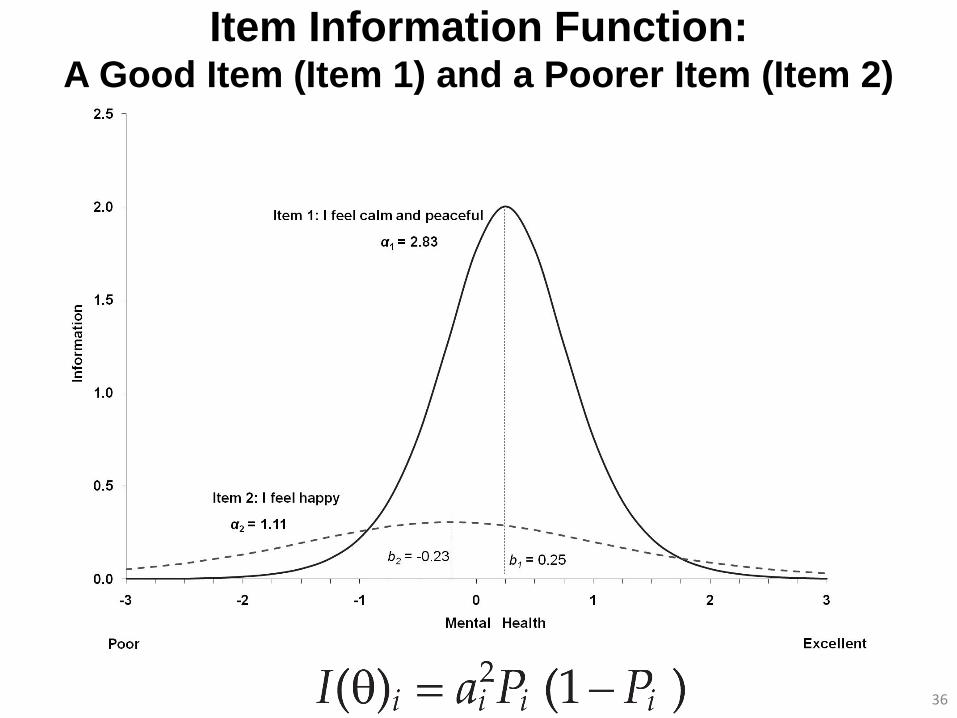
Item Information Function: A Good Item (Item 1) and a Poorer Item (Item 2)
36
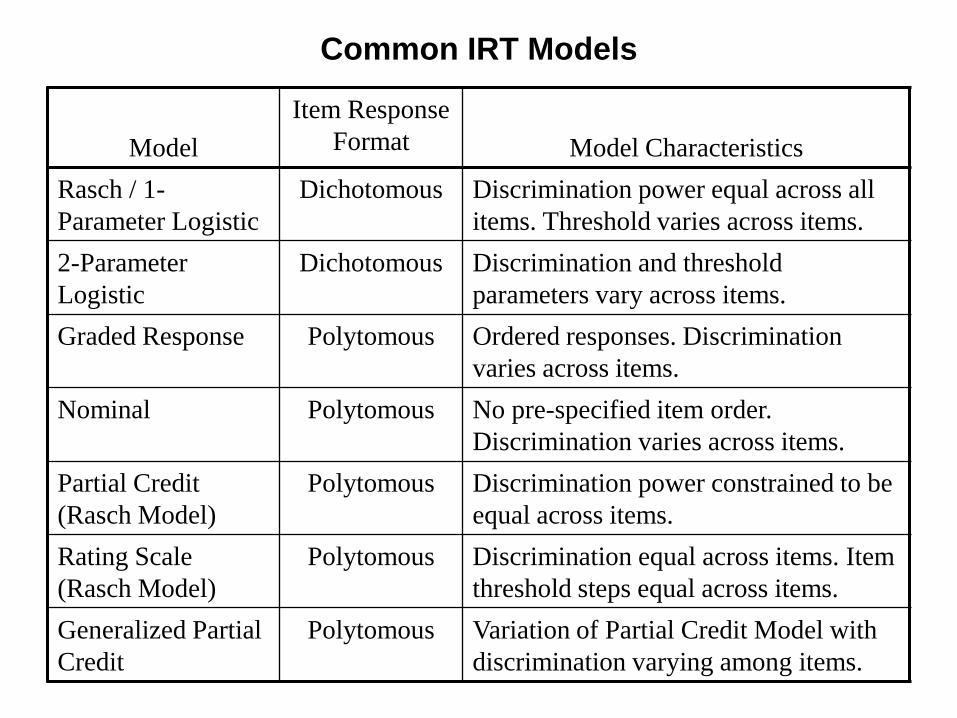
Common IRT Models
Model
Item Response
Format
Model Characteristics
Rasch / 1-
Parameter Logistic
Dichotomous Discrimination power equal across all
items. Threshold varies across items.
2-Parameter
Logistic
Dichotomous Discrimination and threshold
parameters vary across items.
Graded Response Polytomous Ordered responses. Discrimination
varies across items.
Nominal Polytomous No pre-specified item order.
Discrimination varies across items.
Partial Credit
(Rasch Model)
Polytomous Discrimination power constrained to be
equal across items.
Rating Scale
(Rasch Model)
Polytomous Discrimination equal across items. Item
threshold steps equal across items.
Generalized Partial
Credit
Polytomous Variation of Partial Credit Model with
discrimination varying among items.
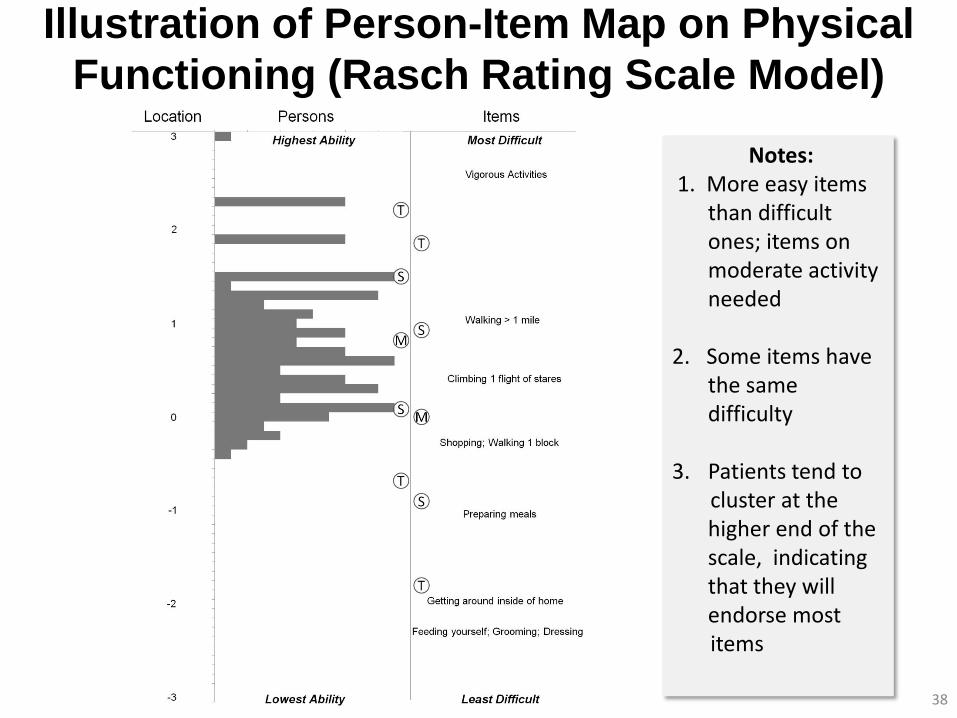
Illustration of Person-Item Map on Physical
Functioning (Rasch Rating Scale Model)
38
Notes: 1. More easy items
than difficult ones; items on moderate activity needed
2. Some items have
the same difficulty
3. Patients tend to cluster at the
higher end of the scale, indicating that they will endorse most
items
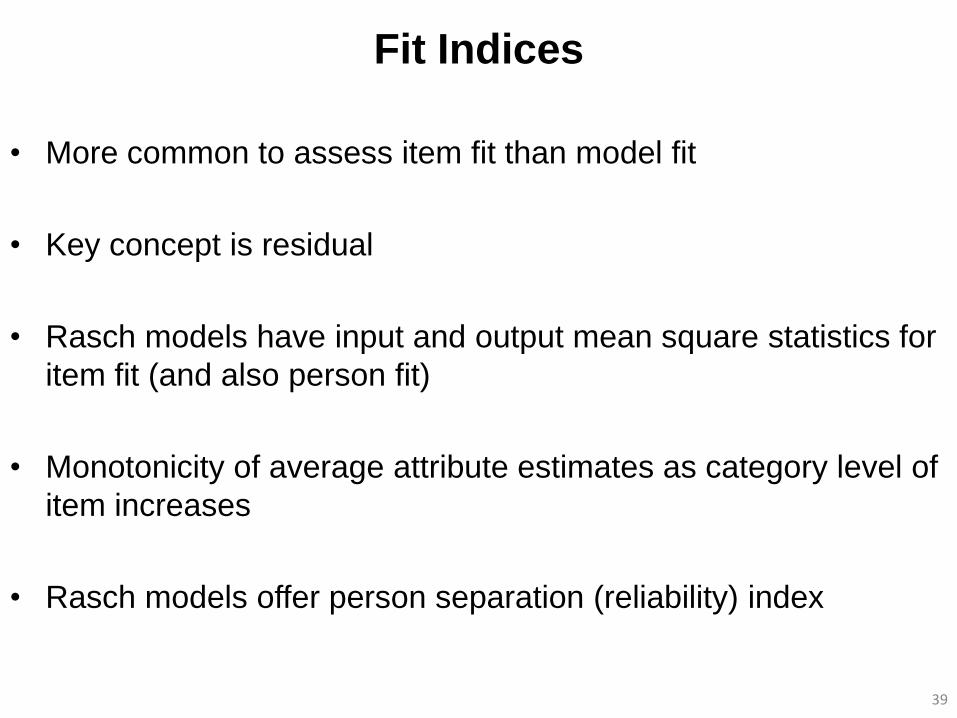
Fit Indices
• More common to assess item fit than model fit
• Key concept is residual
• Rasch models have input and output mean square statistics for
item fit (and also person fit)
• Monotonicity of average attribute estimates as category level of
item increases
• Rasch models offer person separation (reliability) index
39
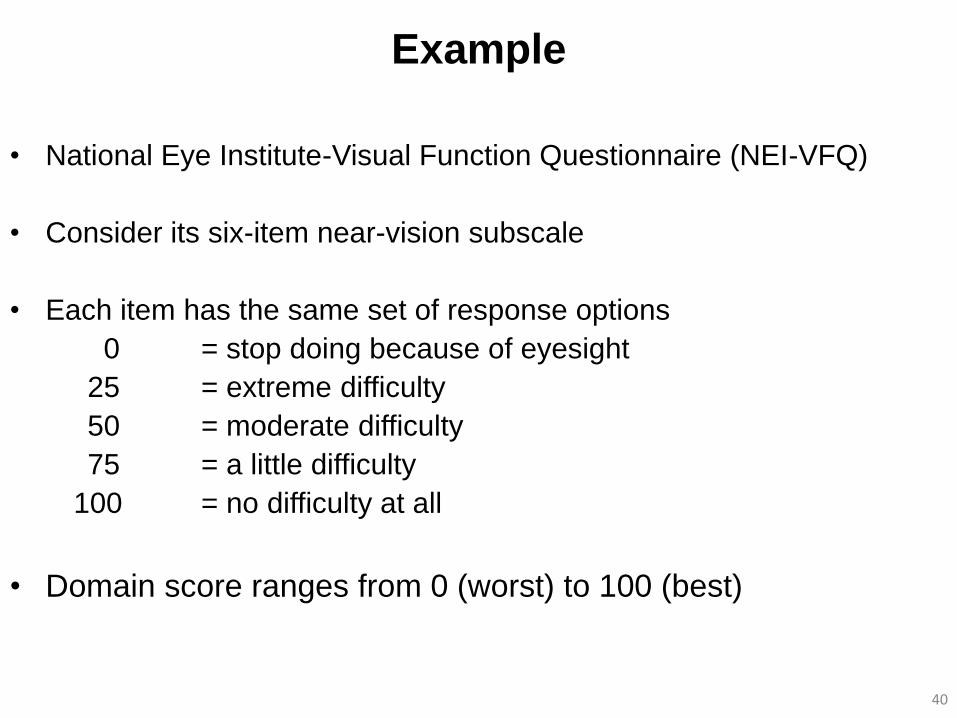
Example
• National Eye Institute-Visual Function Questionnaire (NEI-VFQ)
• Consider its six-item near-vision subscale
• Each item has the same set of response options
0 = stop doing because of eyesight
25 = extreme difficulty
50 = moderate difficulty
75 = a little difficulty
100 = no difficulty at all
• Domain score ranges from 0 (worst) to 100 (best)
40
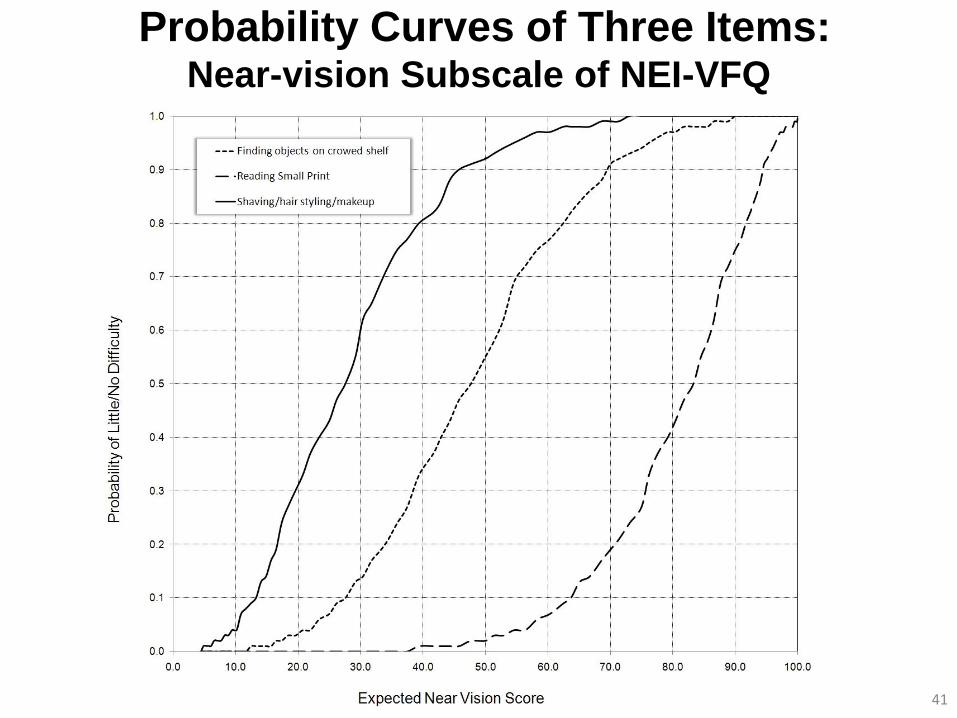
41
Probability Curves of Three Items: Near-vision Subscale of NEI-VFQ

Chapter 7:
Cross-Sectional Analysis
42
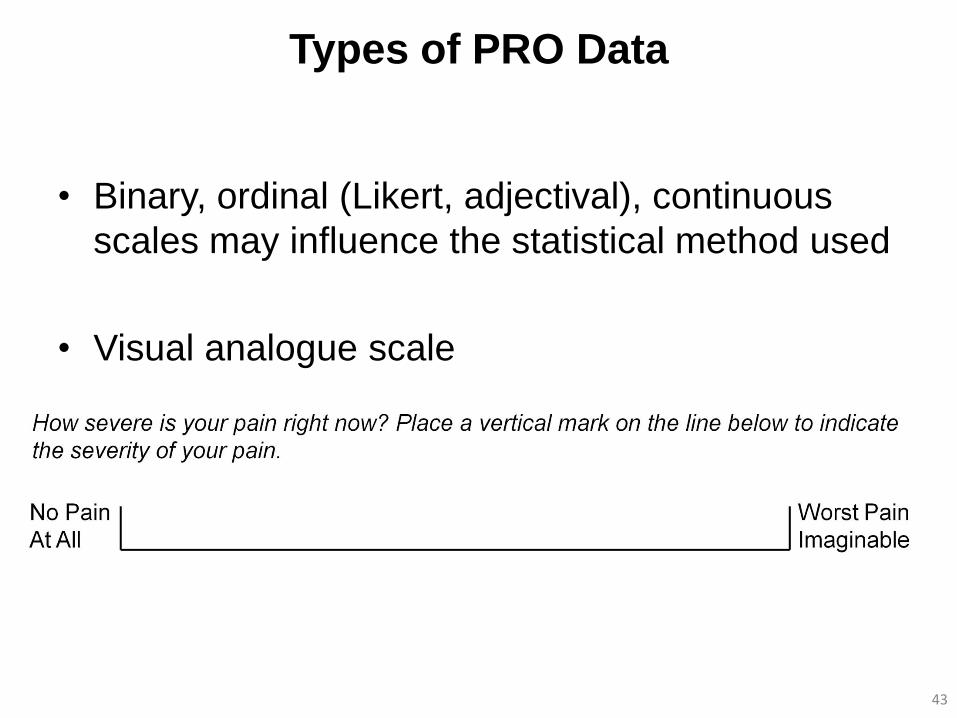
Types of PRO Data
• Binary, ordinal (Likert, adjectival), continuous
scales may influence the statistical method used
• Visual analogue scale
43
Comparing Two or More Samples
• Nonparametric methods
– Does not require data be normally distributed
– Test for differences in distributions between groups
• Parametric methods
– More powerful than nonparametric tests when data are
approximately normally distributed
– Often more interpretable than nonparametric test
– Central limit theorem
• Under most circumstance data from ordinal rating scales
can be analyzed as if they were interval-level
measurement without introducing severe bias
44
Chapter 8:
Longitudinal Analysis
45
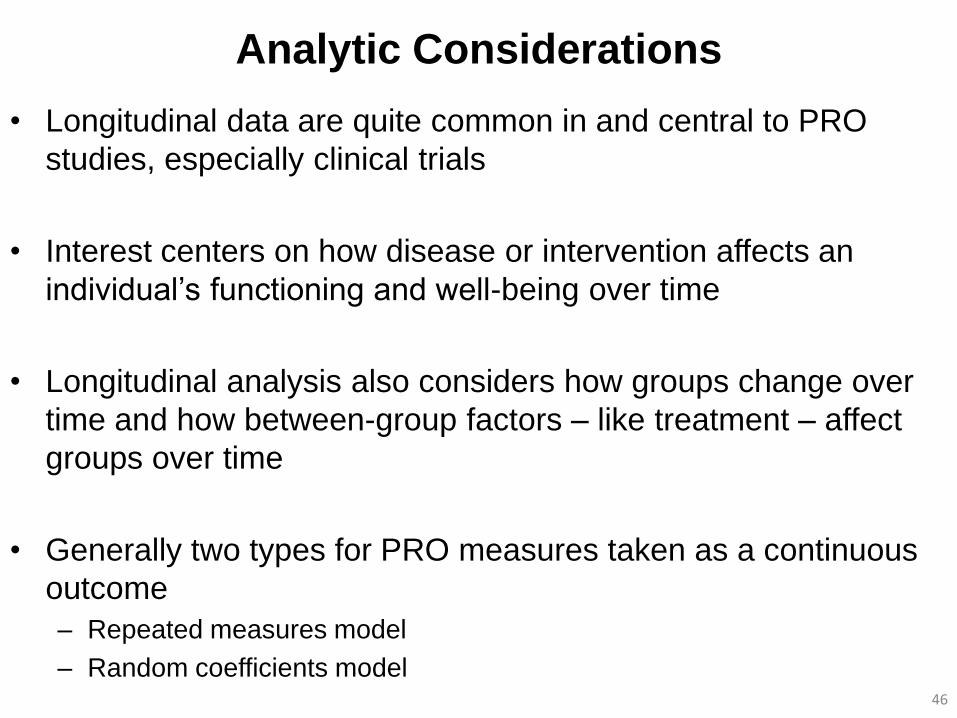
Analytic Considerations
• Longitudinal data are quite common in and central to PRO
studies, especially clinical trials
• Interest centers on how disease or intervention affects an
individual’s functioning and well-being over time
• Longitudinal analysis also considers how groups change over
time and how between-group factors – like treatment – affect
groups over time
• Generally two types for PRO measures taken as a continuous
outcome
– Repeated measures model
– Random coefficients model 46
47
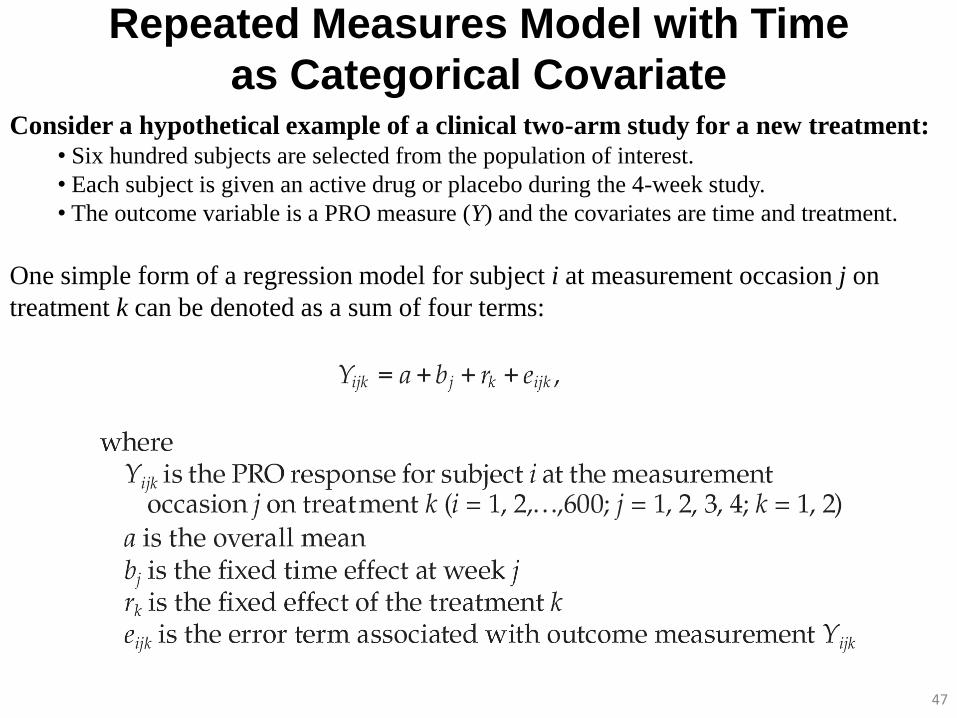
Repeated Measures Model with Time
as Categorical Covariate Consider a hypothetical example of a clinical two-arm study for a new treatment:
• Six hundred subjects are selected from the population of interest.
• Each subject is given an active drug or placebo during the 4-week study.
• The outcome variable is a PRO measure (Y) and the covariates are time and treatment.
One simple form of a regression model for subject i at measurement occasion j on
treatment k can be denoted as a sum of four terms:

Repeated Measures Model with Time
as Categorical Covariate
48
Yijk = a + bj + rk + eijk
Model Y = Visit Treatment Repeated Visit / Subject=ID Type=UN
Proc Mixed data=mixed_ds_1;
Class Visit Treatment ID ;
Model Y = Visit Treatment / Solution ddfm=kr;
Repeated Visit / Subject=ID Type=UN ;
Run;
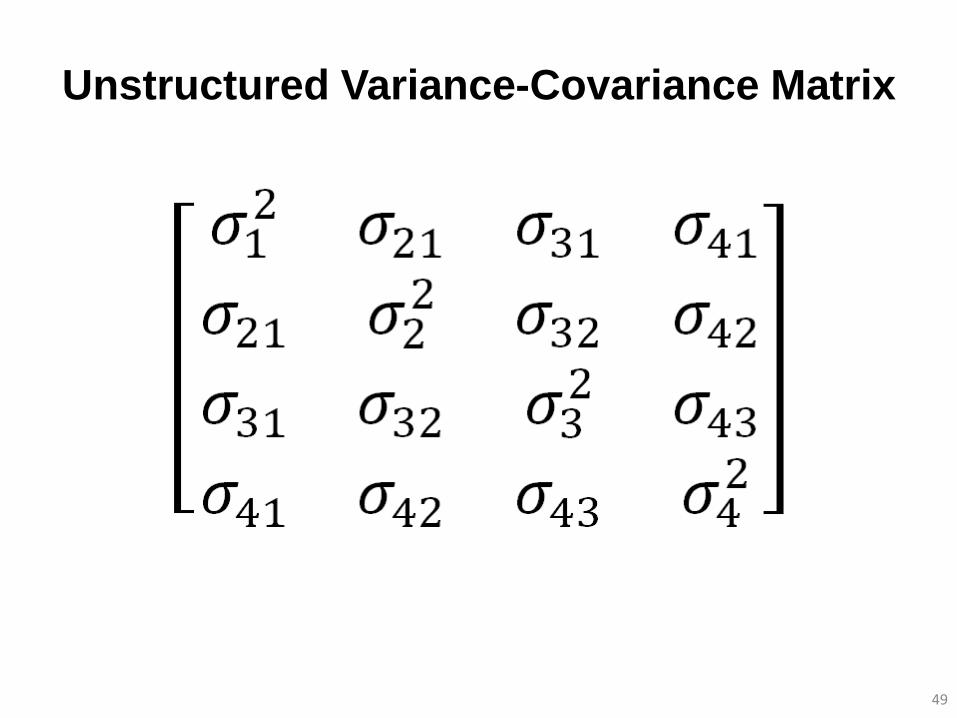
Unstructured Variance-Covariance Matrix
49
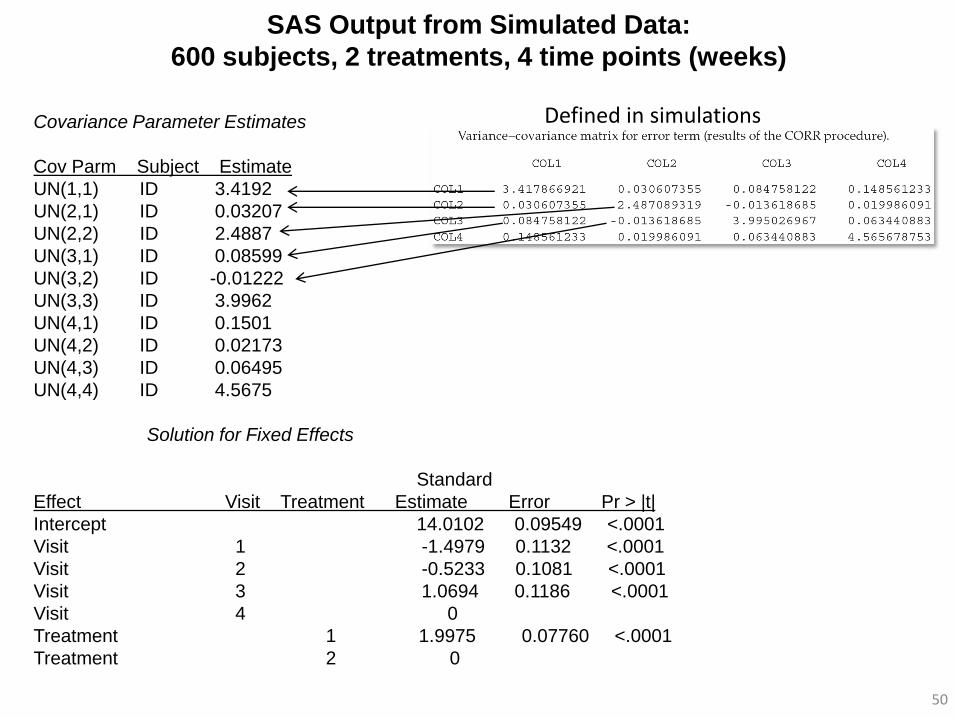
SAS Output from Simulated Data:
600 subjects, 2 treatments, 4 time points (weeks)
50
Covariance Parameter Estimates
Cov Parm Subject Estimate
UN(1,1) ID 3.4192
UN(2,1) ID 0.03207
UN(2,2) ID 2.4887
UN(3,1) ID 0.08599
UN(3,2) ID -0.01222
UN(3,3) ID 3.9962
UN(4,1) ID 0.1501
UN(4,2) ID 0.02173
UN(4,3) ID 0.06495
UN(4,4) ID 4.5675
Solution for Fixed Effects
Standard
Effect Visit Treatment Estimate Error Pr > |t|
Intercept 14.0102 0.09549 <.0001
Visit 1 -1.4979 0.1132 <.0001
Visit 2 -0.5233 0.1081 <.0001
Visit 3 1.0694 0.1186 <.0001
Visit 4 0
Treatment 1 1.9975 0.07760 <.0001
Treatment 2 0
Defined in simulations
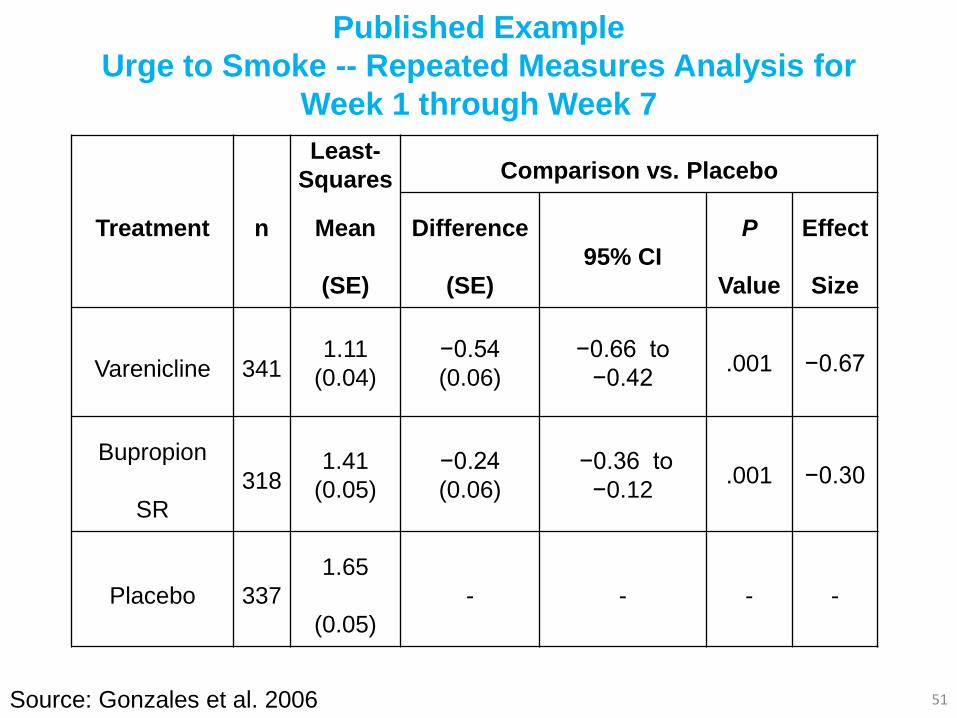
Published Example
Urge to Smoke -- Repeated Measures Analysis for
Week 1 through Week 7
51
Treatment n
Least-
Squares
Mean
(SE)
Comparison vs. Placebo
Difference
(SE)
95% CI
P
Value
Effect
Size
Varenicline 341 1.11
(0.04)
−0.54
(0.06)
−0.66 to
−0.42 .001 −0.67
Bupropion
SR
318 1.41
(0.05)
−0.24
(0.06)
−0.36 to
−0.12 .001 −0.30
Placebo 337
1.65
(0.05)
- - - -
Source: Gonzales et al. 2006

Random Coefficients Models:
Random Intercept-Slope Model
52
Proc Mixed data=_tmp_2;
Class ID;
Model Y = Week / Solution ddfm=kr;
Random INTERCEPT Week / Subject=ID Type=UN Solution;
Run;

Random Intercept-Slope Model
53
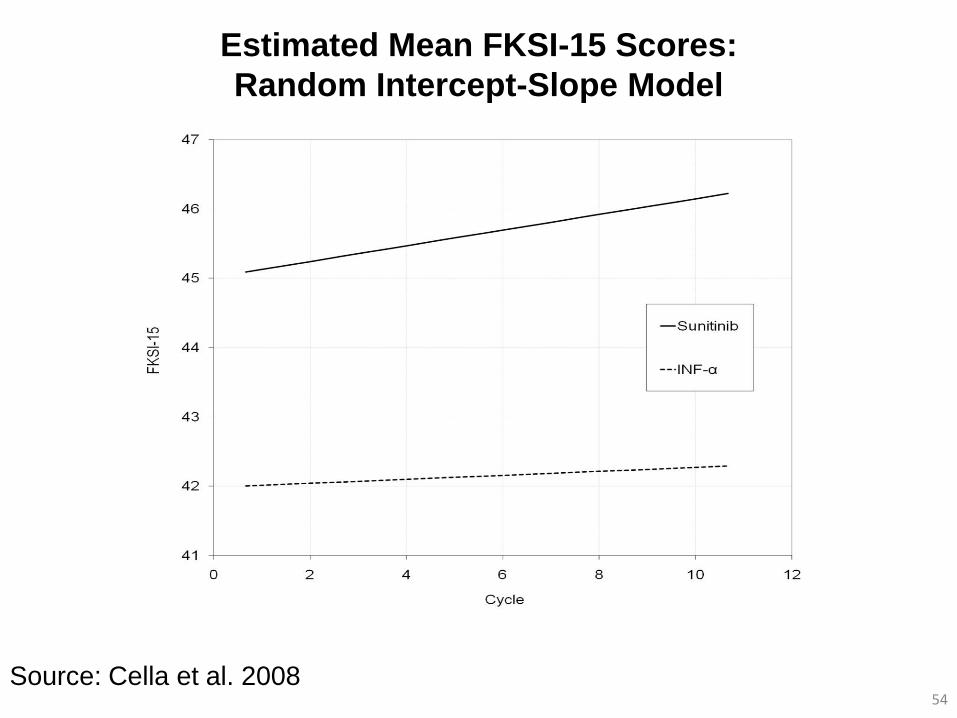
Estimated Mean FKSI-15 Scores:
Random Intercept-Slope Model
54 Source: Cella et al. 2008
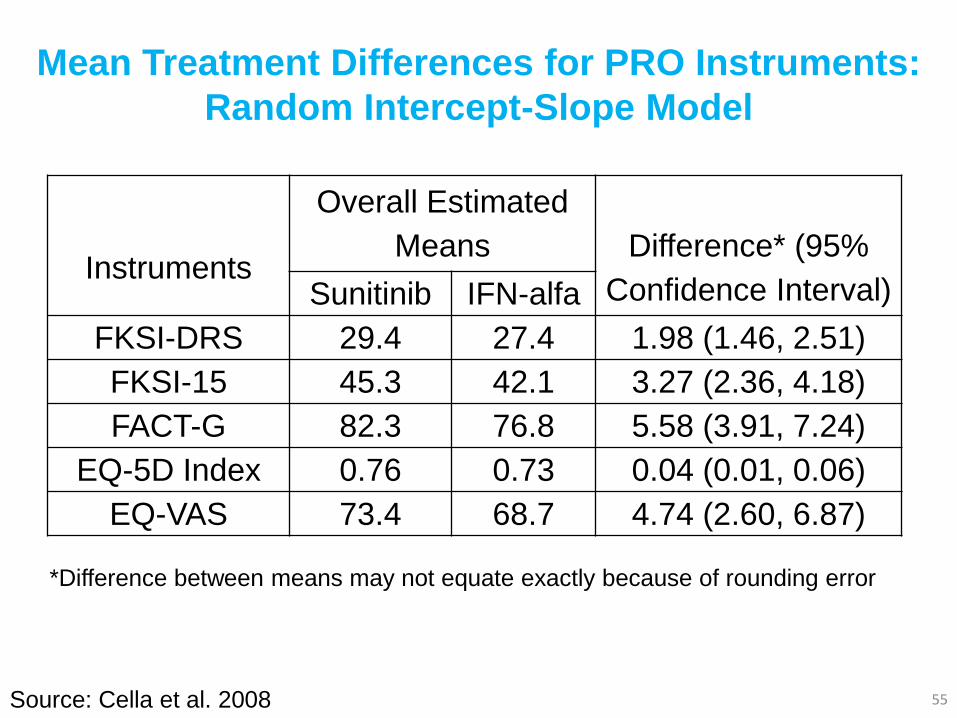
Mean Treatment Differences for PRO Instruments:
Random Intercept-Slope Model
55
Instruments
Overall Estimated
Means
Difference* (95%
Confidence Interval) Sunitinib IFN-alfa
FKSI-DRS 29.4 27.4 1.98 (1.46, 2.51)
FKSI-15 45.3 42.1 3.27 (2.36, 4.18)
FACT-G 82.3 76.8 5.58 (3.91, 7.24)
EQ-5D Index 0.76 0.73 0.04 (0.01, 0.06)
EQ-VAS 73.4 68.7 4.74 (2.60, 6.87)
Source: Cella et al. 2008
*Difference between means may not equate exactly because of rounding error

Chapter 9:
Mediation Models
56
Chapter 10:
Missing Data
57
Introduction
• Missing data poses challenges in the analysis and
interpretation of data
– Potential loss of statistical power or sensitivity to detect
clinically meaningful treatment differences
– Potential bias for estimates of treatment effect
• Two types of missing data
– Item non-response
– Questionnaire non-response
58
Study Design to Minimize Data
• Primary prevention
– Treat PRO measures like other endpoints
– Identify and train key personnel to oversee the process
– Adopt standard administration of PROs across sites
– Minimize patient burden
• Secondary prevention
– Prospectively documenting specific reasons for missing data
• Example : “Patient refusal due to poor health”
• Example: “Patient refusal unrelated to health”
– Collect auxiliary factors that contribute or explain
“missingness”
• Example: toxicity, evaluation of patient health status by others
59
Missing Data Patterns and Mechanism
• Missing Completely At Random (MCAR)
• Missing At Random (MAR)
• Missing Not At Random (MNAR)
60
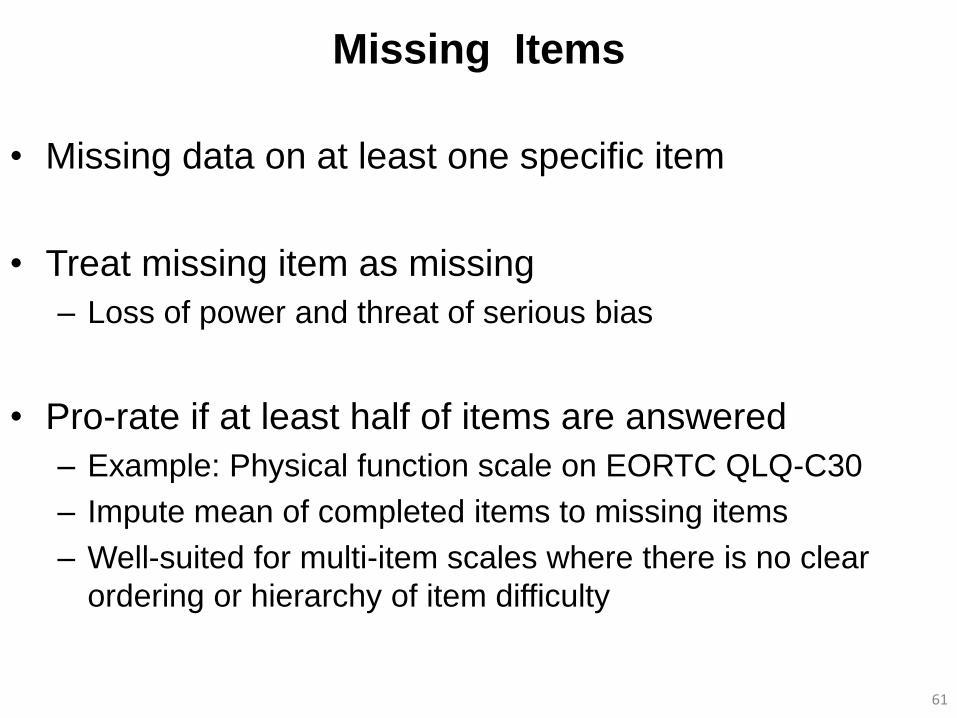
Missing Items
• Missing data on at least one specific item
• Treat missing item as missing
– Loss of power and threat of serious bias
• Pro-rate if at least half of items are answered
– Example: Physical function scale on EORTC QLQ-C30
– Impute mean of completed items to missing items
– Well-suited for multi-item scales where there is no clear
ordering or hierarchy of item difficulty
61
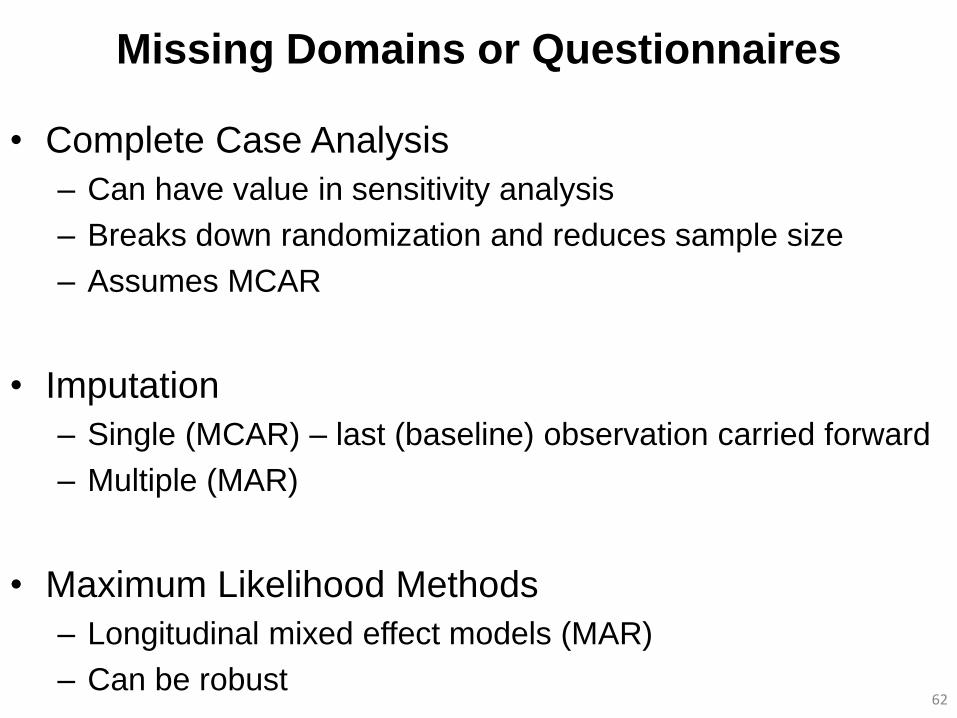
Missing Domains or Questionnaires
• Complete Case Analysis
– Can have value in sensitivity analysis
– Breaks down randomization and reduces sample size
– Assumes MCAR
• Imputation
– Single (MCAR) – last (baseline) observation carried forward
– Multiple (MAR)
• Maximum Likelihood Methods
– Longitudinal mixed effect models (MAR)
– Can be robust
62
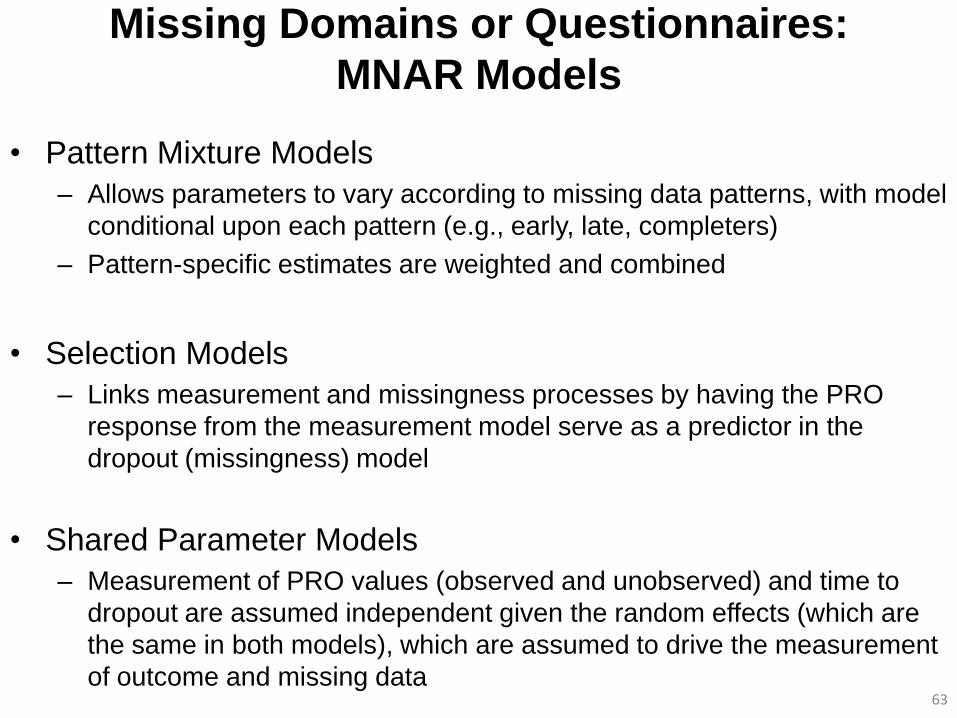
• Pattern Mixture Models
– Allows parameters to vary according to missing data patterns, with model
conditional upon each pattern (e.g., early, late, completers)
– Pattern-specific estimates are weighted and combined
• Selection Models
– Links measurement and missingness processes by having the PRO
response from the measurement model serve as a predictor in the
dropout (missingness) model
• Shared Parameter Models
– Measurement of PRO values (observed and unobserved) and time to
dropout are assumed independent given the random effects (which are
the same in both models), which are assumed to drive the measurement
of outcome and missing data
63
Missing Domains or Questionnaires:
MNAR Models

Chapter 11:
Enriching Interpretation
64

Journal References:
Illustrations Cited
• Cappelleri JC, Althof SE, Siegel RL, Shpilsky A, Bell SS, Duttagupta S. 2004.
Development and validation of the Self-Esteem And Relationship (SEAR)
questionnaire in erectile dysfunction. International Journal of Impotence Research
16:30-38.
• Cappelleri JC, Rosen RC, Smith MD, Quirk F, Maytom MC, Mishra A, Osterloh IH.
1999. Some developments on the International Index of Erectile Function (IIEF). Drug
Information Journal 33:179-190.
• Cella D, Li JZ, Cappelleri JC, Bushmakin A, Charbonneau C, Kim ST, Chen I,
Michaelson MD, Motzer RJ. 2008. Quality of life in patients with metastatic renal cell
carcinoma treated with sunitinib versus interferon-alfa: Results from a phase III
randomized trial. Journal of Clinical Oncology 26:3763-3769.
• Gonzales D, Rennard SI, Nides M, Oncken C, Azoulay S, Billing CB, Watsky EJ,
Gong J, Williams KE, Reeves KR. 2006. Varenicline, an alpha4beta2 nicotinic
acetylcholine receptor partial agonist, vs sustained-release bupropion and placebo for
smoking cessation: a randomized controlled trial. JAMA 296:47-55.
• Mulhall JO, Goldstein I, Bushmakin A, Cappelleri JC, Hvidsten K. Validation of the
Erectile Hardness Score. 2007. Journal of Sexual Medicine 4:1626-1634.
65