Embed Size (px)
Citation preview

© Henry Stewart Publications 2397-1053 (2017) Vol. 2, 2 153–164 Management in Healthcare 153
Patient access metrics in the ambulatory enterpriseReceived (in revised form): 5th March, 2017
Elizabeth Woodcockis the Founder of the Patient Access Symposium and a professional speaker, trainer and author specialising in medical practice management. Principal of Woodcock & Associates, she has focused on medical practice operations and revenue cycle management for nearly 25 years. She has authored 16 best-selling practice management books, as well as dozens of articles in national health care management journals. She is a Fellow in the American College of Medical Practice Executives and a Certified Professional Coder. In addition to a Bachelor of Arts degree from Duke University, she completed a Master of Business Administration in health care management from The Wharton School of Business of the University of Pennsylvania.
Patient Access Symposium, 428 Emory Drive NE, Atlanta, GA 30307, USA
Tel: +1-404-373-6195;
E-mail: [email protected]
Sarah Kierhas over 12 years of experience working in health care and is currently serving as the Director of Operations for Patient Access and Referral Management with The Emory Clinic. She is responsible for leading the Patient Access Capacity Management and Access Optimization teams to drive improvements across the Emory Healthcare enterprise. Before her tenure at Emory, she worked at Northwestern Memorial Hospital focusing on access and surgery scheduling, Northwestern Medical Faculty Foundation focusing on group practice administration for several sections and the University of Chicago focusing on ambulatory process improvement. She holds a Bachelor’s degree in Management and Organizational Design from Loyola University of Chicago and a six sigma green belt certification from Northwestern Medicine.
Patient Access and Referral Management, The Emory Clinic, 101 W Ponce De Leon Ave, Suite 500, Decatur,
GA 30030, USA
Tel: +1-404-778-7861;
E-mail: [email protected]
Vivian Zhaocurrently serves as the Director of Access Operations and Process Improvement for the Johns Hopkins Patient Access Services (PAS). She has over 10 years of experience in practice management. In her role, she is responsible for optimising call centre operations, improving appointment scheduling accuracy and quality, and maximising provider capacity and availability. Before joining PAS, she served as the Assistant Administrator of Ambulatory Operations for the Department of Medicine at Johns Hopkins, where she provided oversight and direction for the outpatient clinics and access team. She holds a Master’s in Health Sciences from Johns Hopkins Bloomberg School of Public Health and a Bachelor’s in Health Policy and Management from the University of North Carolina at Chapel Hill.
Johns Hopkins Patient Access Services, Johns Hopkins Medicine,3910 Keswick Rd, Suite 3029, Baltimore,
MD 21211, USA
Tel: +1-443-997-5082;
E-mail: [email protected]
Abstract This paper explores published articles that report on results from research conducted on patient access in the ambulatory enterprise, and the relationship with tracking performance and developing appropriate metrics from which to measure and monitor. Examining the calculation and use of indicators to track access improvements,
08_Woodcock_MIH_2.2.indd 153 10/19/17 4:25 PM
Woodcock, Kier and Zhao
154 Management in Healthcare Vol. 2, 2 153–164 © Henry Stewart Publications 2397-1053 (2017)
the authors suggest that industry metrics should be expanded and standardised in order to fully understand the current state of patient access management, as well as performance improvement opportunities. The primary objective of this paper is to propose an essential set of process and outcome metrics to provide insight for leaders of health care organisations to optimise performance related to patient access in the ambulatory enterprise. Tracking performance related to patients’ access to care is essential for every health system. This article explores the best methods for measuring and tracking performance on patient access in the ambulatory enterprise. Patients’ velocity to care begins in the ambulatory enterprise. Measuring access to care in the ambulatory enterprise is essential to the successful delivery of care in a health system, as the ambulatory setting is cost-effective and patient-centred.
KEYWORDS: patient access, patient access management, patient access metrics, key performance metrics, ambulatory setting, scheduling systems, industry metric, performance improvement
PATIENT ACCESS METRICS IN THE AMBULATORY ENTERPRISEFor any initiative, the development of performance metrics capable of measuring and monitoring relevant activity represents a crucial step to overall success. As health care organisations recognise the value of accommodating patients in their ambulatory enterprise, stakeholders ponder the issue of tracking the performance of their efforts. Moreover, it is widely recognised that key performance indicators (KPIs) influence the culture of organisations embarking upon a journey to improvement.
SUPPLY AND DEMANDAlthough patient access in the ambulatory setting remains a topic of great complexity, the issue boils down to the achievement of balance with regard to supply and demand. For the ambulatory enterprise, ‘supply’ is defined as the time provided by physicians, advanced-practice providers and other billable providers; ‘demand’ is delineated by patients’ requests for care (and the needs of physicians referring on their behalf). The IOM Committee on Optimizing
Scheduling in Health Care reveals: ‘Care delivery sites should continuously assess and adjust the match between the demand for services and the organisational tools, personnel, and overall capacity available to meet the demand.’1 In the ambulatory setting, these requests are vital to manage, as they represent not only a crucial encounter affecting the well-being of patients, but also the initiation point of the patient’s velocity to care — and, arguably, the most cost-effective manner of managing that care over time.2
The time allocated by providers materialises as open slots in the appointment schedule, and these are arranged in self-defined templates. As a result, numerous access efforts focus upon optimisation of the schedule and strategies related to template management. Because supply is finite and unable to be stored, it must be deployed wisely. Intentional design and leverage of finite supply stands as the cornerstone of patient access, and metrics guiding stakeholders must account for this essential principle. Given current protocols related to scheduling and registration, demand becomes more difficult to measure — and, short of assessment of historical data related to patient
08_Woodcock_MIH_2.2.indd 154 10/19/17 4:25 PM
Patient access metrics in the ambulatory enterprise
© Henry Stewart Publications 2397-1053 (2017) Vol. 2, 2 153–164 Management in Healthcare 155
volume, has historically eluded health care organisations.
Indeed, complexities related to scheduling, combined with a lack of informed data in the area of patient demand, have resulted in significant challenges involving patient access management. Problems have been compounded in geographic markets where certain specialties are constrained — or, in the case of growing communities, where patient demand outstrips the capacity on hand. Whether it is a temporary or long-term conundrum, in markets where supply cannot meet demand, the concept of balance becomes less relevant than careful, intentional management of supply across a set population. For organisations, the most helpful first step is to clearly understand the limits of supply, then answer: Which patients are we going to serve with our finite supply? How long do we want them to wait? How will we ensure that timely follow-up is possible and easy? How will we manage the perishable, at-risk access that results from cancellations? What will we do with patients we cannot accommodate? The responses to these questions will help to identify the metrics most important to measure — and where focus should intensify from an improvement perspective.
The lack of consensus regarding access metrics has resulted in a lack of comparable indicators to help guide strategies for improvement. In order to ensure performance improvement strategies continue to evolve, it is critical that the industry determine a consistent approach to defining, measuring and comparing key performance indicators around appointment availability and health of overall patient access.
HISTORICAL INDUSTRY METRICSThe disjointed and disparate nature of the ambulatory enterprise has resulted in challenges regarding the measurement and comparison of data related to patient access.
For many years, industry stakeholders have been searching for indicators from which to propel improvements.
Third Next Available Appointment. Historically, the KPI for patient access in the ambulatory setting has been the third-next-available appointment, typically expressed in days. The concept of the third-next-available appointment (TNAA) originated in the context of the primary-care environment as a result of the work of Dr Mark Murray.3 Dr Murray and his colleague, Catherine Tantau, RN, lectured extensively about the concept of ‘advanced’ or ‘open’ access. Their original approach, presented with enthusiasm and passion, garnered the attention of stakeholders around the world, leading to widespread adoption of access improvements.
Murray and Tantau urged stakeholders to recognise that demand was finite and predictable — and, therefore, far better managed today than delaying, deferring or deflecting it into the future. These concepts continue to prove challenging to adopt for many, but Murray and Tantau’s thoughtful concepts and innovative solutions have proven invaluable to an industry reticent to change. TNAA was chosen as the metric for tracking these access improvements, as espoused by Murray and Tantau along with the founder of the Institute for Healthcare Improvement (IHI), Dr Don Berwick (see Figure 1).4
Introduced to monitor a concept that was quite novel at the time, TNAA represents an opportunity that remains unfulfilled, as no explicit consensus exists on its definition. While the original definition pinpointed ‘physical examinations’ as the appointment type to be monitored, current definitions allow for avenues of expansion almost unlimited in nature. The IHI presents the following definition:
Average length of time in days between the day a patient makes a request for an appointment with a physician and the third
08_Woodcock_MIH_2.2.indd 155 10/19/17 4:25 PM
Woodcock, Kier and Zhao
156 Management in Healthcare Vol. 2, 2 153–164 © Henry Stewart Publications 2397-1053 (2017)
available appointment for a new patient physical, routine exam, or return visit exam. The ‘third-next-available’ appointment is used rather than the ‘next available’ appointment, since it is a more sensitive reflection of true appointment availability.6
Instructions involve reliably selecting the same day of the week — and the same time of day — to measure each time. Furthermore, users are directed: ‘Count all calendar days, including days off, weekends, and holidays, as it makes it easier to compare patient wait time across providers, and, most importantly, throughout the practice.’ In order to determine the TNAA, reports another source, look at the schedule and ask, ‘As of right now, what is the third-next-available appointment for this provider?’7
While the definition centres upon the protocol of counting slots, the application of TNAA to a large, multispecialty health care organisation can prove quite challenging.
Manual counts of hundreds of physicians’ templates are inherently resource-intensive. The complexity of appointment types characteristic of an ambulatory enterprise increases the complexity of the metric. For example, the IHI recommends the exclusion of ‘blocked’ appointments. ‘Blocked’, however, is an undefined and ambiguous term, resulting in a wide variation of interpretations among organisations. One set of instructions reads:
Determine TNAA for new visits and return visits separately for each provider.
You can determine TNAA for other visit types if they make up a large proportion of the visits in your system. Do not count as open any visit type that is not available for general scheduling use, or that is held for use on a particular day. This includes appointments held for same-day appointments, or those that might be held for urgent care or walk-in patients.8
While scheduling systems offer TNAA in their reporting packages, the specifications and definitions employed are not standard, therefore leading to inaccurate comparison. While such variation within the definition is understandable, it becomes clear that the accuracy of comparisons outside of the organisation (and sometimes even within the organisation) can be fraught with variance and has arguably been rendered improbable.
Dr Murray himself has stated that the metric represents a judgment call, as it contemplates the first or the average third next-available appointment; indeed, he espouses the measurement of both.9 Comparative data about the metric is difficult to locate, as noted in the IOM’s Discussion Paper, Innovation and Best Practices in Health Care Scheduling:
Despite being considered an important element of care quality, measuring of wait times using the IHI measure, third-next-available appointment . . . is not performed throughout the United States, with little benchmarking data released nationally.10
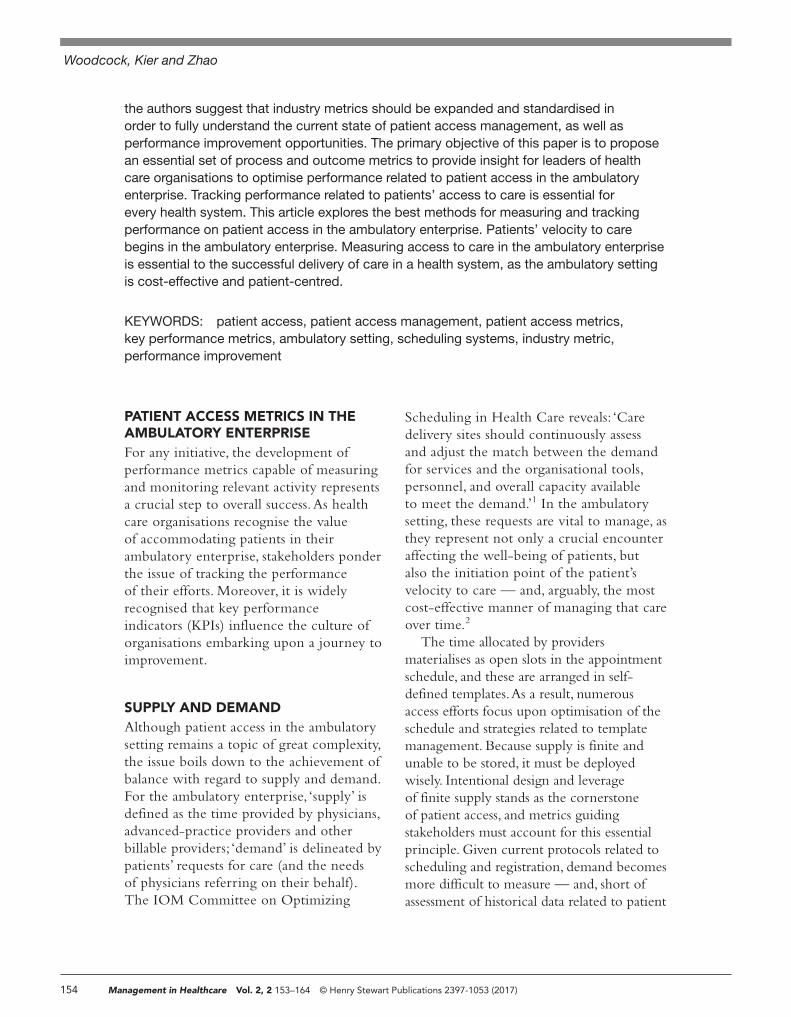
This statistic is used to measure the number of days a patient has to wait to get an appointment. The third-next-available physical examination is a sentinel marker. Physical examination is used rather than another appointment type because it is usually the latest scheduled. If access to physical examination improves, all availability improves. The third appointment is featured because the first and the second available appointments may reflect openings created by patients cancelling appointments, and thus do not accurately measure true accessibility. This measure is easily obtained, daily or weekly, by the receptionist while counting the number of days until an opening for the third-next physical examination appointment is on the schedule. — Dr Mark Murray and Dr Don Berwick.5
Figure 1: Third-next-available appointment
08_Woodcock_MIH_2.2.indd 156 10/19/17 4:25 PM
Patient access metrics in the ambulatory enterprise
© Henry Stewart Publications 2397-1053 (2017) Vol. 2, 2 153–164 Management in Healthcare 157
Of particular concern is the general reaction to the metric. The metric itself is not the point; rather, it represents an opportunity for change. TNAA is a measure of schedule design, and, to a lesser degree, of density or satiation; however, in reality, it offers limited perspective on outcomes. Once a solid understanding has been reached on an acceptable method of measurement, appointment strategies such as blocks and holds can be deployed to alter results. Physicians can manipulate TNAA based upon template changes in order to achieve the desired results. In practice, although, this helps only the numbers — not the patient.
Physicians may argue that an ‘available’ appointment always exists. This is an approach often embraced in a specialty environment, and it functions according to a natural ebb and flow with regard to ‘stat’ patients and the number and nature of available specialists. The nature of this availability, which is perceived as a characteristic of a specialty practice, leaves the door open for rejection by physicians. Active problem-solving around this issue holds the key to unlocking the universal definition and accepted usage of TNAA.
From a patient’s perspective, moreover, it is imperative to consider whether or not anyone truly wants the third-next-available appointment. This may not have mattered years ago, but in the spirit of transparency, it becomes crucial to display these metrics for today’s patients — and for referring physicians, as well. Organisations that have followed this strategy have received pushback from patients — who, of course, intuitively desire the first available appointment.
TNAA has served a vital purpose: it has pressured industry stakeholders to launch improvements in the area of demand satiation. Just as the revenue cycle does not rely exclusively upon days in receivables outstanding, efforts to improve patient access must also include a multitude of metrics. For patient access, TNAA can be used as one
indicator of performance; however, it must be combined with an array of metrics in order to drive significant, positive change.
Outpatient Availability Score. In an effort to develop mechanisms capable of monitoring efforts related to patient access improvements, organisations have begun to develop their own metrics. The Department of Radiology at Massachusetts General Hospital developed the concept of the ‘outpatient availability score (OAS)’. Accounting for patient preference, the OAS utilises a range of predictors (thresholds) in order to determine the low, medium or high likelihood that patients will find appointments suitable for them. This metric can account for patients who were offered an appointment and deferred due to provider, location, date and time preference. It then uses the ratio of preference to the first available appointment in order to determine the number of appointments that will be accepted, if offered. According to the authors of the study,
The OAS is more useful than other current methodologies for measuring availability, such as next appointment availability or third-next appointment availability, for the following reasons: (1) the OAS forecasts availability for an extended period of time, (2) the OAS forecasts the quantity of available appointments and (3) the OAS is a better indication of the department’s ability to satisfy patients’ appointment needs.11
Other Industry Metrics. Others have attempted to establish patient access metrics, but the most intense focus has rested predominantly on revenue cycle measures. In its ‘Patient-Access Metrics’, for example, The Advisory Board Company lists 12 metrics related to collections, registration volume and accuracy, and financial screening, and includes only two related to scheduling: call abandonment and appointment confirmations.12 In addition, the National Association of Healthcare Access Management (NAHAM) reports
08_Woodcock_MIH_2.2.indd 157 10/19/17 4:25 PM
Woodcock, Kier and Zhao
158 Management in Healthcare Vol. 2, 2 153–164 © Henry Stewart Publications 2397-1053 (2017)
front-end collections as well as conversions, process failures, productivity and quality. NAHAM reports patient experience data as well; however, the majority of its efforts focus upon the inpatient environment. Other companies concentrate primarily upon the category of patient experience, particularly those reporting on their organisation’s scoring related to the ‘access to care’ categories on survey instruments such as those provided by the Consumer Assessment of Healthcare Providers and Systems (CAHPS), which include a special survey for the ambulatory environment: ‘Clinician and Group’.
These are all excellent metrics, but none satisfies the responsibility of organisations to strategically measure efforts relevant to the management of supply and demand. In order to provide the health care industry the appropriate metrics to consider — as well as the ability to identify opportunities for comparison and benchmarking — action must be taken quickly. Experts agree: ‘A noted opportunity lies in the metrics used to assess wait times that measure the key components of access, scheduling, and outcomes.’13 It is the opportune time to forge this pathway to success.
PROPOSED INDUSTRY METRICSA careful engineering of the balance between supply and demand clearly constitutes the foundation of all patient access activities, and the indicators chosen by health care organisations to inform that journey are now identified as business-crucial.
New Patient Lag Time. Used to measure capacity and inform operations via monitoring of arrivals, New Patient Lag Time (NPLT) contains both procedural and experiential components, making it a strong candidate as a key performance indicator.
This metric measures the health of the schedule, as well as the ease of access into
the ambulatory enterprise. NPLT can also reliably be used as a proxy for meeting patient expectations, by correlating the measure with patient satisfaction scores.
Strategic planning for NPLT improvement involves intentional scheduling design that reserves specific access for new patients so that return appointments do not fully consume the providers’ time. It is important to establish organisational goals around the length of time new patients should wait, accounting for the ideal patient experience. Market saturation, competition and population demographics play a role in determining patients’ expectations.
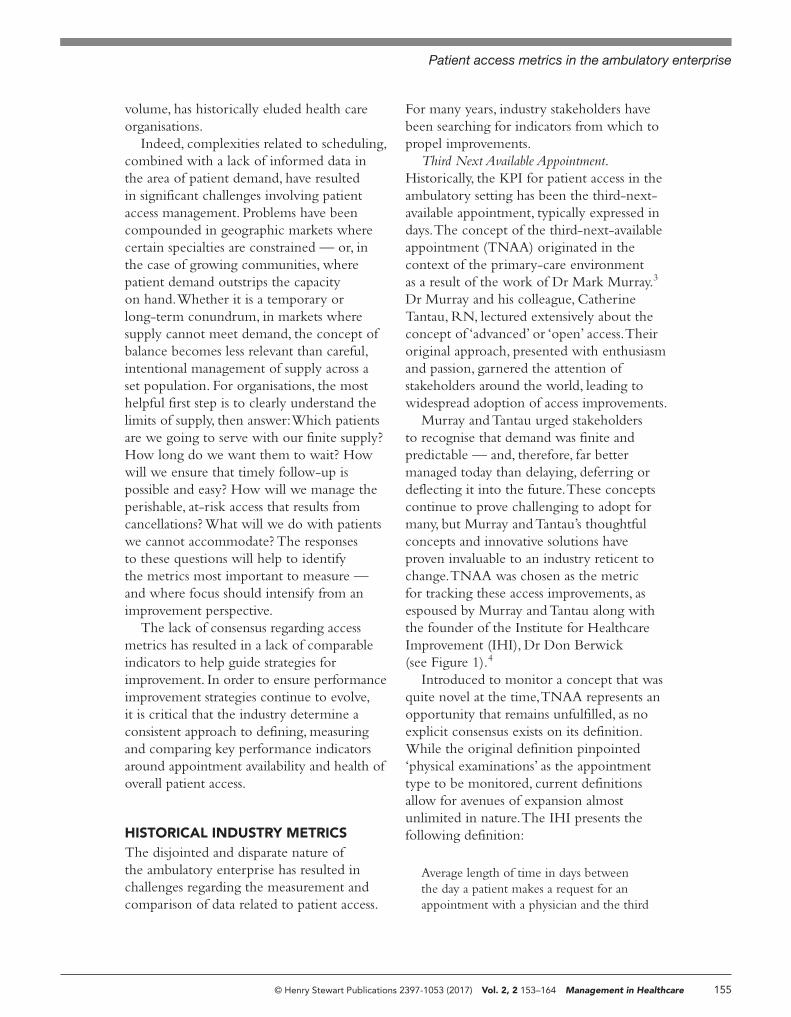
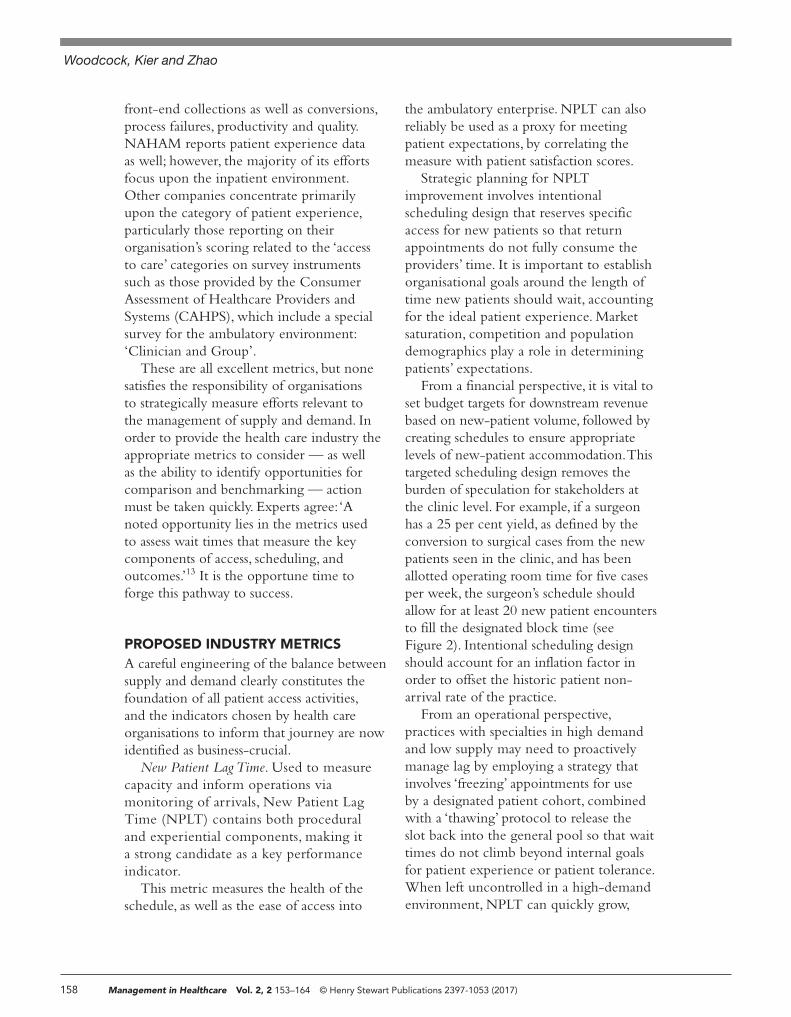
From a financial perspective, it is vital to set budget targets for downstream revenue based on new-patient volume, followed by creating schedules to ensure appropriate levels of new-patient accommodation. This targeted scheduling design removes the burden of speculation for stakeholders at the clinic level. For example, if a surgeon has a 25 per cent yield, as defined by the conversion to surgical cases from the new patients seen in the clinic, and has been allotted operating room time for five cases per week, the surgeon’s schedule should allow for at least 20 new patient encounters to fill the designated block time (see Figure 2). Intentional scheduling design should account for an inflation factor in order to offset the historic patient non-arrival rate of the practice.
From an operational perspective, practices with specialties in high demand and low supply may need to proactively manage lag by employing a strategy that involves ‘freezing’ appointments for use by a designated patient cohort, combined with a ‘thawing’ protocol to release the slot back into the general pool so that wait times do not climb beyond internal goals for patient experience or patient tolerance. When left uncontrolled in a high-demand environment, NPLT can quickly grow,
08_Woodcock_MIH_2.2.indd 158 10/19/17 4:25 PM
Patient access metrics in the ambulatory enterprise
© Henry Stewart Publications 2397-1053 (2017) Vol. 2, 2 153–164 Management in Healthcare 159
causing a higher percentage of patients to fail to keep their appointments due to their expectations not being met. If not managed with skilful execution, this precious amount of supply goes unused. The ‘thawing’ protocol is vital: practices that struggle to fill their schedules should be sure to make ‘reserved’ slots flexible to include all appointment types. This switch should be performed a few days in advance, so that capacity is not spoiled or wasted. Working to understand each practice’s demand cadence and fill rate (discussed later in this article) helps formulate schedules that successfully reserve and switch to support full utilisation as well as provide exceptional patient experience.
Measurement of NPLT is not only important to plan for optimal performance, it is also a key performance metric due to its
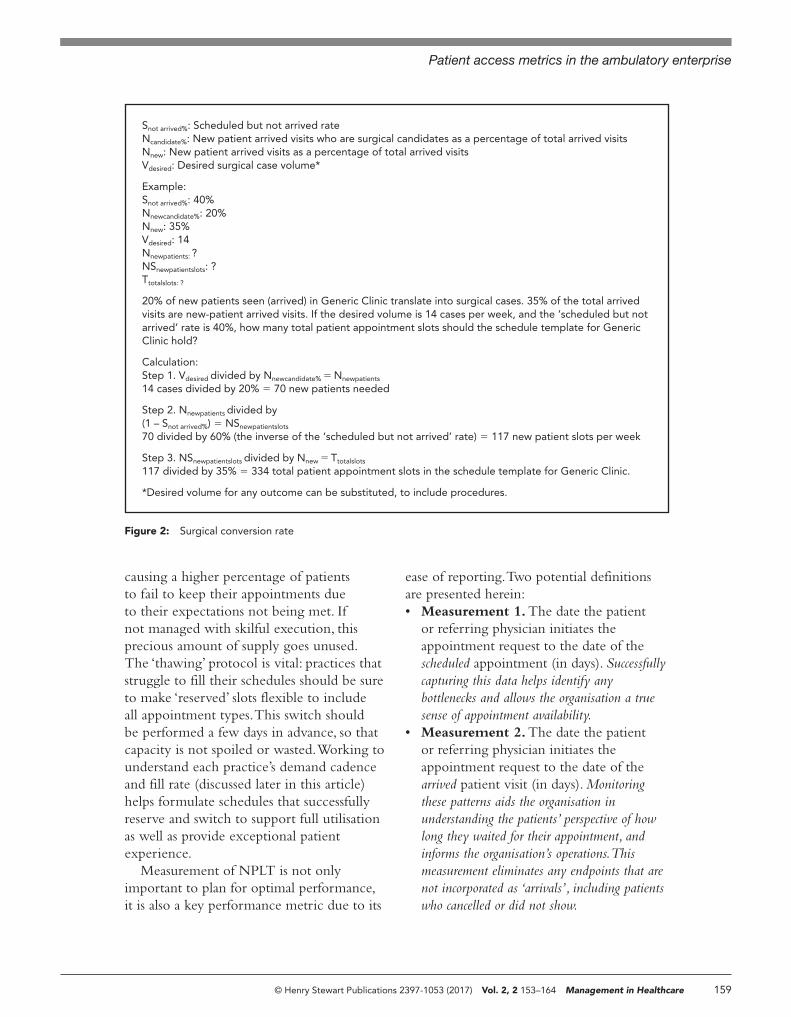
ease of reporting. Two potential definitions are presented herein:• Measurement 1. The date the patient
or referring physician initiates the appointment request to the date of the scheduled appointment (in days). Successfully capturing this data helps identify any bottlenecks and allows the organisation a true sense of appointment availability.
• Measurement 2. The date the patient or referring physician initiates the appointment request to the date of the arrived patient visit (in days). Monitoring these patterns aids the organisation in understanding the patients’ perspective of how long they waited for their appointment, and informs the organisation’s operations. This measurement eliminates any endpoints that are not incorporated as ‘arrivals’, including patients who cancelled or did not show.
Figure 2: Surgical conversion rate
Snot arrived%: Scheduled but not arrived rateNcandidate%: New patient arrived visits who are surgical candidates as a percentage of total arrived visitsNnew: New patient arrived visits as a percentage of total arrived visitsVdesired: Desired surgical case volume*
Example:Snot arrived%: 40%Nnewcandidate%: 20%Nnew: 35%Vdesired: 14Nnewpatients: ?NSnewpatientslots: ?Ttotalslots: ?
20% of new patients seen (arrived) in Generic Clinic translate into surgical cases. 35% of the total arrived visits are new-patient arrived visits. If the desired volume is 14 cases per week, and the ‘scheduled but not arrived’ rate is 40%, how many total patient appointment slots should the schedule template for Generic Clinic hold?
Calculation:Step 1. Vdesired divided by Nnewcandidate% = Nnewpatients
14 cases divided by 20% = 70 new patients needed
Step 2. Nnewpatients divided by (1 – Snot arrived%) = NSnewpatientslots
70 divided by 60% (the inverse of the ‘scheduled but not arrived’ rate) = 117 new patient slots per week
Step 3. NSnewpatientslots divided by Nnew = Ttotalslots
117 divided by 35% = 334 total patient appointment slots in the schedule template for Generic Clinic.
*Desired volume for any outcome can be substituted, to include procedures.
08_Woodcock_MIH_2.2.indd 159 10/19/17 4:25 PM
Woodcock, Kier and Zhao
160 Management in Healthcare Vol. 2, 2 153–164 © Henry Stewart Publications 2397-1053 (2017)
Given the fact that a new patient is defined as an individual new to the specialty, it is recognised, in accordance with current procedural terminology (CPT) guidelines, that a measure of net news (also referred to as new news) should also be considered. It is essential to track the volume of net news over time to ensure that efforts to capture and accommodate new demand prove successful.
High-performing organisations omit conjecture about goals related to lag time by analysing patients’ satisfaction with their access to care. This is performed by surveying
patients to determine the number of days from the date of the patient or referring physician’s preference for the appointment to the actual date of the appointment, as a measure of patient demand. Predictive analytics related to demand, such as those supported by customer relationship management (CRM) solutions, provide invaluable opportunities to monitor success.
Key Performance Indicators. We will now examine the additional metrics that are, to an increasing extent, being adopted by health care organisations to monitor access in the
Days are reported as calendar.
New-Patient Lag Time — Scheduled Patients: The median span of time, as measured in calendar days, between the date of a new patient’s appointment request (e.g. telephone call, portal-based request, referring physician on behalf of the patient, etc.) and the date of the appointment, for all providers with an active template in your scheduling system. Report this based upon a retrospective view of a minimum period of 90 days during the reporting period. Note that this is the median number of calendar days between the request and the appointment schedule. The status of the patient’s arrival is not relevant to this metric.
New-Patient Lag Time — Arrived Patients: The median span of time, as measured in calendar days, between the date of a new patient’s appointment request (e.g. telephone call, portal-based request, referring physician on behalf of the patient, etc.) and the date of the appointment for which the patient arrived, for all providers with an active template in your scheduling system. Report this based upon a retrospective view of a minimum period of 90 days during the reporting period. Note that this is the median number of calendar days between the request and the arrival.
Percentage of New Patients Seen (Arrived) within 14 Days: The median percentage of new patients arrived within 14 calendar days of their appointment request, during the reporting period. Do not include patients who rescheduled, cancelled, or no-showed.
New Patient: Defined by CPT® codes: [New outpatient (99201-05) + outpatient consults (99241-45) + New Preventative Medicine (99381-87) + New Eye Exam (92002-92004)]. An internal scheduling definition (for example, ‘new to clinic’) should not necessarily define ‘new’. For reference, per CPT guidelines. A patient is new when he or she has not been seen in that specialty (defined by taxonomy code) in three years for a professional service.
No-show: Patient fails to present for his/her scheduled appointment without any advance notification (as defined by the organisation).
Cancel: Patient provides advance notification that he/she cancelled a scheduled appointment, as defined by the organisation. (The data can be further refined by segmenting the ‘last-minute’ cancellations — for example, those with less than 24 hours’ notice — to target this opportunity.)
Bump: Physician/provider cancels a patient’s scheduled appointment, as defined by the organisation.
Other: Pending (i.e. chart not closed, etc.).
Percentage Scheduled, but Not Arrived: The median percentage of patients who are given a scheduled appointment (includes same-day appointments that are scheduled), but do not arrive for that appointment. The denominator includes all scheduled appointments. The reasons for non-arrival may include no-shows, advance/last-minute cancellations, provider-initiated bumps, or other reasons. Note that these slots may have been re-filled, but the rate is to recognise rework in addition to capacity opportunities. Reported based upon a retrospective view of a minimum period of 90 days during the reporting period, with the end of the period at least 30 days from today’s date (in order to ensure that missing charges/open charts are accounted for).
Figure 3: Definitions
08_Woodcock_MIH_2.2.indd 160 10/19/17 4:25 PM
Patient access metrics in the ambulatory enterprise
© Henry Stewart Publications 2397-1053 (2017) Vol. 2, 2 153–164 Management in Healthcare 161
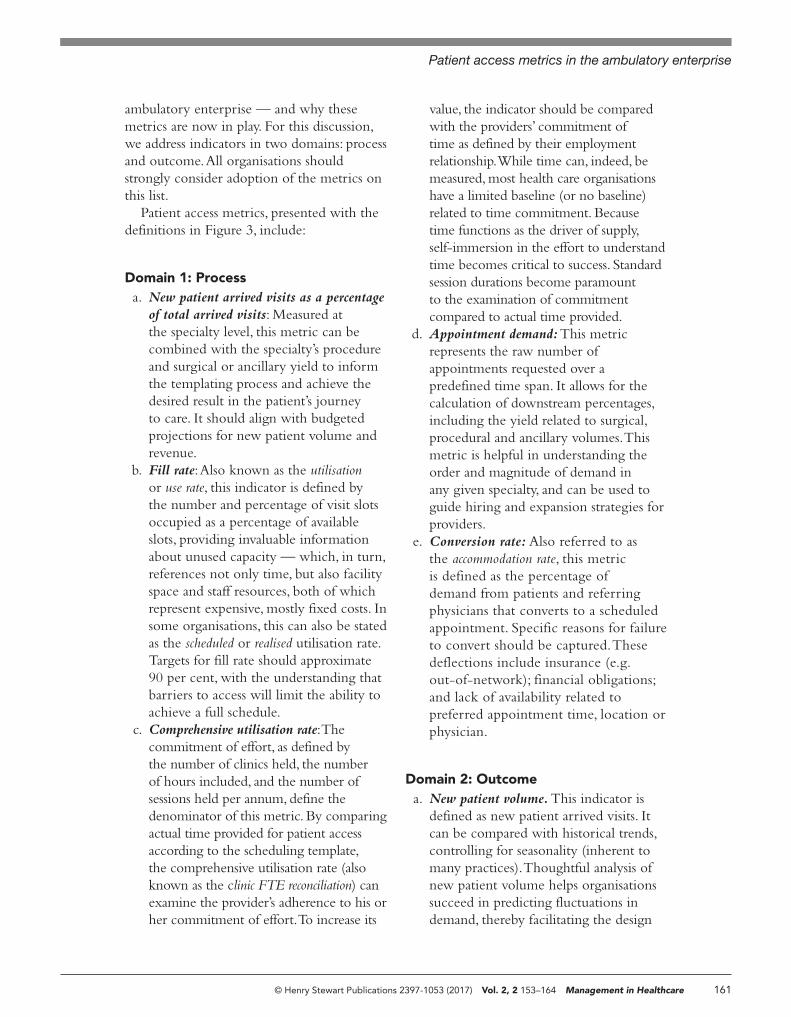
ambulatory enterprise — and why these metrics are now in play. For this discussion, we address indicators in two domains: process and outcome. All organisations should strongly consider adoption of the metrics on this list.
Patient access metrics, presented with the definitions in Figure 3, include:
Domain 1: Processa. New patient arrived visits as a percentage
of total arrived visits: Measured at the specialty level, this metric can be combined with the specialty’s procedure and surgical or ancillary yield to inform the templating process and achieve the desired result in the patient’s journey to care. It should align with budgeted projections for new patient volume and revenue.
b. Fill rate: Also known as the utilisation or use rate, this indicator is defined by the number and percentage of visit slots occupied as a percentage of available slots, providing invaluable information about unused capacity — which, in turn, references not only time, but also facility space and staff resources, both of which represent expensive, mostly fixed costs. In some organisations, this can also be stated as the scheduled or realised utilisation rate. Targets for fill rate should approximate 90 per cent, with the understanding that barriers to access will limit the ability to achieve a full schedule.
c. Comprehensive utilisation rate: The commitment of effort, as defined by the number of clinics held, the number of hours included, and the number of sessions held per annum, define the denominator of this metric. By comparing actual time provided for patient access according to the scheduling template, the comprehensive utilisation rate (also known as the clinic FTE reconciliation) can examine the provider’s adherence to his or her commitment of effort. To increase its
value, the indicator should be compared with the providers’ commitment of time as defined by their employment relationship. While time can, indeed, be measured, most health care organisations have a limited baseline (or no baseline) related to time commitment. Because time functions as the driver of supply, self-immersion in the effort to understand time becomes critical to success. Standard session durations become paramount to the examination of commitment compared to actual time provided.
d. Appointment demand: This metric represents the raw number of appointments requested over a predefined time span. It allows for the calculation of downstream percentages, including the yield related to surgical, procedural and ancillary volumes. This metric is helpful in understanding the order and magnitude of demand in any given specialty, and can be used to guide hiring and expansion strategies for providers.
e. Conversion rate: Also referred to as the accommodation rate, this metric is defined as the percentage of demand from patients and referring physicians that converts to a scheduled appointment. Specific reasons for failure to convert should be captured. These deflections include insurance (e.g. out-of-network); financial obligations; and lack of availability related to preferred appointment time, location or physician.
Domain 2: Outcomea. New patient volume. This indicator is
defined as new patient arrived visits. It can be compared with historical trends, controlling for seasonality (inherent to many practices). Thoughtful analysis of new patient volume helps organisations succeed in predicting fluctuations in demand, thereby facilitating the design
08_Woodcock_MIH_2.2.indd 161 10/19/17 4:25 PM
Woodcock, Kier and Zhao
162 Management in Healthcare Vol. 2, 2 153–164 © Henry Stewart Publications 2397-1053 (2017)
of appropriate templates and protocols. For example, converting physicals, which exhibit high demand in the late summer and early fall, into appointments reserved for acute illnesses in the winter. Both the measurement of and action related to addressing this metric become critical in markets where demand outstrips the supply of providers, as failing to account for seasonal fluctuation in demand can lead to patients diverting their care outside of the organisation.
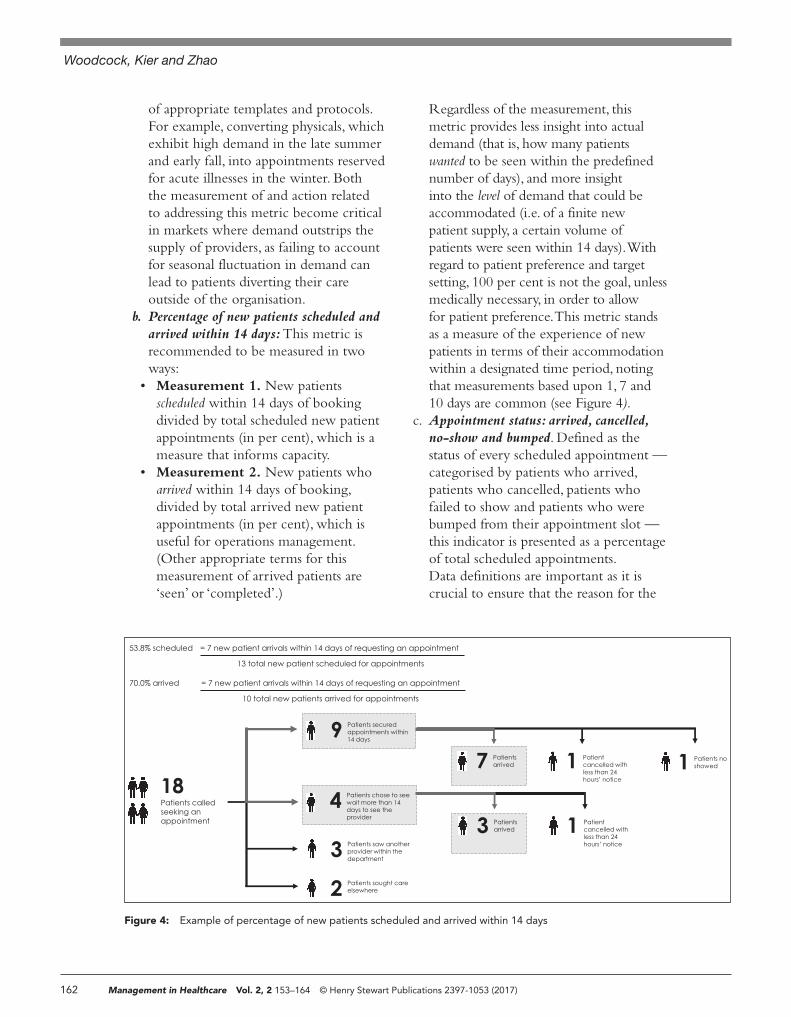
b. Percentage of new patients scheduled and arrived within 14 days: This metric is recommended to be measured in two ways:
• Measurement 1. New patients scheduled within 14 days of booking divided by total scheduled new patient appointments (in per cent), which is a measure that informs capacity.
• Measurement 2. New patients who arrived within 14 days of booking, divided by total arrived new patient appointments (in per cent), which is useful for operations management. (Other appropriate terms for this measurement of arrived patients are ‘seen’ or ‘completed’.)
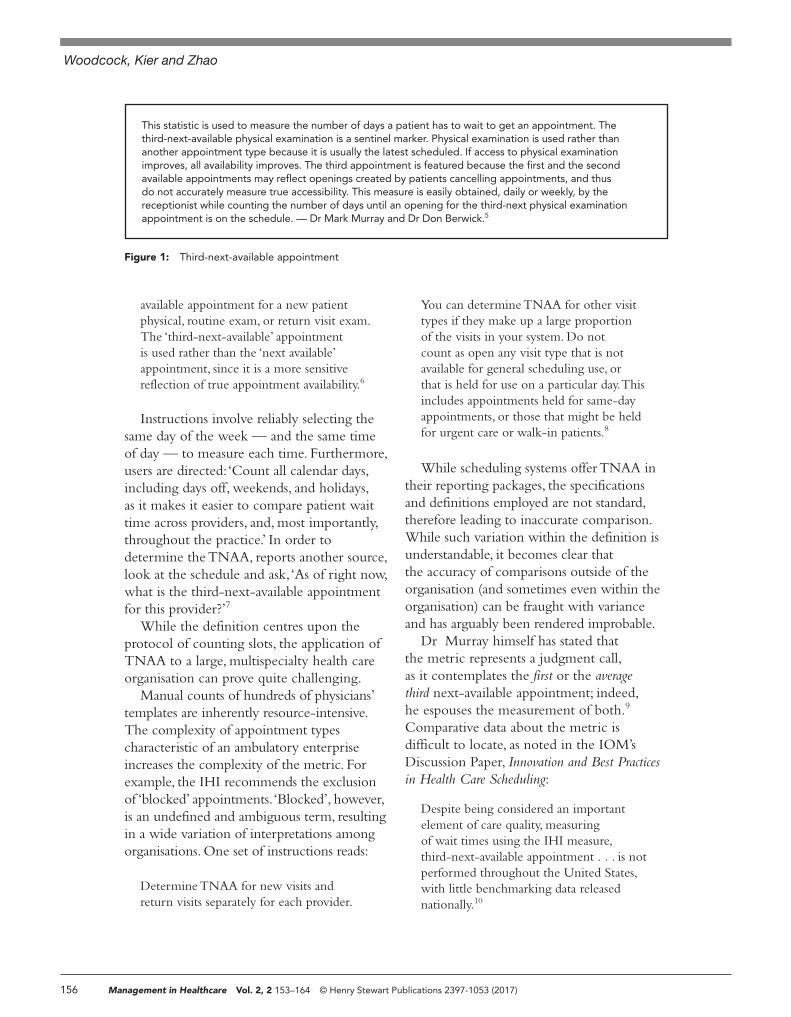
Regardless of the measurement, this metric provides less insight into actual demand (that is, how many patients wanted to be seen within the predefined number of days), and more insight into the level of demand that could be accommodated (i.e. of a finite new patient supply, a certain volume of patients were seen within 14 days). With regard to patient preference and target setting, 100 per cent is not the goal, unless medically necessary, in order to allow for patient preference. This metric stands as a measure of the experience of new patients in terms of their accommodation within a designated time period, noting that measurements based upon 1, 7 and 10 days are common (see Figure 4).
c. Appointment status: arrived, cancelled, no-show and bumped. Defined as the status of every scheduled appointment — categorised by patients who arrived, patients who cancelled, patients who failed to show and patients who were bumped from their appointment slot — this indicator is presented as a percentage of total scheduled appointments. Data definitions are important as it is crucial to ensure that the reason for the
Figure 4: Example of percentage of new patients scheduled and arrived within 14 days
9 Patients securedappointments within14 days
18Patients calledseeking anappointment
4 Patients chose to seewait more than 14days to see theprovider
3 Patients saw anotherprovider within thedepartment
2 Patients sought careelsewhere
1 Patients noshowed 1 Patient
cancelled withless than 24hours’ notice
7 Patientsarrived
= 7 new patient arrivals within 14 days of requesting an appointment 53.8% scheduled
13 total new patient scheduled for appointments
= 7 new patient arrivals within 14 days of requesting an appointment70.0% arrived
10 total new patients arrived for appointments
1 Patientcancelled withless than 24hours’ notice
3 Patientsarrived
08_Woodcock_MIH_2.2.indd 162 10/19/17 4:25 PM
Patient access metrics in the ambulatory enterprise
© Henry Stewart Publications 2397-1053 (2017) Vol. 2, 2 153–164 Management in Healthcare 163
non-arrival, if applicable, is faithfully captured and codified so that action may be taken to improve future performance. Each category of non-arrival is measured as a percentage of total scheduled appointments and monitored based upon the scheduling horizon. This indicator can help to inform the realm of opportunity related to predictive booking protocols: the booking or fill rate needed to convert the appropriate volume of arrivals. It can also identify opportunities related to understanding the reasons patients have scheduled, but failed to arrive at their appointment slots. Many organisations define last-minute cancellations as a separate metric in an attempt to measure and reduce schedule churn close to the date and time of the appointment. Definitions vary by practice: primary care can usually backfill appointments within a few hours, but some subspecialty clinics may require several days particularly accounting for insurance-related requirements. Understanding how total appointment capacity is utilised is critical to designing interventions leading to improvement.
d. Bumped clinics: This indicator measures the volume and percentage of physician-directed cancellations, accompanied by the number of patients lost compared with those who were impacted, but agreed to reschedule. This measures committed time that vanished, as well as the impact of that loss upon patients. It is critical to measure and take action with regard to patients
who did not reschedule, so the impact of the bumped appointments can be quantified from a perspective of revenue — to include the leakage related to the potential surgical, procedural and ancillary yield — as well as patient experience. (The data can be further refined by segmenting bumps by time, with 0–30 days being an important time period in which to measure bumps in order to target this opportunity, as this window of time creates challenges for patient accommodation.)
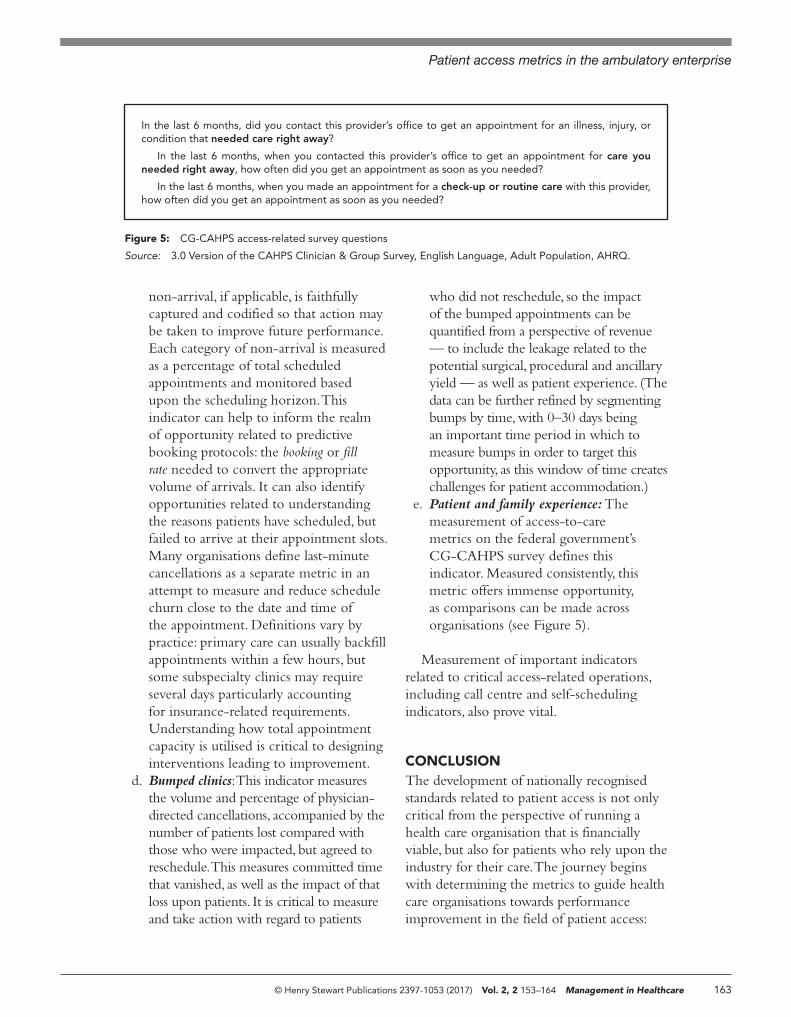
e. Patient and family experience: The measurement of access-to-care metrics on the federal government’s CG-CAHPS survey defines this indicator. Measured consistently, this metric offers immense opportunity, as comparisons can be made across organisations (see Figure 5).
Measurement of important indicators related to critical access-related operations, including call centre and self-scheduling indicators, also prove vital.
CONCLUSIONThe development of nationally recognised standards related to patient access is not only critical from the perspective of running a health care organisation that is financially viable, but also for patients who rely upon the industry for their care. The journey begins with determining the metrics to guide health care organisations towards performance improvement in the field of patient access:
In the last 6 months, did you contact this provider’s office to get an appointment for an illness, injury, or condition that needed care right away?
In the last 6 months, when you contacted this provider’s office to get an appointment for care you needed right away, how often did you get an appointment as soon as you needed?
In the last 6 months, when you made an appointment for a check-up or routine care with this provider, how often did you get an appointment as soon as you needed?
Figure 5: CG-CAHPS access-related survey questions
Source: 3.0 Version of the CAHPS Clinician & Group Survey, English Language, Adult Population, AHRQ.
08_Woodcock_MIH_2.2.indd 163 10/19/17 4:25 PM
Woodcock, Kier and Zhao
164 Management in Healthcare Vol. 2, 2 153–164 © Henry Stewart Publications 2397-1053 (2017)
gathering and comparing data, and sharing strategies proven to achieve success. The IOM’s Consensus Report concludes:
Reliable performance standards, which are needed for assessment and improvement of health care scheduling, cannot be established without better data. To develop the evidence base, health care organizations will need reliable information, tools, and assistance from various national organizations with the requisite expertise — as well as inter-organization coordination to ensure the harmony of reporting instruments and reference resources.14
The time is now: the journey to performance improvement in patient access deserves national attention, which can only be achieved by identifying a robust, proven set of metrics to drive success.
References1. Institute of Medicine. (2015). ‘Transforming health
care scheduling and access: getting to now’, The National Academic Press, Washington.
2. Crawford, D.C., Li, C.S., Sprague, S., Bhandari, M. (2015). ‘Clinical and cost implications of inpatient versus outpatient orthopedic surgeries: a systematic
review of the published literature’, Orthopedic Reviews, Vol. 7, No. 4.
3. Third Next Available Appointment (TNAA) – Q and A. (2010.), available at https://www . mainequalitycounts.org/image_upload/PCMH%20LS%202_Access%20Improvement%20How%20to%20Make%20It%20Work_Mark%20Murry%20and%20Associates_02.12.10.pdf (accessed 26th June, 2017).
4. Murray, M., Berwick, D.M. (2003).’ Advanced access: reducing waiting and delays in primary care’, JAMA, Vol. 289, No. 8, pp. 1035–1040.
5. Ibid.6. Institute for Healthcare Improvement. (2016). ‘Third
next available appointment’, available at http://www .ihi.org/resources/pages/measures/thirdnextavailable-appointment.aspx (accessed 26th June, 2017).
7. Safety Net Medical Home Initiative. (n.d). ‘Third next available appointment’, available at http://www .safetynetmedicalhome.org/sites/default/files /Third-Next-Appointment.pdf (accessed 26th June, 2017).
8. Ibid.9. Ibid, ref. 3 above.
10. Brandenburg, L., Gabow, P., Steele, G., Toussaint, J., Tyson, B.J. (2015). ‘Innovation and best practices in health care scheduling’, Technical report.
11. Asfaw, B.A., Nagtegaal, B.J., Rabiner, P., Thrall, J. (2007). ‘The outpatient availability score: An alternative approach to measuring demand’, Journal of the American College of Radiology, Vol. 4, No. 3, pp. 171–177.
12. The Advisory Board. (2014). ‘Patient access metrics’, available at https://www.advisory.com /-/media/Advisory-com/Technology/Payment - Navigation-Compass/Resources/Patient -Access-Benchmarks.pdf (accessed 26th June, 2017).
13. Ibid, ref. 10 above.14. Ibid, ref. 1 above.
08_Woodcock_MIH_2.2.indd 164 10/19/17 4:25 PM


![Accreditation Program: Ambulatory Health Care · PDF fileAccreditation Program: Ambulatory Health Care Chapter: National Patient Safety Goals Goal 1 Improve the accuracy of [patient]](https://img.pdfslide.us/doc/110x75/5a9dcb387f8b9a85318ca017/accreditation-program-ambulatory-health-care-program-ambulatory-health-care-chapter.jpg)