Embed Size (px)
Citation preview

Patience, Risk-Taking, and Human Capital Investment across Countries*
Eric A. Hanushek, Lavinia Kinne, Philipp Lergetporer, and Ludger Woessmann†
Abstract Patience and risk-taking – two preference components that steer intertemporal decision-making – are fundamental to human capital investment decisions. To understand how they contribute to international skill differences, we combine PISA tests with the Global Preference Survey. We find that opposing effects of patience (positive) and risk-taking (negative) together account for two-thirds of the cross-country variation in student skills. In an identification strategy addressing unobserved residence-country features, we find similar results when assigning migrant students their country-of-origin preferences in models with residence-country fixed effects. Associations of national preferences with family and school inputs suggest that both may act as channels.
Keywords: patience, risk-taking, preferences, culture, intertemporal decision-making, international student achievement, PISA
JEL classification: I21, Z10 July 16, 2021
* Extensive appendix material is available online at the journal website. A previous version of this paper was
circulated under the title “Culture and Student Achievement: The Intertwined Roles of Patience and Risk-Taking.” We gratefully acknowledge comments from Julie Cullen, David Figlio, Chris Karbownik, Martin Kocher, Markus Nagler, Ömer Özak, Nikki Shure, and seminar participants at the Econometric Society World Congress, the European Economic Association, the German Economic Association, the CESifo Area Conference on the Economics of Education, the Lovenheim/Imberman E-conomics of Education Seminar, and the ifo Center for the Economics of Education. This work was supported by the Smith Richardson Foundation. The contribution by Woessmann is also part of German Science Foundation project CRC TRR 190.
† Hanushek: Hoover Institution, Stanford University, CESifo, IZA, and NBER, [email protected]. Kinne: ifo Institute at the University of Munich, [email protected]. Lergetporer: ifo Institute at the University of Munich, CESifo, [email protected]. Woessmann: University of Munich, ifo Institute, CESifo, and IZA, [email protected].

1
1. Introduction
Each release of international student assessment data such as the PISA test brings both
professional and popular discussions of the causes of national differences in test scores. Such
differences attract widespread attention not only because of the national ranking aspect but also
because they provide indices of skills that are important for individual earnings (Hanushek et al.
(2015, 2017)) and economic growth (Hanushek and Woessmann (2012, 2015)). Yet the
underlying reasons for national differences in performance are not well understood. One often
discussed but seldom analyzed explanation involves cultural differences. This paper, relying on
newly available measures of time and risk preferences across countries, establishes a clear case
for linking skill investments to national preferences: International differences in student
achievement are strongly related to international differences in patience and risk-taking.
Past research gives a mixed picture of the sources of test-score differences across countries
(Hanushek and Woessmann (2011); Woessmann (2016b)). Commonly available measures of
educational resources such as aggregate spending, class size, and teacher characteristics explain
little of existing score variation. By contrast, institutional features of school systems including
test-based accountability, local autonomy, and private-school competition provide some
explanation of score differences. Additionally, the role of parents and families is consistently
strong, although highly variable across countries. Yet, the deeper structural determinants of
international differences in societal choices of schooling inputs and in the productivity with
which they are converted into educational outcomes remain poorly understood.
We focus on the potential role of differences in intertemporal preferences across societies as
constituting fundamental determinants of student achievement differences. Our conceptual
framework – developed in greater detail in Appendix A – combines the usually separated
literatures about optimal human capital investment and about education production functions in
order to highlight the central nature of preferences underlying intertemporal decision-making.
Moreover, while investment decisions are generally viewed from the individual perspective,
many decisions on educational inputs – in particular about resources and school institutions – are
taken at the group level rather than the individual level, making it hard to disentangle impacts of
individual preferences from group preferences.1
1 Following the literature (e.g., Guiso, Sapienza, and Zingales (2006); Alesina and Giuliano (2015)), we at
times use “culture” as shorthand for these group preferences. Obviously, however, culture is a very broad concept

2
Two components of national preferences are central to the relative valuation of net payoffs
in the present versus the future: time preferences (patience) and risk preferences (risk-taking).
Human capital investment decisions take time to effectuate and even longer before any returns
are realized. Just as the rewards for schooling investments require patience from the investor,
national differences in patience may lead to national differences in educational outcomes.
The role of risk-taking is more ambiguous a priori. On the one hand, in line with the
negative role of risk-taking stressed in the crime literature (e.g., Freeman (1999)), a preference
for risk-taking may negatively impact the human-capital production process. For example, it may
induce students not to complete required homework even though they take the risk of being
caught and reprimanded by parents or teachers. An increased willingness to take risk may
therefore favor misbehavior, reduce effort in studying, and carry through to lower educational
performance. On the other hand, consideration of various forms of school-completion and labor-
market risks produces indeterminate predictions on how risk attitudes may affect human capital
investment (Levhari and Weiss (1974)). For example, larger earnings variance in higher-
educated occupations may give rise to a positive association between risk-taking and higher-
education investment (e.g., Hartog and Diaz-Serrano (2014)), but lower unemployment risk (e.g.,
Woessmann (2016a)) may induce the opposite association.
Importantly, the intertemporal nature of human capital investment, its riskiness, and the
inherent interrelatedness of the two preference components (Halevy (2008); Andreoni and
Sprenger (2012)) imply that one cannot consider the impact of patience without simultaneously
considering risk-taking, and vice versa.
Our empirical investigation is facilitated by the recent innovations in international
preference measurement in Falk et al. (2018). Their Global Preference Survey (GPS) employs
experimental means to validate survey instruments that can be used to collect systematic data on
international differences in several preference parameters.
We combine the GPS data with PISA data on the educational achievement of close to two
million students observed in seven waves from 2000-2018 across 49 countries. These data allow
us to estimate international education production functions at the student level that bring out how
country differences in national preferences affect the skills acquired by students.
that has been given many different interpretations and goes far beyond the two intertemporal national preferences studied.

3
Our baseline analysis finds a strong and competing relationship between the two preference
components and students’ educational achievement. Patience has a strong positive and risk-
taking a strong negative association with test scores. The substantial positive correlation between
the two preference components implies that looking at them individually leads to consequential
understatement of their respective importance.
Together, the two aggregate preference measures account for two-thirds of the variation in
country average scores. Thus, a significant portion of the cross-country variation in student
achievement may be closely related to fundamental differences in national preferences.
Consistent with a leading role of national cultures, the associations of the preference measures
with individual achievement are much stronger for native students than for migrant students who
moved into the school system from a different country. Moreover, the findings are stable across
separate subjects (math, science, and reading) and subsamples (OECD and non-OECD).
To explore the causal structure of these cross-country associations, we focus on migrant
students in the PISA data. Across 48 residence countries, we observe the country of origin of
over 80,000 migrant students from 58 countries of origin with preference data. Following Figlio
et al. (2019), we assign migrant students the preference values of their country of origin and
study the performance of migrant children from different origin countries observed in the same
residence country. We include fixed effects for each residence country to separate the effects of
cultural factors from potentially correlated effects of the education systems, economies, or other
common features of the residence country.
Students from home countries with an aggregate one standard deviation (s.d.) higher
patience perform about 90 percent of a s.d. better in math (equivalent to the learning gains of
roughly three years of schooling), whereas students from home countries with one s.d. higher
risk-taking perform about 30 percent of a s.d. worse (equivalent to roughly one year of
schooling). Consistent with an intergenerational persistence of home-country preferences, results
are larger for migrant students who do not speak the language of their current residence country
at home. While this migrant analysis cannot rule out all potential biases, our results are
insensitive to different country samples, subjects, genders, alternative preference measures,
definitions of the migrant population, different amounts of student test-taking effort, and several
adjustments for the selectivity of migration – the most obvious threats to identification.

4
To investigate various channels through which national preferences might influence student
achievement, we link them to the proximate inputs of the education production function in a final
descriptive analysis. Patience is significantly positively correlated with family inputs, school
inputs, and residual achievement differences (which likely combine productivity differences with
unobserved inputs) across countries. Risk-taking is negatively correlated with family and
residual inputs. Our results point to particularly important roles for family and residual inputs.
Our analysis of student achievement follows the recent literature investigating the influence
of cultural factors on economic behavior and outcomes (Guiso, Sapienza, and Zingales (2006);
Alesina and Giuliano (2015)). With our migrant student analysis, we also contribute to this
literatures’ focus on intergenerational transmission (e.g., Bisin and Verdier (2011); Alesina and
Giuliano (2014)). Past study of international student achievement has treated cultural factors
largely as a source of possible bias in estimating the effects of proximate inputs in a cross-
country setting (e.g., Hanushek and Woessmann (2011); Woessmann (2016b)). Here we show
the value of directly addressing the potentially more fundamental role of some cultural traits as
underlying causes of achievement differences in their own right, explaining largely unanalyzed
elements of the nature of societal human capital formation. The large effects of national
preferences are in line with the role of unobserved parental characteristics that De Philippis and
Rossi (2021) find in cross-country achievement differences.
One central conceptual feature is combining the two artificially separated strands of human
capital literature: optimal investment decisions and the educational production process for skill
development. The human capital investment literature following Mincer (1958), Becker (1964),
Ben-Porath (1967), and others has measured human capital by individuals’ years of schooling,
equating skill development directly to the time costs of the investment. Human capital
investments are portrayed as an individual intertemporal optimizing decision involving varying
time commitments over the life cycle. For simplicity and tractability, this literature abstracts
from any differences in skills obtained from time in school. The education production function
literature on the other hand focuses on individuals’ qualitative skill differences, generally
looking at individuals with the same investment of school years but with different investment
inputs (e.g., Hanushek (1986)). With some variations, the relevant skills are systematically
related to inputs of the individual, the family, and the public through various aspects of
schooling. These two lines of research are in essence looking at the same issue – how human
5
capital investment decisions translate into differences in economically relevant skills. Treating
these lines of research together yields clear insights into the deeper forces affecting skill
differences of individuals and nations.
We also contribute to the literatures on time preferences (e.g., Sutter et al. (2013); Golsteyn,
Grönqvist, and Lindahl (2014); Figlio et al. (2019)), risk preferences (e.g., Levhari and Weiss
(1974); Castillo, Jordan, and Petrie (2018)), and their interrelatedness (e.g., Halevy (2008);
Andreoni and Sprenger (2012); Castillo, Jordan, and Petrie (2019); Castillo et al. (2020)).
Consistent with the associations of preferences with individual outcomes, our results show that
patience and risk-taking have important effects on countries’ human capital investment. At the
country level, our analysis also relates to work on long-run comparative development (e.g., Galor
and Özak (2016); Sunde et al. (2021)) and immigrants (e.g., Abramitzky and Boustan (2017)).
The next section describes the data. Section 3 develops the baseline estimates of the
relationship of preferences and human capital across nations. Section 4 delves deeper into the
causal structure using the analysis of migrants. Section 5 explores the association of patience and
risk-taking with proximate input factors as possible channels. Section 6 concludes.
2. Data
Our analysis combines international data on student achievement (section 2.1) and on
preferences (section 2.2). Details are found in Appendix B.
2.1 The Programme for International Student Assessment (PISA)
The Organisation for Economic Co-operation and Development (OECD) has conducted the
PISA test since 2000. PISA assesses achievement in math, science, and reading of random
samples of 15-year-old students on a three-year cycle (OECD (2019)), providing repeated cross-
sectional data representative in each country-by-wave cell. PISA also elicits background
information on students and schools that we use as controls and as measures of channels.
Over the seven waves of PISA testing, 2000-2018, a total of 86 countries participated at
least once (see Appendix Table A1 for details of all samples). Our baseline cross-country
analysis considers the subset of 49 countries that are also covered by the GPS, using achievement
data from a total of 1,992,276 students from 263 country-by-wave observations.
In our migrant analysis, we include migrant students in any residence country as long as
PISA identifies the country of origin and home-country GPS data are available. (The entire 2000

6
PISA wave drops out because of missing information on students’ country of origin). We
observe 80,398 migrant students (and up to 145,506 in a wider definition) from 58 countries of
origin located in 48 residence countries.
In the different parts of our analysis, we use data from a total of 86 countries, 71 of which
participated in PISA and 64 of which have GPS data.
2.2 The Global Preference Survey (GPS)
The newly available Global Preference Survey (GPS) provides scientifically validated, high-
quality data on several preference parameters collected from representative samples in 76
countries (Falk et al. (2018)).2 Using probability-based sampling, the GPS covers around 1,000
respondents in each country surveyed in 2012. We collapse the GPS data to the country level to
construct one representative measure for each preference parameter per country. In total, we use
GPS data from 64 countries – 49 countries in the baseline cross-country analysis and 58 as
countries of origin in the migrant analysis.
The GPS measures preferences in six domains: patience and risk-taking (the two preference
components underlying intertemporal decision-making that are our main focus here) plus
positive reciprocity, negative reciprocity, altruism, and trust. The underlying survey items were
selected in an ex-ante validation exercise based on their ability to predict incentivized choices in
a controlled laboratory setting. Patience and risk-taking are each measured by a combination of
one qualitative survey question and one hypothetical choice scenario, which are then combined
into a single preference measure using weights from the validation procedure.
Larger values of patience mean that the individual is more likely to accept deferred
gratification. Larger values of risk-taking mean that the individual is more likely to take risky
outcomes compared to certain outcomes. We z-standardize the GPS measure of each preference
domain in our respective analytical sample and collapse standardized preference measures to the
country level. Consistent with the interrelation emphasized in the behavioral literature, there is a
strong positive correlation between patience and risk-taking in the GPS data of 0.358 at the
country level (see Appendix Figure A1).
2 Because the GPS provides scientifically validated preference measures from representative samples for a
large set of countries, it has important advantages, discussed in Appendix B.2, over common alternative international datasets with proxies for national preferences such as the World Values Survey (WVS) and the Hofstede (1991) data. Correlations of our measures of intertemporal preferences with these alternatives and with the remaining GPS preferences are found in Appendix Table A3.

7
3. Patience, Risk-Taking, and Student Achievement across Countries
This section provides a description of the association of student achievement with patience
and risk-taking across countries. It guides our analysis of the causal structure of the cross-
country associations in section 4.
3.1 Empirical Model
Our empirical approach contrasts with most empirical investigations of educational
production functions that include a long list of possible variables in order to soak up potential
impacts of families, schools, institutions, and cultural traits. Being interested in more
fundamental determinants of educational achievement across countries,3 we employ a
parsimonious specification of an education production function that models the output of
education as centrally determined by national preferences:
𝑇𝑇𝑖𝑖𝑖𝑖𝑖𝑖 = 𝛽𝛽1𝑃𝑃𝑃𝑃𝑃𝑃𝑃𝑃𝑃𝑃𝑃𝑃𝑃𝑃𝑃𝑃𝑖𝑖 + 𝛽𝛽2𝑅𝑅𝑃𝑃𝑅𝑅𝑅𝑅𝑖𝑖 + 𝛼𝛼1𝐵𝐵𝑖𝑖𝑖𝑖𝑖𝑖 + 𝜇𝜇𝑖𝑖 + 𝜀𝜀𝑖𝑖𝑖𝑖𝑖𝑖 (1)
where achievement T of student i in country c at time t is a function of the two preference
components of the country, a parsimonious vector of control variables B (student gender, age,
and migration status), and an error term ɛict. Fixed effects for test waves μt account for average
changes over time along with any idiosyncrasies of the individual tests. Our coefficients of
interest are β1 and β2 which characterize the relationship between the two preference components
of a country’s society – patience and risk-taking – and student achievement.
To account for the country-level nature of the main treatment variables, we cluster standard
errors at the country level throughout. All regressions are weighted by students’ sampling
probabilities within countries and give equal weight to each country. In our analysis, original
PISA scores are divided by 100 to convert achievement in into standard deviations.
3.2 Results of the Baseline Analysis
Results of the baseline model indicate important and intertwined roles of patience and risk-
taking in international student achievement. Table 1 shows our baseline analysis of the
3 Moreover, to the extent that proximate inputs such as family inputs, school resources, and institutional
features are themselves the outcomes of intertemporal choice decisions, they are bad controls in a model depicting the overall effect of national preferences on student achievement (see Appendix A.2). Section 5 provides an analysis of these proximate inputs as potential channels of the impact of national preferences.
8
association of student math achievement with patience and risk-taking across countries. When
entered individually, there is a strong significant positive association of student achievement
with patience (column 1) and a weaker, marginally significant negative association with risk-
taking (column 2). Strikingly, both associations become much stronger (in absolute terms) and
statistically highly significant when the two preference components are considered together
(column 3), highlighting the importance of accounting for their interrelatedness. A one standard
deviation (s.d.) increase in patience is associated with a 1.23 s.d. increase in student
achievement, whereas the same increase in risk-taking is associated with a 1.24 s.d. decline in
student achievement. Conditioning on the other component is particularly relevant for risk-
taking: That part of the variation in risk-taking that is unrelated to patience has a strong negative
association with student achievement.4
The results on patience and risk-taking are hardly affected when taking measures of other
preference domains into account (column 4). In fact, none of the other four GPS measures –
positive reciprocity, negative reciprocity, altruism, and trust – is quantitatively or statistically
significantly associated with student achievement across countries. Thus, the preference
components directly linked to intertemporal decision-making, rather than other preference
domains, appear most relevant for educational achievement.
The interrelationship of the intertemporal preference components and achievement is
depicted graphically in Figure 1. The upper panel shows simple bivariate scatterplots between
average PISA math scores (pooled across waves) and the GPS measures of patience (left) and
risk-taking (right) at the country level.5 There is a strong positive association of student
achievement with patience and a weaker and less precise negative one with risk-taking. At the
country level, the R2s of the underlying regressions suggest that patience alone accounts for 40.9
percent of the cross-country variance in achievement, whereas risk-taking alone accounts for
only 6.2 percent. Both associations become much stronger and more precise when conditioning
on the respective other preference component in the lower panel. The two preference
components together account for two-thirds of the variance in average student achievement
4 Results are very similar for girls and boys, although the (absolute) estimate for risk-taking is slightly smaller
for girls (columns 1 and 2 of Appendix Table A4). An interaction term between patience and risk-taking does not enter the model significantly (not shown).
5 Results are almost identical when estimating the PISA scores as country fixed effects in equation (1) that includes control variables (but not patience and risk-taking; results available upon request).

9
across countries (R2 = 0.672). Interestingly, this is substantially larger than the sum of explained
variance accounted by the two measures separately, underscoring the off-setting interplay of the
two intertemporal preference components. The figures also show that the overall associations are
not driven by any strong outliers.
If cultural traits are driving the achievement results, one would expect the residence-country
culture to be less important for migrants whose parents are less steeped in that culture and whose
exposure to the new culture is less. When we look separately at native students and migrants, we
find a much stronger role of residence-country preferences for native students than for migrant
students.6 Among native students, a one s.d. increase in patience is associated with 1.30 s.d.
higher achievement, and the same increase in risk-taking is associated with 1.32 s.d. lower
achievement (column 5 of Table 1). By contrast, among students with a migrant background the
association is much lower (0.70 s.d.) for patience and only marginally significant (at 0.37 s.d.)
for risk-taking (column 6). Both differences are statistically significant.
The difference in results between students with and without migration background is in line
with a leading role of cultural traits as deep determinants of student achievement rather than
other unobserved schooling factors of a country. It also motivates our migrant analysis below
that considers the cultural traits of the migrant students’ countries of origin.
3.3 Robustness Analysis
One interpretational concern with low-stakes achievement tests such as PISA is that they
might not only measure students’ cognitive skills but also their effort on the test itself which in
turn may depend on students’ conscientiousness, intrinsic motivation, and other related skills
(e.g., Borghans and Schils (2012); Akyol, Krishna, and Wang (2018); Gneezy et al. (2019)).
Among a number of measures of students’ test-taking effort derived for the 2009 PISA wave,
Zamarro, Hitt, and Mendez (2019) find that the extent of item nonresponse (the share of
unanswered questions) in the student background questionnaire that follows the actual
achievement test explains the largest share of cross-country variation in test scores. We construct
this measure for all PISA waves to test whether the strong association of the intertemporal
preferences with PISA achievement partly reflects lower test-taking effort among less patient and
more risk-taking students. Indeed, lower patience and higher risk-taking do significantly predict
6 Students are classified as migrants if both parents were born abroad. The migrant analysis in section 4 shows
that our findings are insensitive to alternative definitions of the migrant population.

10
lower test-taking effort (higher item nonresponse on the background questionnaire) both at the
individual and country level (not shown), validating a cultural component of test-taking effort.
While test-taking effort is relevant for overall test achievement, it does not alter the results
for the two preference components. Individual students’ item nonresponse rates on the
background questionnaire negatively predict achievement on the math test (column 7 of Table 1).
But the coefficients on patience and risk-taking hardly change. The same is true when we
additionally control for average item nonresponse of the country (column 8). This is despite the
fact that item nonresponse has substantial quantitative relevance: At the country level, the
coefficient estimate suggests that going from the country with the lowest (0.010) to the highest
(0.108) average item nonresponse decreases the average PISA score by 0.42 s.d. Thus, while
test-taking effort appears relevant in low-stakes test taking, it does not alter conclusions about
the more fundamental preference-achievement nexus considered here.
Additional robustness analyses described in Appendix C show that qualitative results are
very similar for OECD and non-OECD countries, for achievement in science and reading, and
when restricting the analysis to the first PISA wave after the GPS observations. The appendix
also shows results for the alternative preference measures of WVS and Hofstede.
4. Exploration into Causality: Migrant Analysis
An obvious concern with the cross-country regressions is that a country’s national
preferences are likely correlated with other omitted country characteristics, such as legal or
economic factors, that affect human capital investments. While some of the variation in these
country factors may be the outcome of the national preferences and thus constitute channels
rather than omitted variables, there may also be independent variation that happens to be
associated with the national preference measures. For instance, a culture of patience might foster
the economic development in a country more broadly, making it impossible to distinguish
whether a positive association between patience and student achievement is due to patience per
se or to better well-being. To address concerns about the causal interpretation of the baseline
analysis, we explore an identification strategy that analyzes cultural differences among migrants.
4.1 Empirical Model
If patience and risk-taking truly are cultural factors that affect educational investment
decisions, migrants should retain some influence of the culture of their home countries. If we

11
compare achievement across migrant children from home countries with different preferences
who attend school in the same country of residence, we break the link between the cultural traits
and elements of the schools, institutions, and environments of the country of schooling –
something that cannot be done for natives. Following similar applications in Carroll, Rhee, and
Rhee (1994), Giuliano (2007), Fernández and Fogli (2009), and Figlio et al. (2019), we estimate
regressions of the following form:
𝑇𝑇𝑖𝑖𝑖𝑖𝑖𝑖𝑖𝑖 = 𝛿𝛿1𝑃𝑃𝑃𝑃𝑃𝑃𝑃𝑃𝑃𝑃𝑃𝑃𝑃𝑃𝑃𝑃𝑖𝑖 + 𝛿𝛿2𝑅𝑅𝑃𝑃𝑅𝑅𝑅𝑅𝑖𝑖 + 𝛾𝛾1𝐵𝐵𝑖𝑖𝑖𝑖𝑖𝑖𝑖𝑖 + 𝜃𝜃𝑖𝑖 × 𝜇𝜇𝑖𝑖 + 𝜀𝜀𝑖𝑖𝑖𝑖𝑖𝑖𝑖𝑖 (2)
where T is achievement of migrant student i from country of origin o observed in residence
country c at time t. Patienceo and Risko are the cultural traits measured in the country of origin.
The specification includes residence-country fixed effects θc to remove all common
economic, institutional, and schooling factors for each residence country. We pool the data
across residence countries but only use variation within each residence country and not cross-
country variation to estimate the preference impacts. In fact, our specification controls for a full
set of residence-country by wave fixed effects θc×μt which account for wave-specific differences
across countries. Standard errors are clustered at the country-of-origin level.
We begin with a rather narrow definition of migrants, including only students with parents
who are both born in a different country than the testing country. We assign first-generation
migrant students their country of birth and second-generation migrant students the country of
origin of their father. Across all PISA waves, there are 80,398 first- and second-generation
migrants from 58 countries of origin with GPS data observed in 48 residence countries.
4.2 Results of the Migrant Analysis
The migrant analysis confirms the strong positive effect of patience on student achievement
from the baseline analysis, as well as a significant negative effect of risk-taking, albeit of smaller
magnitude compared to its baseline estimate and to the effect of patience. Table 2 reports the
main regression results for the migrant analysis based on equation (2). All regressions include
180 fixed effects for each residence-country by wave cell and control variables. When entered
separately, student achievement is significantly positively related to patience in the students’
home country (column 1) and insignificantly positively to risk-taking (column 2). In line with the
previous cross-country findings, the coefficient on patience increases and the coefficient on risk-
taking turns significantly negative when both are entered together (column 3), underscoring the
12
interrelated and competing nature of the two cultural traits. Students from home countries with
one s.d. higher patience perform 0.93 s.d. better on the PISA math assessment, and students from
home countries with one s.d. higher risk-taking perform 0.29 s.d. worse.7
Column 4 additionally includes controls for the four other national preference components
of the country of origin. These cultural controls do not significantly affect student achievement
and leave the significant effects of the two intertemporal preference components intact. In fact,
the coefficient on risk-taking increases (in absolute terms) to -0.45 in this specification.
In sum, the migrant analysis confirms the strong and positive effect of patience on student
skill development documented in the descriptive cross-country analysis, even with the same
overall magnitude. Similarly, it replicates the negative effect of risk-taking once we account for
patience, though the effect size is smaller.8 The migrant analysis rules out that the cross-country
results are due to omitted residence-country variables. There is, of course, the possibility of
remaining biases, some of which we address in the following robustness tests.
4.3 Robustness Analysis
To account for differences in students’ test-taking effort, columns 5-7 of Table 2 control for
individual and country-of-origin mean item nonresponse rates in the PISA student background
questionnaires. Even though both enter significantly in explaining scores, the results on patience
and risk-taking again hardly budge after controlling for these proxies for student effort.
Identification in the migrant analysis depends on the extent to which the national preferences
of the country of origin provide a good proxy for the students’ and families’ actual preferences.
A proxy for the extent to which families still hold their country of origin’s influence is whether
they still speak the language of their country of origin at home, rather than adopting the language
of their new host country. The effects of the two home-country traits are 0.17 and 0.20 s.d. larger
for those students who do not speak the residence-country language at home compared to those
who do (columns 8 and 9), although the differences are shy of statistical significance. These
results are consistent with an interpretation that the treatment variables in the migrant analysis do
in fact capture the impact of cultural values of the countries of origin.
7 Results do not differ significantly between girls and boys (columns 3 and 4 of Appendix Table A4). 8 The differences in the point estimates on patience in the migrant analysis of Table 2 (columns 3 and 4) to the
respective specifications in Table 1 are only marginally significant (p < 0.1) in the specification without the four other preference components and statistically insignificant (p = 0.360) in the specification with the other preference components. Both differences are statistically highly significant (p < 0.001) for risk-taking.

13
Appendix D shows that qualitative results are very similar for OECD and non-OECD
countries, for achievement in science and reading, for first- and second-generation migrants and
migrants of different ages of migration, and for alternative migrant definitions. The appendix
also shows results for the alternative WVS and Hofstede preference measures.
Finally, we investigate whether several possible dimensions of selective migration pose a
threat to identification in our migrant analysis. As a start, we note that neither economic
conditions in the home country nor socio-economic differences in family background drive the
estimates of national preferences (column 2 of Appendix Table A5). Another way to address
potential bias from fundamental background differences is to include fixed effects for the origin
continent of the migrant students. Column 1 of Table 3 shows that effects get slightly stronger
when variation across continents of origin is removed. This analysis also indicates that results are
not driven by geographic clustering of preferences by continent or by (exogenous) outstanding
performance of any specific group such as students from Asia, Europe, or Latin America.
Migrants tend to be a selected subgroup from their countries of origin (e.g., Borjas (1987);
Grogger and Hanson (2011)). Note that migrant selectivity that is the same across the different
origin countries that send migrants to a specific residence country does not bias the migrant
results. But differential migrant selectivity that is correlated with average cultural traits of the
sending countries could introduce bias. This type of selection bias should be more severe for
countries of origin with higher variance in cultural traits. However, the standard deviations of the
two preference measures within the country of origin do not enter the model significantly and do
not affect the qualitative results (column 2).
Another way to gauge the relevance of differentially selective migration is to take into
account the geographical and cultural distance between sending and receiving countries. A
general pattern in the migration literature is that migrants from neighboring countries may be less
positively selected than migrants from more distant countries (see Hanushek, Ruhose, and
Woessmann (2017) for US evidence), possibly because fewer hurdles have to be overcome.
Controlling for the geographical distance between migrants’ country of origin and residence
country (using the distance measures from Mayer and Zignago (2011)) does not change our
qualitative results (column 3). In column 5, we test whether effects vary with the cultural
distance between the migrant students’ country of origin and their residence country, as
measured by the absolute difference in the preference measures between the two respective

14
countries. The positive impact of patience does not vary with cultural distance, whereas the
negative impact of risk-taking attenuates as cultural distance increases.
We also employ one direct measure of the differential selectivity of migrants based on their
educational attainment. For each pair of sending and receiving countries, we compare the
educational attainment of migrants in the residence country to the educational attainment of the
populations of their respective countries of origin. We then measure migrant selectivity as the
percentile of the country-of-origin distribution of educational attainment from which the average
migrant in each residence country comes. Hanushek, Ruhose, and Woessmann (2017) produced
this measure for immigrants into the US, and we extend that analysis to the full matrix of origin
and residence countries with available data. The measure of migrant selectivity is indeed
positively associated with student achievement (column 7), but accounting for this differential
selectivity does not affect our estimates of the impact of patience and risk-taking.
5. Channels of Impact
Our analysis has established robust relationships between the two preference components
and student achievement without direct reference to underlying mechanisms. In the context of
the canonical human capital production function, national preferences may influence student
achievement through proximate inputs at the family, school, and institutional level as well as the
productivity with which inputs are transformed into outcomes (see Appendix A.2).9
To investigate the potential channels through which the national preferences operate, we
regress four country-level variables reflecting major categories of proximate inputs10 on the two
preference components, patience and risk-taking (upper panel of Table 4).11 Patience is
positively associated with all four input components, although the association with institutional
inputs is not quite significant at the 10 percent level. The association and explained variance are
strongest for family inputs (column 1) followed by the residual (column 4). The residual factor
has the character of total factor productivity, combining any unmeasured input components with
9 Appendix E shows descriptive analysis that includes the proximate inputs as controls in our main analysis.
Results indicate that a substantial part of the overall effects of the two preference components may work through the channels of these proximate inputs.
10 Appendix F describes the construction of the four country-level input measures. 11 Note that the analysis of channels is not meaningful for the migrant analysis. Migrants are not exposed to the
school and institutional environment of the country that defines their cultural origin.
15
the effectiveness of input use. Similarly, risk-taking is negatively correlated with all four input
components, although only significantly so for family inputs and the residual.
As the estimation underlying the input aggregation may be biased by omission of the deeper
preference variables, the presented estimates serve as an upper bound. A similar aggregation
estimation including controls for the two national preferences can serve as a lower bound. The
lower-bound procedure yields similar qualitative results of significant positive associations of
patience with family and school inputs and a significant negative association of risk-taking with
family inputs, only with expectedly smaller magnitudes (lower panel of Table 4). Interestingly,
none of the other GPS preference measures (positive reciprocity, negative reciprocity, altruism,
and trust) are significantly related to any of the input factors (not shown).
The observed patterns appear intuitive and highlight that the different proximate inputs –
and particularly family inputs and residual productivity – may operate as channels through which
the two intertemporal preferences affect student achievement. Of course, this analysis is
inherently descriptive and should not be interpreted as a causal mediation analysis.
6. Conclusions
International differences in student achievement are at the forefront of many education
policy debates, but the deeper reasons for why students in some countries perform better than in
others are not well understood. While cultural differences have standardly been discussed as
confounding factors in cross-country analyses of student achievement, we explicitly investigate
specific cultural factors as deep determinants of student learning and skill investment. We focus
on patience and risk-taking – the two preference components that reflect the intertemporal and
risky nature of educational decisions – and combine international student achievement data from
PISA with newly available data on national preferences from the Global Preference Survey.
In our cross-country analysis, patience is strongly positively and risk-taking negatively
associated with student achievement. Importantly, ignoring the interrelatedness between the two
positively correlated preference components leads to a substantial underestimation of both
effects.
These results are confirmed in an identification strategy that compares migrant students
from different country-of-origin cultures observed in the same residence country, eliminating any
potential residence-country confounders. In a final descriptive analysis, we show that national
16
preferences likely influence educational achievement by affecting several proximate inputs of the
education production function, in particular family inputs and residual productivity.
Taking an international perspective in studying the factors that influence student
achievement comes with both advantages and challenges. The interest of this paper is
understanding the relationship between national preferences and student achievement across
countries, and the documented strength of the preference-achievement nexus indicates the first-
order nature of this question. However, identifying causal effects in international data is
particularly challenging because of the multitude of potential factors influencing student
achievement. Our migrant analysis, together with a series of robustness analyses, are entirely
consistent with the conclusions from the cross-country analysis. While addressing the most
significant threats to identification of impacts of national preferences, other threats may remain.
At the same time, it seems quite unlikely that any remaining bias would operate to eliminate the
extraordinarily strong impacts of national preferences that we estimate.
While our results are important for understanding international achievement differences,
they do not lend themselves to direct policy conclusions. Cultural traits of countries are slow
moving and not easy to change (e.g., Guiso, Sapienza, and Zingales (2006); Bisin and Verdier
(2011)). At the same time, the relevant preferences are clearly amenable to change both at the
individual and national level (e.g., Bird (2001); Alan and Ertac (2018); Jung, Bharati, and Chin
(2021)). The insight that cultural traits matter for educational achievement should thus be
accounted for when designing policy interventions, particularly those focused on family inputs.
Our results imply that any policy intervention needs to take into account the fundamental
role that cultural traits play in setting the context and in facilitating achievement. National
policies cannot simply copy another country’s experience. Failure to consider context may also
explain why many previous attempts at international improvement have been unsuccessful.
Finally, the finding that national preferences have limited association with institutional factors
suggests that improving the institutional structures of school systems – whose importance has
been highlighted by prior analyses (Hanushek and Woessmann (2011); Woessmann (2016b)) – is
a viable policy mechanism for improvement that does not necessarily depend on cultural change.

17
References Abramitzky, Ran, Leah Boustan (2017). Immigration in American Economic History. Journal of
Economic Literature 55 (4): 1311-1345. Akyol, Ş. Pelin, Kala Krishna, Jinwen Wang (2018). Taking PISA Seriously: How Accurate Are
Low Stakes Exams? NBER Working Paper 24930. Cambridge, MA: National Bureau of Economic Research.
Alan, Sule, Seda Ertac (2018). Fostering Patience in the Classroom: Results from Randomized Educational Intervention. Journal of Political Economy 126 (5): 1865-1911.
Alesina, Alberto, Paola Giuliano (2014). Family Ties. In Handbook of Economic Growth, Vol. 2, edited by Philippe Aghion, Steven N. Durlauf. Amsterdam: North Holland: 177-215.
Alesina, Alberto, Paola Giuliano (2015). Culture and Institutions. Journal of Economic Literature 53 (4): 898-944.
Andreoni, James, Charles Sprenger (2012). Risk Preferences Are Not Time Preferences. American Economic Review 102 (7): 3357-3376.
Becker, Gary S. (1964). Human Capital: A Theoretical and Empirical Analysis, with Special Reference to Education. New York, NY: National Bureau of Economic Research.
Ben-Porath, Yoram (1967). The Production of Human Capital and the Life Cycle of Earnings. Journal of Political Economy 75 (4): 352-365.
Bird, Edward J. (2001). Does the Welfare State Induce Risk-Taking? Journal of Public Economics 80 (3): 357-383.
Bisin, Alberto, Thierry Verdier (2011). The Economics of Cultural Transmission and Socialization. In Handbook of Social Economics, edited by Jess Benhabib, Alberto Bisin, Matthew O. Jackson. Amsterdam: North-Holland: 339-416.
Borghans, Lex, Trudie Schils (2012). The Leaning Tower of Pisa: Decomposing Achievement Test Scores into Cognitive and Noncognitive Components. Mimeo.
Borjas, George J. (1987). Self-Selection and the Earnings of Immigrants. American Economic Review 77 (4): 531-553.
Carroll, Christopher D., Byung-Kun Rhee, Changyong Rhee (1994). Are There Cultural Effects on Saving? Some Cross-Sectional Evidence. Quarterly Journal of Economics 109 (3): 685-699.
Castillo, Marco, Jeffrey L. Jordan, Ragan Petrie (2018). Children’s Rationality, Risk Attitudes and Field Behavior. European Economic Review 102: 62-81.
Castillo, Marco, Jeffrey L. Jordan, Ragan Petrie (2019). Discount Rates of Children and High School Graduation. Economic Journal 129 (619): 1153-1181.
Castillo, Marco, John A. List, Ragan Petrie, Anya Samek (2020). Detecting Drivers of Behavior at an Early Age: Evidence from a Longitudinal Field Experiment. NBER Working Paper No. 28288. Cambridge, MA: National Bureau of Economic Research.
De Philippis, Marta, Federico Rossi (2021). Parents, Schools and Human Capital Differences across Countries. Journal of the European Economic Association 19 (2): 1364-1406.
18
Falk, Armin, Anke Becker, Thomas Dohmen, Benjamin Enke, David Huffman, Uwe Sunde (2018). Global Evidence on Economic Preferences. Quarterly Journal of Economics 133 (4): 1645-1692.
Fernández, Raquel, Alessandra Fogli (2009). Culture: An Empirical Investigation of Beliefs, Work, and Fertility. American Economic Journal: Macroeconomics 1 (1): 146-77.
Figlio, David, Paola Giuliano, Umut Özek, Paola Sapienza (2019). Long-Term Orientation and Educational Performance. American Economic Journal: Economic Policy 11 (4): 272-309.
Freeman, Richard B. (1999). The Economics of Crime. In Handbook of Labor Economics, Vol. 3c, edited by Orley Ashenfelter, David Card. Amsterdam: North-Holland: 3529-3571.
Galor, Oded, Ömer Özak (2016). The Agricultural Origins of Time Preference. American Economic Review 106 (10): 3064-3103.
Giuliano, Paola (2007). Living Arrangements in Western Europe: Does Cultural Origin Matter? Journal of the European Economic Association 5 (5): 927-952.
Gneezy, Uri, John A. List, Jeffrey A. Livingston, Xiangdong Qin, Sally Sadoff, Yang Xu (2019). Measuring Success in Education: The Role of Effort on the Test Itself. American Economic Review: Insights 1 (3): 291-308.
Golsteyn, Bart H.H., Hans Grönqvist, Lena Lindahl (2014). Adolescent Time Preferences Predict Lifetime Outcomes. Economic Journal 124 (580): F739-F761.
Grogger, Jeffrey, Gordon H. Hanson (2011). Income Maximization and the Selection and Sorting of International Migrants. Journal of Development Economics 95 (1): 42-57.
Guiso, Luigi, Paola Sapienza, Luigi Zingales (2006). Does Culture Affect Economic Outcomes? Journal of Economic Perspectives 20 (2): 23-48.
Halevy, Yoram (2008). Strotz Meets Allais: Diminishing Impatience and the Certainty Effect. American Economic Review 98 (3): 1145-1162.
Hanushek, Eric A. (1986). The Economics of Schooling: Production and Efficiency in Public Schools. Journal of Economic Literature 24 (3): 1141-1177.
Hanushek, Eric A., Jens Ruhose, Ludger Woessmann (2017). Knowledge Capital and Aggregate Income Differences: Development Accounting for U.S. States. American Economic Journal: Macroeconomics 9 (4): 184-224.
Hanushek, Eric A., Guido Schwerdt, Simon Wiederhold, Ludger Woessmann (2015). Returns to Skills around the World: Evidence from PIAAC. European Economic Review 73: 103-130.
Hanushek, Eric A., Guido Schwerdt, Simon Wiederhold, Ludger Woessmann (2017). Coping with Change: International Differences in the Returns to Skills. Economics Letters 153: 15-19.
Hanushek, Eric A., Ludger Woessmann (2011). The Economics of International Differences in Educational Achievement. In Handbook of the Economics of Education, Vol. 3, edited by Eric A. Hanushek, Stephen Machin, Ludger Woessmann. Amsterdam: North Holland: 89-200.

19
Hanushek, Eric A., Ludger Woessmann (2012). Do Better Schools Lead to More Growth? Cognitive Skills, Economic Outcomes, and Causation. Journal of Economic Growth 17 (4): 267-321.
Hanushek, Eric A., Ludger Woessmann (2015). The Knowledge Capital of Nations: Education and the Economics of Growth. Cambridge, MA: MIT Press.
Hartog, Joop, Luis Diaz-Serrano (2014). Schooling as a Risky Investment: A Survey of Theory and Evidence. Foundations and Trends in Microeconomics 9 (3-4): 159-331.
Hofstede, Geert H. (1991). Cultures and Organizations: Software of the Mind. London: McGraw-Hill.
Jung, Dawoon, Tushar Bharati, Seungwoo Chin (2021). Does Education Affect Time Preference? Evidence from Indonesia. Economic Development and Cultural Change 69 (4): 1451-1499.
Levhari, David, Yoram Weiss (1974). The Effect of Risk on the Investment in Human Capital. American Economic Review 64 (6): 950-963.
Mayer, Thierry, Soledad Zignago (2011). Notes on Cepii’s Distances Measures: The Geodist Database. CEPII Working Paper 2011-25. http://www.cepii.fr/CEPII/en/bdd_modele/presentation.asp?id=6.
Mincer, Jacob (1958). Investment in Human Capital and Personal Income Distribution. Journal of Political Economy 66 (4): 281-302.
OECD (2019). PISA 2018 Results (Volume I). Paris: OECD Publishing. Sunde, Uwe, Thomas Dohmen, Benjamin Enke, Armin Falk, David Huffman, Gerrit Meyerheim
(2021). Patience and Comparative Development. Review of Economic Studies: forthcoming. Sutter, Matthias, Martin G. Kocher, Daniela Glätzle-Rützler, Stefan T. Trautmann (2013).
Impatience and Uncertainty: Experimental Decisions Predict Adolescents' Field Behavior. American Economic Review 103 (1): 510-531.
Woessmann, Ludger (2016a). The Economic Case for Education. Education Economics 24 (1): 3-32.
Woessmann, Ludger (2016b). The Importance of School Systems: Evidence from International Differences in Student Achievement. Journal of Economic Perspectives 30 (3): 3-32.
Zamarro, Gema, Collin Hitt, Ildefonso Mendez (2019). When Students Don’t Care: Reexamining International Differences in Achievement and Student Effort. Journal of Human Capital 13 (4): 519-552.
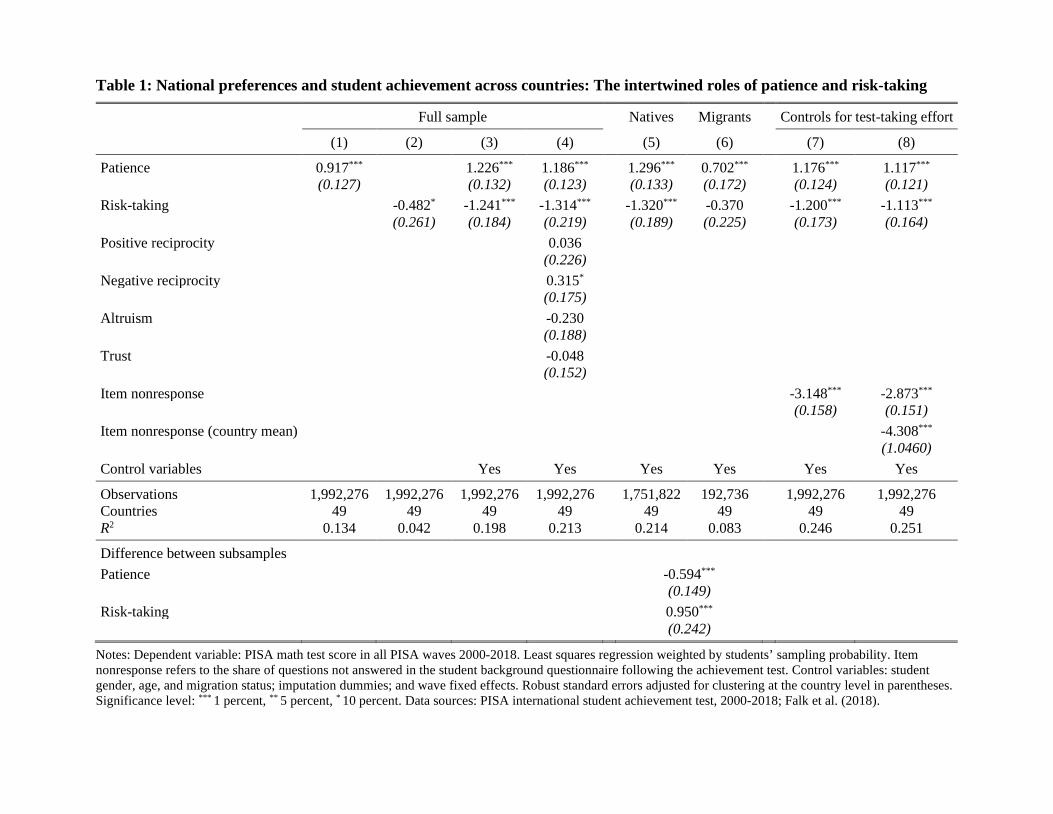
Table 1: National preferences and student achievement across countries: The intertwined roles of patience and risk-taking
Full sample Natives Migrants Controls for test-taking effort
(1) (2) (3) (4) (5) (6) (7) (8)
Patience 0.917*** 1.226*** 1.186*** 1.296*** 0.702*** 1.176*** 1.117*** (0.127) (0.132) (0.123) (0.133) (0.172) (0.124) (0.121)
Risk-taking -0.482* -1.241*** -1.314*** -1.320*** -0.370 -1.200*** -1.113*** (0.261) (0.184) (0.219) (0.189) (0.225) (0.173) (0.164)
Positive reciprocity 0.036 (0.226)
Negative reciprocity 0.315* (0.175)
Altruism -0.230 (0.188)
Trust -0.048 (0.152)
Item nonresponse -3.148*** -2.873*** (0.158) (0.151)
Item nonresponse (country mean) -4.308*** (1.0460)
Control variables Yes Yes Yes Yes Yes Yes
Observations 1,992,276 1,992,276 1,992,276 1,992,276 1,751,822 192,736 1,992,276 1,992,276 Countries 49 49 49 49 49 49 49 49 R2 0.134 0.042 0.198 0.213 0.214 0.083 0.246 0.251
Difference between subsamples Patience -0.594*** (0.149) Risk-taking 0.950*** (0.242)
Notes: Dependent variable: PISA math test score in all PISA waves 2000-2018. Least squares regression weighted by students’ sampling probability. Item nonresponse refers to the share of questions not answered in the student background questionnaire following the achievement test. Control variables: student gender, age, and migration status; imputation dummies; and wave fixed effects. Robust standard errors adjusted for clustering at the country level in parentheses. Significance level: *** 1 percent, ** 5 percent, * 10 percent. Data sources: PISA international student achievement test, 2000-2018; Falk et al. (2018).

Table 2: Patience, risk-taking, and student achievement: Migrant analysis
Full sample Language spoken at home
Controls for test-taking effort Residence Other
(1) (2) (3) (4) (5) (6) (7) (8) (9) Patience (country-of-origin) 0.779*** 0.931*** 1.032*** 0.890*** 1.021*** 0.977*** 0.718*** 0.883***
(0.115) (0.116) (0.133) (0.114) (0.100) (0.105) (0.117) (0.151) Risk-taking (country-of-origin) 0.183 -0.294** -0.449*** -0.286** -0.307** -0.303** -0.305** -0.508***
(0.210) (0.122) (0.140) (0.119) (0.120) (0.114) (0.115) (0.165) Positive reciprocity (country-of-origin) -0.141
(0.157) Negative reciprocity (country-of-origin) 0.082
(0.087) Altruism (country-of-origin) 0.042
(0.144) Trust (country-of-origin) -0.173
(0.138) Item nonresponse -2.993*** -3.218*** (0.233) (0.171) Item nonresponse (country-of-origin mean) -3.319*
(1.691) Residence-country by wave fixed effects Yes Yes Yes Yes Yes Yes Yes Yes Yes Control variables Yes Yes Yes Yes Yes Yes Yes Yes Yes Observations 80,398 80,398 80,398 80,398 80,398 36,668 36,668 48,556 24,520 Countries of origin 58 58 58 58 58 41 41 56 57 Residence countries 48 48 48 48 48 45 45 48 48 R2 0.273 0.256 0.275 0.277 0.310 0.178 0.234 0.298 0.238 Difference between subsamples Patience (country-of-origin) 0.165 (0.130) Risk-taking (country-of-origin) -0.203 (0.139)
Notes: Dependent variable: PISA math test score, waves 2003-2018. Least squares regressions, including 180 fixed effects for each residence-country by wave cell. Sample: students with both parents not born in the country where the student attends school. Item nonresponse refers to the share of questions not answered in the student background questionnaire following the achievement test. Control variables: student gender, age, dummy for OECD country of origin, imputation dummies. Robust standard errors adjusted for clustering at the country level in parentheses. Significance level: *** 1 percent, ** 5 percent, * 10 percent. Data sources: PISA international student achievement test, 2000-2018; Falk et al. (2018).

Table 3: Addressing selectivity of migrants in the migrant analysis
Continent-of-origin Cultural Migration distance Selectivity of migrant fixed effects variance Geographical Cultural schooling
(1) (2) (3) (4) (5) (6) (7)
Patience (country-of-origin) 0.976*** 0.818*** 0.925*** 0.933*** 0.870*** 0.987*** 1.048*** (0.125) (0.191) (0.117) (0.149) (0.137) (0.105) (0.106)
Risk-taking (country-of-origin) -0.331** -0.284** -0.302** -0.539*** -0. 903*** -0.300*** -0.411*** (0.127) (0.141) (0.121) (0.143) (0.179) (0.109) (0.093)
Std. dev. of patience (country-of-origin) 0.285 (0.307)
Std. dev. of risk-taking (country-of-origin) -0.241 (0.372)
Geographical distance (in 1000 km) -0.010 (0.007)
Patience (country-of-origin) -0.287 × Patience distance (0.353) Risk-taking (country-of-origin) 1.048*** × Risk-taking distance (0.217) Selectivity of migrant schooling 1.269***
(0.379)
Observations 80,398 80,398 80,398 29,019 29,019 39,725 39,725 Countries of origin 58 58 58 49 49 44 44 Residence countries 48 48 48 26 26 20 20 R2 0.276 0.275 0.276 0.236 0.239 0.192 0.196
Notes: Dependent variable: PISA math test score, waves 2003-2018. Least squares regressions. Sample: students with both parents not born in the country where the student attends school. All specifications include residence-country by wave fixed effects and control variables (student gender, age, dummy for OECD country of origin, imputation dummies). Column-specific additional control variables: Col. 1: fixed effects for continent of origin. Col. 2: standard deviation of patience and risk-taking, respectively, in country of origin obtained from individual-level GPS data using individuals’ sampling probability. Col. 3: geographical distance between respective residence and origin country according to most populous cities. Col. 5: interaction with difference in patience and risk-taking between respective residence and origin country (all variables demeaned). Col. 7: percentile of migrants’ educational attainment on respective country-of-origin schooling distribution for each residence country. Robust standard errors adjusted for clustering at the country level in parentheses. Significance level: *** 1 percent, ** 5 percent, * 10 percent. Data sources: PISA international student achievement test, 2003-2018; Falk et al. (2018).

Table 4: The association of patience and risk-taking with proximate inputs in the education production function
Family inputs School inputs Institutional inputs Residual (1) (2) (3) (4)
Upper bound Patience 0.800*** 0.069*** 0.060 0.289***
(0.087) (0.021) (0.037) (0.095) Risk-taking -0.500*** -0.017 -0.066 -0.690***
(0.139) (0.033) (0.059) (0.151)
Observations 49 49 49 49 R2 0.646 0.200 0.061 0.335
Lower bound Patience 0.382*** 0.044** -0.012
(0.062) (0.019) (0.027) Risk-taking -0.325*** 0.003 -0.009
(0.099) (0.031) (0.043)
Observations 49 49 49 R2 0.461 0.120 0.008
Notes: Country-level least squares regressions. Dependent variables indicated in column headers. Upper/lower bound refers to whether the preference variables are included in the underlying estimation of coefficients for the combination of the three input vectors. See text for details. Robust standard errors in parentheses. Significance level: *** 1 percent, ** 5 percent, * 10 percent. Data sources: PISA international student achievement test, 2000-2018; Falk et al. (2018).

Figure 1: Patience, risk-taking, and student achievement across countries Patience Risk-taking
Patience (conditional on risk-taking) Risk-taking (conditional on patience)
Notes: PISA math score: average student achievement, 2000-2018. The added-variable plot in the lower left panel is created by first regressing both variables (math achievement and patience) on risk-taking. The residuals of the two regressions are then plotted against each other. These residuals represent the part of the variation in both variables that cannot be accounted for by risk-taking, assuring that risk-taking does not drive the depicted association. This exercise is numerically equivalent to regressing math achievement on patience and including risk-taking as a control variable. The equivalent procedure is used in the lower right panel. Data sources: PISA international student achievement test, 2000-2018; Falk et al. (2018).