Embed Size (px)
Citation preview
Pathways to Student Success Vistasp Karbhari, PresidentThe University of Texas at Arlington
Association of Governing Boards of Universities and CollegesNational Conference on TrusteeshipApril 20, 2015

The New ParadigmState situated rather than state supportedRapidly changing demographicsChanging financial profile of students with changes in the economy & supportPipeline vs. PathwayDigital natives vs. analog natives and/or digital immigrants
Instinctively parallel process and multitask, prefer images over text Are attuned to, and like, receiving high-speed bursts of information Function best in a networked environment Expect education to be based on information systems that work like Google
Co-location vs. DistributedFormal Lecture vs. Studio or “Flipped” Classroom vs. “Organized” ChaosDegrees vs. Knowledge and Competency
The decrease of the “guild” model in favor of “individualized” knowledge? The transition from “degrees” through “certificates” and “badges” to “knowledge on
demand” or “knowledge in packages”
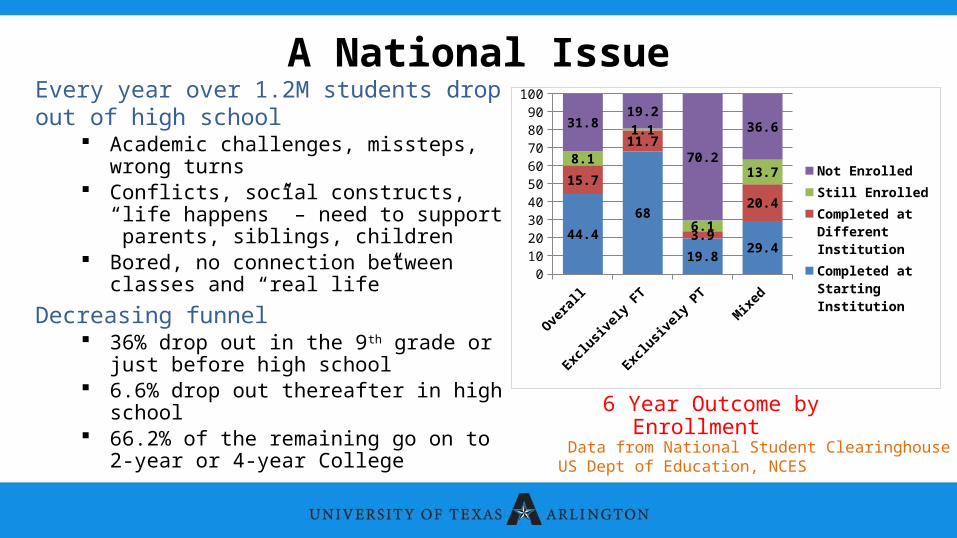
A National IssueEvery year over 1.2M students drop out of high school
Academic challenges, missteps, wrong turns
Conflicts, social constructs, “life happens” – need to support parents, siblings, children
Bored, no connection between classes and “real life”
Decreasing funnel 36% drop out in the 9th grade or just
before high school 6.6% drop out thereafter in high school 66.2% of the remaining go on to 2-year
or 4-year College
Overa
ll
Exclu
sive
ly F
T
Exclu
sive
ly P
T
Mix
ed
0
10
20
30
40
50
60
70
80
90
100
44.4
68
19.829.4
15.7
11.7
3.9
20.4
8.1
1.1
6.1
13.7
31.819.2
70.2
36.6
Not Enrolled
Still Enrolled
Completed at Dif-ferent Institution
Completed at Start-ing Institution
6 Year Outcome by Enrollment
Data from National Student Clearinghouse & US Dept of Education, NCES

A Compounding Effect
Of every 100 students coming to the 9th grade 64 continue in high school 40 go on to 2 year or 4 year college 22 will complete a college degree in 6 years 24 will complete a college degree in 8 years
Overa
ll
Exclu
sive
ly F
T
Exclu
sive
ly P
T
Mix
ed
0
20
40
60
80
100
42.166.4
17.4 27.3
13
10.8
3.6
15.7
14.7
3.2
10.4
23.7
30.319.6
68.5
33.3
Not Enrolled
Still Enrolled
Completed at Different Institution
Completed at Starting Institution
6 Year Outcome by Enrollment
Data from NSC & NCES
Overa
ll
Exclu
sively
FT
Exclu
sively
PT
Mixed
0
20
40
60
80
100
44.468
19.8 29.4
15.7
11.7
3.9
20.4
8.1
1.1
6.1
13.7
31.819.2
70.2
36.6
8 Year Outcome by Enrollment
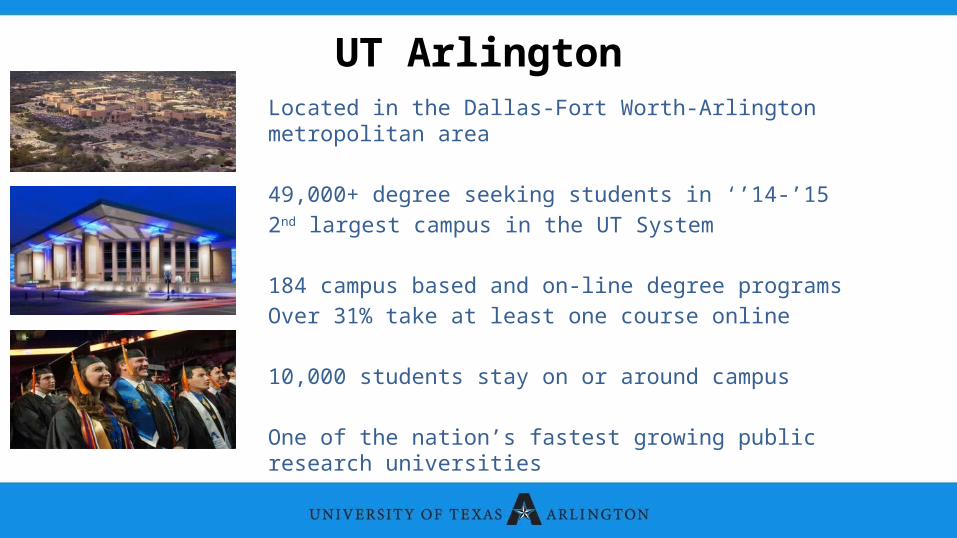
UT ArlingtonLocated in the Dallas-Fort Worth-Arlington metropolitan area
49,000+ degree seeking students in ‘’14-’15
2nd largest campus in the UT System
184 campus based and on-line degree programs
Over 31% take at least one course online
10,000 students stay on or around campus
One of the nation’s fastest growing public research universities

Some Key Features
40%
60%
First-time Freshmen, 2,710
Transfers, 4,037
New Incoming Students
38.7%
26.9%
16.0%
11.6%
3.6%2.1% 1.1%
White
Hispanic
African-American
Asian
International
Multiracial
Other
Student Ethnicity
2008-09 2009-10 2010-11 2011-12 2012-13 2013-14
0
2,000
4,000
6,000
4002 4180
5109
57816344 6736
1,792 1,8652,421
3,3052,975
2,500
113128 127 168 150
225
Doctoral
Master's
Bachelor'sDe
gre
es
Aw
ard
ed
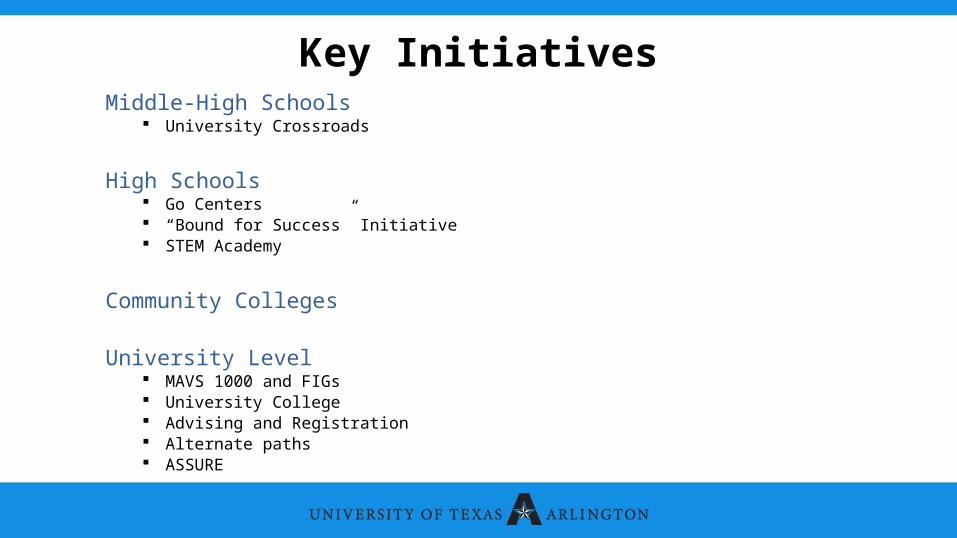
Key InitiativesMiddle-High Schools
University Crossroads
High Schools Go Centers “Bound for Success” Initiative STEM Academy
Community Colleges
University Level MAVS 1000 and FIGs University College Advising and Registration Alternate paths ASSURE
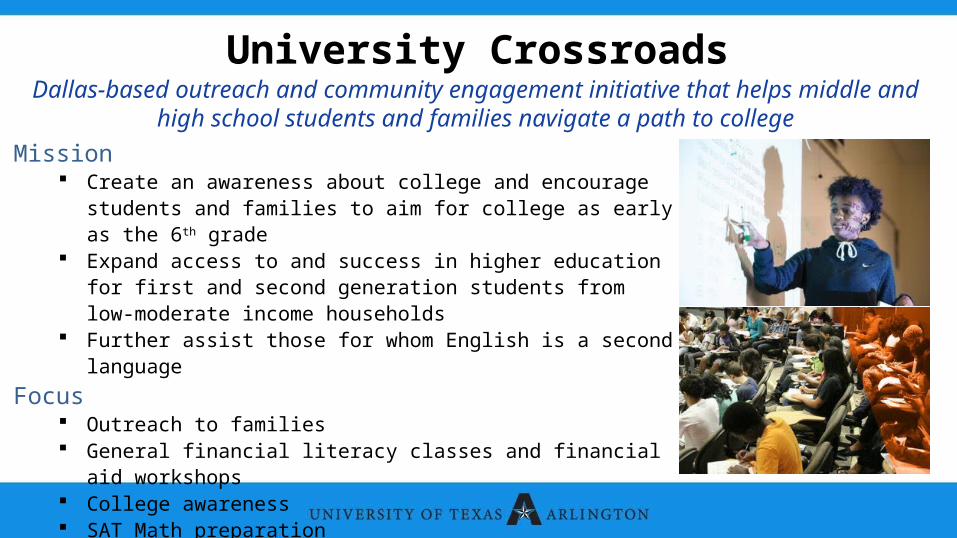
University CrossroadsDallas-based outreach and community engagement initiative that helps middle and
high school students and families navigate a path to college
Mission Create an awareness about college and encourage students
and families to aim for college as early as the 6th grade Expand access to and success in higher education for first
and second generation students from low-moderate income households
Further assist those for whom English is a second language
Focus Outreach to families General financial literacy classes and financial aid workshops College awareness SAT Math preparation
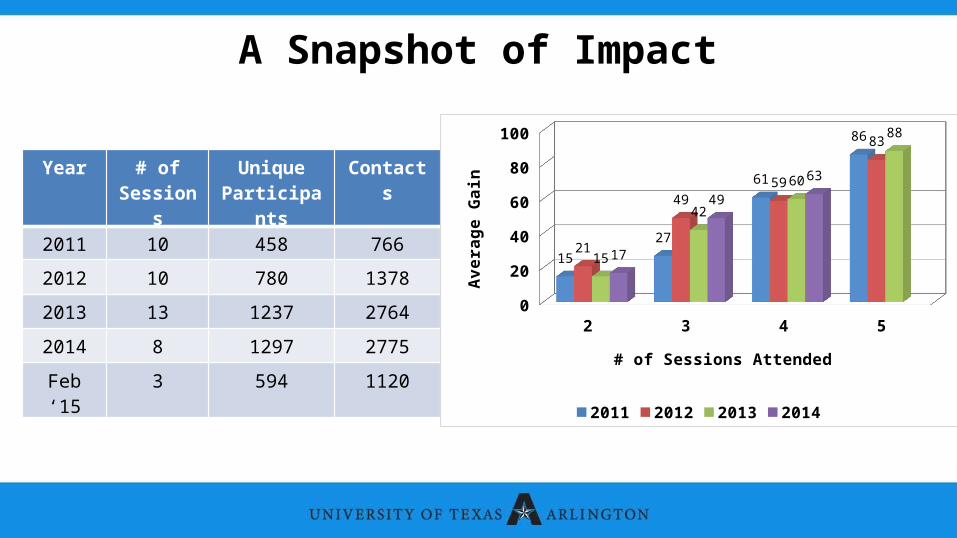
A Snapshot of Impact
Year # of Sessions
Unique Participant
s
Contacts
2011 10 458 766
2012 10 780 1378
2013 13 1237 2764
2014 8 1297 2775
Feb ‘15 3 594 1120
2 3 4 50
102030405060708090
15
27
61
86
21
49
59
83
15
42
60
88
17
49
63
2011 2012 2013 2014
# of Sessions Attended
Av
era
ge
Ga
in
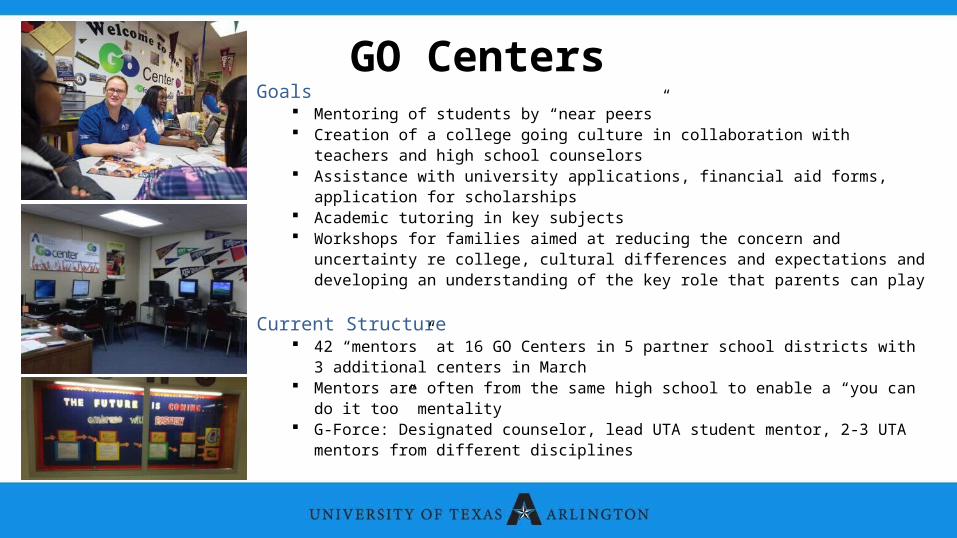
GO CentersGoals
Mentoring of students by “near peers” Creation of a college going culture in collaboration with teachers and high
school counselors Assistance with university applications, financial aid forms, application for
scholarships Academic tutoring in key subjects Workshops for families aimed at reducing the concern and uncertainty re
college, cultural differences and expectations and developing an understanding of the key role that parents can play
Current Structure 42 “mentors” at 16 GO Centers in 5 partner school districts with 3 additional
centers in March Mentors are often from the same high school to enable a “you can do it too”
mentality G-Force: Designated counselor, lead UTA student mentor, 2-3 UTA mentors
from different disciplines
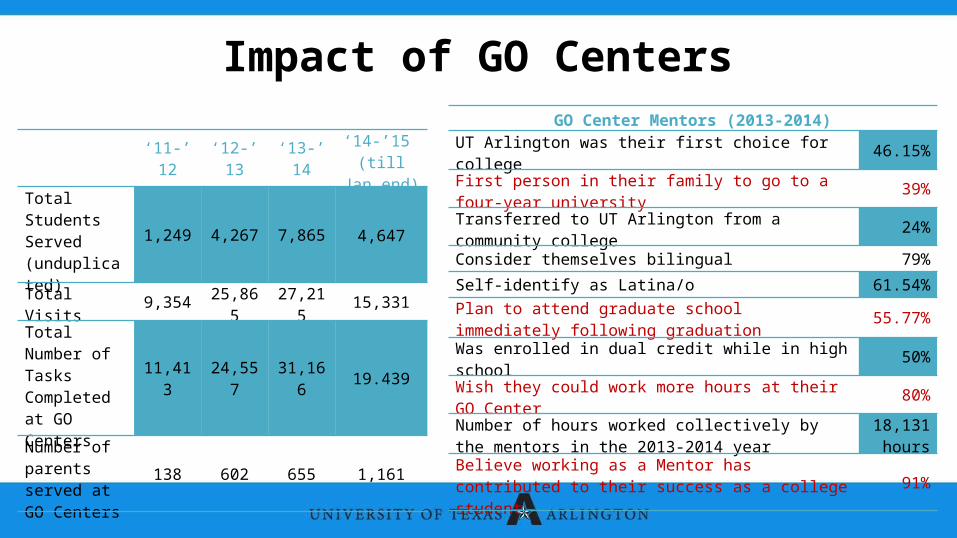
Impact of GO Centers
‘11-’12 ‘12-’13 ‘13-’14‘14-’15 (till Jan
end)Total Students Served (unduplicated)
1,249 4,267 7,865 4,647
Total Visits 9,354 25,865 27,215 15,331
Total Number of Tasks Completed at GO Centers
11,413 24,557 31,166 19.439
Number of parents served at GO Centers
138 602 655 1,161
GO Center Mentors (2013-2014)
UT Arlington was their first choice for college 46.15%
First person in their family to go to a four-year university 39%
Transferred to UT Arlington from a community college 24%
Consider themselves bilingual 79%
Self-identify as Latina/o 61.54%
Plan to attend graduate school immediately following graduation
55.77%
Was enrolled in dual credit while in high school 50%
Wish they could work more hours at their GO Center 80%
Number of hours worked collectively by the mentors in the 2013-2014 year
18,131 hours
Believe working as a Mentor has contributed to their success as a college student
91%
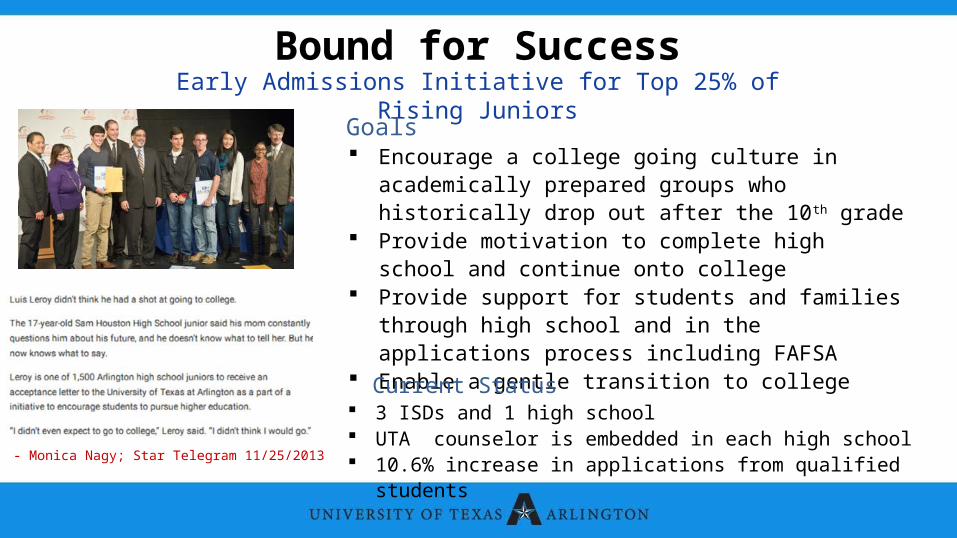
Bound for SuccessEarly Admissions Initiative for Top 25% of Rising Juniors
- Monica Nagy; Star Telegram 11/25/2013
Goals Encourage a college going culture in academically
prepared groups who historically drop out after the 10th grade
Provide motivation to complete high school and continue onto college
Provide support for students and families through high school and in the applications process including FAFSA
Enable a gentle transition to college
Current Status 3 ISDs and 1 high school UTA counselor is embedded in each high school 10.6% increase in applications from qualified students
Transition to CollegeMAVS 1000 Mandatory first year experience course (no credit, no tuition) Focused on enabling skills, building networks, and introducing resources Class size restricted to 25 with an instructor and a peer leader Provides support and an efficient “early warning” and “intervention” system Follow up mechanism in subsequent semesters with a focus on advising, registration &
progression
Freshman Interest Groups (FIGS) Small cohorts enrolled in classes together with specialized peer mentoring and select
residential communities Focused on key majors
Status Fall ’14: 1,724 enrolled in MAVS 1000, 549 in FIGs Increased retention Fall to Spring 1 year retention rate for FIGs was 9.3% than the university average

Additional SupportProject CAR (central Advising Record) All records and notes for a student are available centrally at a single location and are
constantly updated All advisors have access to the most recent notes, performance, and information for a student
Student Success Collaborative (with the EAB) Platform to identify key at-risk students for early intervention and assistance for on-time
progression Assistance in selecting alternate majors based on interest and minimum number of additional
courses
Registration Focused registration of a minimum of 15 hours at orientation and thereafter (15 to Succeed) Guaranteed registration and availability of courses 1 year in advance Early alert system to ensure reach out through specially trained advisors
ASSURE
Replacement of repetitive undergraduate freshman and sophomore labs with scalable, research experiences Curricular reform to enhance enquiry and discovery Use of research as a tool for motivation and retention Incorporate doctoral students as part of their learning experience
Structure Faculty design a guided research program (stream: e.g. Drug discovery) for the
curriculum Multiple students work on it simultaneously 3 semester sequence (Research methods Guided research experience original
research experience within the project framework) Ensures team work, communications skills, link to major
Achieving Success in Science through Undergraduate Research and Engagement

Summary We are at the tipping point and elitism will not help us or the nation
Changes in demographics demand that we change our approach
The family is often as important, if not more important, than the student as related to the decision to continue with higher education
Processes (application, FAFSA, financial aid, selection of type of College) are confusing and can scare qualified applicants away
There is a need for greater integration along the PK-16 pathway
We live in an era of pathways not pipelines and hence clarity, articulation, and collaboration are the key
Our job as leaders in higher education is to be understanding of our constituency and the demands placed on them, and to be innovative and collaborative


![[v.M. Karbhari, F. Ansari] Structural Health Monit(Bokos-Z1)](https://img.pdfslide.us/doc/110x75/55cf8ab155034654898cff74/vm-karbhari-f-ansari-structural-health-monitbokos-z1.jpg)