Embed Size (px)
Citation preview
1
WORKING PAPER
Pathways to El Norte: Origins, Destinations, and Characteristics of Mexican Migrants to the United States Fernando Riosmena Douglas S. Massey June 2010 Population Program POP2010-02
_____________________________________________________________________________
Pathways to El Norte:
Origins, Destinations, and Characteristics of Mexican Migrants to the United States
Fernando Riosmena
Population Program and Department of Geography
University of Colorado at Boulder
Douglas S. Massey
Office of Population Research and Department of Sociology
Princeton University
Acknowledgements: We thank Luis Felipe Ramos Martínez and Jorge Valencia for guidance
with the use of the ENADID data and Nancy D. Mann for her careful editing and suggestions.
We acknowledge administrative and computing support from the NICHD-funded University of
Colorado Population Center (grant R21 HD51146). Please send correspondence to
1
Pathways to El Norte:
Origins, Destinations, and Characteristics of Mexican Migrants to the United States
Abstract
In this paper, we investigate how old and new migrant networks have fueled the eastward
expansion of Mexican migration using a nationally representative survey in Mexico that for the
first time collected information on state of destination in the US for household members
emigrating in the five years before the survey. Migrants going to new destinations in the US
South and East are more likely to come from less traditional sending regions in Central and
Southeast Mexico. We discuss how economic restructuring in both Mexico and the US might
have contributed towards the growth and expansion of Mexican migration.
Keywords: Migration; immigration; Mexico; United States; origins; destinations; gateways;
economic restructuring; industrial restructuring
2
1 Introduction
The geography of Mexico-US migration has experienced deep transformations in recent
decades as migrant origins and destinations have diversified away from their traditional Mexican
sources and US gateways. The heartland for emigration to the United States has historically
been Mexico’s West-Central region, composed of the states of Guanajuato, Jalisco, Michoacán,
San Luis Potosí, and Zacatecas. Since early in the twentieth century, these “big five” states have
accounted for a majority of all emigrants to the United States (Durand et al., 2001). Over the
past two decades, however, new regions of origin have emerged in response to changes in the
Mexican political economy under neoliberal restructuring (Durand and Massey, 2003, Massey et
al., 2008, Nevins, 2007).
Within the United States, the geographic destinations of Mexican immigrants have also
diversified in response to economic restructuring and shifting immigration policies and border
enforcement practices. Before the 1990s, around 85% of all Mexican migrants went to just three
states: Texas, Illinois, and California, with the latter receiving upwards of 60% all by itself
(Massey and Capoferro, 2008). By the late 1990s, however, the share of new arrivals settling in
California dropped from two-thirds to one-third, with the bulk of the difference being absorbed
by new states of destination in the Northeast, such as the tri-state area of New York, New Jersey,
and Pennsylvania; the Southeastern region, including North Carolina, Georgia, and Florida; and
states in the West, such as Colorado and Nevada (Durand et al., 2005, Massey and Capoferro,
2008). In addition, during the 1990s a large number of immigrants living in traditional gateway
states migrated internally to new destinations in the South and Midwest (Census, 2004).
Although these changes have affected the internal and international migration patterns of
a variety of national groups (Massey, 2008, Singer, 2004), they have been particularly marked in
3
the case of Mexican immigration, transforming it from a regional into a national phenomenon
within just a few years (Durand et al., 2005, Massey, 2008). At the same time, the increased
costs and risks of undocumented border crossing have compelled migrants to remain in the
United States rather than circulating back and forth, and rates of return migration have
plummeted to record low levels (Massey et al., 2002), especially among undocumented migrants
from high-emigration areas (Riosmena, 2005: Chapter 3). The Mexican immigrant population
has not only grown more dispersed geographically, it has also become more permanent.
Until now, the geographic diversification of immigrant origins and destinations has been
studied mainly using census and survey data drawn from each side of the border. In Mexico, the
Decennial Census and the Encuesta Nacional de la Dinámica Demográfica ask which household
members have been to the United States during the preceding five years. Tabulating the number
of people by state and municipality offers a snapshot of the geographic origins of recent US
migrants (or recent return migrants, depending on how the question was asked), and cross-
classifying them by individual, family, and household characteristics yields a socioeconomic
profile (see Durand et al., 2001, Massey and Zenteno, 2000). In the United States, the Decennial
Census and Current Population Survey ask place of birth and year of entry for those born abroad,
enabling social scientists to examine the distribution of Mexican immigrants by state, county,
and metropolitan area and to measure trends in migrant characteristics by period of entry (see
Massey and Capoferro, 2008).
Until recently, however, there was no way to connect information on places of origin
with data on places of destination. In the United States, for example, we knew where Mexican
migrants were located, but had no idea where they came from; likewise, in Mexico, we knew
where those with recent US experience had their Mexican residence, but we had no information
4
on where they had been living in the US. We thus knew little about specific place-to-place
flows—not even their size, much less the characteristics of the immigrants involved and how
they might differ from place to place.
This situation has changed with the appearance of two new data sources.1 The first
comes from Mexico’s Matrícula Consular Program, which provides a registration document to
nationals who register with Mexican Consulates abroad. Issued since 1871, the document was
originally a paper certificate that recorded the foreign address of the bearer, but in response to
the rising number of undocumented migrants living north of the border and the growing
repression directed against them, beginning in March 2002 the ID card underwent major changes
and was replaced by a high security, wallet-sized card that uses the same security standards as
the Mexican passport, thereby enabling its use for identification purposes in the United States
(Instituto de los Mexicanos en el Exterior 2004).
By the end of 2006, some 5.7 million consular ID’s had been issued (Dalton and Gordon
2005) and the Instituto de los Mexicanos en el Exterior prepared a sample of nearly one million
registrants and published the data on the internet (http://www.ime.gob.mx/estados.htm). These
data cross-classify state and region of origin in Mexico with state and city of destination in the
United States to identify specific place-to-place flows, which Massey, Rugh, and Pren
(Forthcoming) have analyzed. They found that by 2006, US migration had moved well beyond
its historical origins in West-Central Mexico and had come to embrace sending communities in
the Central, Southeast, and Border regions. Although Massey et al. found traditional gateways
continued to dominate destinations in the United States, a variety of newer gateways had
emerged in the south and Midwest by 2006, and California had lost its overwhelming dominance
as a favored destination.
5
A second new source of data also became available recently: Mexico’s 2006 Encuesta
Nacional de la Dinámica Demográfica (ENADID), which in that year for the first time asked
household members with US experience where they had gone in the United States, also enabling
the identification of specific flows. In this paper, we build on the earlier work of Massey et al.
(Forthcoming) using the Matrícula Consular and here draw upon ENADID data to characterize
the size and composition of specific migratory flows. Although the Matrícula Program and
ENADID both offer means of identifying specific place-to-place flows, they have
complementary strengths and weaknesses. While the Matrícula data are available for a very large
sample, they only cover undocumented residents of the United States and are not even
necessarily representative of that population, since the sample only includes those who
voluntarily came forward to register for the consular ID, which presumably includes people who
are better established as US residents. In addition, the Matrícula data only offer aggregate
tabulations, making it impossible to study characteristics and behaviors at the individual level.
Although the ENADID offers a much smaller number of cases it is a probability sample
that yields an unbiased nationwide snapshot of all persons who had migrated to the United States
over the preceding five years, including both legal and undocumented migrants, as long as
someone in their household remained behind to report their experience. Moreover, the data are
available at the individual level, so that multivariate models of the determinants of migration and
destination choice can be estimated, though explanatory variables are limited to standard socio-
demographic indicators and exclude many factors specifically relevant to migration decision-
making, such as access to social capital through migrant network connections.
2 Origins and destinations of Mexico-US migration
6
Given the relatively small number of migrants enumerated within the ENADID (just shy
of 2,500), we focus on region-to-region rather than state-to-state flows. Although this approach
has the obvious drawback of ignoring intra-regional shifts in migrant origins and destinations,
the analyses stemming from our regional classification provide—albeit in broad strokes—a clear
picture of the changing geography of Mexican migration. We use the regional classification
scheme developed by Durand and Massey (2003: Chapter 3), who divided Mexico into four
distinct regions of origin. The Historical Region includes the west-central states of Durango,
Zacatecas, San Luis Potosí, Aguascalientes, Guanajuato, Jalisco, Nayarit, Colima, and
Michoacán. According to information from the large variety of sources examined by Durand
and Massey (2003), from the 1920s onward the share of immigrants coming from the Historical
Region was at least 50% and peaked at 60%-70% in the late 1970s (see tables 3.3 and 3.4).
Up until the mid-1990s, the second most important sending region was the Border
Region, which includes the states of Baja California, Baja California Sur, Sonora, Sinaloa,
Chihuahua, Coahuila, Nuevo León, and Tamaulipas. According to Durand and Massey (2003:
Tables 3.6 and 3.7), between 20 and 28% of migrants historically came from these eight states,
but after the mid-1990s this share fell below 20%, dipping to 11% by 2000, as the region came to
house the most rapidly growing economic sectors in Mexico (Hanson, 2003). As a result, border
residents are now less likely to migrate to the United States than inhabitants of other regions of
Mexico (Fussell, 2004, Fussell and Massey, 2004).
Not only the Border but also the Historical Region has seen its share of all migrants
reduced in the past three decades, as two new regions came on line: the Central Region, which
includes the states of Querétaro, México, Distrito Federal, Hidalgo, Tlaxcala, Morelos, Puebla,
Guerrero, and Oaxaca, and the Southeastern Region, which includes Veracruz, Tabasco,
7
Chiapas, Campeche, Quintana Roo, and Yucatán. The Central Region was relatively
unimportant until 1980, accounting for no more than 10% of migrants to the US, but rose
steadily thereafter to reach just over 30% by century’s end (Durand and Massey, 2003: Tables 9
and 10). Mexico’s Southeastern Region also remained insignificant as a migration source until
recently, contributing fewer than 2% of migrants through the early 1990s (Durand and Massey,
2003: Tables 12 and 13). After 1993, however, the implementation of the North American Free
Trade Agreement and the end of import substitution industrialization transformed the agrarian
economy and triggered large-scale displacements from the countryside (Delgado-Wise and
Márquez Covarrubias, 2007, Massey et al., 2008, Nevins, 2007). By the end of the millennium,
migrants from this region composed 7% of the total (Durand and Massey, 2003: Table 13).
Durand and Massey (2003) also divided the United States into eight regions of
destination for heuristic purposes. We use this regional classification, with one exception noted
below, while also grouping regions into three main types according to the historical evolution of
Mexican migration in terms of magnitude and historical continuity. Here we follow the spirit of
a typology developed by Singer (2004) in her depiction of metro-area immigrant gateways,2
using state-level trends in Mexican immigration from the 1910-2000 US Censuses as reported by
Durand et al. (2005) and Massey and Capoferro (2008).
First, Traditional Gateways are those regions with the longest history of Mexican
migration and the largest inflows on a continuing basis. These clearly encompass most of the
Borderland Region, comprising California, Arizona, New Mexico, and Texas, as well as the
Chicago Metropolitan Area, located in the Great Lakes region, which embraces the states of
Indiana, Illinois, Wisconsin, Michigan, and Ohio.
8
Second, Re-emerging Destinations include cities and states in the West and Midwest that
received non-trivial numbers of immigrants before 1920 or during the Bracero Era of 1942-1964,
but which declined during the Undocumented Era from 1965 to 1985, resurging during the 1980s
and 1990s (e.g. places in Colorado, Kansas, Oklahoma, Oregon, see Durand et al., 2005). In this
category we also include regions that experienced significant migration during the first years of
the Undocumented Era but stagnated for a time before reviving in the late 1980s and 1990s (e.g.,
the Yakima ValleyDarian, 2006). We thus include as re-emerging destinations in the
Northwestern states of Washington, Oregon, Idaho, Nevada, and Utah, as well as the Great
Plains Region. Although Durand and Massey (2003) distinguished the Upper Plains (Montana,
Wyoming, the Dakotas, and Minnesota) from the Lower Plains (Colorado, Nebraska, Kansas,
Oklahoma, Missouri, and Iowa), here we collapse these two categories for reasons of statistical
power.
Finally, we characterize states in the rest of the continental United States as New
Destinations, divided into three regions located east of the Mississippi where Mexican migration
was by and large non-existent or very small before the 1980s: except for Florida and New York,
large flows of Mexican migrants into these states are a recent phenomenon. The Southeast
Region is composed of Maryland, the District of Columbia, the Virginias, the Carolinas,
Georgia, and Florida. The South includes Arkansas, Louisiana, Mississippi, Alabama,
Tennessee, and Kentucky; and finally, the Northeast spans Maine, Vermont, New Hampshire,
Massachusetts, Rhode Island, Connecticut, New York, New Jersey, Pennsylvania, and Delaware.
According to this scheme, in 2006 61% of all undocumented Mexicans lived in the Borderlands,
with 12% in the Great Lakes, 10% in the Southeast, 9% in the Northwest, and 2-3% each in the
Northeast, South, Upper Plains, and Lower Plains (Massey et al., Forthcoming).
9
3 Data and methods
The Encuesta Nacional de la Dinámica Demográfica (ENADID), or National Survey of
Population Dynamics, is based on a stratified, multi-stage probability sample of 41,926
dwellings. The sample was designed to obtain information representative of the nation, states,
metropolitan areas, mid-sized urban areas, and rural areas (INSP, 2008).3 The ENADID is a
semi-continuous survey of repeated cross-sections, the first of which was carried out in 1992 by
the Mexican Statistical Office (Instituto Nacional de Estadística, Geografía e Informática, or
INEGI). Its purpose was to obtain information on a variety of demographic processes, including
mortality, fertility, reproductive health, and internal and international migration. Subsequent
cross-sections of the survey were implemented in 1997 and most recently, in 2006. The latter
was a collaboration between four Mexican government institutions: the Ministry of Health,
INEGI, the National Institute of Public Health, and the National Population Council.
Within each household surveyed by the ENADID in 2006, fieldworkers enumerated all
persons who “normally” resided there, even if they were temporarily absent, and obtained basic
socio-demographic information for all residents. People currently in the United States are
included in the data as long they are still considered by respondents to reside "normally" in the
household. We identify recent US migrants as those currently in the United States or who had
left and returned between January 2001 and the time of the survey (63% were still in the US, see
table 2 below). This definition clearly does not include members of entire households that left
for the United States without returning during the reference period.
Here we focus attention on household members old enough to engage in independent
migration as the emigration of children and other dependents tends to occur in tandem with that
10
of other household members, making it highly likely that it is under-estimated by the proxy
reports of members left behind. We thus set a lower bound for inclusion at age 15, thus yielding
a sample of 100,963 individuals, 2,477 of whom had US migratory experience. The ENADID
2006 questionnaire asked 2001-2006 migrants several questions about their last US trip,
including documentation held by the migrant and state of destination in the US (“¿A qué estado
de los Estados Unidos se fue la última vez?”). Some 83% of migrants (2,061 individuals)
provided valid information on state of destination. This last question was not asked in previous
versions of the survey or in the 2000 Census Migration Supplement, making it possible for the
first time to identify specific interregional flows from a nationally-representative source.
We use the Durand-Massey regional classifications to characterize differences in the
composition of origin-destination flows and to understand differences in the profile of migrants
coming from and going to specific regions. That is, we select migrants who left specific origin
regions, went to specific destination regions, and participated in specific interregional flows and,
stratifying by region of origin and region of destination we tabulate urban-rural origins,
documentation status, return probability, trip duration, age, gender, education, marital status, and
household position. We also estimate logistic regressions predicting the likelihood of migration
from and to different regions controlling for these same variables. In order to determine whether
the determinants of migration differ geographically, we estimate equations separately by region
of origin and region of destination and test for differences between coefficients. We also
estimate a multinomial logit model predicting emigration to (1) traditional and re-emerging
gateways (our data lacked the power to look at these separately) and (2) new destinations in the
South, East, and Northeast, both relative to not migrating. Before turning to these multivariate
11
analyses, we first describe the basic characteristics of migrants participating in specific origin-
destination flows.
4 Origins, destinations, and characteristics of migrants
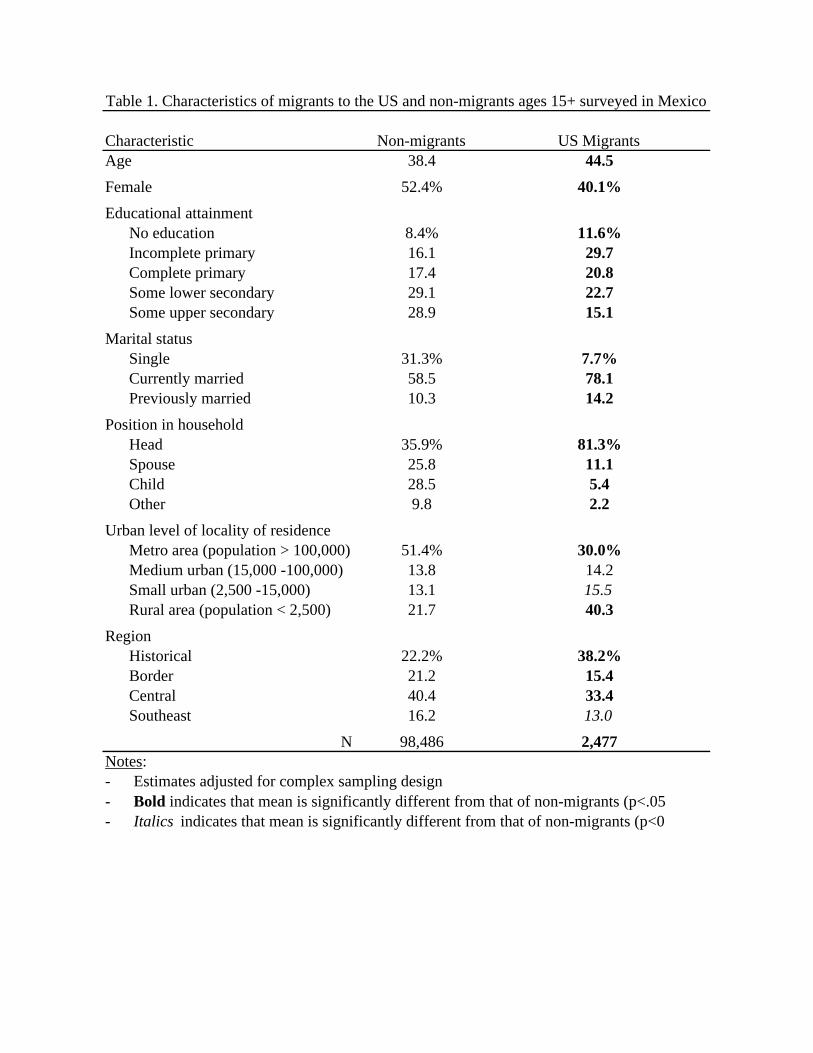
Table 1 presents general socio-demographic characteristics for the 2001-2005 US-bound
migrants (N=2,477) and non-migrants (N=98,486) derived from our sub-sample of individuals
15 and older. Although the age structure of migrants tends to be quite young, those in the sample
are older, on average, than the general Mexican population (44.5 vs. 38.4), because the latter still
has a quite youthful structure and the former includes those making return trips to the US as well
as those going for the first time. While women are under-represented in the flow (40% vs. 52%
in the general population) they represent a larger share of it than in the past (cfr. Durand et al.,
2001: Table 2). Some female moves are independent of male migration (Kanaiaupuni, 2000),
whereas others are tied to family reunification, oftentimes by way of legal migration (Cerrutti
and Massey, 2001, Donato, 1993, Riosmena, forthcoming). Migrants and non-migrants differ in
educational attainment, partly because migrants are older. Relative to non-migrants, migrants
have higher proportions of persons with no schooling (12% vs. 8%), incomplete primary
education (30% vs. 16%), and completed elementary education (21% vs. 17%), and lower
proportions with some lower secondary (23% vs. 29%) and some upper secondary (15% vs.
29%).
Given differences in age structures, it is not surprising that migrants are considerably less
likely to be single than non-migrants (8% vs. 31%) and more likely to be either currently or
previously married (78 vs. 59% and 14 vs. 10% respectively). Age, gender, and marital status
12
differences are reflected in the household position of migrants. Household heads are over-
represented in the migrant flow by a large margin (81 vs. 36%).
As Durand et al. (2001) point out, the growing representation of urban origins among
migrants partly stems from the urbanization Mexico has undergone since the 1950s (Garza,
2003), as villages have become towns and towns have become cities. Although the majority of
migrants no longer come from rural areas, they are still over-represented in the flow: 40% of
migrants come from rural areas, while only 22% of the Mexican population lives in rural
localities. As shown in the table, small urban areas (2,500-15,000 inhabitants) are also slightly
over-represented in the migrant flow (16%, vs. 13% for non-migrants) whereas medium-sized
urban areas (15,000-100,000 inhabitants) yield around 14% for both migrants and non-migrants.
The proportion of people coming from medium-sized cities has in fact remained strikingly stable
since the 1970s, fluctuating non-monotonically between 11 and 15% (Durand et al., 2001).
Although the share of migrants coming from metropolitan areas has been on the rise (Durand et
al., 2001, Hernández-León, 2008), these areas are still under-represented in the flow. While
more than half of all Mexicans live in metro areas, only 30% of US migrants come from such
places, results that are consistent with the hypothesis that mechanisms associated with the
cumulative causation of migration (Massey, 1990) do not operate as efficiently in large urban
settings because of their higher economic dynamism and diversity and greater anonymity and
impersonality (Fussell and Massey, 2004).
The regional composition of migration underscores continuities in the Historical Region
and changes elsewhere. Although our results indicate that the Historical region no longer
generates more than half of the flow (cfr. Durand and Massey, 2003, Durand et al., 2001) and
presently accounts for only 38% of the outflow, it is still the largest source region for US
13
migrants and the only one over-represented in the flow relative to its share of the population
(only 22% of Mexicans aged 15 and over live in this region). In contrast, 15% of recent migrants
come from the Border Region, a slight under-representation relative to its share of the total
population at 21%. The same is true for the Central and Southeastern Regions, which compose
33% and 13% of the migrant flow respectively but 40% and 16% of the Mexican population.
These figures are generally consistent with those of previous studies (cfr. Durand et al., 2001);
but they also suggest that migrants from less traditional sending regions are joining the flow at
very rapid rates: the share originating in the Southeast, for example, increased from 7% in 2000
(Durand and Massey, 2003: Table 13) to the estimated 13% in 2006.
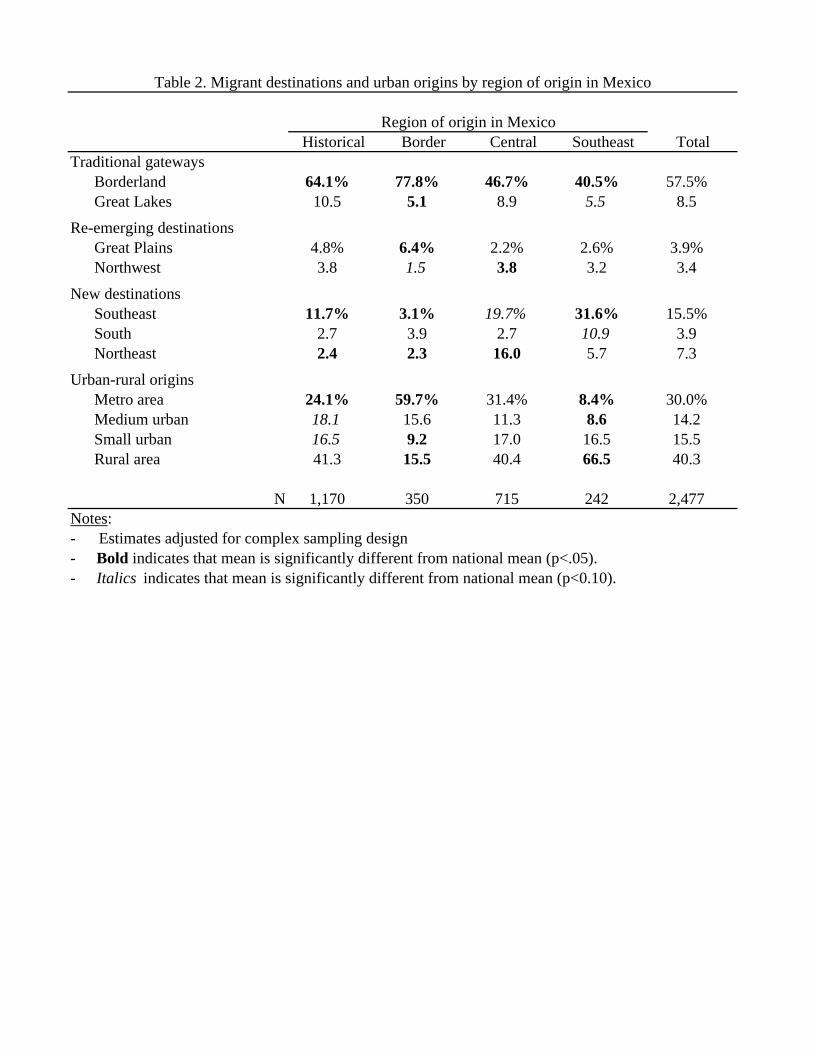
We now consider the characteristics of recent migrants (including their region of
destination) by region of origin. Table 2 shows the regional distribution of destinations of 2001-
2006 US migrants to reveal that around two-thirds still go to traditional gateways along the US
border (California, Texas, Arizona, New Mexico at 58% combined) or to the Great Lakes Region
(9%). Nonetheless, our results indicate that a sizable minority of migrants now go to less
traditional gateways directly from Mexico, in addition to whatever internal movement occurs
among Mexicans living in the United States (Census, 2004). As can be seen, many more people
presently migrate to new destinations in the South and East than to re-emerging destinations in
the West and Midwest. Only a small share (around 8%) of the flow goes to places that received
a significant number of migrants before the Bracero Program (e.g., Colorado and Kansas) or
thereafter (e.g. in the Northwest as Nevada and Washington state, see Durand et al., 2005). In
contrast, new destinations east of the Mississippi and outside the Great Lakes region have
received over a quarter of recent flows, a remarkable fraction given their newness. The
Southeast accounts for the bulk of these new flows (16% of the total,(particularly in various
14
location in Georgia and North Carolina, see Durand et al., 2005: Table 1.2)), followed by the
Northeastern Region (7%) and the South (4%). The Great Plains (4%) and Northwest (3%) lag
well behind.
-TABLE 2 ABOUT HERE-
The composition of destinations is strikingly different across Mexican regions. Not
surprisingly, flows from the Historical Region are disproportionately concentrated in traditional
destinations in the US Borderland Region (64% vs. 58%, p<0.05), the Great Lakes area (11% vs.
9%), the Great Plains (6% vs.4%), and the Northwest (3% vs. 2%). In sharp contrast, migrants
from the Historical Region are under-represented at new destinations in the Southeast (12% vs.
16%) and the Northeast (2% vs. 7%, p<0.05 in both cases). Again not surprisingly, the vast
majority (78%) of migrants from border Mexican states go to the Borderland Region, the only
region where they are over-represented (cf. second and rightmost panels of table 2). Central and
Southeastern-origin migrants are generally under-represented in traditional gateways. “Only”
47% and 41% of migrants from the Central and Southeast Regions go to locations in California,
Arizona, New Mexico, and Texas (again, compared to 58% for all migrants), whereas both
regions are over-represented in flows to the burgeoning Southeastern Region (20% and 32%
respectively, vs. 16% nation-wide).
Migrants leaving Southeastern Mexico also go disproportionately to the South (11% vs.
4%), while those emigrating from Central Mexico go disproportionately to the Northeast (16 vs.
7%). This characterization does not vary substantially if one uses the destination composition of
migrants leaving the Historical Region as the benchmark for comparison: migrants from
Mexico’s Border Region are disproportionately located in the US Borderland region, whereas
those from Central and Southeastern Mexico are more concentrated in new destination areas in
15
the Southeastern United States (from both regions), South (just Southeastern migrants), and
Northeast (Central region migrants).
The urban-rural origin of migrants also varies noticeably by region, with the sharpest
contrast being between the Border Region (more metropolitan) and the Southeast Region (more
rural), whereas migrants from the Historical and Central Regions have relatively similar
distributions. In the Historical Region, migrants from metropolitan areas are slightly under-
represented (24% vs. 30% for all flows) while those from medium and small urban areas are
slightly over-represented at 18% and 17% relative to their shares among all migrants (14% and
16%). The rural-urban origins of migrants from the Central region are not significantly different
from migrants at large, meaning that rural and small urban areas are over-represented and
metropolitan areas under-represented. Migrants from the Border region, however, are much
more likely to come from metropolitan areas (60 vs. 30% for all migrants) and least likely to
come from rural areas (16 vs. 40% for all migrants).
At the other extreme, migrants from the Southeast are considerably more likely to come
from rural areas (67 vs. 40%) and least likely to come from metropolitan areas (8 vs. 30%). This
is not just because the Border region has experienced a much more rapid urbanization than the
South (Garza, 2003). Metropolitan areas are still under-represented among migrants in the
Border region (60%), compared to that region’s total urban-rural composition (68%, not shown
in table 2), though this under-representation is by far the smallest among the four regions. Nor is
it just because the Southeast is the least urbanized region, at 31% metropolitan vs. 44, 68, and
56% for the Historical, Border, and Central regions respectively (according to our calculations
using ENADID data, not shown in table 2). The Southeast’s proportion of metropolitan migrants
16
is still far lower, at 8%. Hence, other factors must be shaping the pattern in urban/rural origins of
migrants from these two areas.
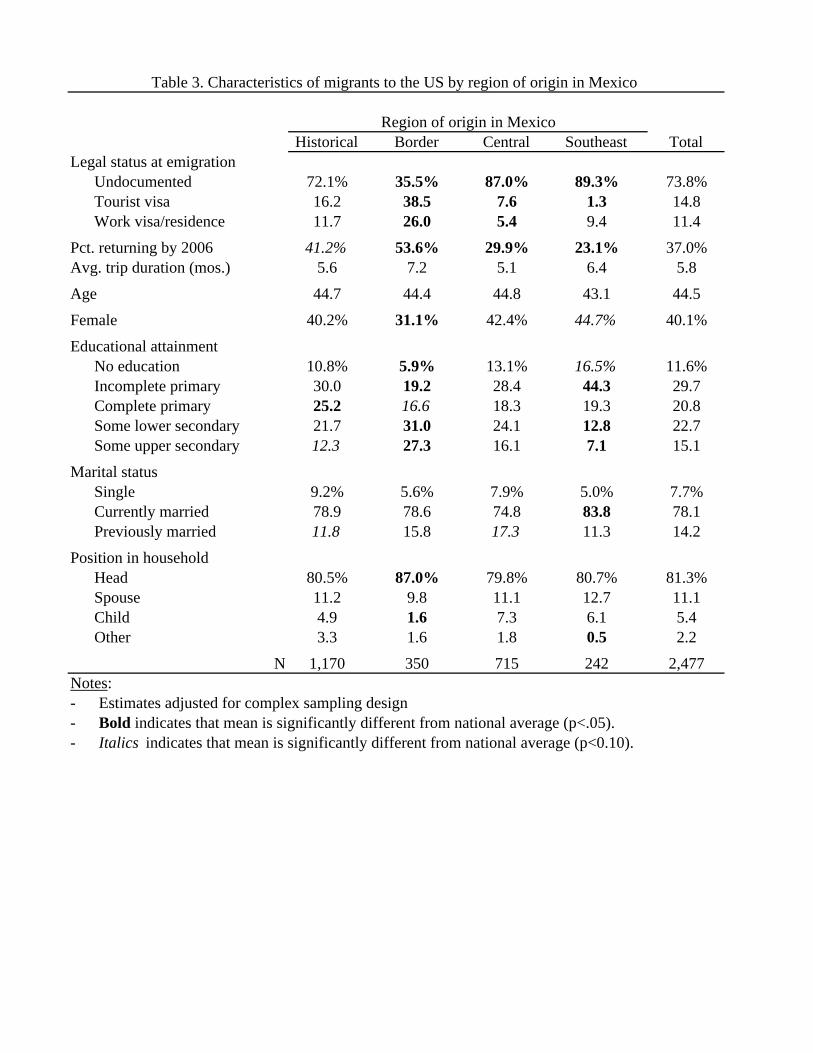
Table 3 tabulates individual-level characteristics of migrants by region of origin,
including documentation and return behavior as well as socio-demographic traits (the rightmost
panel shows the total for all migrants regardless of region). There are some interesting
differences in documentation used by migrants from different sending regions. Whereas the vast
majority of migrants from the Historical (72%), Central (87%), and Southeast (89%) Regions
crossed the border without documents, only 36% of migrants from the Border Region did so.
Border residents were more likely to cross using tourist visas (39%) or legal work/residence
documents (26%). The percentage of migrants from other regions using tourist visas and
work/residence permits was much lower. The share using a tourist visa was just 16%, 8%, and
1% in the Historical, Central, and Southeastern Regions, respectively, whereas the share using a
work/residence permit was just 12%, 5%, and 9% in these states
-TABLE 3 ABOUT HERE-
Return rates (truncated at the time of the survey) also seem to vary considerably across
regions, suggesting that flows from the Border and Historical Regions may be more likely to be
of short duration. Migrants from the Border Region were the most likely to return by the time of
the survey (54% did), followed by those from the Historical Region at 42%. In contrast, only 30
and 23% of migrants from the Central and Southeast Regions had returned from the US by the
survey date. For those returning in the short run, however, mean trip durations did not fluctuate
very much, averaging between 5 and 7 months across regions. Mean ages also do not oscillate
very much, ranging from 43 to 45 years across regions, differences that are not statistically
different from one another.
17
In the Border and Southeast Regions migrants differ along two key socio-demographic
dimensions: gender and educational attainment. The proportions of women is 40% in the
Historical Region and 42% in Central Regions, both close to the overall average of 40%; but
among Southeastern migrants the proportion of women is slightly higher than average, at 45%
(p<0.10), while in the Border region it is significantly lower at 31%. Similarly, schooling levels
for migrants in the Central and Historical Regions closely parallel national averages for all
migrants, and once again the Border and Southeast Region represent the extremes. Migrants
from the Border region include the lowest proportions without formal schooling (6%) or with
incomplete primary school (19%) and the highest share with some lower (31%) and upper
secondary education (27%). In contrast, migrants from the Southeast are the least likely to have
lower (13%) and upper secondary (7%) education, with greater-than-average proportions of
people with no schooling (17%) and incomplete primary schooling (44%).
Finally, we observe little variation across sending regions in the marital status and
household position of migrants. The proportion of migrants who are currently married is highest
in the Southeast (84% vs. 75-78% in all other regions), while the proportion of migrants who are
separated/divorced/widowed ranges from 12% in the Historical Region to 17% in the Central
Region. Accordingly, most US-bound migrants were heads of households, with 80%-81% of
migrants from the Historical, Central, and Southeastern Regions being household heads. Given
the peculiarities of the Mexican patriarchal system (Massey et al., 2006), it is not surprising that
the Border region, which has the lowest share of women in the flow, has an even larger share of
household heads at 87%.
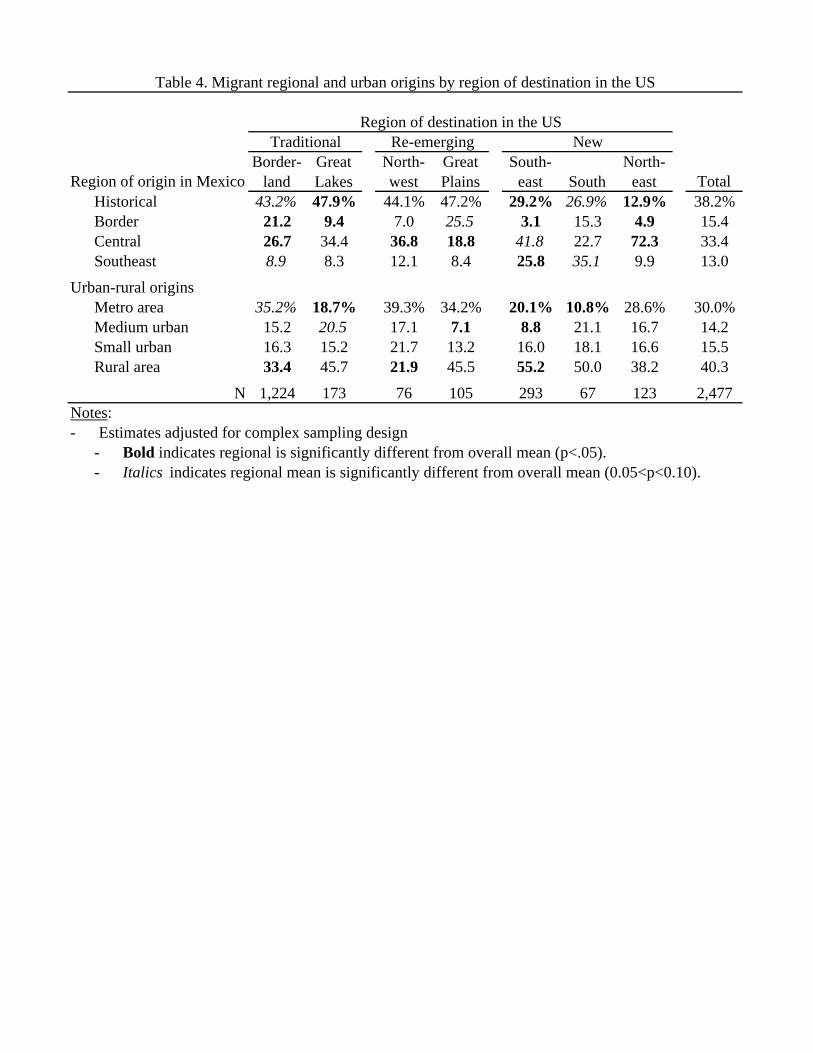
Table 4 shows the regional and urban-rural distributions of migrant origins by region of
destination. Broken down this way, these data reconfirm that the changing regional composition
18
of Mexican origins is contributing to the eastward expansion of immigrant destinations while
standardizing for differences in the size of flows to different destination regions. Although the
re-emergence of destinations in the West and Midwest indeed seems to be driven largely by
networks emanating from the Historical Region, the eastern expansion of Mexican migrants in
the United States is not. First, the Historical Region is always over-represented in flows to
traditional destinations: its residents compose 38% of the total flow but 43% and 48% of
migrants going into the Borderland and Great Lakes Regions. In contrast, migrants from the
Historical Region represent only 30%, 27%, and 13% of migrants going to the Southeast, South,
and Northeast of the United States. The striking under-representation of the Historical Region in
flows to the Northeast suggest that old networks from West-Central Mexico do not operate the
same way in guiding migrants to the Northeast as they do in channeling migrants to communities
in the West and Midwest.
-TABLE 4 ABOUT HERE-
The concentration of people from Mexican Border states in the US Borderland Region is
also evident from Table 4. People from the Mexican Border region are over-represented in flows
to US states just across the border (21% vs. 15% overall) as well in as the smaller flows going to
the Great Plains (26% vs. 15% overall). Flows from the Border Region to the South are relatively
large at 15%, basically mirroring the share of migrants leaving the Border region overall. In
contrast, the share of migrants from the Border Region is much lower in flows going to
traditional Great Lakes gateways (9%), and new destination areas in the Southeast (3%) and
Northeast (5%).
The pattern of emigration from Mexico’s Central Region most likely reflects its
combination of immigrants from both older and newer immigrant origins (e.g., areas around
19
Mexico City and Guerrero vs. Puebla and Querétaro, see De Genova, 2005: p.p. 3-4). For
instance, the Central Region is well represented in traditional gateways in the Great Lakes
Region (34% vs. 33% overall) and the Northwest (37%), as well as new immigrant destinations
in the Southeast (42%) and the Northeast, where nearly 3 out of 4 recent migrants arriving
directly from Mexico come from the Central region. New destinations in the South (26%) and
Southeast (35%) disproportionately receive migrants from Southeastern Mexico, again
suggesting that newer sending areas are contributing more than their fair share to the growth of
new immigrant destinations.
The rural-urban origin of migrants seems to relate to the profile of sending regions
described above. Migrants going to the South and Southeast (who tend to work in primary sector
industries, see Dunn et al., 2005, Griffith, 2005, Haverluk and Trautman, 2008, Kandel and
Parrado, 2004, Kandel and Parrado, 2005, Kandel and Parrado, 2006, Parrado and Kandel, 2008)
are least likely to come from a Mexican metropolitan area and disproportionately likely to come
from rural areas. In the South and Southeast, 50% and 55% of migrants, respectively, come from
rural areas while only 11% and 20% are of metropolitan origin. In contrast, the proportion of
migrants coming from metropolitan areas is highest in the more established flows going to the
US Borderland Region (p<0.10 relative to the national average), while the proportion coming
from rural areas is lowest in this region, but also quite low in the re-emerging areas of the
Northwest, a fact that might reflect the historical transformation of migration to traditional
gateways away from seasonal agricultural labor toward work in urban services (e.g. Cornelius,
1992, Durand et al., 1999, Riosmena, 2004). Interestingly, although migrants going to the Great
Lakes region have traditionally worked in industrial and urban sectors (De Genova, 2005), they
do not come from places that are particularly urbanized relative to the general migrant flow,
20
except for a slight over-representation of migrants from urban areas with 15,000-100,000
inhabitants, at 21% (vs. 14%).
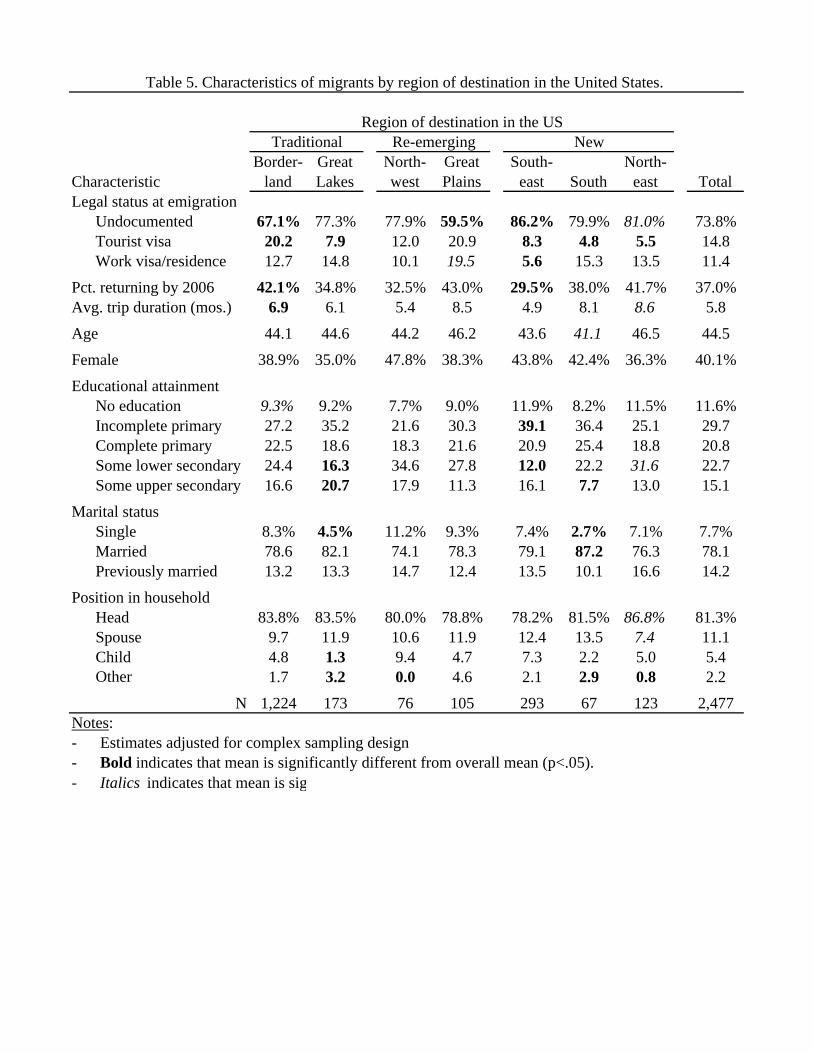
Table 5 shows the characteristics of migrants according to their region of destination.
The proportion undocumented is somewhat higher among migrants going to new destinations in
the South and East of the United States (80% and above) compared with the Borderland and
Great Plains, where the proportions are 60 and 67%, respectively. The former figure stems from
higher proportions using tourist visas (20%), perhaps because of the over-representation of
migrants from the Border. The latter is attributable to higher proportions of migrants with
work/residence permits (20%). Although return rates also vary across destination regions, it is
only in the extremes (and the two largest flows) that these patterns are significantly different
from the average for all migrants. Thus the likelihood of return is lowest among migrants going
to the Southeast (30%) and highest among migrants going to the Borderland Region, where trip
durations are nonetheless slightly longer than average (6.9 months vs. 5.8 months for all
returnees).
-TABLE 5 ABOUT HERE-
The demographic profile of migrants does not vary greatly, certainly not enough to be
distinguished from random noise in most instances. Only in the South is the mean age of
migrants slightly lower than average, at 41 years (vs. 44.5, p<0.10). Although the proportion of
women is generally lower in traditional destinations (35%-39%) than in new destinations in the
South (43%-44%), these differences are not statistically significant. Not surprisingly, the
educational attainment of migrants reflects their urban-rural origins. The percentage of people
with at least some lower secondary education (the sum of the two highest schooling categories
shown in table 4, which can be interpreted as being around or above the educational average for
21
the Mexican adult population), is higher in the Northeast (31.6 + 13.0 = 44.6%), the Borderland
Region (41%), and the Great Lakes (37%) compared with figures of 28% and 30% in the
Southeast and South, respectively. In all other regions, schooling levels were not significantly
different from the average. Finally, the distribution of marital status is similar across all
destinations except the South, where the percentage of migrants who are currently married is
higher than in all other regions (87% vs. an average of 78%).
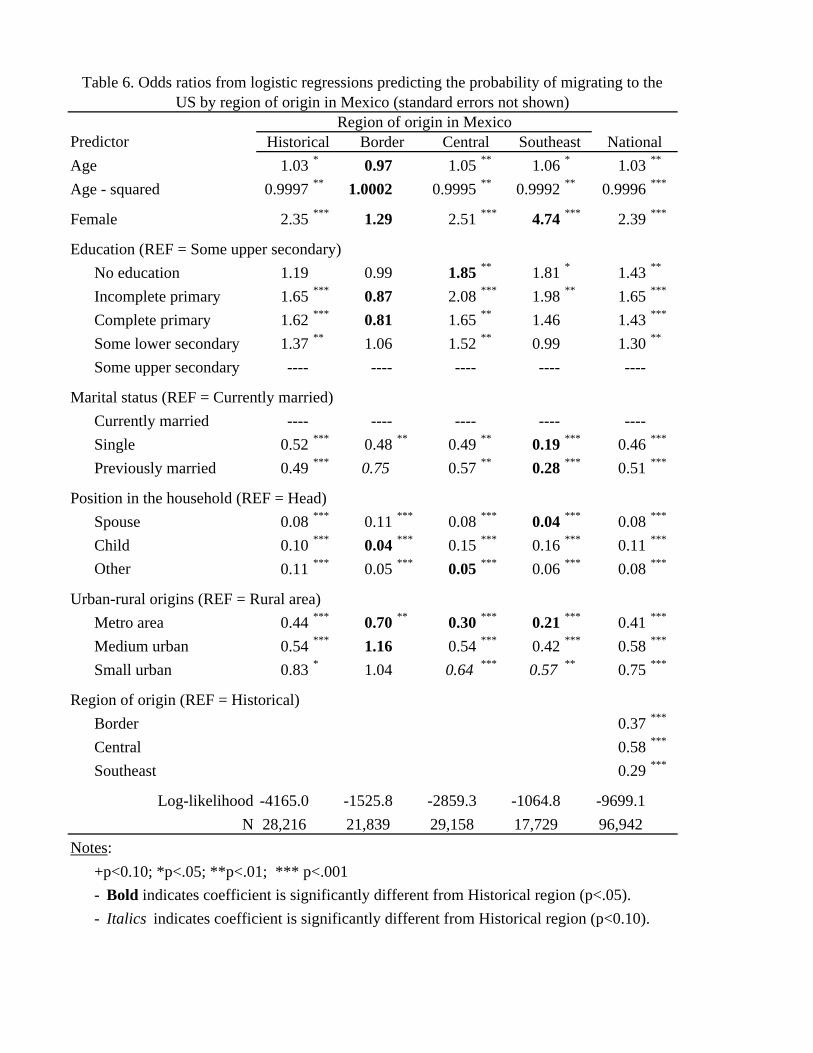
5 Determinants of migration to and from traditional and new origins and destinations
Table 6 shows odds ratios derived from logistic regressions predicting the likelihood of
2001-2006 US migration by region of residence in Mexico.4 The rightmost panel shows results
for the whole sample, including controls for region. As is the case in other studies of Mexican
migration, the odds of US migration are curvilinear with respect to both age (with an implied
peak at age 41) and educational attainment (peaking for those with some primary schooling and
being lower for those with less and more schooling). While the fact that the odds of migration for
women are 2.4 times higher than those of men may seem surprising given the history of Mexican
migration and the results shown in tables 1 and 3, these odds are conditional on people’s position
in the household. Before we control for the sorting of men and women into different positions in
the household, women are around 48% less likely to emigrate than men (calculations not shown).
Never- and previously married individuals have 56 and 49% lower odds of emigrating than those
married at the time of the survey, while members of the household other than the head have ~89-
92% lower odds of migration than household heads.
-TABLE 6 ABOUT HERE-
The degree of urbanization of people’s place of residence in Mexico, and the region
where that place is located, are also significantly and strongly associated with the odds of
22
emigration. Migration to the US is less likely the more urbanized a place is. People from small
urban, large urban, and metropolitan areas have 25%, 42%, and 59% lower odds of emigration
than those living in rural areas. The introduction of socio-demographic controls does not change
this basic pecking order in regional origins: people living in the Central, Border, and
Southeastern regions are still 41%, 65%, and 70% less likely to emigrate than residents of the
Historical Region of emigration.
As the descriptive statistics earlier suggested, the profile of migrants varies across
sending regions even after introducing other socio-demographic controls, with variations shown
in boldface or italics whenever we found significant differences (for two-tailed tests at the 0.05
and 0.10 levels respectively) between the determinants of emigration from the Border, Central,
or Southeast regions and those of emigration from the Historical heartland of emigration. We
performed these tests by simultaneously introducing all possible two-level interactions between
region of origin and all the other covariates in the model; consequently, the results are net of any
other two-level interactions in addition to the main effects. We further used likelihood ratio (as
opposed to Wald) tests to ascertain the significance of the patterns we observed.
The age patterns of the Border Region differ significantly from those observed in the
Historical Region and imply an earlier peak in the likelihood of emigration. Flows from the
Border Region are also the least feminized, judging from the lower advantage of women relative
to men (29% higher odds) after we control for their position in the household. In contrast, the
female advantage is highest in the Southeast, where the odds of migration are 4.7 times higher
for women than for men net of their household position. Note that the odds ratios of single and
previously married individuals in the Southeast are particularly low (0.19 and 0.28 relative to
currently married individuals respectively, cf. those of the Historical region at 0.52 and 0.49) and
23
so are the relative odds of emigration for spouses (96% lower than those for household heads,
slightly lower than the same odds for spouses in the Historical region at 92%). This pattern
suggests that the rigid patriarchal household structure prevalent in Central and Northern Mexico
does not operate in the same way in Southeastern Mexico, at least with regards to emigration.
The educational selectivity of migration in the Border Region is remarkably flatter than
that in the Historical (or any other) Region. Not only are the implied effects of education lower
in the Border than in the Historical region, they are in fact not significantly different from zero
(see table 6, second panel). In other words, educational attainment is not a good predictor of
migration to the US from the states along the Mexico-US border. In addition, the odds of
migration for those with no formal schooling living in Central Mexico seem to be somewhat
higher (relative to those with some upper secondary) than in the Historical Region (1.85% vs.
1.19% for those with no schooling, p<0.05). Put differently, the education-migration gradient is
steeper in the Historical region than in the Central region for those with no schooling.
Finally, the under-representation of metropolitan origins among migrants is especially
strong in the Central and Southeastern regions, as suggested by the stronger negative effect of
coming from a metropolitan in both the Central and Southeastern Regions relative to the
Historical Region. Thus, whereas the relative odds of migrating to the US from a metropolitan
area (compared to a rural one) are 56% lower in the Historical Region, they are 70% and 79%
lower in the Central and Southeast Regions. In contrast, they are only 30% lower for
metropolitan dwellers in the Border region, and this is in fact the only significant difference in
emigration propensities across the urban-rural continuum. Unlike in the Historical, Central, and
Southeastern Regions, the odds of emigration from rural and small and large urban areas are not
statistically different from each other. This again confirms the notion that migratory flows from
24
the Border Region are much more urban than those coming from other regions, especially the
Southeast. Nonetheless, even in these places the process of cumulative causation seems to
operate less efficiently than in smaller places (Fussell and Massey 2004).
Having established some basic differences between migrants according to their sending
region, we turn now to an analysis by region of destination. Table 7 shows odds ratios from
multinomial logistic regression predicting migration to (1) traditional and re-emerging
destinations combined and (2) newer destinations in the Southeast, South, and Northeast, in both
cases relative to non-migrants. Significant differences between the coefficients predicting
emigration to traditional and re-emerging versus new destinations are denoted in bold (p<0.05)
and italics (0.05<p<0.10). The socio-demographic profile of migrants going to new destinations
is not significantly different from that of migrants going to traditional or re-emerging
destinations, with one exception. Although children of a household head are considerably less
likely to migrate to any US destination, when they do they are 1.64 times more likely (0.14/0.08,
p<0.1) to move to new than to an older destination, probably because of differences in household
structures between Southeast Mexico (where fertility is higher and marriage occurs earlier) and
the rest of the country.
-TABLE 7 ABOUT HERE-
Unlike socio-demographic effects on destination, rural-urban and regional origins are
significant in differentiating between traditional and new destinations. The urban-rural gradient
is sharper in flows directed towards new destinations than in those going to traditional and re-
emerging gateways, even after we control for region of origin in Mexico. Relative to rural areas,
the odds of migration to traditional or re-emerging gateway are 15%, 36%, and 54% lower in
25
smaller urban, larger urban, and metropolitan areas. These gaps are even greater for new
destinations, where the odds of emigration are 35%, 54%, and 78% lower in smaller urban,
larger urban, and metropolitan areas relative to rural areas. Again, this is not surprising given that
the demand for migrant labor in the American South and Southeast is heavily concentrated in
primary sector industries (Dunn et al., 2005, Griffith, 2005, Haverluk and Trautman, 2008,
Kandel and Parrado, 2004, Kandel and Parrado, 2005, Kandel and Parrado, 2006, Parrado and
Kandel, 2008). As a result, the expansion of Mexican migration eastward (at least for flows
stemming directly from Mexico) retains the relatively rural character Mexican migration has had
historically.
Tradition, however, is not the word that best describes the regional distribution of
migrants, as suggested by the descriptive statistics. The regional pecking order in emigration
rates is different, especially in terms of magnitude, depending on the destination. First of all,
residents of the Historical Region are most likely to migrate to traditional and re-emerging
destinations, followed by those from the Border, Central, and Southeast Regions, who are 60%,
61%, and 80% less likely to migrate to traditional or re-emerging destinations than residents of
the Historical Region, once we control for other relevant characteristics. In contrast, people from
the Central Region are most likely to migrate to new destinations. Indeed, they are 1.26 times
more likely to do so than residents of the Historical Region. In contrast people living in the
Border and Southeaster Regions are 78% and 39% less likely to migrate to new destinations than
people living in the Historical heartland of Mexican migration to the United States.
Although residents of the Historical and Border Regions are more likely to go to
traditional or re-emerging gateways than to new destinations in the East, Southeast, and South,
the opposite is true for residents of the Central and Southeast Regions. Residents of the Border
26
Region, for example, have 44% (0.22/0.40, p<0.01) lower odds of migrating to new destinations
than to regions with traditional/re-emerging gateways. In contrast, people from Central and
Southeast Mexico have 3.1 (i.e., 1.26/0.41 and 0.61/0.20) times higher odds of migrating to new
destinations than to traditional or re-emerging gateways. It is thus clear that the eastward
expansion of Mexican settlement has a different origin composition net of other confounders, at
least among migrants who come directly from Mexico.
6 Conclusions
Our results reveal the diverging regional origins of Mexican migrants to new destinations
in the American South, Southeast, and especially the Northeast. A majority of migrants going to
new destinations in the East come not from the Historical Region but from Central and
Southeastern Mexico. Migrants from the Central Region dominate flows into the Northeast (72%
with an additional 10% coming from the Southeast) and the Southeast (42%, plus 26% from the
Central region), whereas migrants from the Southeast dominate migration to the South (35%, in
addition to 23% from Central Mexico, see Table 4). Although migrants from the Historical
Region remain a non-trivial portion of the flow going to the Southeast (29%) and South (27%,
see table 4), they are strikingly absent from flows into the Northeast (in our data, mostly
comprised of the tri-state area of New York, New Jersey, and Pennsylvania), in which they
represent a meager 13%.
It is possible, of course, that the origin composition of current population stocks in the
new destinations could be less dominated by Central and Southeastern Mexico because of past
migration flows and internal redistribution of migrants away from traditional gateways, though
that possibility remains something of an empirical puzzle given the lack of relevant data.
27
Nonetheless, this seems unlikely given how migrant networks typically operate (Fussell and
Massey, 2004, Lindstrom and López-Ramírez, 2009, Massey et al., 1994) and the rapid growth
in emigration from Mexico’s Central and Southeast Regions (cfr. Table 2, Durand and Massey,
2003, Durand et al., 2001), not to mention the rapid growth in migration to the US South,
Southeast, and Northeast (cfr. Table 4, Durand and Massey, 2003, Durand et al., 2005, Leach
and Bean, 2008, Massey and Capoferro, 2008).
More than half of all migrants to the US South and Southeast, in particular, originate in
Mexican rural areas whereas only a few (11%-20%) come from metropolitan areas. This pattern
not only is consistent with the distribution of migrant origins favoring flows from the Central and
Southeastern regions (40% and 67% rural, see table 2), but remains so even after we control for
the regional composition of flows into new destinations (Table 7). In any event, the rural-urban
composition of flows into new destinations in the US South and Southeast is not surprising given
the demand for immigrant labor created by meat processing and other industries in non-metro
areas in the US South and Midwest (Dunn et al., 2005, Griffith, 2005, Haverluk and Trautman,
2008, Kandel and Parrado, 2004, Kandel and Parrado, 2005, Kandel and Parrado, 2006, Parrado
and Kandel, 2008). As a result, the more rural character of Mexican migration remains a
common feature of flows to these regions, though not to the Northeast, where migrants enter
diverse occupations in the urban sector in cities such as New York (e.g. Smith, 2006) more often
than they enter rural occupations in small towns in the tri-state area (e.g. Shutika, 2005).
We do not mean to imply that Central and Southeastern Mexicans go exclusively to new
destinations, however: as with any other migrant stream, the largest flows from the Central and
Southeastern regions go to the US Borderland Region (47% and 41%, respectively, see Table 2),
though these shares are indeed smaller than among those leaving from the Historical (64%) and
28
Border (78%) regions.5 The latter in fact stands out in various ways from other regions. First, it is
the only region in which a majority of migrants come from metropolitan areas (see Table 2).
Though this predominance almost defies the notion that cumulative causation does not operate in
large cities (Fussell and Massey, 2004), not even in the Border Region do metropolitan areas
contribute their fair share to the migrant flow (see Table 6).
Migrants from the Border region also have flat education-migration gradients and above-
average return rates, and they concentrate heavily in the adjacent Borderland Region. The profile
of Border migrants may stem from the unique history of cross-border movement more than the
structural conditions promoting emigration from elsewhere in Mexico, particularly the South.
Indeed, large disparities in job creation partially fueled by NAFTA have transformed the Border
region into the most rapidly growing portion of the Mexican economy (Hanson, 2003) as well as
population. In contrast, the liberalization of the Mexican economy and the gradual opening of
agricultural markets under NAFTA have generated large-scale displacement from the
countryside, especially in Southern Mexico (Delgado-Wise and Márquez Covarrubias, 2007,
Massey et al., 2008, Nevins, 2007). In sum, the recent growth of Mexican migration and its
geographic expansion on both sides of the border reflects a confluence of supply-side and
demand-side factors operating in the same direction with a common thread: economic
restructuring.
29
References
Census, U. B. O. T. 2004 "The Foreign-Born Population in the United States: 2003" In Book The
Foreign-Born Population in the United States: 2003. ed. Editor. City: U.S. Department of
Commerce. Economics and Statistics Administration. U.S. Census Bureau. Pp. 9.
Cerrutti, M., and D. S. Massey.2001 "On the Auspices of Female Migration From Mexico to the
United States." Demography, 38 (2): 187-200.
Cornelius, W. A. 1992 ""From Sojourners to Settlers: The Changing Profile of Mexican
Immigration to the United States"" In U.S. Mexico Relations: Labor Market
Interdependence. ed. J. A. Bustamante, W. Reynolds and R. A. Hinojosa Ojeda. Stanford,
CA: Stanford University Press. Pp. 155-195.
Darian, L. T. 2006 "The Emerging Hispanic Homeland of the Pacific Northwest: A Case Study
of Yakima Valley, Washington" In Book The Emerging Hispanic Homeland of the
Pacific Northwest: A Case Study of Yakima Valley, Washington. ed. Editor. City:
Montana State University. Pp. 228.
De Genova, N. (2005), Working the boundaries: race, space, and" illegality" in Mexican
Chicago. Duke University Press.
Delgado-Wise, R., and H. Márquez Covarrubias.2007 "The reshaping of Mexican labor exports
under NAFTA: Paradoxes and challenges." International Migration Review, 41 (3): 656.
Donato, K. M.1993 "Current Trends and Patterns of Female Migration - Evidence From
Mexico." International Migration Review, 27 (4): 748-771.
Donato, K. M., M. Stainback, and C. I. Bankston Iii 2005 "The Economic Incorporation of
Mexican Immigrants in Southern Louisiana: A Tale of Two Cities" In New Destinations:
30
Mexican Immigration in the United States. ed. V. Zúñiga and R. Hernández-León. New
York: Russell Sage Foundation. Pp. 50-75.
Dunn, T. J., A. M. Aragonés, and G. Shivers.2005 "Recent Mexican Migration in the Rural
Delmarva Peninsula: Human Rights Versus Citizenship Rights in a Local Context." New
Destinations: Mexican Immigration in the United States: 155-183.
Durand, J., and D. S. Massey (2003), Clandestinos: Migración México-Estados Unidos en los
Albores del Siglo XXI. Universidad Autónoma de Zacatecas: Zacatecas.
Durand, J., D. S. Massey, and C. Capoferro 2005 "The New Geography of Mexican
Immigration" In New Destinations: Mexican Immigration in the United States. ed. V.
Zúñiga and R. Hernández-León. New York: Russell Sage Foundation. Pp. 1-22.
Durand, J., D. S. Massey, and E. A. Parrado.1999 "The New Era of Mexican Migration to the
United States." Journal of American History, 86 (2): 518-536.
Durand, J., D. S. Massey, and R. M. Zenteno.2001 "Mexican Immigration to the United States:
Continuities and Changes." Latin American Research Review, 36 (1): 107-127.
Fussell, E.2004 "Sources of Mexico's migration stream: Rural, urban, and border migrants to the
United States." Social Forces, 82 (3): 937-967.
Fussell, E., and D. S. Massey.2004 "The limits to cumulative causation: International migration
from Mexican urban areas." Demography, 41 (1): 151-171.
Garza, G. (2003), La Urbanización en México en el Siglo XX. El Colegio de México: Mexico
city.
Gouveia, L., M. A. Carranza, and J. Cogua 2005 "The Great Plains Migration: Mexicanos and
Latinos in Nebraska" In New Destinations: Mexican Immigration in the United States.
ed. V. Zúñiga and R. Hernández-León. New York: Russell Sage Foundation.
31
Grey, M. A., and A. C. Woodrick 2005 ""Latinos Have Revitalized Our Community": Mexican
Migration and Responses in Marshalltown, Iowa" In New Destinations: Mexican
Immigration in the United States. ed. V. Zúñiga and R. Hernández-León. New York:
Russell Sage Foundation.
Griffith, D. C. 2005 "Rural Industry and Mexican Immigration and Settlement in North
Carolina" In New Destinations: Mexican Immigration in the United States. ed. V. Zúñiga
and R. Hernández-León. New York: Russell Sage Foundation. Pp. 50-75.
Hanson, G. H.2003 "What Has Happened to Wages in Mexico since NAFTA?" SSRN eLibrary.
Haverluk, T., and L. Trautman.2008 "The Changing Geography of US Hispanics from 1990-
2006: A Shift to the South and Midwest." Journal of Geography, 107 (3): 87-101.
Hernández-León, R. (2008), Metropolitan migrants: the migration of urban Mexicans to the
United States. University of California Press: Berkeley.
Hernandez-Leon, R., and V. Zuniga 2001 "A New Destination for an Old Migration: Origins,
Trajectories, and Labor Market Incorporation of Latinos in Dalton, Georgia" In Latino
Workers in the Contemporary South. ed. A. Murphy, C. Blanchard and J. A. Hill. Athens,
Georgia: University of Georgia Press.
Hernandez-Leon, R., and V. Zúñiga 2005 "Appalachia Meets Aztlán: Mexican Immigration and
Intergroup Relations in Dalton, Georgia" In New Destinations: Mexican Immigration in
the United States. ed. V. Zúñiga and R. Hernández-León. New York: Russell Sage
Foundation.
Insp 2008 "Diseño Muestral [ENADID 2006]" In Book Diseño Muestral [ENADID 2006]. ed.
Editor. City. Pp.
32
Kanaiaupuni, S. M.2000 "Reframing the migration question: An analysis of men, women, and
gender in Mexico." Social Forces, 78 (4): 1311-1347.
Kandel, W., and E. A. Parrado.2004 "Hispanics in the American South and the Transformation
of the Poultry Industry." Hispanic spaces, Latino places: Community and cultural
diversity in contemporary America: 255-276.
Kandel, W., and E. A. Parrado.2005 "Restructuring of the US meat processing industry and new
Hispanic migrant destinations." Population and Development Review: 447-471.
Kandel, W. A., and E. A. Parrado 2006 "Rural Hispanic Population Growth" In Population
Change and Rural Society. ed. W. Kandel and D. L. Brown. The Netherlands: Springer.
Pp. 155.
Leach, M. A., and F. D. Bean 2008 "The Structure and Dynamics of Mexican Migration to New
Destinations in the United States" In New Faces in New Places: The Chanaging
Geography of American Immigration. ed. D. Massey. New York: Russell Sage
Foundation. Pp. 99-123.
Lindstrom, D. P., and A. López-Ramírez 2009 "Pioneers and Followers: Migrant Selectivity and
the Development of US Migration Streams in Latin America" In Book Pioneers and
Followers: Migrant Selectivity and the Development of US Migration Streams in Latin
America. ed. Editor. City. Pp.
Massey, D., and C. Capoferro 2008 "The geographic diversification of American immigration"
In New faces in new places: The changing geography of American immigration. ed. D.
Massey. New York: Russel Sage Foundation. Pp. 25-50.
Massey, D. S.1990 "Social-Structure, Household Strategies, and the Cumulative Causation of
Migration." Population Index, 56 (1): 3-26.
33
Massey, D. S. (2008), New faces in new places : the changing geography of American
immigration. Russell Sage Foundation: New York.
Massey, D. S., J. Durand, and N. J. Malone (2002), Beyond smoke and mirrors : Mexican
immigration in an era of economic integration. Russell Sage Foundation: New York :.
Massey, D. S., M. J. Fischer, and C. Capoferro.2006 "International migration and gender in Latin
America: A comparative analysis." International Migration, 44 (5): 63-91.
Massey, D. S., L. Goldring, and J. Durand.1994 "Continuities in Transnational Migration: An
Analysis of Nineteen Mexican Communities." American Journal of Sociology, 99 (6):
1492-1533.
Massey, D. S., F. Kalter, and K. A. Pren.2008 "II. Migration." Migration und Integration: 134.
Massey, D. S., J. S. Rugh, and K. A. Pren.Forthcoming "The Geography of Undocumented
Mexican Migration." Mexican Studies/Estudios Mexicanos.
Massey, D. S., and R. Zenteno.2000 "A Validation of the Ethnosurvey: the Case of Mexico-US
Migration." International Migration Review, 34 (3): 766-793.
Nevins, J.2007 "Dying for a cup of coffee? Migrant deaths in the US-Mexico border region in a
neoliberal age." Geopolitics, 12 (2): 228-247.
Parrado, E. A., and C. A. Flippen.2005 "Migration and gender among Mexican women."
American Sociological Review, 70 (4): 606-632.
Parrado, E. A., and W. Kandel 2008 "New Hispanic migrant destinations: A tale of two
industries" In New Faces in New Places: The Changing Geography of American
Immigration. ed. D. Massey. Pp. 99-123.
Rich, B., and M. Miranda 2005 "The Sociopolitical Dynamics of Mexican Immigration in
Lexington, Kentucky, 1997 to 2002: An Ambivalent Community Responds" In New
34
Destinations: Mexican Immigration in the United States. ed. V. Zúñiga and R.
Hernández-León. New York: Russell Sage Foundation.
Riosmena, F. 2004 "Return Versus Settlement Among Undocumented Mexican Migrants, 1980
to 1996" In Crossing the Border: Research from the Mexican Migration Project. ed. J.
Durand and D. S. Massey. New York: Russell Sage Foundation. Pp. 265-280.
Riosmena, F. 2005 "Within, between, and beyond space-time: Three essays on Latin America-
United States migratory dynamics" In Book Within, between, and beyond space-time:
Three essays on Latin America-United States migratory dynamics. ed. Editor. City:
University of Pennsylvania. Pp. 210.
Riosmena, F.forthcoming "On the Auspices of Latin America - U.S. Migration." Annals of the
American Academy of Political and Social Science.
Shutika, D. L.2005 "Bridging the community: Nativism, activism, and the politics of inclusion in
a Mexican settlement in Pennsylvania." New Destinations: Mexican Immigration in the
United States: 103–132.
Singer, A.2004 "The rise of new immigrant gateways." Washington: Brookings Institution.
Smith, R. C. 2005 "Racialization of Mexicans in New York City" In New Destinations: Mexican
Immigration in the United States. ed. V. Zúñiga and R. Hernández-León. New York:
Russell Sage Foundation.
Smith, R. C. (2006), Mexican New York : transnational lives of new immigrants. University of
California Press: Berkeley.
Zúñiga, V., and R. Hernández-León (2005), New destinations : Mexican immigration in the
United States. Russell Sage Foundation: New York.
35
NOTES
1 There is of course a plethora of community studies, many of them in Zúñiga and Hernández-
León (2005), in which oftentimes the place or state of origin (as a proxy for the age of the
migrant network) in Mexico is explored. Among others, scholars have studied destinations in
New York (mostly with Pueblans, see Smith, 2005, Smith, 2006), Pennsylvania (Kenneth
Square, see Shutika, 2005), North Carolina (Griffith, 2005, Parrado and Flippen, 2005), Georgia
(e.g. Dalton, see Hernandez-Leon and Zuniga, 2001, Hernandez-Leon and Zúñiga, 2005), Iowa
(Grey and Woodrick, 2005), Nebraska (Gouveia et al., 2005), Maryland (Dunn et al., 2005),
Kentucky (Rich and Miranda, 2005), and Louisiana (Donato et al., 2005). However, the main
goal of these studies has by and large been to understand the perils and mechanisms of
community formation and inter-ethnic relations in these places while emphasizing the context of
reception migrants face and the role of restructuring in bringing certain jobs to these areas.
2 Singer classified metro gateways into various types according to the evolution of their share of
foreign-born in every decennial census in the 20th Century. Re-emerging gateways are those
places with an above-average share of foreign-born individuals in 1900-1930, lagging below the
national average until 1980, after which it increased rapidly (Singer, 2004: p. 5). Given that we
are dealing with much larger regions, our classification is less strict and more informal, but
follows the same spirit. Re-emerging regions are those in which Mexican migration had been
sizable before the 1980s (mostly during the Enganche or Bracero Eras of 1900-1929 and 1942-
1964), later to diminish in relevance relative to immigration intro traditional gateways, and
which resurged during the 1980s and 1990 (Durand et al., 2005).
36
3 Most state samples included 1,200 dwellings except for Jalisco, Veracruz, Distrito Federal, and
Mexico (the state), with 1,800 and Nuevo León, Guanajuato, and Puebla, with 1,600 sampled
dwellings each.
4 Odds ratios reported were calculated by the exponentiation of regression coefficients; when we
refer to relative differences in odds ratios, we further convert them to the conventional relative
measures in the form 100 [exp{b} – 1].
5 However, after controls are introduced, migrants from the Central and Southeast regions do in
fact have a larger propensity to emigrate to new than to traditional and re-emerging destinations
(see table 7).
CharacteristicAge 38.4 44.5
Female 52.4% 40.1%
Educational attainmentNo education 8.4% 11.6%Incomplete primary 16.1 29.7Complete primary 17.4 20.8Some lower secondary 29.1 22.7Some upper secondary 28.9 15.1
Marital statusSingle 31.3% 7.7%Currently married 58.5 78.1Previously married 10.3 14.2
Position in householdHead 35.9% 81.3%Spouse 25.8 11.1Child 28.5 5.4Other 9.8 2.2
Urban level of locality of residenceMetro area (population > 100,000) 51.4% 30.0%Medium urban (15,000 -100,000) 13.8 14.2Small urban (2,500 -15,000) 13.1 15.5Rural area (population < 2,500) 21.7 40.3
RegionHistorical 22.2% 38.2%Border 21.2 15.4Central 40.4 33.4Southeast 16.2 13.0
NNotes:- Estimates adjusted for complex sampling design
- Italics indicates that mean is significantly different from that of non-migrants (p<0
Table 1. Characteristics of migrants to the US and non-migrants ages 15+ surveyed in Mexico
Non-migrants US Migrants
98,486 2,477
- Bold indicates that mean is significantly different from that of non-migrants (p<.05
Traditional gatewaysBorderland 64.1% 77.8% 46.7% 40.5% 57.5%Great Lakes 10.5 5.1 8.9 5.5 8.5
Re-emerging destinationsGreat Plains 4.8% 6.4% 2.2% 2.6% 3.9%Northwest 3.8 1.5 3.8 3.2 3.4
New destinationsSoutheast 11.7% 3.1% 19.7% 31.6% 15.5%South 2.7 3.9 2.7 10.9 3.9Northeast 2.4 2.3 16.0 5.7 7.3
Urban-rural originsMetro area 24.1% 59.7% 31.4% 8.4% 30.0%Medium urban 18.1 15.6 11.3 8.6 14.2Small urban 16.5 9.2 17.0 16.5 15.5Rural area 41.3 15.5 40.4 66.5 40.3
N 1,170 350 715 242 2,477Notes:- Estimates adjusted for complex sampling design- Bold indicates that mean is significantly different from national mean (p<.05).- Italics indicates that mean is significantly different from national mean (p<0.10).
Table 2. Migrant destinations and urban origins by region of origin in Mexico
Region of origin in MexicoHistorical Border Central Southeast Total
Legal status at emigrationUndocumented 72.1% 35.5% 87.0% 89.3% 73.8%Tourist visa 16.2 38.5 7.6 1.3 14.8Work visa/residence 11.7 26.0 5.4 9.4 11.4
Pct. returning by 2006 41.2% 53.6% 29.9% 23.1% 37.0%Avg. trip duration (mos.) 5.6 7.2 5.1 6.4 5.8
Age 44.7 44.4 44.8 43.1 44.5
Female 40.2% 31.1% 42.4% 44.7% 40.1%
Educational attainmentNo education 10.8% 5.9% 13.1% 16.5% 11.6%Incomplete primary 30.0 19.2 28.4 44.3 29.7Complete primary 25.2 16.6 18.3 19.3 20.8Some lower secondary 21.7 31.0 24.1 12.8 22.7Some upper secondary 12.3 27.3 16.1 7.1 15.1
Marital statusSingle 9.2% 5.6% 7.9% 5.0% 7.7%Currently married 78.9 78.6 74.8 83.8 78.1Previously married 11.8 15.8 17.3 11.3 14.2
Position in householdHead 80.5% 87.0% 79.8% 80.7% 81.3%Spouse 11.2 9.8 11.1 12.7 11.1Child 4.9 1.6 7.3 6.1 5.4Other 3.3 1.6 1.8 0.5 2.2
NNotes:- Estimates adjusted for complex sampling design- Bold indicates that mean is significantly different from national average (p<.05).- Italics indicates that mean is significantly different from national average (p<0.10).
Southeast
242
Table 3. Characteristics of migrants to the US by region of origin in Mexico
Region of origin in MexicoHistorical Border Central
2,477
Total
1,170 350 715
Region of origin in Mexico TotalHistorical 43.2% 47.9% 44.1% 47.2% 29.2% 26.9% 12.9% 38.2%Border 21.2 9.4 7.0 25.5 3.1 15.3 4.9 15.4Central 26.7 34.4 36.8 18.8 41.8 22.7 72.3 33.4Southeast 8.9 8.3 12.1 8.4 25.8 35.1 9.9 13.0
Urban-rural originsMetro area 35.2% 18.7% 39.3% 34.2% 20.1% 10.8% 28.6% 30.0%Medium urban 15.2 20.5 17.1 7.1 8.8 21.1 16.7 14.2Small urban 16.3 15.2 21.7 13.2 16.0 18.1 16.6 15.5Rural area 33.4 45.7 21.9 45.5 55.2 50.0 38.2 40.3
N 2,477Notes:- Estimates adjusted for complex sampling design
- Bold indicates regional is significantly different from overall mean (p<.05).- Italics indicates regional mean is significantly different from overall mean (0.05<p<0.10).
Great Lakes
North-west
Great Plains
South-east
Table 4. Migrant regional and urban origins by region of destination in the US
Region of destination in the USTraditional Re-emerging New
SouthNorth-
east
1,224 173 76 105 293 67 123
Border-land
CharacteristicLegal status at emigration
Undocumented 67.1% 77.3% 77.9% 59.5% 86.2% 79.9% 81.0% 73.8%Tourist visa 20.2 7.9 12.0 20.9 8.3 4.8 5.5 14.8Work visa/residence 12.7 14.8 10.1 19.5 5.6 15.3 13.5 11.4
Pct. returning by 2006 42.1% 34.8% 32.5% 43.0% 29.5% 38.0% 41.7% 37.0%Avg. trip duration (mos.) 6.9 6.1 5.4 8.5 4.9 8.1 8.6 5.8
Age 44.1 44.6 44.2 46.2 43.6 41.1 46.5 44.5
Female 38.9% 35.0% 47.8% 38.3% 43.8% 42.4% 36.3% 40.1%
Educational attainmentNo education 9.3% 9.2% 7.7% 9.0% 11.9% 8.2% 11.5% 11.6%Incomplete primary 27.2 35.2 21.6 30.3 39.1 36.4 25.1 29.7Complete primary 22.5 18.6 18.3 21.6 20.9 25.4 18.8 20.8Some lower secondary 24.4 16.3 34.6 27.8 12.0 22.2 31.6 22.7Some upper secondary 16.6 20.7 17.9 11.3 16.1 7.7 13.0 15.1
Marital statusSingle 8.3% 4.5% 11.2% 9.3% 7.4% 2.7% 7.1% 7.7%Married 78.6 82.1 74.1 78.3 79.1 87.2 76.3 78.1Previously married 13.2 13.3 14.7 12.4 13.5 10.1 16.6 14.2
Position in householdHead 83.8% 83.5% 80.0% 78.8% 78.2% 81.5% 86.8% 81.3%Spouse 9.7 11.9 10.6 11.9 12.4 13.5 7.4 11.1Child 4.8 1.3 9.4 4.7 7.3 2.2 5.0 5.4Other 1.7 3.2 0.0 4.6 2.1 2.9 0.8 2.2
NNotes:- Estimates adjusted for complex sampling design- Bold indicates that mean is significantly different from overall mean (p<.05).
Table 5. Characteristics of migrants by region of destination in the United States.
Region of destination in the USTraditional Re-emerging New
Border-land
Great Lakes
North-west
Great Plains
South-east South
North-east Total
123 2,477
- Italics indicates that mean is sig
1,224 173 76 105 293 67
Predictor
Age 1.03 * 0.97 1.05 ** 1.06 * 1.03 **
Age - squared 0.9997 ** 1.0002 0.9995 ** 0.9992 ** 0.9996 ***
Female 2.35 *** 1.29 2.51 *** 4.74 *** 2.39 ***
Education (REF = Some upper secondary)
No education 1.19 0.99 1.85 ** 1.81 * 1.43 **
Incomplete primary 1.65 *** 0.87 2.08 *** 1.98 ** 1.65 ***
Complete primary 1.62 *** 0.81 1.65 ** 1.46 1.43 ***
Some lower secondary 1.37 ** 1.06 1.52 ** 0.99 1.30 **
Some upper secondary ---- ---- ---- ---- ----
Marital status (REF = Currently married)
Currently married ---- ---- ---- ---- ----
Single 0.52 *** 0.48 ** 0.49 ** 0.19 *** 0.46 ***
Previously married 0.49 *** 0.75 0.57 ** 0.28 *** 0.51 ***
Position in the household (REF = Head)
Spouse 0.08 *** 0.11 *** 0.08 *** 0.04 *** 0.08 ***
Child 0.10 *** 0.04 *** 0.15 *** 0.16 *** 0.11 ***
Other 0.11 *** 0.05 *** 0.05 *** 0.06 *** 0.08 ***
Urban-rural origins (REF = Rural area)
Metro area 0.44 *** 0.70 ** 0.30 *** 0.21 *** 0.41 ***
Medium urban 0.54 *** 1.16 0.54 *** 0.42 *** 0.58 ***
Small urban 0.83 * 1.04 0.64 *** 0.57 ** 0.75 ***
Region of origin (REF = Historical)
Border 0.37 ***
Central 0.58 ***
Southeast 0.29 ***
Log-likelihood
N
Notes:
+p<0.10; *p<.05; **p<.01; *** p<.001
- Bold indicates coefficient is significantly different from Historical region (p<.05).
- Italics indicates coefficient is significantly different from Historical region (p<0.10).
Table 6. Odds ratios from logistic regressions predicting the probability of migrating to the US by region of origin in Mexico (standard errors not shown)
Region of origin in MexicoHistorical Border Central Southeast National
-4165.0 -1525.8 -2859.3 -1064.8 -9699.1
28,216 21,839 29,158 17,729 96,942
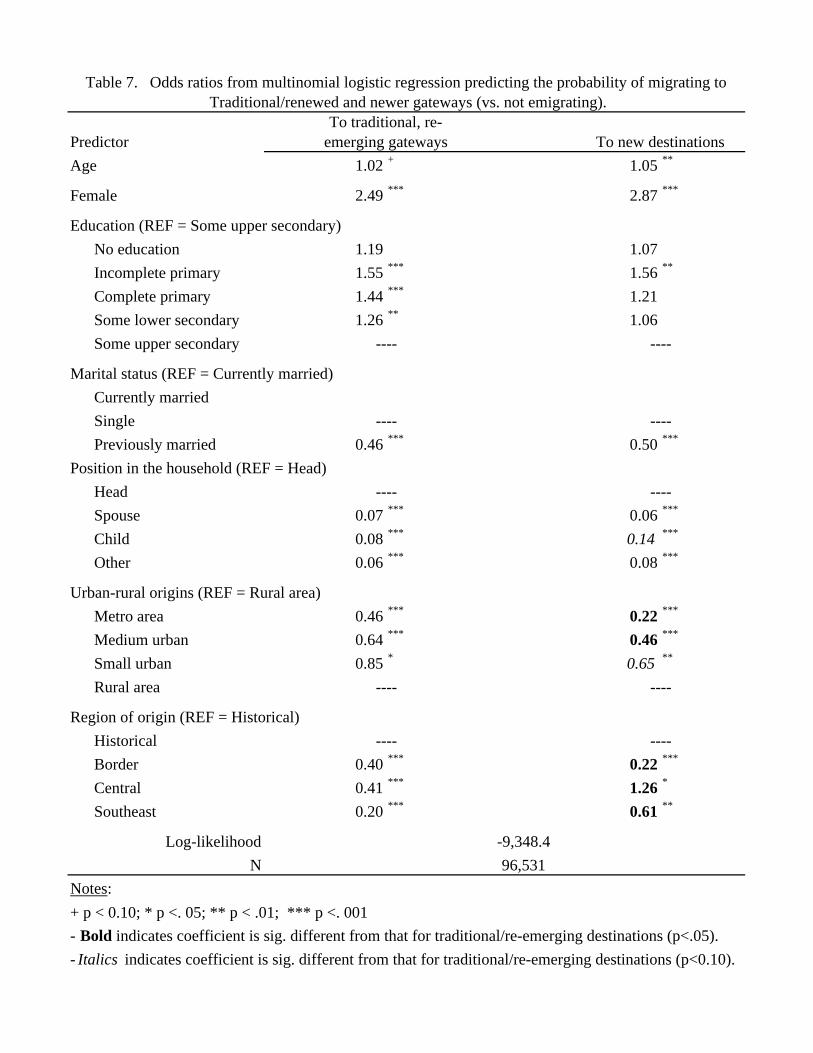
Predictor
Age 1.02 + 1.05 **
Female 2.49 *** 2.87 ***
Education (REF = Some upper secondary)
No education 1.19 1.07
Incomplete primary 1.55 *** 1.56 **
Complete primary 1.44 *** 1.21
Some lower secondary 1.26 ** 1.06
Some upper secondary
Marital status (REF = Currently married)
Currently married
Single
Previously married 0.46 *** 0.50 ***
Position in the household (REF = Head)
Head
Spouse 0.07 *** 0.06 ***
Child 0.08 *** 0.14 ***
Other 0.06 *** 0.08 ***
Urban-rural origins (REF = Rural area)
Metro area 0.46 *** 0.22 ***
Medium urban 0.64 *** 0.46 ***
Small urban 0.85 * 0.65 **
Rural area
Region of origin (REF = Historical)
Historical
Border 0.40 *** 0.22 ***
Central 0.41 *** 1.26 *
Southeast 0.20 *** 0.61 **
Log-likelihood
N
Notes:
+ p < 0.10; * p <. 05; ** p < .01; *** p <. 001
- Bold indicates coefficient is sig. different from that for traditional/re-emerging destinations (p<.05).
- Italics indicates coefficient is sig. different from that for traditional/re-emerging destinations (p<0.10).
Table 7. Odds ratios from multinomial logistic regression predicting the probability of migrating to Traditional/renewed and newer gateways (vs. not emigrating).
To traditional, re-emerging gateways To new destinations
---- ----
---- ----
-9,348.4
96,531
---- ----
---- ----
---- ----