Embed Size (px)
Citation preview
Pathways to 2050 – Key Results MARKAL Model Review and Scenarios for DECC’s 4th Carbon Budget Evidence Base Final Report
A report for the Department of Energy and Climate Change
Restricted Commercial ED56609 Issue Number 1 11th May 2011
AEA in Confidence Ref: AEA/ED56609 ii
Customer: Contact:
Department of Energy and Climate Change Adam Hawkes 10th Floor 6 New Street Square London EC4A 3BF t: 0870 190 6786 f: 0870 190 5151 e: [email protected] AEA is a business name of AEA Technology plc AEA is certificated to ISO9001 and ISO14001
Confidentiality, copyright & reproduction:
This report is the Copyright of the Department of Energy and Climate Change and has been prepared by AEA Technology plc under contract to the Department of Energy and Climate Change dated 26th November 2010. The contents of this report may not be reproduced in whole or in part, nor passed to any organisation or person without the specific prior written permission of the Department of Energy and Climate Change. AEA Technology plc accepts no liability whatsoever to any third party for any loss or damage arising from any interpretation or use of the information contained in this report, or reliance on any views expressed therein.
Author:
Adam Hawkes
Approved By:
Heather Haydock
Date:
11th May 2011
Signed:
AEA reference:
ED56609
AEA in Confidence Ref: AEA/ED56609 ii
Executive summary The Climate Change Act 2008 created the requirement for a legislated greenhouse gas emissions reduction target in the UK. This target has been set at a minimum of 80% reduction relative to 1990 levels, to be achieved by 2050. The Act also creates the need to set a series of carbon budgets, which chart the course to achieving the long term 2050 targets via a series of intermediate steps. This report forms part of the evidence base to support government decisions relating to the 4th carbon budget period, which runs from 2023 to 2027.
The investigation presented draws on the MARKAL model of the UK energy system. The MARKAL approach is a widely recognised and internationally supported model that allows the investigator to consider ideal pathways for energy system change, under decarbonisation constraints, in a technology-rich framework with sound economic basis. MARKAL finds the pathway of energy system change that maximises combined consumer and producer surplus, via consideration of technologies, conservation measures, upstream resources, and the reaction of consumers to changes in energy price. The UK MARKAL database contains more than 1,000 resources, conversion technologies and end-use technologies, all of which are considered by the model in choosing the “best” combination of measures and timing of their implementation to achieve the required abatement.
The project consisted of two stages. Firstly, the UK MARKAL database was presented to HMG stakeholders via a series of five workshops. Following these workshops stakeholders were given the opportunity to provide updated data sets and assumptions for input to the model. The second stage of the project applied the updated model to investigate 35 energy system decarbonisation scenarios. The applied modelling proceeded in two phases, initially with variable discount rates according to the sector in which investment occurs, and then with discount rates set to 3.5% across the model and additional constraints added to the database to better emulate investor behaviour.
Stage 1 of the project, where the then existing model was presented and vetted by HMG stakeholders, resulted in significant update and changes to the UK MARKAL database. The key changes were:
1. Revised electricity generation sector costs and constraints, including addition and removal of some technologies from the model.
2. Energy Service demands were generally increased across the model to reflect the government viewpoint.
3. Changes were made to the cost and availability of bio-energy resources, from both domestic and international sources.
In general, it is expected that all the changes made are likely to increase the cost of meeting CO2 reduction targets. This is particularly true of the power sector, where costs of investment and operation were approximately doubled in many cases. Additionally, the increased levels of service demand projected are also likely to bear heavily on the cost of abatement, as each additional unit of energy consumed must be completely decarbonised to retain the same total emissions reduction profile.
A wide range of noteworthy results were observed when the updated model was applied in stage 2 of the project. In relation to the 4th carbon budget period – assuming a budget level based on an equal annual percentage reduction trajectory from 2020 to the 2050 target – several key messages can be drawn out:
1. The cost of abatement in the UK energy system under the core phase 2 run in this study was a £2 billion annual loss (in discounted UK£20101
1 Note that all economic metrics in the Executive Summary are presented in discounted UK£2010. They have been adjusted via
the Green Book discount rate of 3.5% to arrive at present values. The basis of presentation of other economic metrics in this report is described in section 1 below.
) of combined consumer and producer surplus during the budget period. This is the total present-value cost to the economy of meeting the abatement targets, including physical energy system change and the loss of welfare associated with the elasticity of demand. Depending on the ultimate emissions target and availability of technologies, this figure could be as low as £1.5 billion, or as high as £5
AEA in Confidence Ref: AEA/ED56609 iii
billion per year in the most extreme cases (in discounted UK£2010). £2 billion is approximately an eighth of a percent of 2010 GDP.
2. The marginal cost of CO2 reduction observed in the 4th budget period ranged from £10 to £95/tCO2 in discounted UK£2010. In core runs this range reduces to £32 to £37/tCO2. These costs are higher than those of the preceding study using the MARKAL model commissioned by the Committee on Climate Change (Usher et al, 2010), and in many cases higher than would be expected for international CO2 permits. If the marginal price of CO2 reduction in the UK were to approach levels observed in the more extreme model results, it would be expected that a great degree of innovation would result, and the UK would have the recourse to buy international permits.
3. Demand response (i.e. behavioural/activity change to reduce service demand in response to increasing energy prices) plays an important part in all abatement scenarios. In general, average service demand met was reduced by 15-20% from their original projected values. This impact is substantial and there are concerns over its impact on welfare, but it does aid decarbonisation substantially in the modelling.
4. The key technical changes in the energy system over the 4th budget are:
a. Power sector decarbonisation. During the 4th budget period the emissions intensity of grid electricity would halve (from ~0.3 to ~0.15 kgCO2/kWh). This is driven by rapid introduction of nuclear power and a portfolio of renewable electricity technologies.
b. The beginnings of wholesale decarbonisation of the transport sector via the introduction of battery electric vehicles.
c. Mass adoption of heat pumps in the residential sector to serve space and water heating needs, and similar but more technically diverse decarbonisation measures in heating in the Services sector.
d. Uptake of all cost-effective conservation measures, particularly as they relate to thermal energy use in buildings. By 2025 the impact of conservation would be double that of measures installed over the past 10 years, mainly due to uptake in the residential sector.
5. Of all the sensitivities observed in the model, those relating to the power sector have the most significant impact on economic metrics. For example, where the power sector is extremely constrained (i.e. limited nuclear power, no CCS beyond planned demonstration plants, and limited renewables available) the cost of abatement during the 4th budget increases to the maximum of £95/tCO2. This is substantially higher than the expected price of international carbon permits in the 4th budget period, and as such it is unlikely that the UK economy would be exposed to it in practice.
6. Overall, whilst decarbonisation is apparent in all sectors during the 4th budget, it is focused in power generation and the residential and services sectors. The other key sectors in the model, transport and industry, show more action later in the timeframe to 2050.
Overall the 4th budget period is characterised by significant investment in the power sector to achieve low carbon electricity. This is accompanied by electrification in residential and transport sectors, and of course this activity is dependent on the parallel power sector decarbonisation. Moreover, when longer term costs and technical choices in relation to abatement are considered, further lessons of relevance to the 4th budget period and beyond are apparent. A notable point in this regard is that the optimal overall trajectory of CO2 reduction suggests that extensive and resolute action in the 2020s provides the best outcomes. Where MARKAL is given freedom regarding when to abate, it chooses even more stringent targets over the 4th budget period. The message here is that it is better from long term social welfare perspective to accept high costs in the 4th budget period, because this is a key enabling step to more manageable long term decarbonisation. Indeed it has been shown in this project that delaying action until after the 2020s, but still striving for the same cumulative emissions reduction, is extremely technically challenging and very expensive.
When the timeframe beyond the 4th budget is contemplated, it is clear that there are a number of pathways and corresponding technical options available to achieve the required 90% national
AEA in Confidence Ref: AEA/ED56609 iv
emissions reduction target2
2 Note that the scope of emissions included in UK MARKAL requires a 90% reduction target, as opposed to the legislated 80%
target, because MARKAL does not include international aviation and shipping, or non-CO2 greenhouse gases. This is explained further in section 1.3.1.
. The most important technical options are carbon capture and storage (CCS) both in industry and power generation, large scale renewables – notably wind power, marine renewables, continuing rapid investment in nuclear power, mass market heat pumps, and a diverse range of low carbon transport technologies. However, should any one of these, or even certain combinations, turn out to be unavailable then there are generally other remaining options available to achieve the targets, although potentially at substantially greater cost. In terms of policy development, this suggests broad support for low carbon technologies is still appropriate, along with a pressing need for demonstration of key unproven technologies such as CCS, marine renewables, electric vehicles and heat pumps. Further consideration should also be given to the impact of factors external to the UK on the cost and effectiveness of energy system decarbonisation, such as availability and price of fuels including bio-energy resources, and the development and international supply chains related to the key technologies described above. Each of these areas will benefit from further focused investigation, and many are already being taken forward in technology or sector-specific analyses commissioned by DECC.
If key technologies do materialise and the bulk of decarbonisation is achieved, still further attention will need to be paid to smaller sources of emissions, as these become increasingly important if deep targets are to be met. These include non-energy uses of fuel, process emissions in industry (not characterised in MARKAL), fugitive emissions in energy supply, and many others described in this report. Further investigation is required to assess the extent to which these emissions fall under existing policy instruments, and the nature of policy instruments that may be able to address them.
AEA in Confidence Ref: AEA/ED56609 v
Table of contents 1 Project Overview ........................................................................................................................................ 6
1.1 Project Stage 1 ............................................................................................................................ 7
1.2 Project Stage 2 ............................................................................................................................ 7
1.3 The UK MARKAL Database ........................................................................................................ 9
2 A Cross-Section of Results ..................................................................................................................... 11
2.1 Description of the Baseline ........................................................................................................ 11
2.2 Key Result Metrics .................................................................................................................... 11
2.3 The 4th Carbon Budget Period ................................................................................................... 13
2.4 The Residential and Services Sectors ....................................................................................... 20
2.5 The Transport Sector ................................................................................................................ 21
2.6 The Industry Sector ................................................................................................................... 22
2.7 Variations on Demand, Price and Emissions Reduction ........................................................... 23
2.8 The Impact of Demand Response ............................................................................................. 25
3 Acronyms and Abbreviations.................................................................................................................. 27
4 References ................................................................................................................................................ 28
AEA in Confidence Ref: AEA/ED56609 6
1 Project Overview The Climate Change Act 2008 (HM Government, 2008) created the requirement for UK government to set a series of carbon budgets, charting a pathway of medium term greenhouse gas emissions reductions that are consistent with reaching at least 80% reduction by 2050, relative to 1990 levels. At the time of writing, the Department of Energy and Climate Change needs to take a view on the 4th carbon budget (2023-2027).
In order to create a base of evidence to inform this 4th carbon budget, DECC commissioned this project to provide information on key trade-offs between resources, technologies and sectors, where total CO2 emissions are constrained. The project proceeded in two stages:
• Stage 1: Stakeholder workshops and database update. Five workshops were held with cross-Whitehall participants and invited MARKAL experts. These workshops presented and vetted the then-current version of the UK MARKAL database; version 3.25. Database updates were then suggested and incorporated into a new version of the database; version 3.26.
• Stage 2: Model runs investigating energy system pathways to 2050. The new version of the UK MARKAL database was then applied in a series of studies to examine the impact of policy, resource availability, technology availability, and demand response. In total the model was applied to study 35 abatement scenarios.
The outcomes of the project are an improved appreciation of the model across government, an updated model database including significantly revised power sector, and a set of scenarios based on the new database that can help to inform decisions regarding the 4th carbon budget period and further into the future.
The following sub-sections provide more details regarding each stage of the project, and a basic summary and recent history of the UK MARKAL database.
Presentation of economic metrics in this report
All costs associated with a specific year in the body of this report are presented in undiscounted real year 2010 UK pounds, except where explicitly stated. This means they are adjusted for inflation, but not for the green book real discount rate (3.5%).
All costs associated with the entire time horizon are presented in discounted year 2010 pounds, using the green book discount rate. The timeframe for which these metrics applies is 2010 to 2050.
AEA in Confidence Ref: AEA/ED56609 7
1.1 Project Stage 1
Before the modelling could begin it was necessary to update the UK MARKAL database to reflect current government thinking, and to improve understanding of the strengths and weaknesses of the MARKAL approach amongst HMG stakeholders. As such, the first stage of the project centred on knowledge building regarding the premise of the MARKAL approach, followed by vetting and update of input assumptions in UK MARKAL. Five workshops were held attended by relevant personnel from DfT, DECC, Defra, CLG, HMT, BIS and the CCC. The key technical output was a government policy-consistent version of the model, which was supported by an interim report detailing the findings of the review.
The five workshops held were structured as follows:
1. Introductory and cross-cutting issues
2. Power Sector
3. Industry, Services and Agriculture Sectors
4. Transport Sector
5. Residential Sector
Following the workshops a database update was performed and reported upon. The nature of changes made is detailed in the companion report “Pathways to 2050 – MARKAL Database Updates”. The primary changes were made in the power sector and in relation to the projected level of service demand in future decades. In general, the cost of power generation technologies has increased substantially, and the level of service demand increased. Both of these changes make it more difficult and costly to achieve long term abatement targets.
A further array of minor changes was made to the database. These primarily relate to the cost and performance of technologies across end-use sectors, and the availability and cost of some resources.
1.2 Project Stage 2
Stage two of the project focussed on application of the updated model to explore the main sensitivities relevant to the 4th carbon budget, bounded by the fact that long term 2050 abatement targets must also be satisfied. A set of model runs, designed to explore these issues, was undertaken and reported upon.
The modelling consisted of two distinct phases, with the crucial difference between these phases being the imposition of the green book discount rate (3.5%) across the model in phase 2, versus discount rates differentiated by sector in phase 1. A further key difference between these phases was the introduction of “constraints and frictions” into the model to better emulate the dynamics of uptake of technologies. Where the model projected extremely rapid uptake of particular technologies, constraints were imposed to prevent such rapid switches. These and further constraints applied in phase 2 of the modelling are presented in the companion report “Pathways to 2050 – MARKAL Database Updates”.
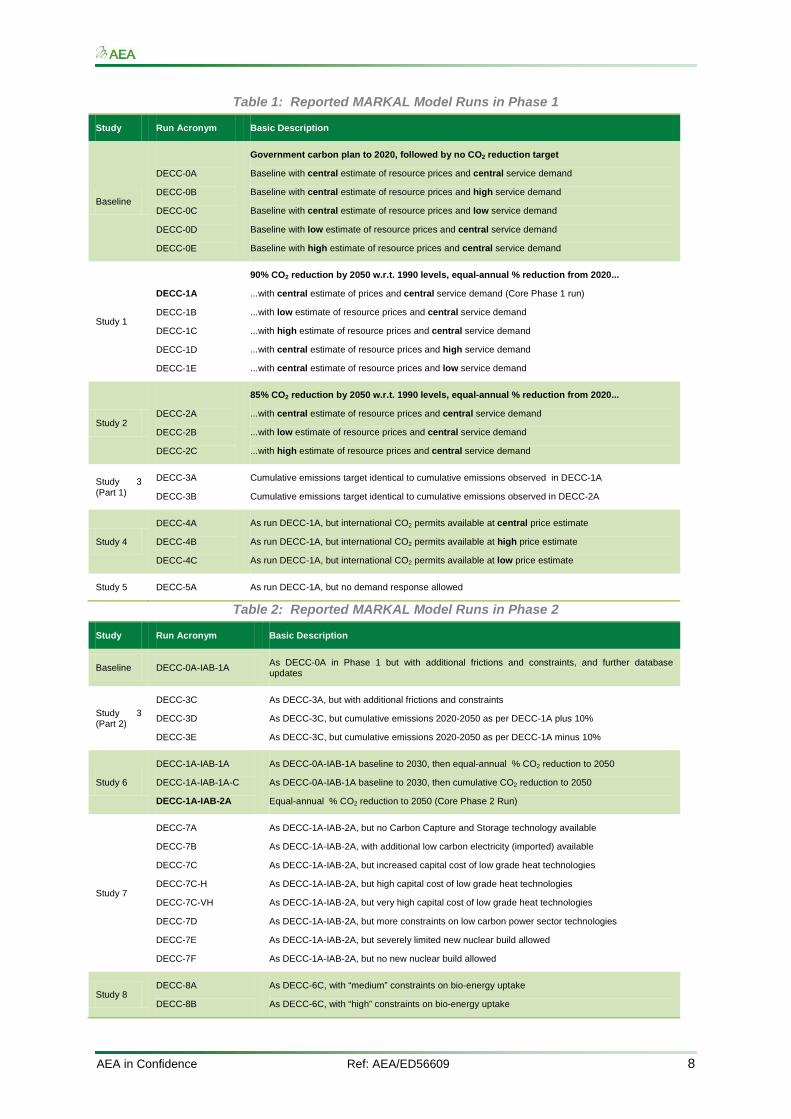
The model runs undertaken are presented in Table 1 and Table 2. Run DECC-1A is the core run for phase 1 of the modelling, and DECC-1A-IAB-2A is the core run for phase 2 of the modelling.
AEA in Confidence Ref: AEA/ED56609 8
Table 1: Reported MARKAL Model Runs in Phase 1
Study Run Acronym Basic Description
Baseline
DECC-0A
DECC-0B
DECC-0C
DECC-0D
DECC-0E
Government carbon plan to 2020, followed by no CO2 reduction target
Baseline with central estimate of resource prices and central service demand
Baseline with central estimate of resource prices and high service demand
Baseline with central estimate of resource prices and low service demand
Baseline with low estimate of resource prices and central service demand
Baseline with high estimate of resource prices and central service demand
Study 1
DECC-1A
DECC-1B
DECC-1C
DECC-1D
DECC-1E
90% CO2 reduction by 2050 w.r.t. 1990 levels, equal-annual % reduction from 2020...
...with central estimate of prices and central service demand (Core Phase 1 run)
...with low estimate of resource prices and central service demand
...with high estimate of resource prices and central service demand
...with central estimate of resource prices and high service demand
...with central estimate of resource prices and low service demand
Study 2
DECC-2A
DECC-2B
DECC-2C
85% CO2 reduction by 2050 w.r.t. 1990 levels, equal-annual % reduction from 2020...
...with central estimate of resource prices and central service demand
...with low estimate of resource prices and central service demand
...with high estimate of resource prices and central service demand
Study 3 (Part 1)
DECC-3A
DECC-3B
Cumulative emissions target identical to cumulative emissions observed in DECC-1A
Cumulative emissions target identical to cumulative emissions observed in DECC-2A
Study 4
DECC-4A
DECC-4B
DECC-4C
As run DECC-1A, but international CO2 permits available at central price estimate
As run DECC-1A, but international CO2 permits available at high price estimate
As run DECC-1A, but international CO2 permits available at low price estimate
Study 5 DECC-5A As run DECC-1A, but no demand response allowed
Table 2: Reported MARKAL Model Runs in Phase 2
Study Run Acronym Basic Description
Baseline DECC-0A-IAB-1A As DECC-0A in Phase 1 but with additional frictions and constraints, and further database updates
Study 3 (Part 2)
DECC-3C
DECC-3D
DECC-3E
As DECC-3A, but with additional frictions and constraints
As DECC-3C, but cumulative emissions 2020-2050 as per DECC-1A plus 10%
As DECC-3C, but cumulative emissions 2020-2050 as per DECC-1A minus 10%
Study 6
DECC-1A-IAB-1A
DECC-1A-IAB-1A-C
DECC-1A-IAB-2A
As DECC-0A-IAB-1A baseline to 2030, then equal-annual % CO2 reduction to 2050
As DECC-0A-IAB-1A baseline to 2030, then cumulative CO2 reduction to 2050
Equal-annual % CO2 reduction to 2050 (Core Phase 2 Run)
Study 7
DECC-7A
DECC-7B
DECC-7C
DECC-7C-H
DECC-7C-VH
DECC-7D
DECC-7E
DECC-7F
As DECC-1A-IAB-2A, but no Carbon Capture and Storage technology available
As DECC-1A-IAB-2A, with additional low carbon electricity (imported) available
As DECC-1A-IAB-2A, but increased capital cost of low grade heat technologies
As DECC-1A-IAB-2A, but high capital cost of low grade heat technologies
As DECC-1A-IAB-2A, but very high capital cost of low grade heat technologies
As DECC-1A-IAB-2A, but more constraints on low carbon power sector technologies
As DECC-1A-IAB-2A, but severely limited new nuclear build allowed
As DECC-1A-IAB-2A, but no new nuclear build allowed
Study 8 DECC-8A
DECC-8B
As DECC-6C, with “medium” constraints on bio-energy uptake
As DECC-6C, with “high” constraints on bio-energy uptake
AEA in Confidence Ref: AEA/ED56609 9
1.3 The UK MARKAL Database
For the uninitiated reader, this section provides a brief overview of the MARKAL model and its UK incarnation.
MARKAL (acronym for MARKet ALlocation) was initially developed by the International Energy Agency (IEA) Energy Technologies Systems Analysis Programme. It is a widely applied bottom-up, dynamic, linear programming optimisation model which has been adapted for use in many countries, including the Japan, Germany, South Korea, Sweden, the US as well as the UK. As such, it represents a widely accepted modelling paradigm, and benefits from decades of development and an active international base of cooperation.
UK MARKAL is the UK-version of the model which has been developed since the 1990s by AEA, UCL? and various public sector organisations. It models the entire energy system at an aggregate level, but maintains the richness of technical detail that distinguishes the MARKAL approach. It models all aspects of the energy system, from imports and domestic resources (e.g. coal, oil, natural gas) through upstream fuel processing and supply, explicit representation of infrastructures, conversion to secondary energy carriers (including electricity, heat and hydrogen), end-use technologies and energy service demands in the industrial, commercial, residential, transport and agricultural sectors. It does not model emissions from international transport or non-energy non-CO2 GHGs from agriculture, waste and land-use land-use change and forestry (LULUCF).
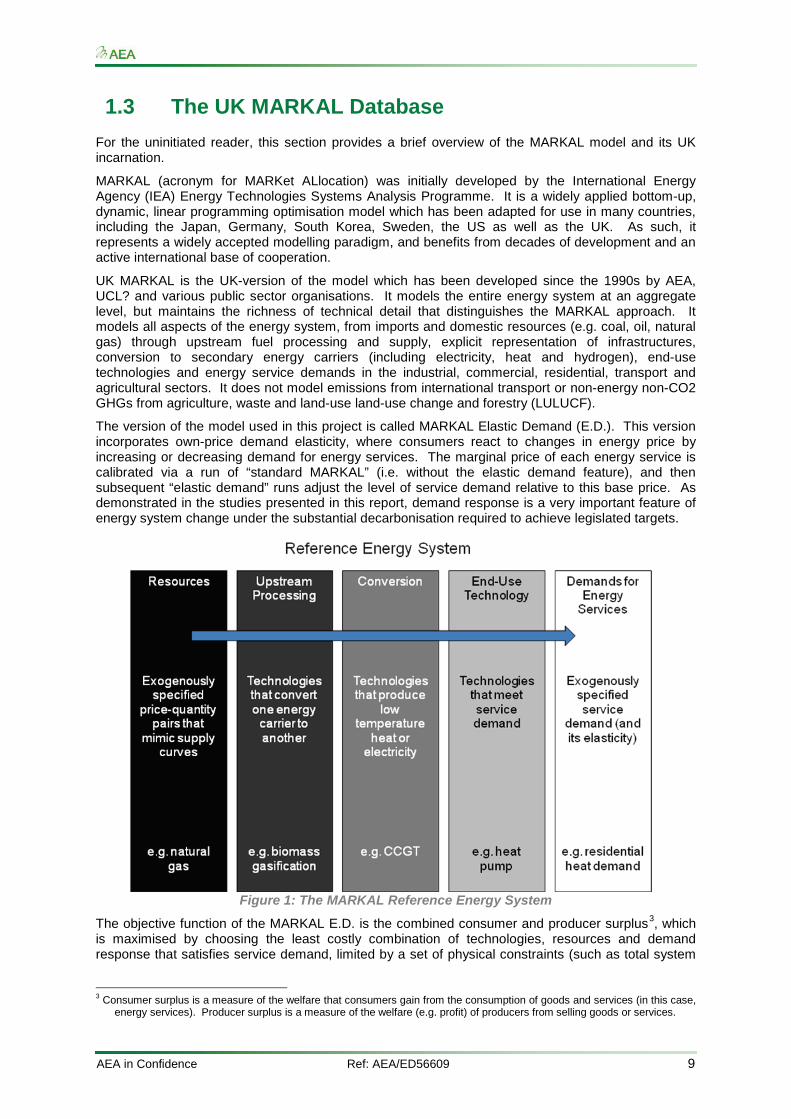
The version of the model used in this project is called MARKAL Elastic Demand (E.D.). This version incorporates own-price demand elasticity, where consumers react to changes in energy price by increasing or decreasing demand for energy services. The marginal price of each energy service is calibrated via a run of “standard MARKAL” (i.e. without the elastic demand feature), and then subsequent “elastic demand” runs adjust the level of service demand relative to this base price. As demonstrated in the studies presented in this report, demand response is a very important feature of energy system change under the substantial decarbonisation required to achieve legislated targets.
Figure 1: The MARKAL Reference Energy System
The objective function of the MARKAL E.D. is the combined consumer and producer surplus3
3 Consumer surplus is a measure of the welfare that consumers gain from the consumption of goods and services (in this case,
energy services). Producer surplus is a measure of the welfare (e.g. profit) of producers from selling goods or services.
, which is maximised by choosing the least costly combination of technologies, resources and demand response that satisfies service demand, limited by a set of physical constraints (such as total system
AEA in Confidence Ref: AEA/ED56609 10
CO2 emissions, specific technology uptake rates or limits on consumer demand). Figure 1 shows a basic MARKAL reference energy system.
Overall, the UK MARKAL model is well recognised as a tool for the analysis of the UK energy system. There is a detailed and comprehensive collection of documentation to which the reader is directed. Key documentation is available on the website of the Energy Technology Systems Analysis Programme (www.etsap.org), including Loulou, Goldstein and Noble (2004) which presents a complete description of the model equations and approach. Also, more specific to the UK incarnation of the model, Kannan et al. (2007) presents a description of its structure and assumptions. The most recent application of the model in UK policy making prior to this project was commissioned by the Committee on Climate Change to provide an evidence base for its recommendations on the 4th carbon budget period. The report associated with that project is available online (Usher and Strachan, 2010). Chapter 3 of Usher and Strachan (2010) provides detail on the updates made in that project, which created version 3.25 of the database.
The present project builds on the historical development of the model database by AEA and academic institutions, to allow DECC to create a version that is consistent with the present viewpoint of government, and to explore how changes in assumptions impact the findings of the previous study for the CCC. The starting point for this project is model database version 3.25. The modifications made during this project, which and constitute the changes made to create version 3.26 of the database, are outlined in the companion report to this one “Pathways to 2050 – MARKAL Database Updates”.
1.3.1 The CO2 Reduction Target in UK MARKAL
The UK MARKAL model covers CO2 emissions from energy use and does not model non-CO2 GHGs, LULUCF and international aviation and shipping sectors. As a consequence the 80% 2050 target covering all GHGs on the net UK carbon account needs to be translated to a ‘MARKAL equivalent’. This requires judgements to be made on the level of emissions from non-CO2 GHGs and LULUCF sources in 2050, and consideration to take into account international transport for sensitivity analysis where these sectors are in future included in the UK target. DECC’s evidence based on an efficient share of global abatement suggests the UK’s 2050 target ought to be considered as an efficient share of global effort, and met territorially.
Assumptions have been taken to provide a central, high and low estimate of non-energy non-CO2 GHG emissions in 2050. Deducting these emission levels from the overall 2050 target level (156MtCO2e in 2050) implies energy related CO2 emissions represented by MARKAL need to fall by at least 85% on central forecasts (83-87% when considering respective low and high emission sensitivities in agriculture and forestry). A 90% reduction could be interpreted as a sensitivity around the uncertainty in non-CO2 GHG emissions.
The inclusion of international aviation increases the MARKAL equivalent 2050 target to 91% (87-94% sensitivities) for the non-CO2 GHGs and domestic sectors, and including international shipping on top of this increases the target to 97% (92-99% sensitivity). This assumes no additional abatement from shipping, and current policy measures only for aviation (as at December 2009). From this assessment, given the uncertainty range of non-CO2 GHG projections, and rounding to avoid spurious accuracy, it would seem prudent to consider a reduction of at least 90% in CO2 emissions by 2050, alongside 85% reduction scenarios. This does not fully take into account all international transport emissions as projected – but with more stringent targets, if this turned out to be the case, one would expect more abatement to be occurring in the non-CO2 GHG, LULUCF and international sectors than the current forecasted central trends (suggesting the low-end range), and that there could also be a role for international carbon trading.
A further point to note regarding the CO2 target applied in this project is the trajectory of reductions. In the majority of runs this trajectory has been assumed to be an equal-annual percentage reduction in emissions (the only exception to this are the cumulative emissions runs). This equal annual percentage reduction is imposed to prevent the model from delaying action implausibly, where the scale of investment late in the timeframe would be unachievable. It is also possible to create this model behaviour via investment constraints on each technology, but such extensive database updates were beyond the scope of this project.
AEA in Confidence Ref: AEA/ED56609 11
2 A Cross-Section of Results This section presents a cross-section of the study results. It brings together the individual studies presented in the companion report “Pathways to 2050 – Detailed Analyses”. The focus of discussion here is on 4th carbon budget period, from 2023 to 2027, within the context that legislated long term emissions reduction targets must also be met. UK MARKAL’s 2025 time step corresponds directly to the 4th budget period.
2.1 Description of the Baseline
The modelling undertaken and presented here is of course subject to a number of assumptions. These have been developed in consultation with DECC over the course of the project, and represent incremental changes and improvements in the model as results from earlier runs emerged. As with much mitigation modelling, a key assumption made revolves around definition of a baseline scenario for comparison with the mitigation scenarios. The “baseline philosophy” adopted in this project can be broadly summarised by two statements:
• The impact of the government carbon plan (HM Government, 2011) to 2020 is included in the baseline on the assumption that policy and initiatives are already in place to achieve it. For key technologies and policies this representation is explicit; actual penetrations of specific system and targets are included. For other policies the representation is indirect, and a UK-wide CO2 emissions constraint has been imposed to mimic the assumed impact of the carbon plan. Therefore a price of CO2 reduction is apparent even in the baseline runs, in years up to 2020.
• All technical and resource options available to the abated system are always also available to the baseline system. Where a new technology or resource has been added to the database during the project, the database has been re-calibrated to take account of this. This means that all changes in economic parameters with respect to the baseline (e.g. loss of combined consumer and producer surplus – the key MARKAL ED metric) and the demand response observed are a result of the overarching CO2 constraint only.
The results presented in this section and throughout this report should be interpreted in light of these assumptions regarding the baseline.
2.2 Key Result Metrics
The studies of energy system change presented here are split into two parts, relating to each of the two phases described in section 1.2 above. The distinction between these parts is primarily in the discount rates applied to capital investment4
The vital statistics
, and in relation to additional uptake constraints and “frictions” imposed in phase 2 of the modelling. In the first part (Phase 1), various discount rates are applied according to the sector in which the investment occurs. These discount rates are set out in the companion report “Pathways to 2050 – MARKAL Database Updates”. The second part (Phase 2) set all of these discount rates to be equal to the Green Book rate of 3.5%, as is appropriate for a study with the social perspective.
5 Table 3 of the results achieved are presented in . As expected, the discounted loss of surplus is generally lower in phase 2 studies, reflecting the lower discount rate used to annuitize capital investments. The average total discounted loss of surplus over the entire timeframe is of the order of £210-260 billion (in 2010 UK pounds), relating to the cost of technical change and demand response required to achieve long term abatement targets over the period from 2010 to 2050. Both the costs of technical system change and demand response are important, but in most runs demand response has more impact on loss of surplus. This indicates that the marginal cost 4 MARKAL distinguishes discount rates applied to annuitized capital investment, and discount rates applied to calculate present
values. Choice of these rates reflects the viewpoint of the initiator of the study. 5 Basic metrics provided for information only. Results between part 1 and part 2 presented in this table are not directly
comparable without the details of the studies included.
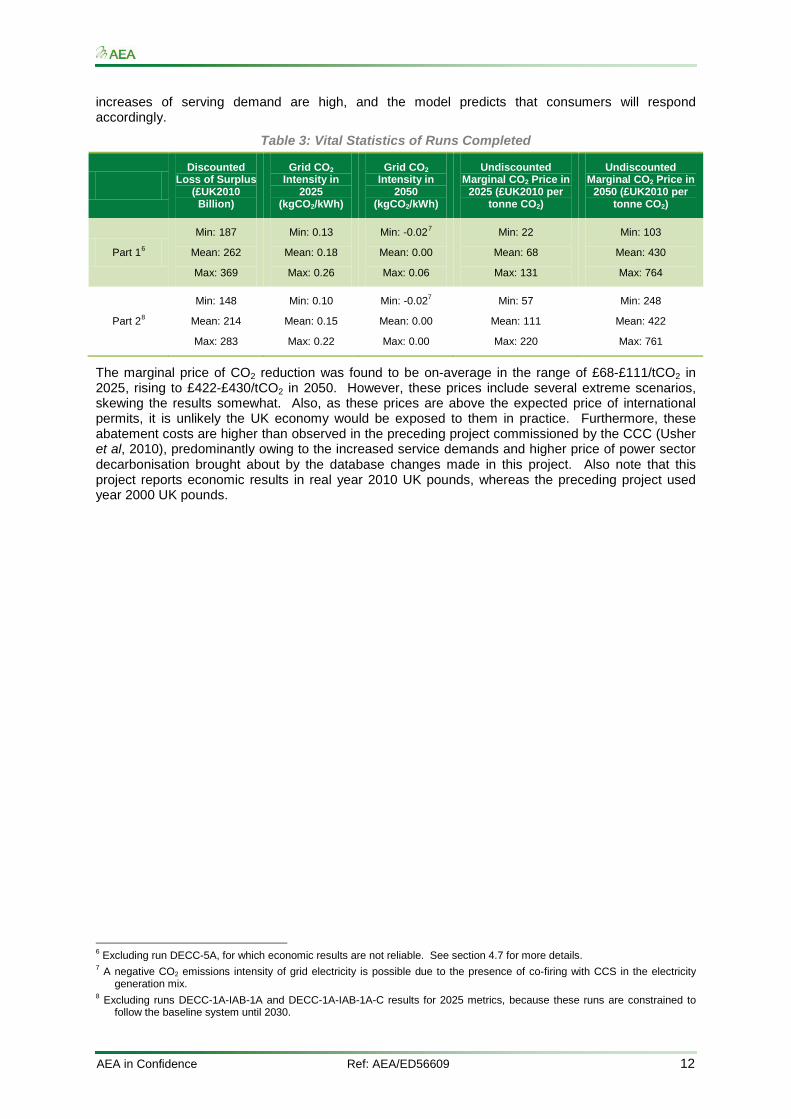
AEA in Confidence Ref: AEA/ED56609 12
increases of serving demand are high, and the model predicts that consumers will respond accordingly.
Table 3: Vital Statistics of Runs Completed
Discounted Loss of Surplus
(£UK2010 Billion)
Grid CO2 Intensity in
2025 (kgCO2/kWh)
Grid CO2 Intensity in
2050 (kgCO2/kWh)
Undiscounted Marginal CO2 Price in
2025 (£UK2010 per tonne CO2)
Undiscounted Marginal CO2 Price in
2050 (£UK2010 per tonne CO2)
Part 16
Min: 187
Mean: 262
Max: 369
Min: 0.13
Mean: 0.18
Max: 0.26
Min: -0.027 Min: 22
Mean: 68
Max: 131
Mean: 0.00
Max: 0.06
Min: 103
Mean: 430
Max: 764
Part 28
Min: 148
Mean: 214
Max: 283
Min: 0.10
Mean: 0.15
Max: 0.22
Min: -0.027
Mean: 0.00
Max: 0.00
Min: 57
Mean: 111
Max: 220
Min: 248
Mean: 422
Max: 761
The marginal price of CO2 reduction was found to be on-average in the range of £68-£111/tCO2 in 2025, rising to £422-£430/tCO2 in 2050. However, these prices include several extreme scenarios, skewing the results somewhat. Also, as these prices are above the expected price of international permits, it is unlikely the UK economy would be exposed to them in practice. Furthermore, these abatement costs are higher than observed in the preceding project commissioned by the CCC (Usher et al, 2010), predominantly owing to the increased service demands and higher price of power sector decarbonisation brought about by the database changes made in this project. Also note that this project reports economic results in real year 2010 UK pounds, whereas the preceding project used year 2000 UK pounds.
6 Excluding run DECC-5A, for which economic results are not reliable. See section 4.7 for more details. 7 A negative CO2 emissions intensity of grid electricity is possible due to the presence of co-firing with CCS in the electricity
generation mix. 8 Excluding runs DECC-1A-IAB-1A and DECC-1A-IAB-1A-C results for 2025 metrics, because these runs are constrained to
follow the baseline system until 2030.
AEA in Confidence Ref: AEA/ED56609 13
2.3 The 4th Carbon Budget Period
The results of modelling suggest the 4th carbon budget period could represent an important enabling step for the UK energy system. In order to minimise welfare loss associated with the long term low carbon transition, the 4th budget period would be characterised by:
• significant investment, particularly in the power sector, running at approximately 6GW new capacity per year in the 3rd and 4th budget periods.
• extremely rapid decarbonisation of grid electricity,
• the beginnings of a wholesale shift to low carbon transport,
• almost exclusive uptake of heat pumps in the residential sector, and
• fuel switching for heating in the services sector.
MARKAL E.D. maximises the discounted combined consumer and producer surplus over the entire timeframe of the model (i.e. 2000 to 2050). Hence the energy system pathway that is cheapest overall may not be cheapest during the 4th carbon budget period. In fact, the economic impacts of system changes are considerable in the 4th budget period, which is particularly notable because investment in supply side technologies reaches its peak at or near this time.
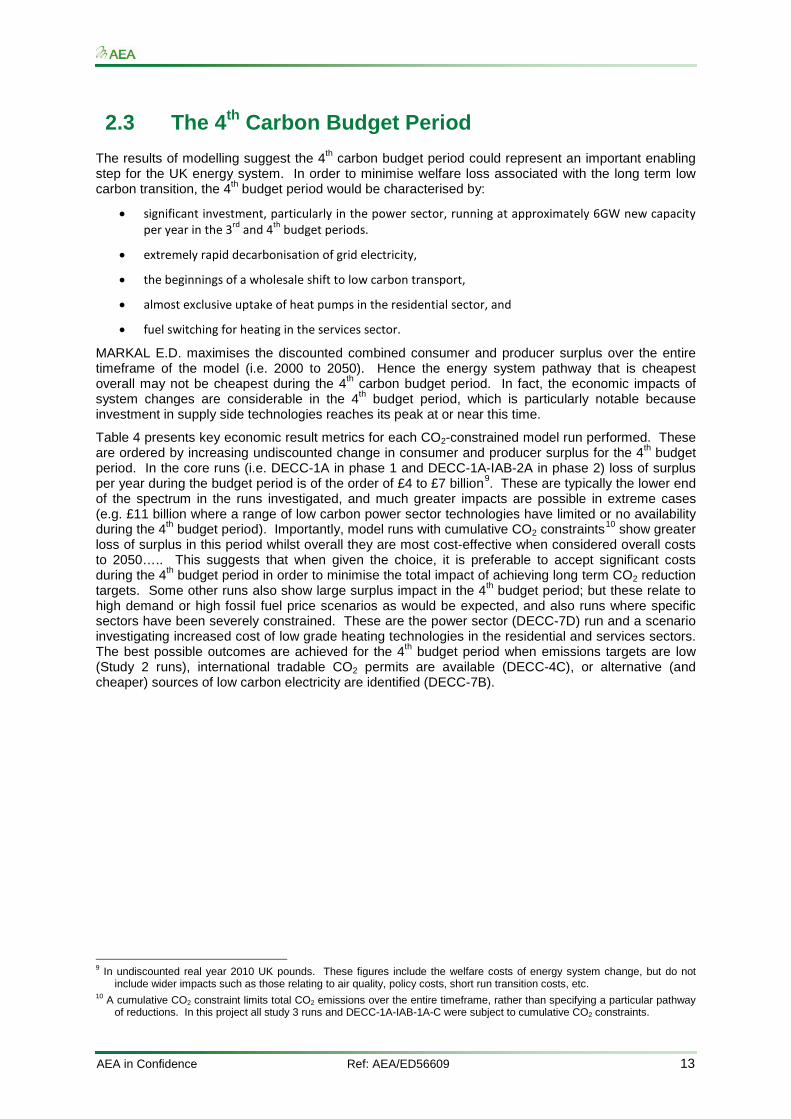
Table 4 presents key economic result metrics for each CO2-constrained model run performed. These are ordered by increasing undiscounted change in consumer and producer surplus for the 4th budget period. In the core runs (i.e. DECC-1A in phase 1 and DECC-1A-IAB-2A in phase 2) loss of surplus per year during the budget period is of the order of £4 to £7 billion9. These are typically the lower end of the spectrum in the runs investigated, and much greater impacts are possible in extreme cases (e.g. £11 billion where a range of low carbon power sector technologies have limited or no availability during the 4th budget period). Importantly, model runs with cumulative CO2 constraints10
9 In undiscounted real year 2010 UK pounds. These figures include the welfare costs of energy system change, but do not
include wider impacts such as those relating to air quality, policy costs, short run transition costs, etc. 10 A cumulative CO2 constraint limits total CO2 emissions over the entire timeframe, rather than specifying a particular pathway
of reductions. In this project all study 3 runs and DECC-1A-IAB-1A-C were subject to cumulative CO2 constraints.
show greater loss of surplus in this period whilst overall they are most cost-effective when considered overall costs to 2050….. This suggests that when given the choice, it is preferable to accept significant costs during the 4th budget period in order to minimise the total impact of achieving long term CO2 reduction targets. Some other runs also show large surplus impact in the 4th budget period; but these relate to high demand or high fossil fuel price scenarios as would be expected, and also runs where specific sectors have been severely constrained. These are the power sector (DECC-7D) run and a scenario investigating increased cost of low grade heating technologies in the residential and services sectors. The best possible outcomes are achieved for the 4th budget period when emissions targets are low (Study 2 runs), international tradable CO2 permits are available (DECC-4C), or alternative (and cheaper) sources of low carbon electricity are identified (DECC-7B).
AEA in Confidence Ref: AEA/ED56609 14
Table 4: Economic Outcomes in the 4th Carbon Budget Period. Reported in ascending order of undiscounted change in consumer/producer surplus (w.r.t. baseline) in the 4th budget period.
Core runs in Bold.
Run Acronym
Change in Consumer/Producer
Surplus in 2025 (Undiscounted Real 2010 UK£ Billions
per year)
Discounted Change in
Consumer/Producer Surplus from 2010
to 2050 (Discounted 2010 UK£ Billions) – ranking provided in
brackets
Economic Impact of Demand Response in 2025 (Undiscounted
Real 2010 UK£ Billions per year)
Annually Adjusted Total System Cost in 2025 (Undiscounted
Real 2010 UK£ Billions per year)
DECC-5A -11.4 -556 (1) 0.0 270.1
DECC-3A -10.9 -294 (4) 14.8 254.8
DECC-3E -9.0 -251 (12) 8.6 238.9
DECC-3B -8.5 -233 (14) 12.7 254.5
DECC-1D -8.4 -369 (2) 11.0 265.9
DECC-7C-H -8.4 -227 (15) 7.1 241.2
DECC-7C-VH -8.1 -283 (8) 9.5 243.9
DECC-7D -7.7 -214 (18) 11.4 234.9
DECC-1B -7.7 -322 (3) 8.8 240.3
DECC-3C -7.7 -198 (22) 7.8 238.4
DECC-3D -6.8 -157 (26) 7.0 238.2
DECC-1A -6.6 -293 (5) 10.3 255.0
DECC-7F -6.6 -260 (10) 7.6 238.0
DECC-4B -6.4 -286 (7) 8.1 257.0
DECC-1C -6.1 -287 (6) 10.5 266.4
DECC-2B -5.5 -237 (13) 7.1 239.7
DECC-7A -5.4 -268 (9) 7.5 236.2
DECC-7E -5.4 -217 (=16) 6.7 237.3
DECC-8B -5.3 -209 (20) 6.3 237.7
DECC-7C -4.9 -206 (21) 6.7 238.1
DECC-4A -4.8 -246 (11) 6.6 256.9
DECC-1A-IAB-2A -4.5 -195 (=23) 6.5 236.4
DECC-1E -4.5 -231 (14) 7.7 242.3
DECC-8A -4.3 -195 (=23) 6.0 236.8
DECC-2A -4.0 -213 (17) 6.7 256.0
DECC-2C -4.0 -217 (=16) 8.0 266.8
DECC-7B -3.8 -178 (25) 4.7 237.1
DECC-4C -3.5 -187 (24) 4.4 257.8
DECC-1A-IAB-1A-C -0.111 -148 (27) 0.0 238.6
DECC-1A-IAB-1A -0.111 -213 (19) 0.0 238.6
DECC-0E 0.0 0.0 0.0 270.8
DECC-0B 0.0 0.0 0.0 268.5
DECC-0A 0.0 0.0 0.0 258.7
DECC-0C 0.0 0.0 0.0 245.5
DECC-0D 0.0 0.0 0.0 241.3
DECC-0A-IAB-1A 0.0 0.0 0.0 238.5
The following sub-sections present more details of results for specific aspects of the energy system during the 4th carbon budget.
11 Small change in surplus observed here relates to the fact that MARKAL has perfect foresight and pre-empts future emissions
targets. Ideally it would follow the baseline system perfectly until 2030 in these runs, resulting in change in surplus of zero, but small departures are apparent due to modelling constraints. For more detail see section 4.8.
AEA in Confidence Ref: AEA/ED56609 15
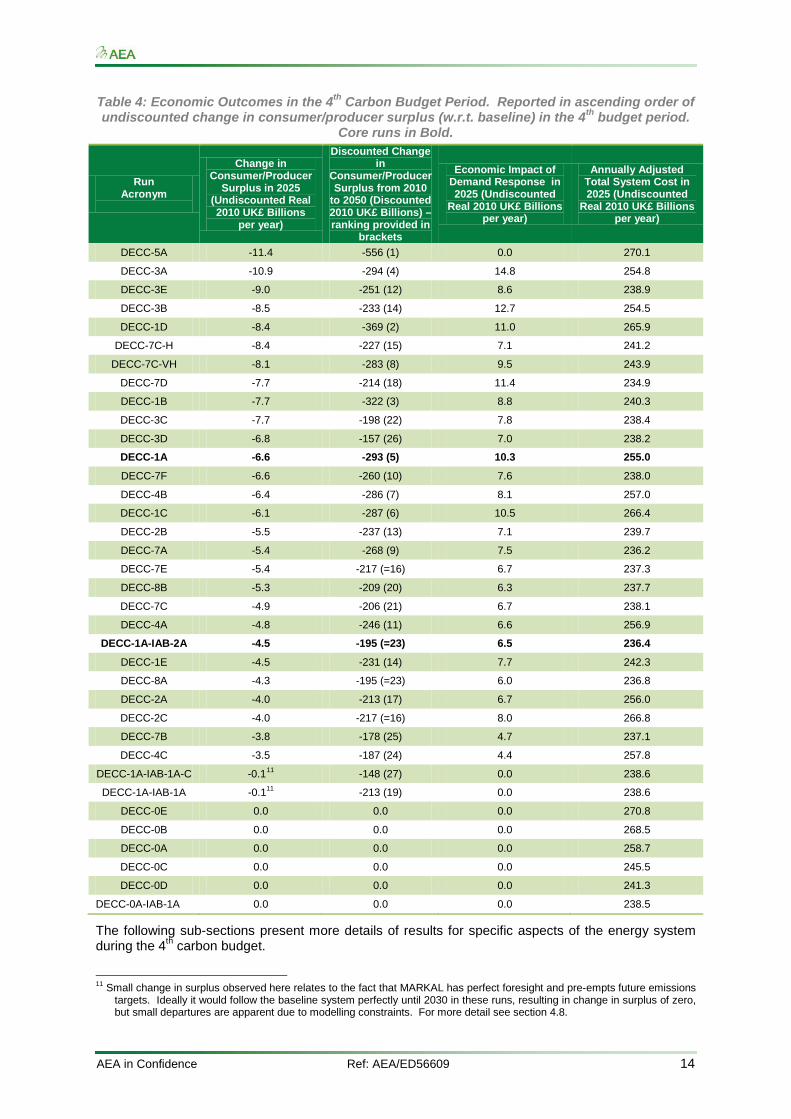
2.3.1 The Marginal Price of CO2
The range of marginal CO2 prices observed under the abatement targets are shown in Figure 2 in undiscounted real terms (2010 prices), for the 4th budget period (2025) and the end of the time horizon (2050). For the 4th budget period there is more certainty around CO2 price, which follows from the lower emissions target (relative to those of 2050). The expected price of marginal CO2 reduction in the 4th budget period is in the range of £68 to £111/tCO2. This is higher than figures available from other studies, relating to the increase in the price of power sector decarbonisation incorporated into this project, and higher levels of projected service demand in each end-use sector. Furthermore, the higher marginal CO2 prices are associated with the more extreme scenarios, where certain technologies are not available or demand is significantly higher than the central estimate. In the core runs (expected levels of demand and technology availability) the price of CO2 was £75 to £85/tCO2. A further noteworthy caveat is that many CO2 prices seen in the results are well above the expected international price of CO2 permits, suggesting that other means will be available to achieve medium terms abatement targets.
The most extreme marginal CO2 prices in 2025 occur under run DECC-7D, which constrains a range of low carbon power sector technologies, and this result is consistent with the rapid power sector investment observed in all scenarios; in essence, rapid power sector decarbonisation is crucial to alleviate overall costs. The lowest costs occur when international carbon credits are available for purchase, indicating that there may be a greater role for credit purchase than estimated in previous studies.
Figure 2: Marginal Price of CO2 across the 35 runs in the Project (Undiscounted Real UK£2010)
By 2050, that range of possible abatement costs is much greater. In this case the highest cost relate to scenarios where demand response is not allowed, and again where some key power sector technologies (CCS, nuclear power and renewables) are constrained. The expected price of marginal CO2 abatement by 2050 reaches around £400/tCO2, in undiscounted 2010 UK pounds. This is a high carbon price, and should be interpreted in the context that the model only includes known abatement options. It is possible that future technology may reduce costs, particularly under the innovation that may be motivated by the high carbon price. It is also possible that sectors such as international aviation and shipping (which are not included in the model) may take a larger portion of the abatement required to achieve the national 80% target, thus reducing the abatement burden (and costs) of the energy system modelled in UK MARKAL.
2.3.2 Sectoral Split of CO2 Reduction
It would not be sensible to expect all sectors to contribute to CO2 reduction proportionally with their 1990 or present-day emissions levels. This is because it may be easier or cheaper to decarbonise one sector instead of another, or it may be possible to address upstream resources rather than end-uses, or an array of other possibilities. Figure 3 shows the sectoral breakdown of emissions reduction
AEA in Confidence Ref: AEA/ED56609 16
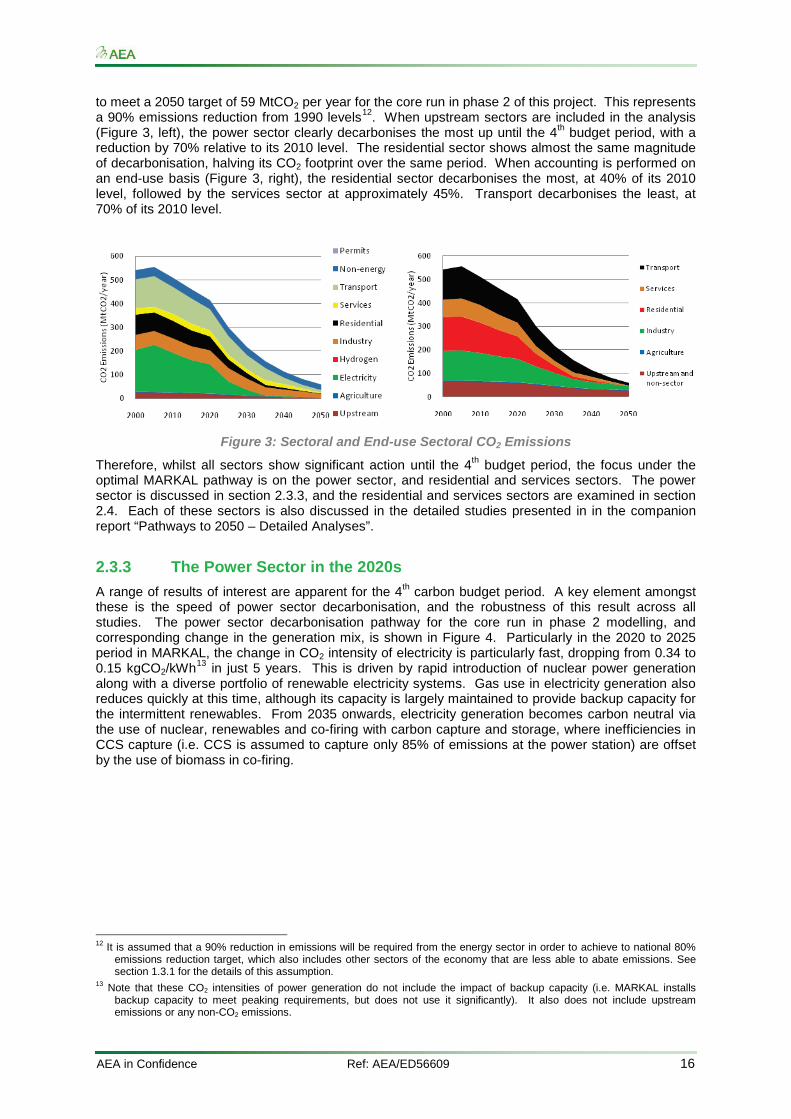
to meet a 2050 target of 59 MtCO2 per year for the core run in phase 2 of this project. This represents a 90% emissions reduction from 1990 levels12
Figure 3. When upstream sectors are included in the analysis
( , left), the power sector clearly decarbonises the most up until the 4th budget period, with a reduction by 70% relative to its 2010 level. The residential sector shows almost the same magnitude of decarbonisation, halving its CO2 footprint over the same period. When accounting is performed on an end-use basis (Figure 3, right), the residential sector decarbonises the most, at 40% of its 2010 level, followed by the services sector at approximately 45%. Transport decarbonises the least, at 70% of its 2010 level.
Figure 3: Sectoral and End-use Sectoral CO2 Emissions
Therefore, whilst all sectors show significant action until the 4th budget period, the focus under the optimal MARKAL pathway is on the power sector, and residential and services sectors. The power sector is discussed in section 2.3.3, and the residential and services sectors are examined in section 2.4. Each of these sectors is also discussed in the detailed studies presented in in the companion report “Pathways to 2050 – Detailed Analyses”.
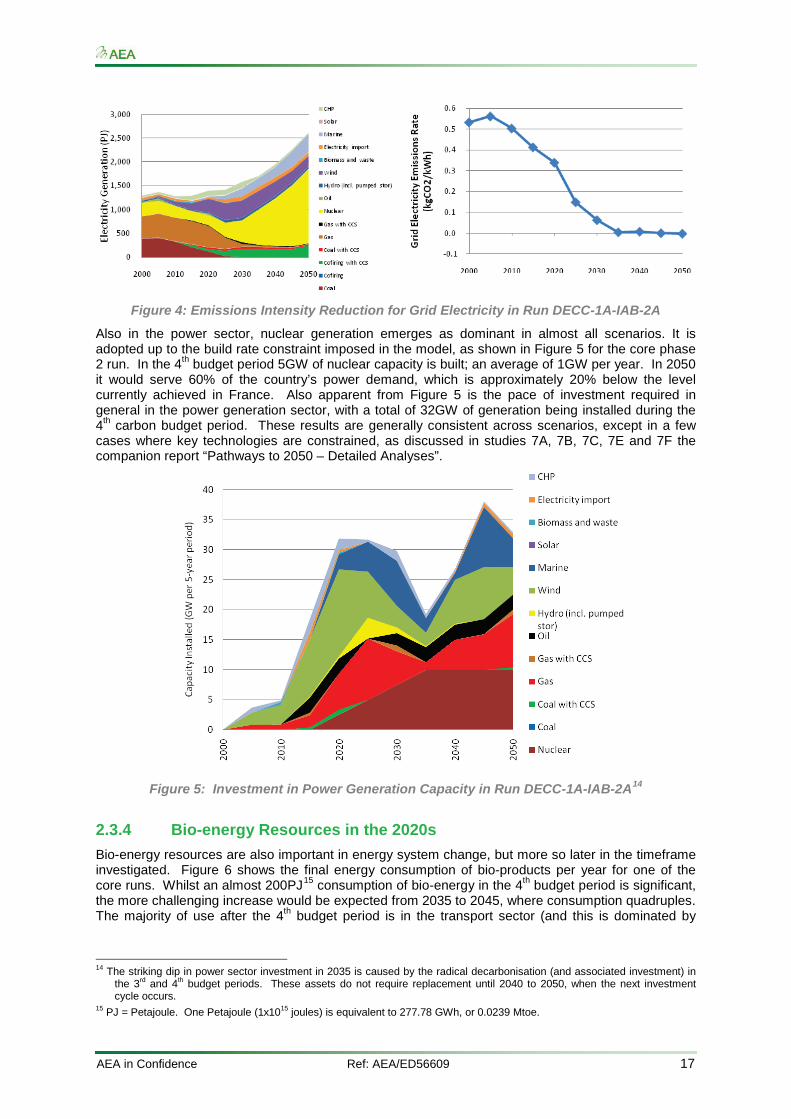
2.3.3 The Power Sector in the 2020s
A range of results of interest are apparent for the 4th carbon budget period. A key element amongst these is the speed of power sector decarbonisation, and the robustness of this result across all studies. The power sector decarbonisation pathway for the core run in phase 2 modelling, and corresponding change in the generation mix, is shown in Figure 4. Particularly in the 2020 to 2025 period in MARKAL, the change in CO2 intensity of electricity is particularly fast, dropping from 0.34 to 0.15 kgCO2/kWh13
12 It is assumed that a 90% reduction in emissions will be required from the energy sector in order to achieve to national 80%
emissions reduction target, which also includes other sectors of the economy that are less able to abate emissions. See section 1.3.1 for the details of this assumption.
13 Note that these CO2 intensities of power generation do not include the impact of backup capacity (i.e. MARKAL installs backup capacity to meet peaking requirements, but does not use it significantly). It also does not include upstream emissions or any non-CO2 emissions.
in just 5 years. This is driven by rapid introduction of nuclear power generation along with a diverse portfolio of renewable electricity systems. Gas use in electricity generation also reduces quickly at this time, although its capacity is largely maintained to provide backup capacity for the intermittent renewables. From 2035 onwards, electricity generation becomes carbon neutral via the use of nuclear, renewables and co-firing with carbon capture and storage, where inefficiencies in CCS capture (i.e. CCS is assumed to capture only 85% of emissions at the power station) are offset by the use of biomass in co-firing.
AEA in Confidence Ref: AEA/ED56609 17
Figure 4: Emissions Intensity Reduction for Grid Electricity in Run DECC-1A-IAB-2A
Also in the power sector, nuclear generation emerges as dominant in almost all scenarios. It is adopted up to the build rate constraint imposed in the model, as shown in Figure 5 for the core phase 2 run. In the 4th budget period 5GW of nuclear capacity is built; an average of 1GW per year. In 2050 it would serve 60% of the country’s power demand, which is approximately 20% below the level currently achieved in France. Also apparent from Figure 5 is the pace of investment required in general in the power generation sector, with a total of 32GW of generation being installed during the 4th carbon budget period. These results are generally consistent across scenarios, except in a few cases where key technologies are constrained, as discussed in studies 7A, 7B, 7C, 7E and 7F the companion report “Pathways to 2050 – Detailed Analyses”.
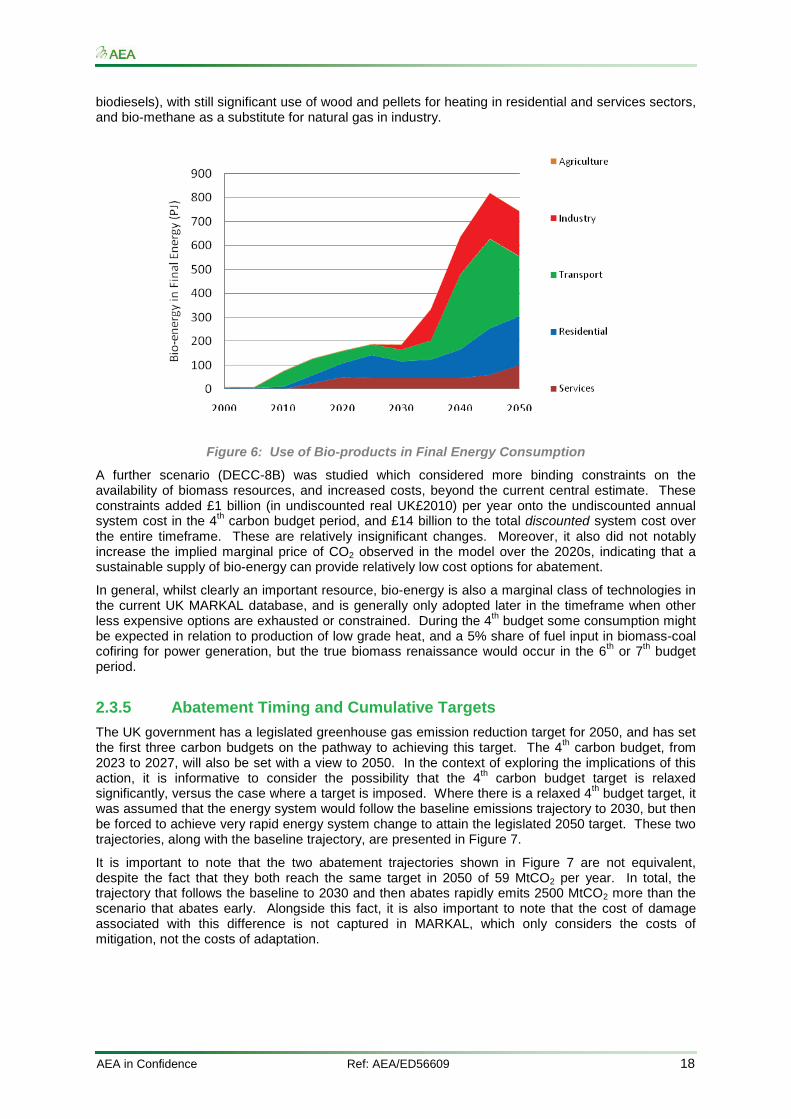
Figure 5: Investment in Power Generation Capacity in Run DECC-1A-IAB-2A14
2.3.4 Bio-energy Resources in the 2020s
Bio-energy resources are also important in energy system change, but more so later in the timeframe investigated. Figure 6 shows the final energy consumption of bio-products per year for one of the core runs. Whilst an almost 200PJ15
14 The striking dip in power sector investment in 2035 is caused by the radical decarbonisation (and associated investment) in
the 3rd and 4th budget periods. These assets do not require replacement until 2040 to 2050, when the next investment cycle occurs.
15 PJ = Petajoule. One Petajoule (1x10¹⁵ joules) is equivalent to 277.78 GWh, or 0.0239 Mtoe.
consumption of bio-energy in the 4th budget period is significant, the more challenging increase would be expected from 2035 to 2045, where consumption quadruples. The majority of use after the 4th budget period is in the transport sector (and this is dominated by
AEA in Confidence Ref: AEA/ED56609 18
biodiesels), with still significant use of wood and pellets for heating in residential and services sectors, and bio-methane as a substitute for natural gas in industry.
Figure 6: Use of Bio-products in Final Energy Consumption
A further scenario (DECC-8B) was studied which considered more binding constraints on the availability of biomass resources, and increased costs, beyond the current central estimate. These constraints added £1 billion (in undiscounted real UK£2010) per year onto the undiscounted annual system cost in the 4th carbon budget period, and £14 billion to the total discounted system cost over the entire timeframe. These are relatively insignificant changes. Moreover, it also did not notably increase the implied marginal price of CO2 observed in the model over the 2020s, indicating that a sustainable supply of bio-energy can provide relatively low cost options for abatement.
In general, whilst clearly an important resource, bio-energy is also a marginal class of technologies in the current UK MARKAL database, and is generally only adopted later in the timeframe when other less expensive options are exhausted or constrained. During the 4th budget some consumption might be expected in relation to production of low grade heat, and a 5% share of fuel input in biomass-coal cofiring for power generation, but the true biomass renaissance would occur in the 6th or 7th budget period.
2.3.5 Abatement Timing and Cumulative Targets
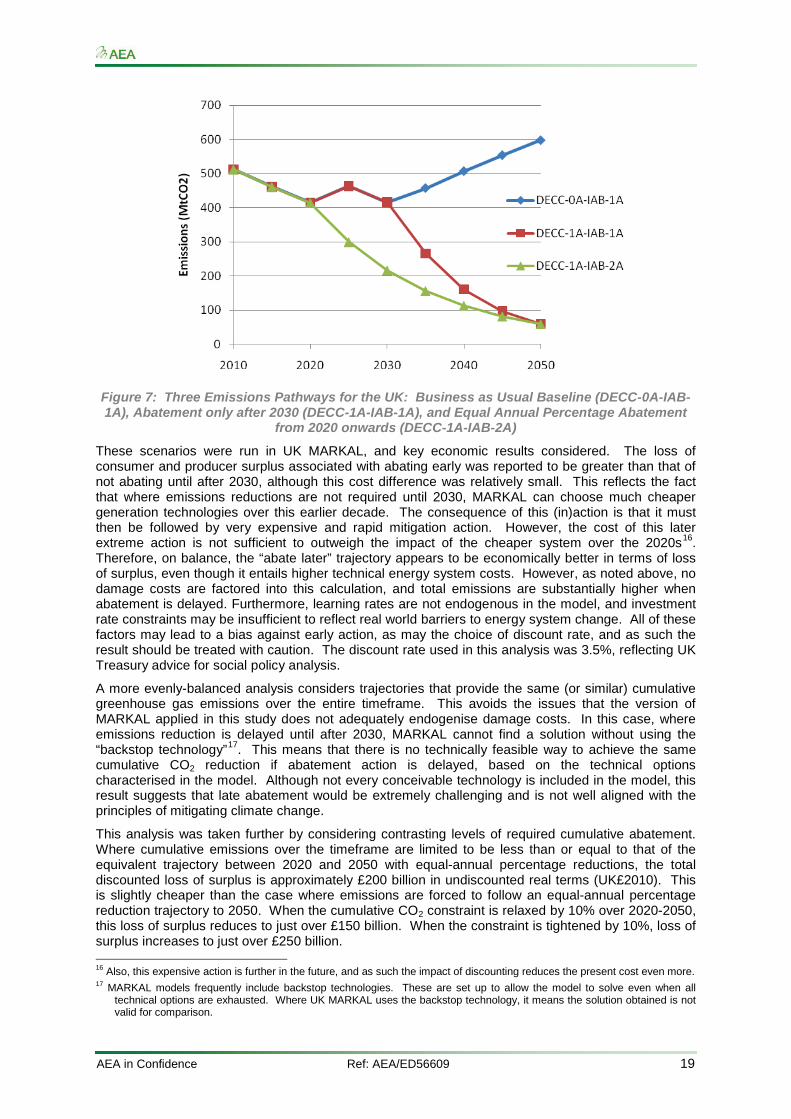
The UK government has a legislated greenhouse gas emission reduction target for 2050, and has set the first three carbon budgets on the pathway to achieving this target. The 4th carbon budget, from 2023 to 2027, will also be set with a view to 2050. In the context of exploring the implications of this action, it is informative to consider the possibility that the 4th carbon budget target is relaxed significantly, versus the case where a target is imposed. Where there is a relaxed 4th budget target, it was assumed that the energy system would follow the baseline emissions trajectory to 2030, but then be forced to achieve very rapid energy system change to attain the legislated 2050 target. These two trajectories, along with the baseline trajectory, are presented in Figure 7.
It is important to note that the two abatement trajectories shown in Figure 7 are not equivalent, despite the fact that they both reach the same target in 2050 of 59 MtCO2 per year. In total, the trajectory that follows the baseline to 2030 and then abates rapidly emits 2500 MtCO2 more than the scenario that abates early. Alongside this fact, it is also important to note that the cost of damage associated with this difference is not captured in MARKAL, which only considers the costs of mitigation, not the costs of adaptation.
AEA in Confidence Ref: AEA/ED56609 19
Figure 7: Three Emissions Pathways for the UK: Business as Usual Baseline (DECC-0A-IAB-1A), Abatement only after 2030 (DECC-1A-IAB-1A), and Equal Annual Percentage Abatement
from 2020 onwards (DECC-1A-IAB-2A)
These scenarios were run in UK MARKAL, and key economic results considered. The loss of consumer and producer surplus associated with abating early was reported to be greater than that of not abating until after 2030, although this cost difference was relatively small. This reflects the fact that where emissions reductions are not required until 2030, MARKAL can choose much cheaper generation technologies over this earlier decade. The consequence of this (in)action is that it must then be followed by very expensive and rapid mitigation action. However, the cost of this later extreme action is not sufficient to outweigh the impact of the cheaper system over the 2020s16
A more evenly-balanced analysis considers trajectories that provide the same (or similar) cumulative greenhouse gas emissions over the entire timeframe. This avoids the issues that the version of MARKAL applied in this study does not adequately endogenise damage costs. In this case, where emissions reduction is delayed until after 2030, MARKAL cannot find a solution without using the “backstop technology”
. Therefore, on balance, the “abate later” trajectory appears to be economically better in terms of loss of surplus, even though it entails higher technical energy system costs. However, as noted above, no damage costs are factored into this calculation, and total emissions are substantially higher when abatement is delayed. Furthermore, learning rates are not endogenous in the model, and investment rate constraints may be insufficient to reflect real world barriers to energy system change. All of these factors may lead to a bias against early action, as may the choice of discount rate, and as such the result should be treated with caution. The discount rate used in this analysis was 3.5%, reflecting UK Treasury advice for social policy analysis.
17
This analysis was taken further by considering contrasting levels of required cumulative abatement. Where cumulative emissions over the timeframe are limited to be less than or equal to that of the equivalent trajectory between 2020 and 2050 with equal-annual percentage reductions, the total discounted loss of surplus is approximately £200 billion in undiscounted real terms (UK£2010). This is slightly cheaper than the case where emissions are forced to follow an equal-annual percentage reduction trajectory to 2050. When the cumulative CO2 constraint is relaxed by 10% over 2020-2050, this loss of surplus reduces to just over £150 billion. When the constraint is tightened by 10%, loss of surplus increases to just over £250 billion.
. This means that there is no technically feasible way to achieve the same cumulative CO2 reduction if abatement action is delayed, based on the technical options characterised in the model. Although not every conceivable technology is included in the model, this result suggests that late abatement would be extremely challenging and is not well aligned with the principles of mitigating climate change.
16 Also, this expensive action is further in the future, and as such the impact of discounting reduces the present cost even more. 17 MARKAL models frequently include backstop technologies. These are set up to allow the model to solve even when all
technical options are exhausted. Where UK MARKAL uses the backstop technology, it means the solution obtained is not valid for comparison.
AEA in Confidence Ref: AEA/ED56609 20
2.4 The Residential and Services Sectors
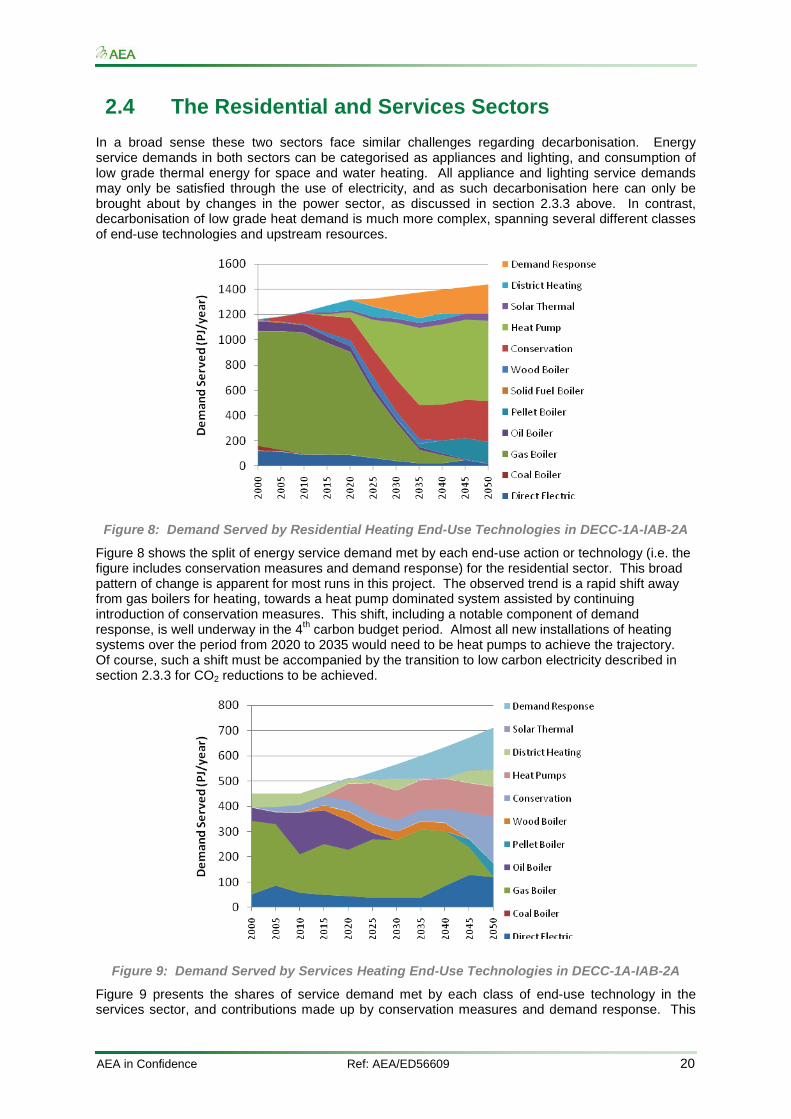
In a broad sense these two sectors face similar challenges regarding decarbonisation. Energy service demands in both sectors can be categorised as appliances and lighting, and consumption of low grade thermal energy for space and water heating. All appliance and lighting service demands may only be satisfied through the use of electricity, and as such decarbonisation here can only be brought about by changes in the power sector, as discussed in section 2.3.3 above. In contrast, decarbonisation of low grade heat demand is much more complex, spanning several different classes of end-use technologies and upstream resources.
Figure 8: Demand Served by Residential Heating End-Use Technologies in DECC-1A-IAB-2A
Figure 8 shows the split of energy service demand met by each end-use action or technology (i.e. the figure includes conservation measures and demand response) for the residential sector. This broad pattern of change is apparent for most runs in this project. The observed trend is a rapid shift away from gas boilers for heating, towards a heat pump dominated system assisted by continuing introduction of conservation measures. This shift, including a notable component of demand response, is well underway in the 4th carbon budget period. Almost all new installations of heating systems over the period from 2020 to 2035 would need to be heat pumps to achieve the trajectory. Of course, such a shift must be accompanied by the transition to low carbon electricity described in section 2.3.3 for CO2 reductions to be achieved.
Figure 9: Demand Served by Services Heating End-Use Technologies in DECC-1A-IAB-2A
Figure 9 presents the shares of service demand met by each class of end-use technology in the services sector, and contributions made up by conservation measures and demand response. This
AEA in Confidence Ref: AEA/ED56609 21
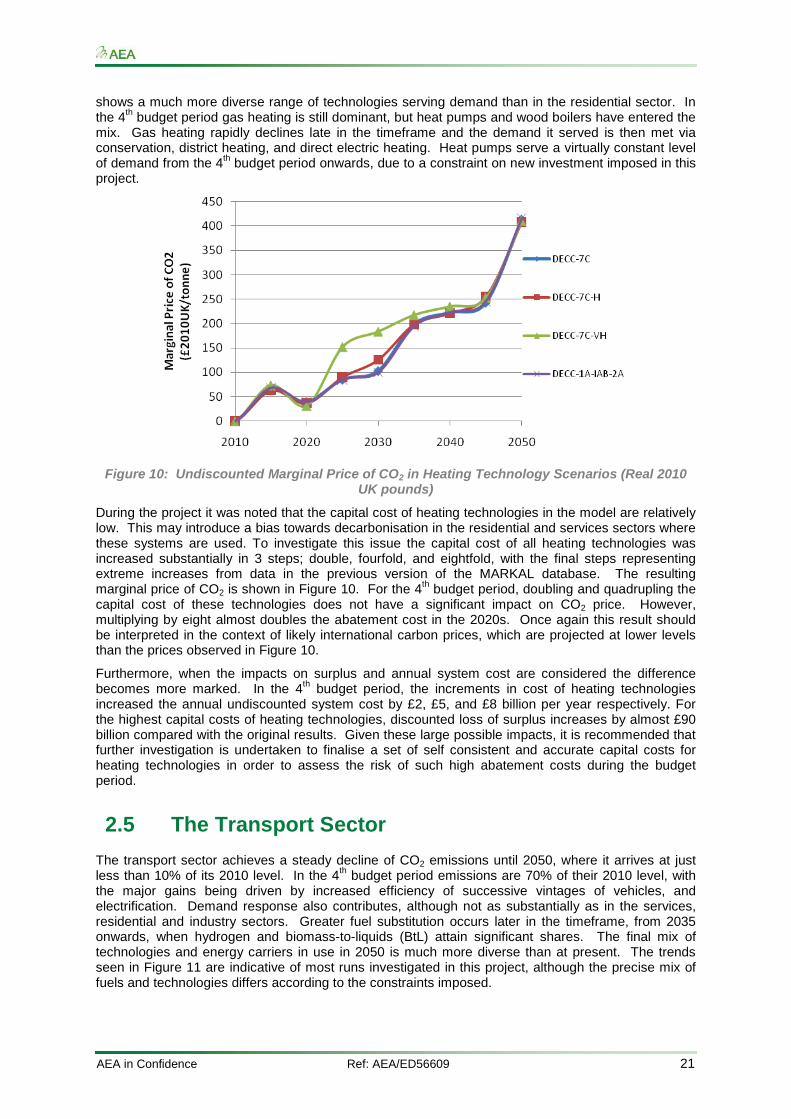
shows a much more diverse range of technologies serving demand than in the residential sector. In the 4th budget period gas heating is still dominant, but heat pumps and wood boilers have entered the mix. Gas heating rapidly declines late in the timeframe and the demand it served is then met via conservation, district heating, and direct electric heating. Heat pumps serve a virtually constant level of demand from the 4th budget period onwards, due to a constraint on new investment imposed in this project.
Figure 10: Undiscounted Marginal Price of CO2 in Heating Technology Scenarios (Real 2010 UK pounds)
During the project it was noted that the capital cost of heating technologies in the model are relatively low. This may introduce a bias towards decarbonisation in the residential and services sectors where these systems are used. To investigate this issue the capital cost of all heating technologies was increased substantially in 3 steps; double, fourfold, and eightfold, with the final steps representing extreme increases from data in the previous version of the MARKAL database. The resulting marginal price of CO2 is shown in Figure 10. For the 4th budget period, doubling and quadrupling the capital cost of these technologies does not have a significant impact on CO2 price. However, multiplying by eight almost doubles the abatement cost in the 2020s. Once again this result should be interpreted in the context of likely international carbon prices, which are projected at lower levels than the prices observed in Figure 10.
Furthermore, when the impacts on surplus and annual system cost are considered the difference becomes more marked. In the 4th budget period, the increments in cost of heating technologies increased the annual undiscounted system cost by £2, £5, and £8 billion per year respectively. For the highest capital costs of heating technologies, discounted loss of surplus increases by almost £90 billion compared with the original results. Given these large possible impacts, it is recommended that further investigation is undertaken to finalise a set of self consistent and accurate capital costs for heating technologies in order to assess the risk of such high abatement costs during the budget period.
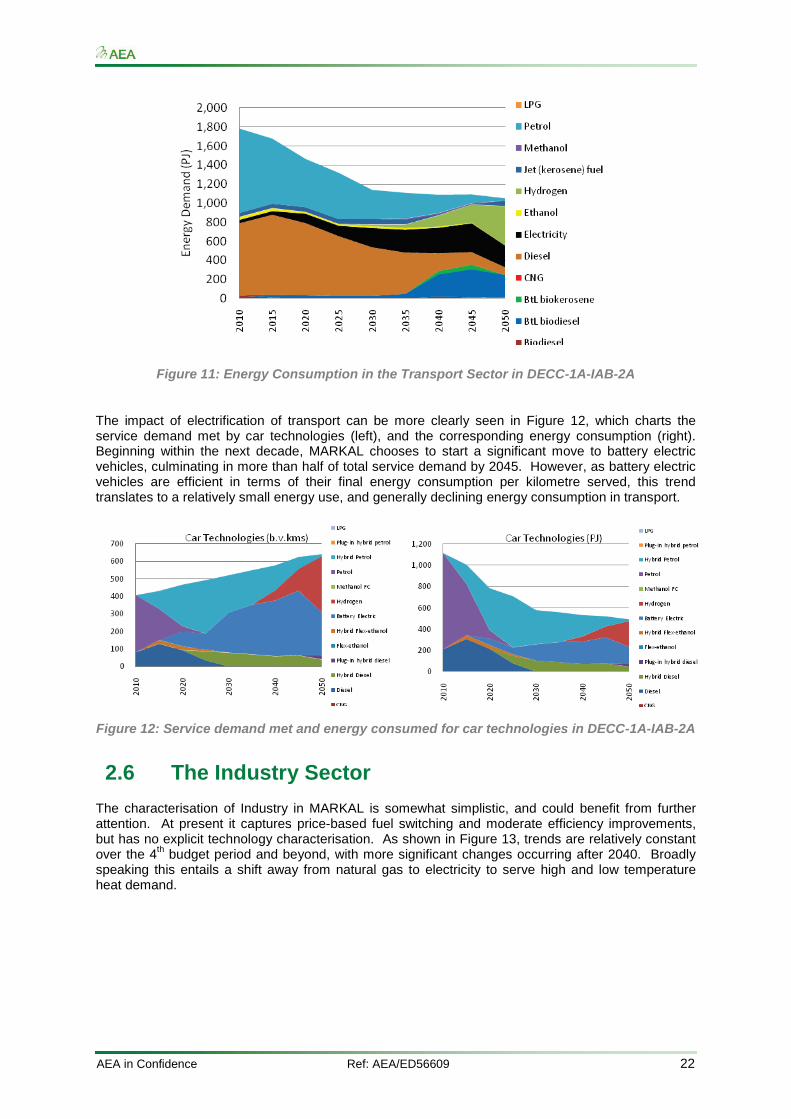
2.5 The Transport Sector
The transport sector achieves a steady decline of CO2 emissions until 2050, where it arrives at just less than 10% of its 2010 level. In the 4th budget period emissions are 70% of their 2010 level, with the major gains being driven by increased efficiency of successive vintages of vehicles, and electrification. Demand response also contributes, although not as substantially as in the services, residential and industry sectors. Greater fuel substitution occurs later in the timeframe, from 2035 onwards, when hydrogen and biomass-to-liquids (BtL) attain significant shares. The final mix of technologies and energy carriers in use in 2050 is much more diverse than at present. The trends seen in Figure 11 are indicative of most runs investigated in this project, although the precise mix of fuels and technologies differs according to the constraints imposed.
AEA in Confidence Ref: AEA/ED56609 22
Figure 11: Energy Consumption in the Transport Sector in DECC-1A-IAB-2A
The impact of electrification of transport can be more clearly seen in Figure 12, which charts the service demand met by car technologies (left), and the corresponding energy consumption (right). Beginning within the next decade, MARKAL chooses to start a significant move to battery electric vehicles, culminating in more than half of total service demand by 2045. However, as battery electric vehicles are efficient in terms of their final energy consumption per kilometre served, this trend translates to a relatively small energy use, and generally declining energy consumption in transport.
Figure 12: Service demand met and energy consumed for car technologies in DECC-1A-IAB-2A
2.6 The Industry Sector
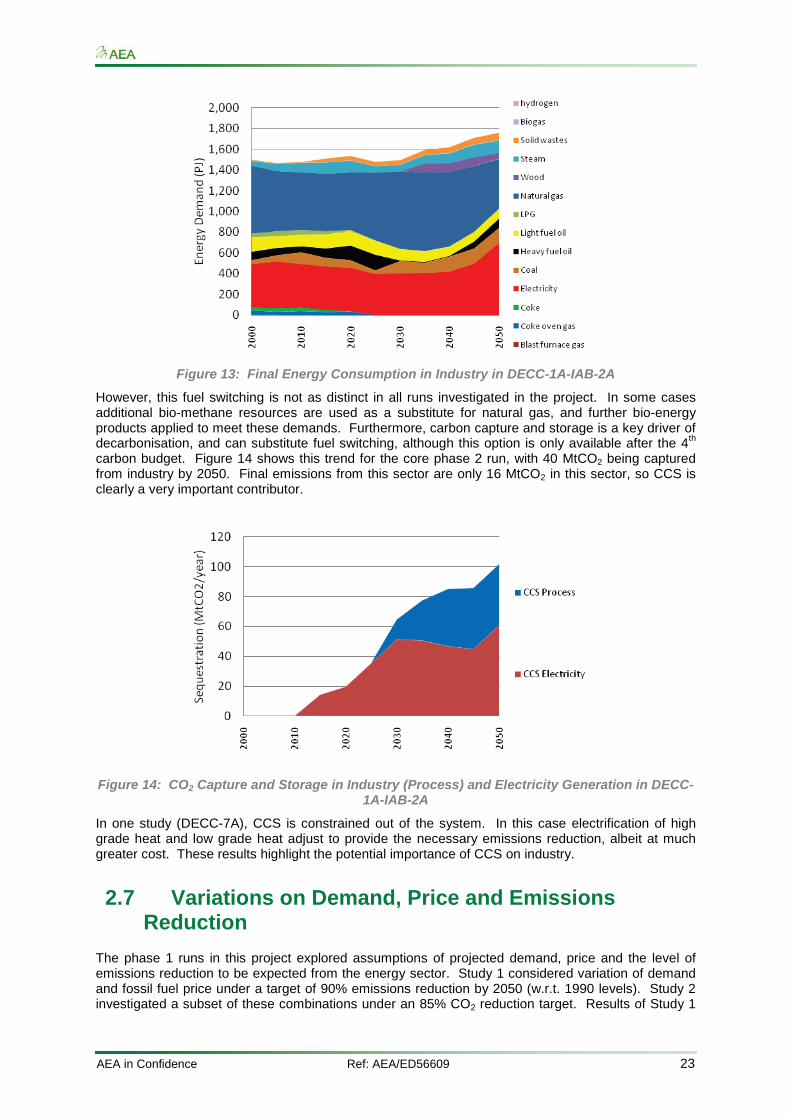
The characterisation of Industry in MARKAL is somewhat simplistic, and could benefit from further attention. At present it captures price-based fuel switching and moderate efficiency improvements, but has no explicit technology characterisation. As shown in Figure 13, trends are relatively constant over the 4th budget period and beyond, with more significant changes occurring after 2040. Broadly speaking this entails a shift away from natural gas to electricity to serve high and low temperature heat demand.
AEA in Confidence Ref: AEA/ED56609 23
Figure 13: Final Energy Consumption in Industry in DECC-1A-IAB-2A
However, this fuel switching is not as distinct in all runs investigated in the project. In some cases additional bio-methane resources are used as a substitute for natural gas, and further bio-energy products applied to meet these demands. Furthermore, carbon capture and storage is a key driver of decarbonisation, and can substitute fuel switching, although this option is only available after the 4th carbon budget. Figure 14 shows this trend for the core phase 2 run, with 40 MtCO2 being captured from industry by 2050. Final emissions from this sector are only 16 MtCO2 in this sector, so CCS is clearly a very important contributor.
Figure 14: CO2 Capture and Storage in Industry (Process) and Electricity Generation in DECC-1A-IAB-2A
In one study (DECC-7A), CCS is constrained out of the system. In this case electrification of high grade heat and low grade heat adjust to provide the necessary emissions reduction, albeit at much greater cost. These results highlight the potential importance of CCS on industry.
2.7 Variations on Demand, Price and Emissions Reduction
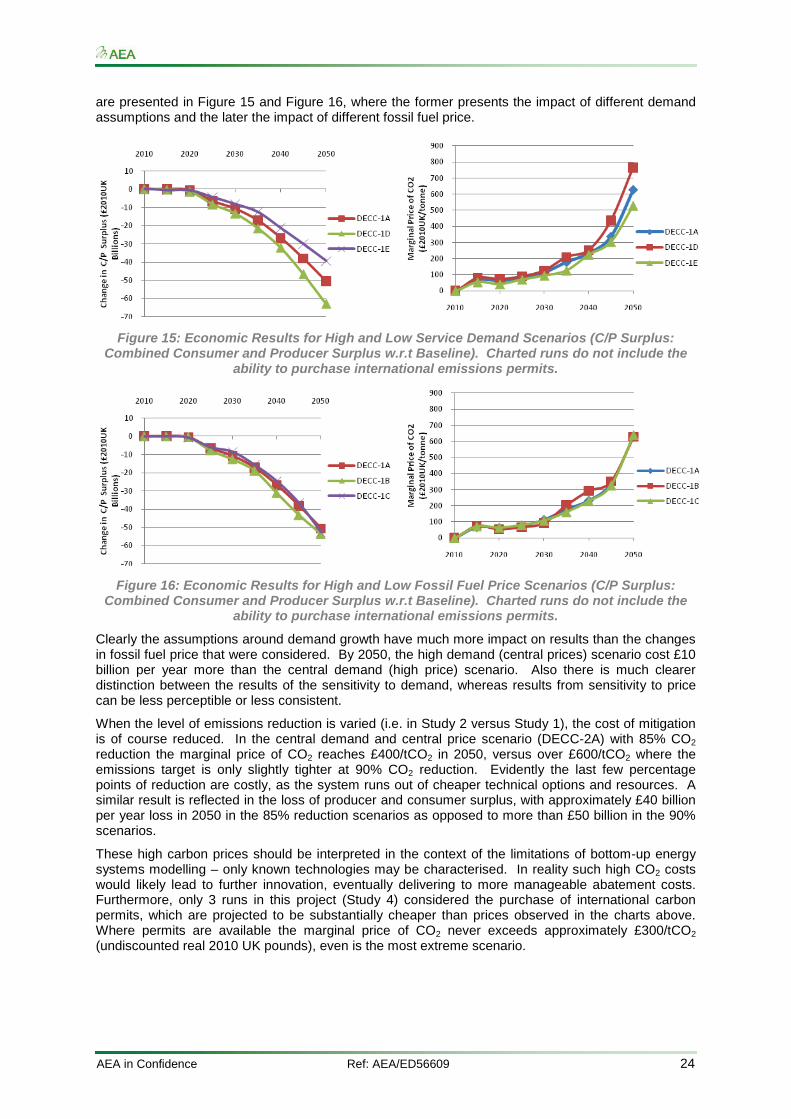
The phase 1 runs in this project explored assumptions of projected demand, price and the level of emissions reduction to be expected from the energy sector. Study 1 considered variation of demand and fossil fuel price under a target of 90% emissions reduction by 2050 (w.r.t. 1990 levels). Study 2 investigated a subset of these combinations under an 85% CO2 reduction target. Results of Study 1
AEA in Confidence Ref: AEA/ED56609 24
are presented in Figure 15 and Figure 16, where the former presents the impact of different demand assumptions and the later the impact of different fossil fuel price.
Figure 15: Economic Results for High and Low Service Demand Scenarios (C/P Surplus: Combined Consumer and Producer Surplus w.r.t Baseline). Charted runs do not include the
ability to purchase international emissions permits.
Figure 16: Economic Results for High and Low Fossil Fuel Price Scenarios (C/P Surplus: Combined Consumer and Producer Surplus w.r.t Baseline). Charted runs do not include the
ability to purchase international emissions permits.
Clearly the assumptions around demand growth have much more impact on results than the changes in fossil fuel price that were considered. By 2050, the high demand (central prices) scenario cost £10 billion per year more than the central demand (high price) scenario. Also there is much clearer distinction between the results of the sensitivity to demand, whereas results from sensitivity to price can be less perceptible or less consistent.
When the level of emissions reduction is varied (i.e. in Study 2 versus Study 1), the cost of mitigation is of course reduced. In the central demand and central price scenario (DECC-2A) with 85% CO2 reduction the marginal price of CO2 reaches £400/tCO2 in 2050, versus over £600/tCO2 where the emissions target is only slightly tighter at 90% CO2 reduction. Evidently the last few percentage points of reduction are costly, as the system runs out of cheaper technical options and resources. A similar result is reflected in the loss of producer and consumer surplus, with approximately £40 billion per year loss in 2050 in the 85% reduction scenarios as opposed to more than £50 billion in the 90% scenarios.
These high carbon prices should be interpreted in the context of the limitations of bottom-up energy systems modelling – only known technologies may be characterised. In reality such high CO2 costs would likely lead to further innovation, eventually delivering to more manageable abatement costs. Furthermore, only 3 runs in this project (Study 4) considered the purchase of international carbon permits, which are projected to be substantially cheaper than prices observed in the charts above. Where permits are available the marginal price of CO2 never exceeds approximately £300/tCO2 (undiscounted real 2010 UK pounds), even is the most extreme scenario.
AEA in Confidence Ref: AEA/ED56609 25
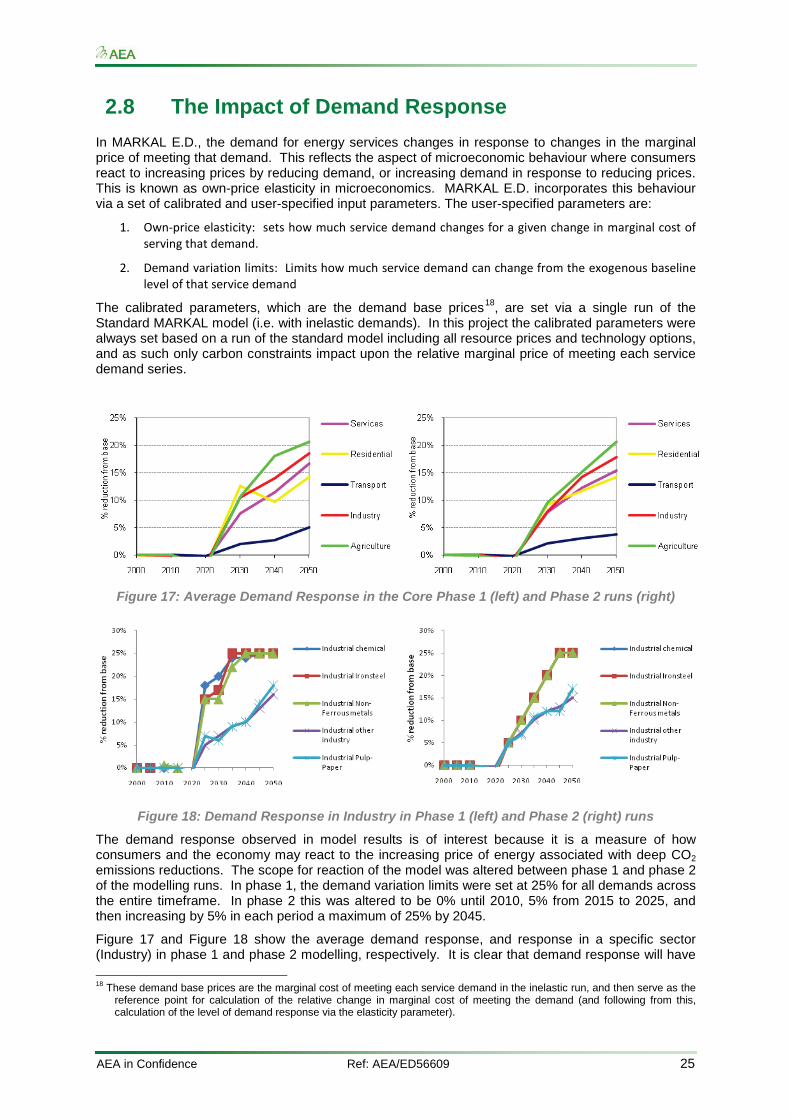
2.8 The Impact of Demand Response
In MARKAL E.D., the demand for energy services changes in response to changes in the marginal price of meeting that demand. This reflects the aspect of microeconomic behaviour where consumers react to increasing prices by reducing demand, or increasing demand in response to reducing prices. This is known as own-price elasticity in microeconomics. MARKAL E.D. incorporates this behaviour via a set of calibrated and user-specified input parameters. The user-specified parameters are:
1. Own-price elasticity: sets how much service demand changes for a given change in marginal cost of serving that demand.
2. Demand variation limits: Limits how much service demand can change from the exogenous baseline level of that service demand
The calibrated parameters, which are the demand base prices18, are set via a single run of the Standard MARKAL model (i.e. with inelastic demands). In this project the calibrated parameters were always set based on a run of the standard model including all resource prices and technology options, and as such only carbon constraints impact upon the relative marginal price of meeting each service demand series.
Figure 17: Average Demand Response in the Core Phase 1 (left) and Phase 2 runs (right)
Figure 18: Demand Response in Industry in Phase 1 (left) and Phase 2 (right) runs
The demand response observed in model results is of interest because it is a measure of how consumers and the economy may react to the increasing price of energy associated with deep CO2 emissions reductions. The scope for reaction of the model was altered between phase 1 and phase 2 of the modelling runs. In phase 1, the demand variation limits were set at 25% for all demands across the entire timeframe. In phase 2 this was altered to be 0% until 2010, 5% from 2015 to 2025, and then increasing by 5% in each period a maximum of 25% by 2045.
Figure 17 and Figure 18 show the average demand response, and response in a specific sector (Industry) in phase 1 and phase 2 modelling, respectively. It is clear that demand response will have
18 These demand base prices are the marginal cost of meeting each service demand in the inelastic run, and then serve as the
reference point for calculation of the relative change in marginal cost of meeting the demand (and following from this, calculation of the level of demand response via the elasticity parameter).
AEA in Confidence Ref: AEA/ED56609 26
a significant impact in the energy system as prices rise to fund decarbonisation. For example, both the services and residential sectors experience a 15% demand reduction.
The steeper demand response in phase 1 modelling is observable, particularly in the 4th carbon budget period in Chemicals, Iron and Steel and Non-Ferrous metals which all showed greater than 15% service demand reduction in a single period in phase 1 runs. As this level of demand reduction is unlikely to be acceptable, response was limited to 1% per year in phase 2 runs.
The impact of this change in the extent of response possible is clear in the results. Undiscounted loss of surplus due to demand response is much higher in phase 1 runs. For the core runs, DECC-1A (phase 1) annual loss of surplus due to demand reduction was almost £40 billion, whilst the equivalent phase 2 run was only £26 billion, in undiscounted real 2010 UK pounds. These figures only reflect welfare changes with respect to change in demand for energy services; where a consumer demands less energy due to higher prices there is a negative welfare impact.
The importance of demand response has also been made clear in run DECC-5A, which removed this possibility entirely (i.e. the demand variation limits were set to zero). Where this option was not available, the range of technologies explicitly characterised in MARKAL was not sufficient to provide the required abatement, and the backstop technology (see footnote 17) was adopted. Whilst this does not necessarily mean that there are no technical options to achieve the required CO2 reduction, it does indicate that the prospect is likely to be very challenging. As such, it should be recognised that demand response (or proxies for demand response beyond what is currently characterised in the model) are an important part of energy system change in coming decades. Examples of proxies for demand response are behavioural and lifestyle changes, as described in Ekins et al (2010).
AEA in Confidence Ref: AEA/ED56609 27
3 Acronyms and Abbreviations BEV: Battery Electric Vehicle
CO2: Carbon Dioxide
CCC: Committee on Climate Change
CCGT: Combined Cycle Gas Turbine
CCS: Carbon Capture and Storage
CNG: Compressed Natural Gas
DECC: Department of Energy and Climate Change
DfT: Department for Transport
HGV: Heavy Good Vehicle
LGV: Light Goods Vehicle
MARKAL: MARKet ALlocation model
O&M: Operation and Maintenance
PHEV: Plug-in Hybrid Electric Vehicle
PWR: Pressurised Water Reactor
RES: Reference Energy System
T&D: Transmission and Distribution
AEA in Confidence Ref: AEA/ED56609 28
4 References AEA Technology (2010), UK & Global Bio-energy Resource. Report for the Department of Energy and Climate Change. Forthcoming.
Element Energy, Carbon Counts, AMEC (2010), Potential for the application of CCS to UK industry and natural gas power generation. Report for the Committee on Climate Change. Available from: http://www.ccsassociation.org.uk/docs/2010/Element%20Energy%20report%20on%20CCS%20in%20gas%20and%20industry%20June%202010.pdf
HM Government (2008), Climate Change Act 2008, 2008 Chapter 27. Available from: http://www.legislation.gov.uk/ukpga/2008/27
HM Government (2011), Carbon Plan. Available from: http://www.decc.gov.uk/en/content/cms/what_we_do/lc_uk/carbon_plan/carbon_plan.aspx
Kannan, R., Strachan, N., Pye, S. & Balta-ozkan, N. (2007), UK MARKAL Model Documentation, London. Available from: http://www.ukerc.ac.uk/support/tiki-index.php?page=ES_MARKAL_Documentation_2010.
Loulou, Goldstein and Noble (2004), Documentaion of the MARKAL Family of Models, Energy Technology Systems Analysis Programme. Available from: http://www.etsap.org/tools.htm
Mott MacDonald (2010), UK Electricity Generation Costs Update. Report for the Department of Energy and Climate Change. June 2010. Available from: http://www.decc.gov.uk/assets/decc/statistics/projections/71-uk-electricity-generation-costs-update-.pdf
Skea J, Ekins P, Winskel M (Editors) (2010) Energy 2050: Making the Transition to a Secure Low Carbon Energy System. Earthscan, UK.
Usher, W. & Strachan N. (2010), UK MARKAL Modelling - Examining Decarbonisation Pathways in the 2020s on the Way to Meeting the 2050 Emissions Target. Available from: http://downloads.theccc.org.uk.s3.amazonaws.com/4th%20Budget/CCC%20MARKAL%20Final%20Report%20-%20UCL%20Nov10.pdf
AEA in Confidence Ref: AEA/ED56609 29
AEA Group The Gemini Building Fermi Avenue Harwell Didcot Oxfordshire OX11 0QR Tel: 0870 190 1900 Fax: 0870 190 6318 www.aeat.co.uk