Embed Size (px)
Citation preview

Pathway to progress: Girls making the grade in rural Sindh
Theresa Castillo, MA CHES * Teachers College, Columbia University

Sindh Profile
Second largest province
(~42 million, 23.7% primary school age)
Economic growth (2004-2009; GDP 18%)
Impact of floods (2010-2012)
Urban/Rural disparitiesLow performance
scores on learning outcomes

Gender Parity Index (GPI)
One gender indicator
Measures enrollment, not attendance or learning gaps
Rural/Urban Divide = Slow progress
Urban primary
Rural primary
Primary (Total)
Rural secondary
Urban secondary
Secondary (Total)
00.2
0.40.6
0.81
2010-2011
2008-2009
2006-2007
Gender Parity Index for Sindh Province, primary vs. secondary schools (2007-2011)
Source: UNESCO Islamabad. (2011). Policy analysis of education in Sindh.

Research Questions
& Expected Results
Is there a relationship
between girls’ enrollment and the
type of school?
Are girls learning differently,
depending up on the type of school?
Is there a relationship
between boys/girls/mixed
schools and learning
environment?
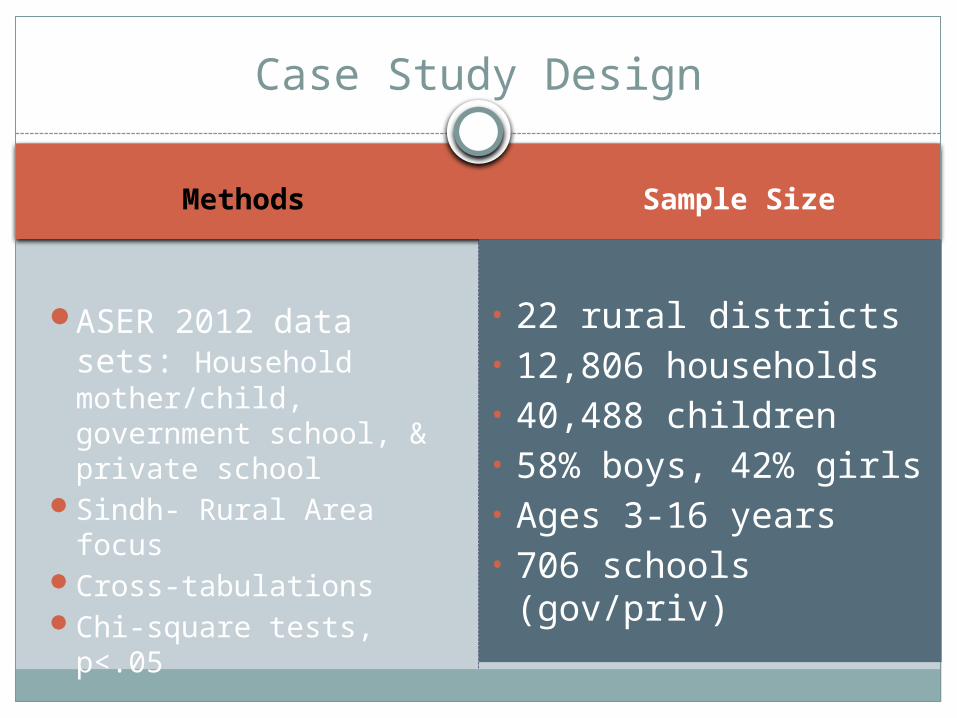
Sample SizeMethods
• 22 rural districts• 12,806 households• 40,488 children• 58% boys, 42% girls • Ages 3-16 years• 706 schools
(gov/priv)
ASER 2012 data sets: Household mother/child, government school, & private school
Sindh- Rural Area focus
Cross-tabulationsChi-square tests,
p<.05
Case Study Design

Education at a glance: Where are the girls?
School Enrollment
Out of School
Types of Schools

Comparison of School Enrollment,
by Gender, Ages 6-16
Education at a glance: Where are the girls?
Rural 2010 Rural 2012 Karachi 20120%
10%
20%
30%
40%
50%
60%
23% 24%
41%
45% 44%
53%
girls
boys
Nearly 2x’s more rural boys vs girls enrolled
Rural boys and Urban girls have similar %
Urban girls enrolled at twice the rate of rural girls
Little change from 2010 to 2012

Education at a glance: Where are the girls?
GovernmentPrivate
Madrassa NFE /other
0%
20%
40%
60%
80%
100%
139851446
5940
7885 757
9260
girls boys
(n=24,324)
% Rural Enrollment 2012, by Type of School & Gender
The greatest share of girls enrollment is in Madrassa and Non-formal education(NFE)/Other

Education at a glance: Where are the girls?
Boys Girls Total
Dropouts* 4.2% 3.5% 7.7%
Never Enrolled*
11.6%
13.1% 24.7%
Total- Rural 15.8%
16.6% 32.4%
Total-Karachi
4.5% 1.9% 6.4%• Statistically significant,
p<.001
% Out of School, ages 6-16(dropouts/leftouts)
• Increase since 2011: 29.5% out of school
• 37.8% of boys and girls dropout in grade 5
• Of those never enrolled, 48% boys, 52% girls

Education at a glance: Where are the girls?
7885
75759 40
(n=8741)Government* Private*
Madrassa* Other*
*Statistically significant, p<.001
Rural Girls’ Enrollment, by School Type
More girls enrolled in gov schools (90%) compared to all other schooling.
Smaller percentages : Private 8.7%, Madrassa 0.7%,Other 0.6%
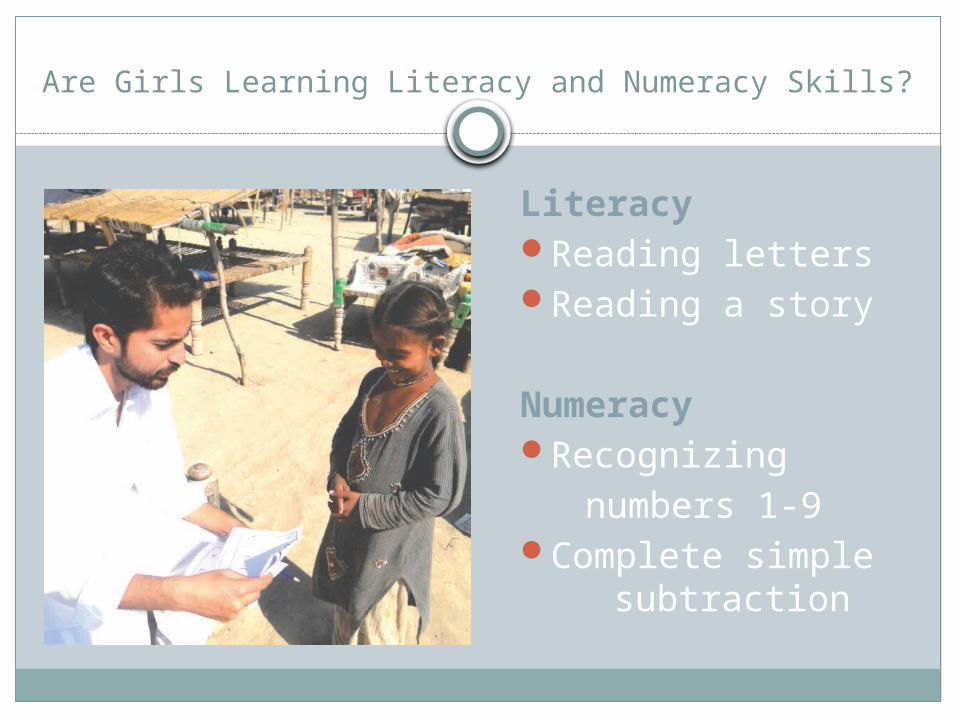
Are Girls Learning Literacy and Numeracy Skills?
LiteracyReading lettersReading a story
NumeracyRecognizing numbers 1-9Complete simple
subtraction

% Learning Outcomes, by Gender and Type of School
Gove
rnm
ent
Pri
vate
Madra
ssa
Oth
er
Gove
rnm
ent
Pri
vate
Madra
ssa
Oth
er
Girls
Boys
0%
20%
40%
60%
80%
100%
Math Di-vision
Math 1-9
Reading Story
Reading Letters
Results:
Government and private schools were statistically significant across all outcomes (p=.000)
Reading letters was statistically significant (p<.05) for girls in Madrassas and girls and boys in Other
Math 1-9 was statistically significant (p<.001) for both in Other

Reading Letters Reading Story Math 1-9 Math Division
0.00%
20.00%
40.00%
60.00%
80.00%
GovernmentPrivateMadrassaOther
% Learning Outcomes for Girls, by Type of School

Does Learning Environment Matter?
Environment Variables Drinking WaterBoundary Wall Usable Toilets
-Menstrual Hygiene Management
Mother’s EducationFemale Teachers
Government & Private Schools Surveyed, by category (2012)
Mixed Schools
Boys' Schools
Girls' Schools
(n=706)
5.1%
25.1%
69.8%

Government Private
% Availability of Resources by School Category
Water Boundary Wall*
Toilets*0%
20%
40%
60%
80%
100%
57%62%
48%
65%73%
56%60%
90%
73%
Mixed Schools
Boys' Schools
Girls' Schools
Water Boundary Wall Toilets10%
20%
30%
40%
50%
60%
70%
80%
90%
100%87%
81% 81%75% 75% 75%
(n=85)
(n=621); * Statistically significant, p< 0.05

Mother’s Education
% School Enrollment, by
Mother Education, by Gender
( n=24,324); * Statistically significant , p< .001
Mother, school Mother, no school0.00%
20.00%
40.00%
60.00%
80.00%78.20%
63.90%
70.30%
47.60% Enrolled Boys *
Enrolled Girls*
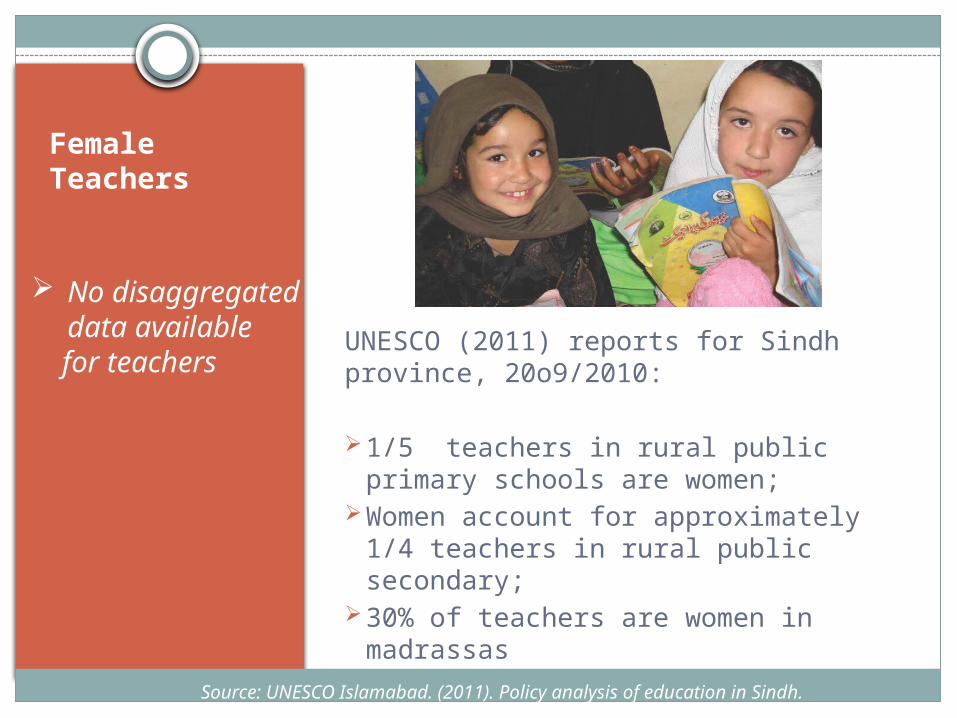
Female Teachers
UNESCO (2011) reports for Sindh province, 20o9/2010:
1/5 teachers in rural public primary schools are women;
Women account for approximately 1/4 teachers in rural public secondary;
30% of teachers are women in madrassas
No disaggregated data available
for teachers
Source: UNESCO Islamabad. (2011). Policy analysis of education in Sindh.

Study Limitations
Urban sample was too small for comparison (Karachi only)
Aggregate data ( i.e. teachers gender, mixed
schools)
Limited information on Madrassas
Inability to link the household data to school data
Recommendations
Qualitative research to explore differences in schools in relation to girls’ enrollment (such as defining barriers, attitudinal changes, etc.)
Conduct more research to better understand the role of Madrassas in girls’ education.
Conduct more exploratory research on the relationship between school type and learning outcomes.
Advocate for more resources in mixed government schools for toilets. boundary walls and drinking water to achieve optimal , given 90% of enrolled girls attend these schools.
Disaggregate data ( i.e. urban/rural, gender, school category) needed in order to understand disparities
Incorporate gender-responsive indicators and maps into future assessments (i.e. mixed schools, teacher gender)

Acknowledgements
ASER Pakistan
Sahar Saheed
Huma Zia
Photo credits: ASER Pakistan & UNICEF
www.aserpakistan.org
We will continue our journey to our destination of peace and education for everyone.
~ Malala Yousafzai