Embed Size (px)
Citation preview

Patents and Cumulative Innovation: Causal Evidence from the Courts
Alberto Galasso Mark Schankerman University of Toronto/NBER London School of Economics/CEPR
OECD Conference (Tokyo) November 2014

Motivation
Innovation is the engine of growth. Much of this is driven by R&D. Extensive evidence of underinvestment in R&D (Bloom, Schankerman & van Reenen, 2013). Implies some form of R&D support is warranted.
Patents are a key policy tool to promote innovation. Classic trade-off between static product market distortions (price > marginal cost) and dynamic innovation incentives is well-understood
But dominant feature of modern innovation is cumulative research (e.g., bio-medical, ICT, software). Modern macro models of (endogenous) growth turn on cumulative innovation.
KEY RESEARCH AND PUBLIC POLICY QUESTION:
How do patents on existing technology affect cumulative innovation? Is this a problem, and if so, in which technology fields and for what types of innovators?

Literature
Wide diversity of theories: patents can have positive, negative or no
effect on later innovation (Kitch, 1977; Green & Scotchmer, 1995; Heller & Eisenberg, 1998). Assumption on information and bargaining frictions are crucial.
Causal evidence shows negative impact in biomedicine: Williams (2013): Celera gene IP ↘ publications & products based on
human genome by 30% Murray et al (2008): more lenient restrictions on Oncomouse patent
license ↗ citations by 20% Murray and Stern (2007): 20% decline in citations after a patent
granted for patent-paper pairs BUT: In most technology areas the relationship between patents and later innovation remains unexplored. And the industrial organization of blockage is unknown (who blocks whom?)
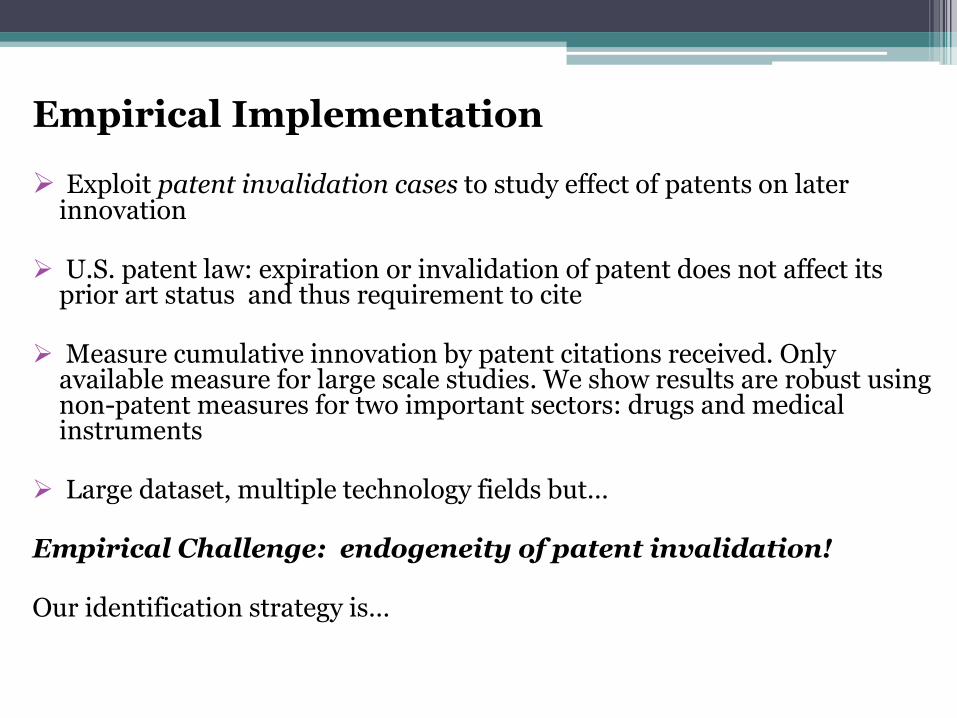
Empirical Implementation Exploit patent invalidation cases to study effect of patents on later
innovation U.S. patent law: expiration or invalidation of patent does not affect its
prior art status and thus requirement to cite
Measure cumulative innovation by patent citations received. Only available measure for large scale studies. We show results are robust using non-patent measures for two important sectors: drugs and medical instruments
Large dataset, multiple technology fields but… Empirical Challenge: endogeneity of patent invalidation! Our identification strategy is…

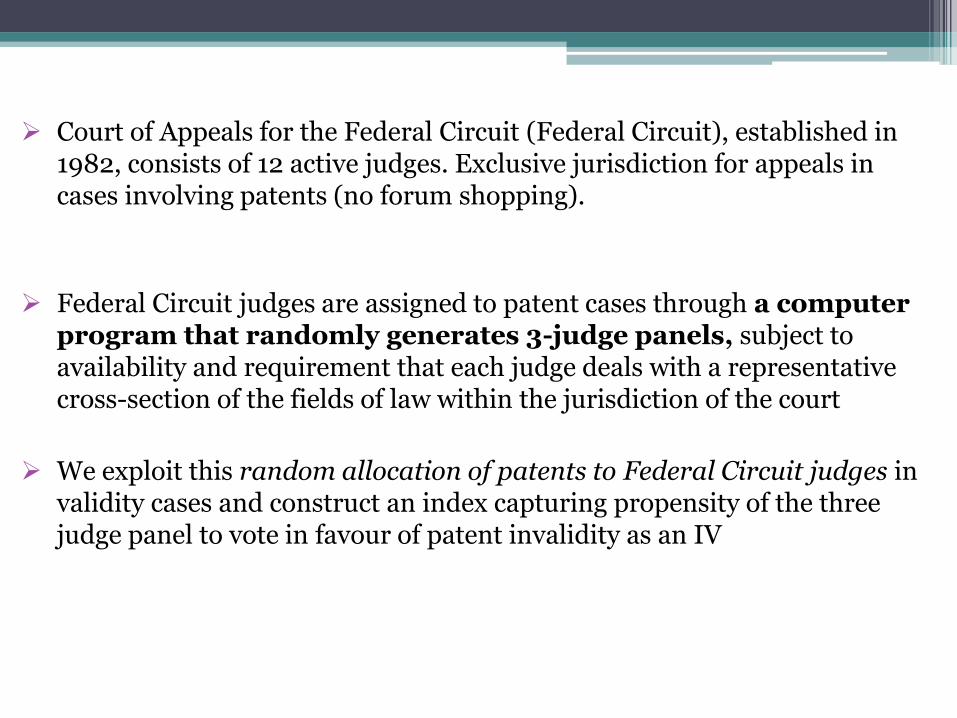
Court of Appeals for the Federal Circuit (Federal Circuit), established in 1982, consists of 12 active judges. Exclusive jurisdiction for appeals in cases involving patents (no forum shopping).
Federal Circuit judges are assigned to patent cases through a computer program that randomly generates 3-judge panels, subject to availability and requirement that each judge deals with a representative cross-section of the fields of law within the jurisdiction of the court
We exploit this random allocation of patents to Federal Circuit judges in validity cases and construct an index capturing propensity of the three judge panel to vote in favour of patent invalidity as an IV

Analytical Framework
We develop a framework that provides micro-foundation of payoffs. The model involves one upstream innovator and two potential downstream innovators who compete. Two main elements:
(1) ex-post bargaining problem: discourages downstream innovation when patents are present (bargaining failure associated with asymmetric information over the value of follow-on innovation)
(2) coordination problem among downstream potential innovators: discourages innovation when patents are absent
Trade-off is between greater bargaining failure with upstream patents versus coordination failure without upstream patents.

There is a base technology and follow-on patentable innovation, uncertain value. A1 (Asymmetric Info) Value only known by two downstream innovators A2 (Coordination) Innovation costs make entry by one firm profitable, but unprofitable for two firms. Focus on mixed strategy equilibrium: We derive probability of downstream investment with and without upstream patent. Result: A patent facilitates downstream innovation when the value is “well known” – either low or high. This is when bargaining breakdown with a patent is low, and where the mixed strategy equilibrium (downstream competition) generates a high probability of no innovation. Otherwise, patents make downstream innovation less likely.
Model

Model (2)
KEY IMPLICATION: The effect of patents on later innovation is ambiguous, depends critically on characteristics of the technology and the bargaining environment. Empirically, we would expect heterogeneous effects within and across technology fields and different market structures.
Data
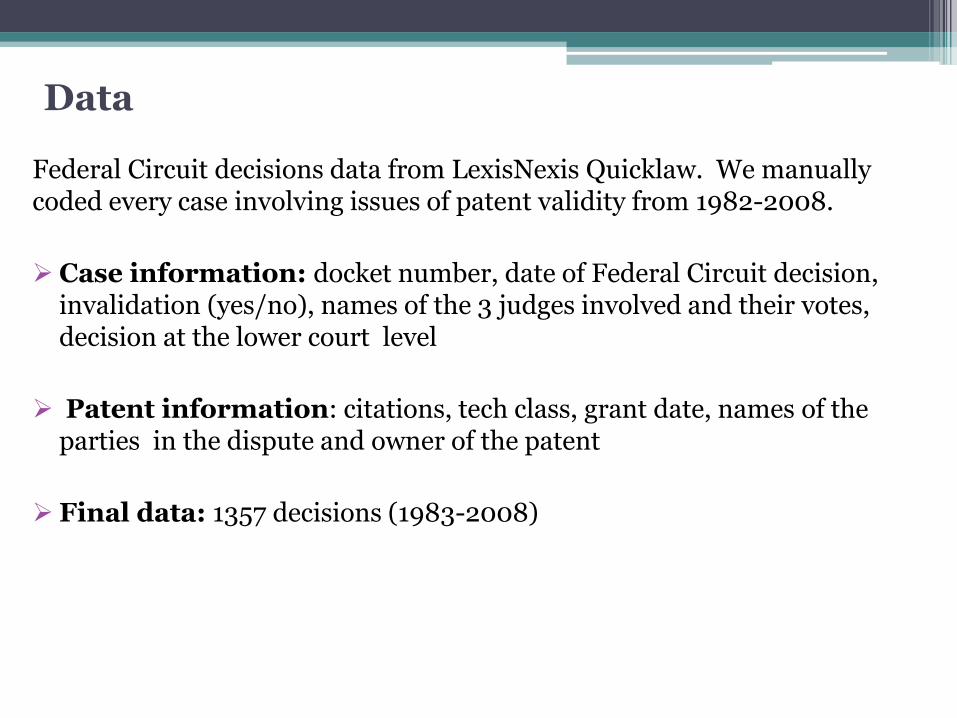
Federal Circuit decisions data from LexisNexis Quicklaw. We manually coded every case involving issues of patent validity from 1982-2008.
Case information: docket number, date of Federal Circuit decision, invalidation (yes/no), names of the 3 judges involved and their votes, decision at the lower court level
Patent information: citations, tech class, grant date, names of the parties in the dispute and owner of the patent
Final data: 1357 decisions (1983-2008)

Variables
Post-external cites: citations received in 5 years after Court decision
Invalidated: Dummy=1 if Court invalidates patent (or part of it)
Other Controls:
Pre-external/self-cites: citations received from grant date to decision
Number of claims
Tech field dummies: 6 NBER classes

Econometrics
techageClaims
dInvalidatePostCites
log)1esPreSelfCitlog(
)1PreCiteslog()1log(
32
1

Endogeneity
Issue: Unobserved heterogeneity of patents affects both citations to patents and the likelihood that judges invalidate the patent Likely Downward Bias: Shock in the value of underlying technology may increase citations to a patent and induce patentee to invest heavily in legal protection to avoid invalidation (challenger’s incentives are weaker due to free riding)

Judge Active ServiceValidity Decisions 1982-
2008
Percentage of Decisions in
which the Judge voted for
Invalidation
Randall Ray Rader 1990- 242 39.6
Daniel Mortimer Friedman 1982–1989 112 21.2
Pauline Newman 1984- 309 26.9
Glenn Leroy Archer, Jr. 1985–1997 170 34.7
Haldane Robert Mayer 1987–2010 269 42.4
S. Jay Plager 1989–2000 153 35.3
Alan David Lourie 1990- 293 46.8
Raymond Charles Clevenger III 1990–2006 232 37.9
Alvin Anthony Schall 1992–2009 248 37.5
William Curtis Bryson 1994- 238 44.1
Arthur J. Gajarsa 1997–2011 164 41.5
Richard Linn 1999– 111 43.2
Timothy B. Dyk 2000- 131 37.4
Sharon Prost 2001- 106 40.6
Kimberly Ann Moore 2006- 21 76.2
Giles Sutherland Rich 1982–1999 152 40.8
Arnold Wilson Cowen 1982-2007 59 33.9
Oscar Hirsh Davis 1982–1988 70 50.1
Philip Nichols, Jr. 1982-1990 38 26.3
Byron George Skelton 1982–2004 56 33.9
Phillip Benjamin Baldwin 1982-1991 54 25.9
Howard Thomas Markey 1982–1991 138 49.3
Marion Tinsley Bennett 1982–2000 57 57.9
Shiro Kashiwa 1982-1986 34 38.2
Jack Richard Miller 1982-1994 35 42.9
Edward Samuel Smith 1982-2001 91 36.3
Paul Redmond Michel 1988–2010 245 41.6
Helen Wilson Nies 1982–1996 89 38.2
Jean Galloway Bissell 1984–1990 41 24.4
IV Strategy
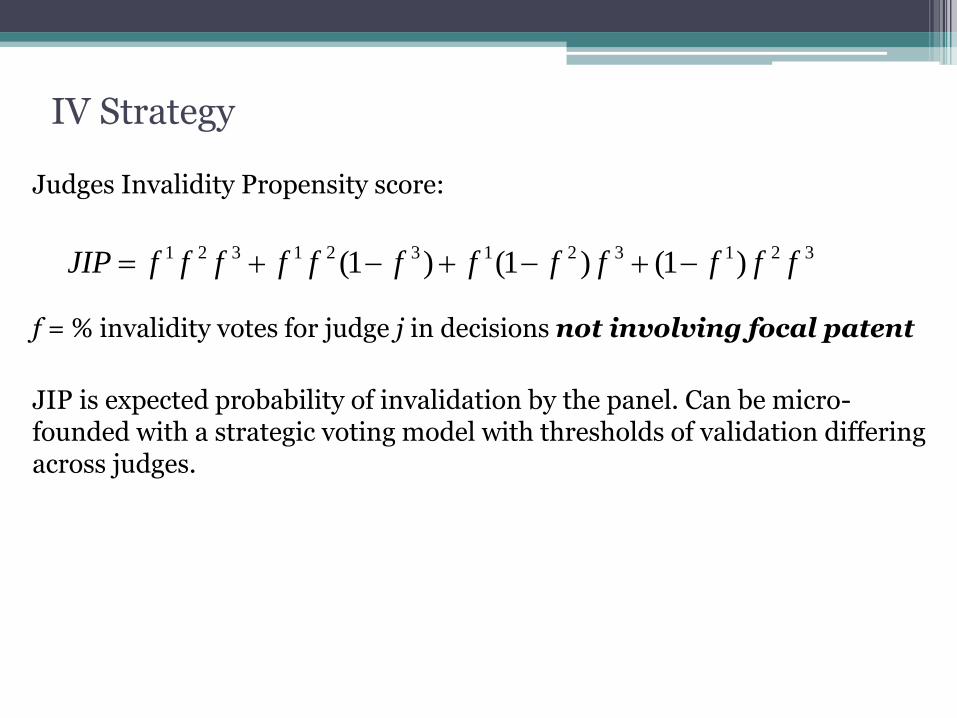
Judges Invalidity Propensity score:
f = % invalidity votes for judge j in decisions not involving focal patent
JIP is expected probability of invalidation by the panel. Can be micro-founded with a strategic voting model with thresholds of validation differing across judges.
321321321321 )1()1()1( ffffffffffffJIP

Impact of Invalidation on Future Citations
1 3
Estimation Method OLS 2SLS
Dependent Variable log(PostCites+1) log(PostCites+1)
Invalidated -0.053 0.410**
(0.048) (0.196)
Year effects YES YES
Age effects YES YES
Technology effects YES YES
Instrument predicted probability from
Probit
IV Validity Test F=94.85
Observations 1357 1357
All regressions control for log(Claims) log(PreCites) and log(Pre-SelfCites)

Discussion
Patents, on average, have negative impact on subsequent innovation
Patents invalidated because they are assigned to panels with high JIP experience about a 50% increase in citations
Lots of robustness checks in the paper (and appendices).

-0.6
-0.1
0.4
0.9
1.4
1.9
1 2 3 4 5 6 7 8 9 10
Effect of CAFC Invalidation
Years after CAFC
decision
Timing of Invalidity Effect
1982-2003 decisions so ≥ 7 year
window (robust to samples)
No effect in first 2 years, suggestive of entry not just publicity

Explaining the Heterogeneity
Economics of innovation literature identifies two features of bargaining environment that affect impact of patents on cumulative innovation. To capture these, we define:
Conc4: share of patenting of four largest assignees in technology sub-category in 5 years before decision
Hypothesis: less negotiation breakdown with higher concentration
Complexity: =1 if electronics, computers, medical instruments
Hypothesis: users require multiple patents, greater risk of breakdown

Sample Conc4 above
Median Conc4 below
Median Complex
Technologies Non Complex Technologies
Estimation 2SLS 2SLS 2SLS 2SLS
Dependent Variable
log(PostCites) log(PostCites) log(PostCites) log(PostCites)
Invalidated (Instrumented)
0.086 0.985*** 0.739** 0.317*
(0.331) (0.288) (0.322) (0.183)
Observations 687 670 437 920

Technology Effect of Invalidation
Chemical -0.028
(0.242)
Mechanical 0.173 (0.230)
Drugs 0.229 (0.230)
Computers and Communications
1.024***
(0.285)
Electrical and Electronics
1.107***
(0.285)
Medical Inst / Biotech 1.435*** (0.313)
Similar effects in split samples Evidence of negative impact of patents on cumulative innovation only in specific technology fields Medical Instruments/Biotech has strongest effect (as in earlier studies)

Blocking at Intensive/Extensive Margins
We decompose the impact on total number of citations into:
extensive margin (number of distinct patent assignees citing)
intensive margin (average number of cites per assignee)
Focus here on total effect only.
Distinguish between:
large patentees: top quartile (>102 patents)
small: below median (<5)
medium (5-102)

Total Effect
(Total External Citations Received)
1 2 3
Citing Patents in Small Portfolios
Citing Patents in Medium
Portfolios Citing Patents in Large Portfolios
Invalidity 0.075 0.19 0.228
(0.183) (0.168) (0.158)
Invalidity X Large Patentee
1.840** 0.826 0.689
(0.726) (0.663) (0.837)

Non-Patent Measures
1. MEDICAL INSTRUMENTS
• We exploit U.S. FDA regulation requiring approval of clinical trials on new medical devices in order to construct a metric of cumulative innovation linking (later) FDA approval requests to medical instrument patents.
• IV estimates confirm earlier result: patent invalidation increases later approval requests for medical instruments linked to the invalidated patent.
2. DRUGS
• We exploit FDA regulation of new drugs. For each drug patent, identify active ingredients and for all subsequent clinical trials and use a count of clinical trials that refer to the active ingredients in the invalidated patent.
• IV estimates confirm earlier result: no impact of patent rights on later innovation for pharmaceuticals

Three Alternative Interpretations
1. Media Coverage (Publicity) Increase in citations generated by press coverage around the decision.
But press coverage unlikely to be higher for patents that have been (randomly) allocated to judges with high propensity to invalidate
Predicts sudden burst in citations, not the gradual increase we estimated
Further, we collect news data to construct measure “Media Mentions.” Including it has virtually no effect on our invalidation impact.

2. Substitution among Patents Increase in citation reflects patentees shifting from other patents to less expensive invalidated patent, rather than more cumulative innovation.
But why only for small firms for invalidated patents held by large firms? And only in complex technology sectors with fragmented patent rights?
We use Google patent search (text matching) algorithm to identify “related” patents to the invalidated patent and study whether post-decision citations to them decline, as predicted by the “substitution hypothesis.”
We do find evidence of this (significant negative coefficient), but only able to explain at most 20% of overall impact of invalidation.

3. Strategic Citation Increase in citation reflects small patentees "strategically withholding” cites to valid patents of large firms
But previous studies show large firms more likely to withhold cites, whereas we find the effect of invalidity is driven by small firm citations
hard to reconcile with lagged effect of invalidity on cites we find

Conclusions
Exploit random allocation of Federal Circuit judges to estimate causal effect of patent rights on cumulative innovation: patent invalidation increases future citations on average
Effects are heterogeneous: vary across and within technology fields. Blockage only in complex technology sectors with fragmented patent rights. More research needed to explore this.
On evidence so far, patents held by large firms impede cumulative innovation by smaller firms, but not for other firm pairings. Suggests that incentives and licensing hurdles depend on parties’ asymmetries.
Remedial policies should be targeted to facilitate bargaining – which is the key here – and thereby promote cumulative innovation. “One size fits all” remedies (broad-based scaling back of patent rights) are not likely to be optimal.


All Granted Patents not litigated
Litigated at Lower Courts and Not
Appealed
Litigated at Lower Courts and Fed. Circuit Appealed
Number of patents 1,808,770 7,216 877 Patent Characteristics
Cites received per claim 1.0 1.9 2.3 Number of claims 12.5 17.1 19.0 Generality 0.45 0.49 0.49 Originality 0.36 0.39 0.40
SAMPLE COMPARISONS 1980-1999

3 5
Estimation Method Probit OLS
Dependent Variable
D_Invalidity JIP
Judge fixed effects
Judges Invalidity Propensity (JIP)
3.131***
(0.743)
log(Claims) 0.041 -0.001
(0.039) (0.002)
log(PreExCites) -0.137*** 0.001
(0.040) (0.002)
log(PreSelfCites 0.002 -0.002
(0.045) (0.002)
Year effects YES*** YES***
Age effects YES*** YES
Technology effects YES*** YES
Observations 1357 1357

-1.5
-1
-0.5
0
0.5
1
1.5
2
2.5
3
0.08 0.16 0.2 0.24 0.27 0.3 0.32 0.34 0.36 0.38 0.4 0.42 0.45 0.48 0.51 0.54 0.59 0.64 0.68 0.72
Marginal Treatment Effect
95 percent Conf. Int.
Lot of heterogeneity
Blockage concentrated among patents with higher estimated probability of being invalidated, based on observables.
ptpt
),(| ptptpt JIPXPE
Heterogeneous Effects
We follow Carneiro, Heckman & Vytlacil (Ecta, 2010) to estimate the MTE:

Invalidity and Patent Age – 2SLS
Full Sample Age<=20 Age<=18 Age<=15 Age>15
Invalidated 0.410** 0.412** 0.457** 0.577** 0.055
(0.196) (0.203) (0.216) (0.239) (0.272)
Obs 1357 1313 1245 1098 259
Effect of invalidity is stronger as we drop older patents from sample. We find no effect of invalidity on old patents.

Total Effect Extensive Margin Intensive Margin
(Total External Citations Received) (Number of distinct Assignees) (External Citations per Assignee)
1 2 3 4 5 6 7 8 9
Citing Patents in
Small Portfolios
Citing Patents in Medium
Portfolios
Citing Patents in
Large Portfolios
Citing Patents in
Small Portfolios
Citing Patents in Medium
Portfolios
Citing Patents in
Large Portfolios
Citing Patents in
Small Portfolios
Citing Patents in Medium
Portfolios
Citing Patents in
Large Portfolios
Invalidity 0.075 0.19 0.228 0.036 0.003 0.123 0.025 0.171 0.088
(0.183) (0.168) (0.158) (0.155) (0.105) (0.104) (0.053) (0.105) (0.079)
Invalidity X Large Patentee
1.840** 0.826 0.689 1.347** 0.418 0.041 0.479* 0.362 0.659
(0.726) (0.663) (0.837) (0.556) (0.376) (0.446) (0.261) (0.393) (0.535)
Medical Instruments (2)
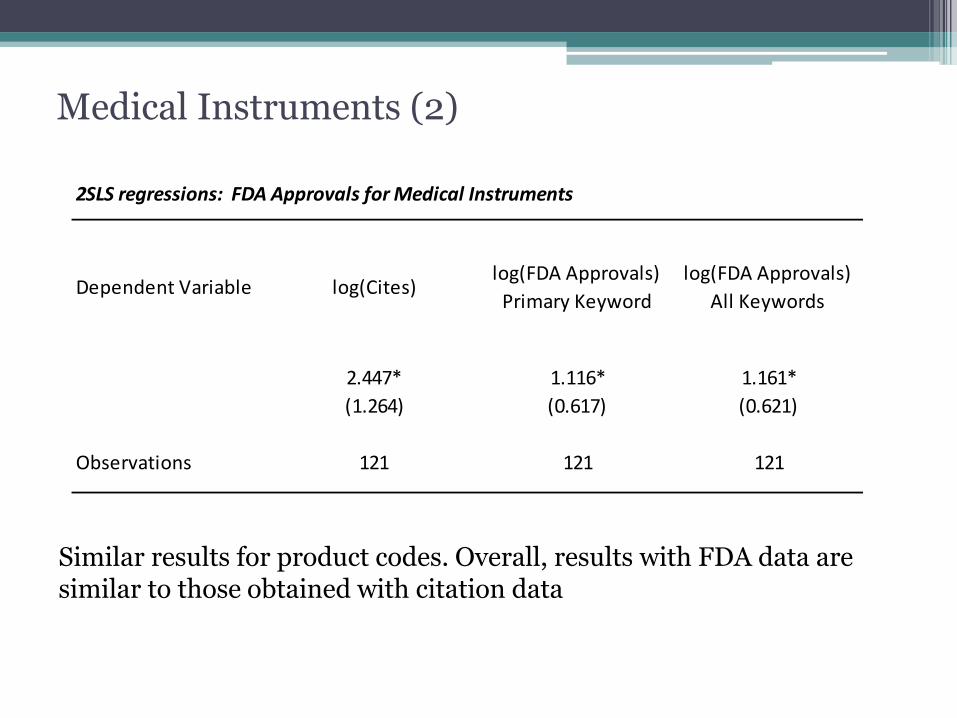
2SLS regressions: FDA Approvals for Medical Instruments
Dependent Variable log(Cites)log(FDA Approvals)
Primary Keyword
log(FDA Approvals)
All Keywords
2.447* 1.116* 1.161*
(1.264) (0.617) (0.621)
Observations 121 121 121
Similar results for product codes. Overall, results with FDA data are similar to those obtained with citation data
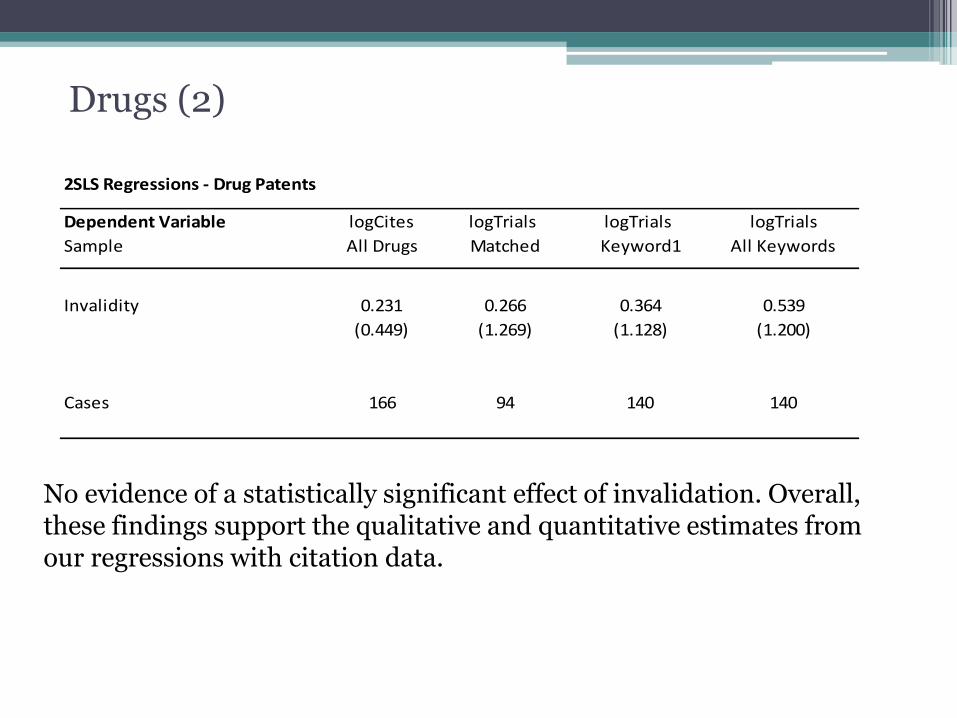
Drugs (2)
Dependent Variable logCites logTrials logTrials logTrials
Sample All Drugs Matched Keyword1 All Keywords
Invalidity 0.231 0.266 0.364 0.539
(0.449) (1.269) (1.128) (1.200)
Cases 166 94 140 140
2SLS Regressions - Drug Patents
No evidence of a statistically significant effect of invalidation. Overall, these findings support the qualitative and quantitative estimates from our regressions with citation data.
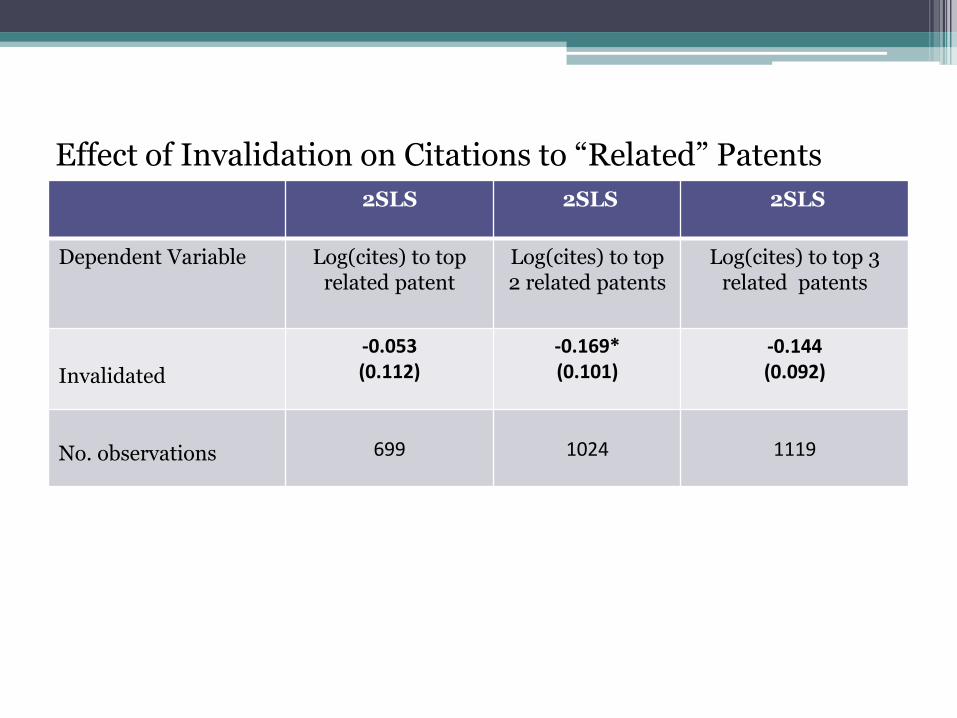
Effect of Invalidation on Citations to “Related” Patents
2SLS 2SLS 2SLS
Dependent Variable Log(cites) to top related patent
Log(cites) to top 2 related patents
Log(cites) to top 3 related patents
Invalidated
-0.053 (0.112)
-0.169* (0.101)
-0.144 (0.092)
No. observations
699
1024
1119