Embed Size (px)
Citation preview
PATENT SIMILARITY AN ANALYSIS TOOL AND APPLICATIONS
Dietmar Harhoff
Based on joint work with Michael Natterer, Matthias Pötzl, Georg von Graevenitz, Stefan Wagner
TOKYO, NOVEMBER 17/18, 2014
IP Statistics for Decision Makers Conference
Max Planck Institute for Innovation and Competition | Munich
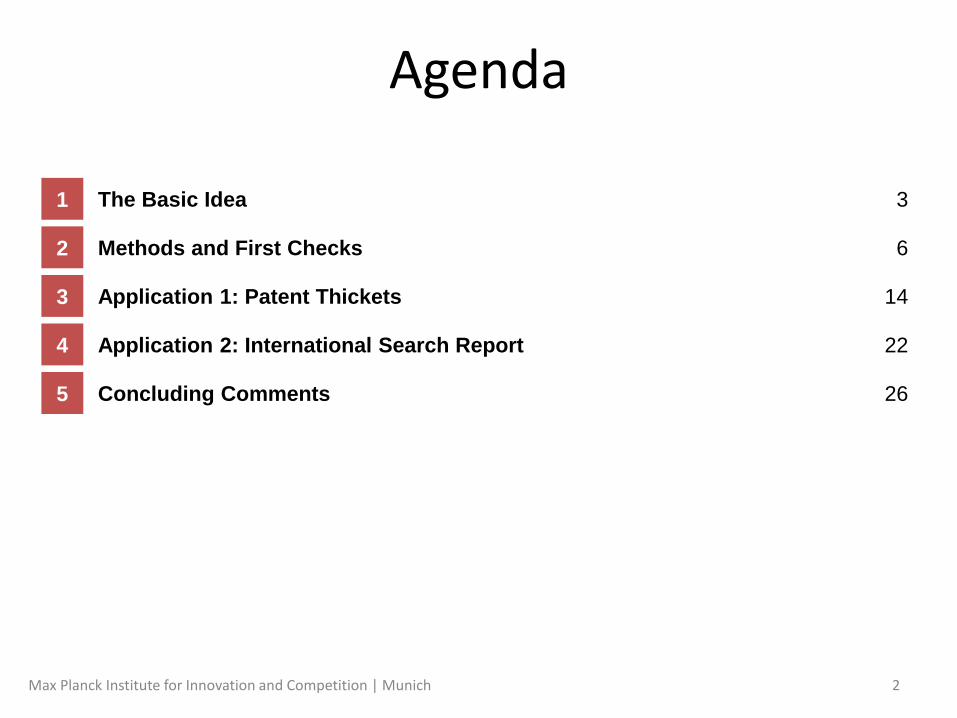
26 Concluding Comments 5
22 Application 2: International Search Report 4
14 Application 1: Patent Thickets 3
6 Methods and First Checks 2
3 The Basic Idea 1
Agenda
Max Planck Institute for Innovation and Competition | Munich 2
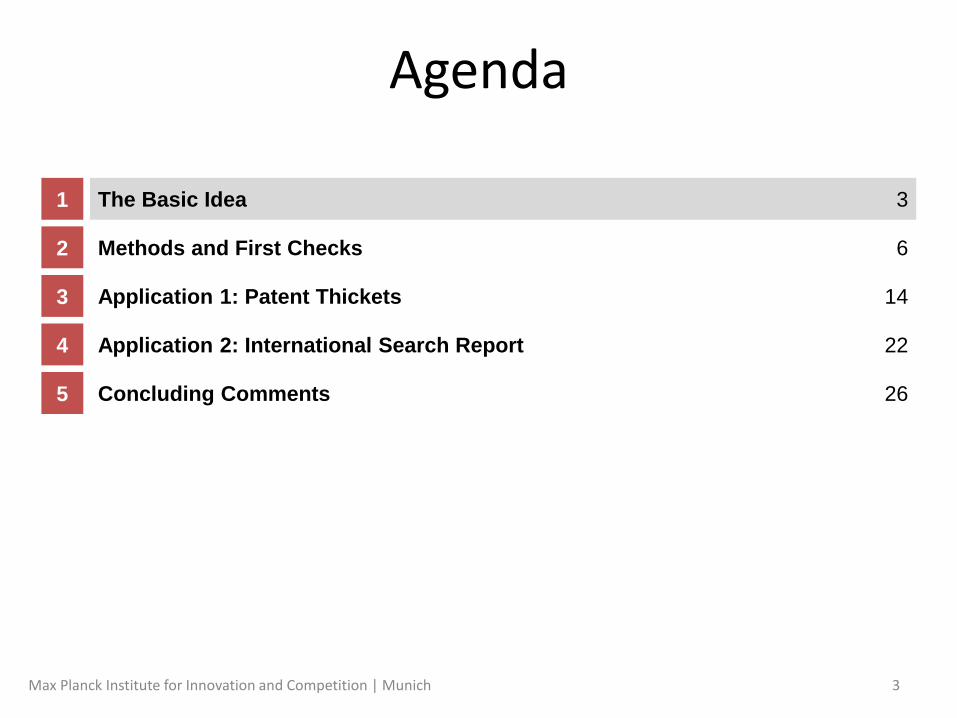
26 Concluding Comments 5
22 Application 2: International Search Report 4
14 Application 1: Patent Thickets 3
6 Methods and First Checks 2
3 The Basic Idea 1
Agenda
Max Planck Institute for Innovation and Competition | Munich 3
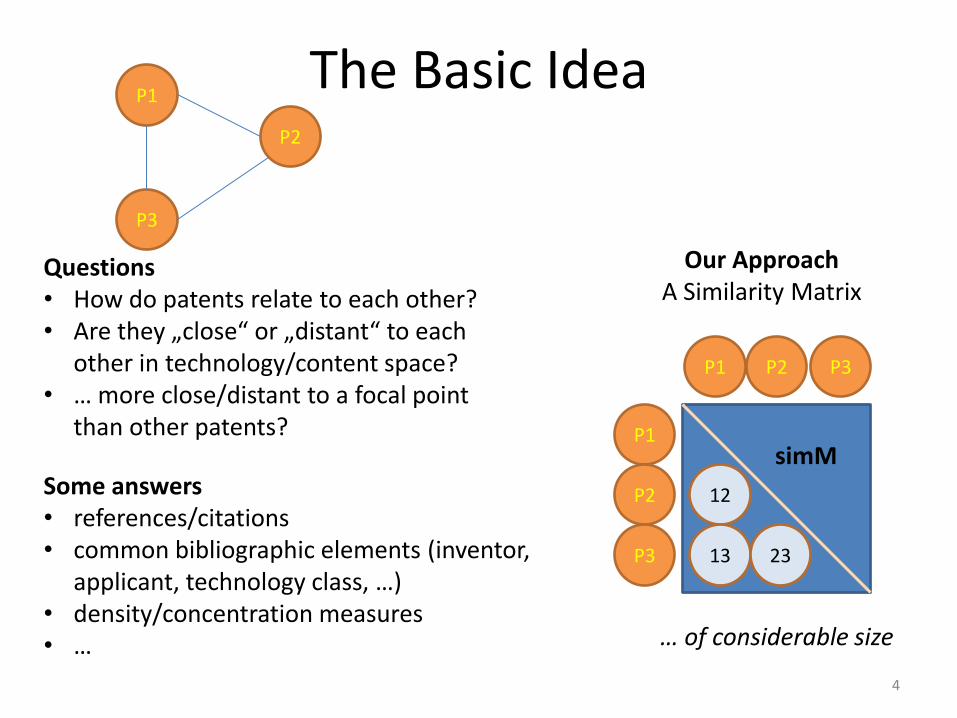
The Basic Idea
Questions • How do patents relate to each other? • Are they „close“ or „distant“ to each
other in technology/content space? • … more close/distant to a focal point
than other patents?
Some answers • references/citations • common bibliographic elements (inventor,
applicant, technology class, …) • density/concentration measures • …
P1
P2
P3
… of considerable size
simM
P1 P2 P3
P1
P2
P3
12
13 23
Our Approach A Similarity Matrix
4

The Basic Idea
• Similarity matrices may be (and are being) used for – clustering exercises (e.g. within applicant or national
portfolios) and analysis of such clusters – search for similar technical art – detection of areas within the patent system with high
average similarity among patents (possibly: thickets?) – modeling of impact of competition on patent value,
litigation, etc. – analyzing „patent quality“ – analyzing relatedness of R&D activities and of
technological rivalry
5
26 Concluding Comments 5
22 Application 2: International Search Report 4
14 Application 1: Patent Thickets 3
6 Methods and First Checks 2
3 The Basic Idea 1
Agenda
Max Planck Institute for Innovation and Competition | Munich 6

Methods and First Checks
• computation of similarity measures using a multi-step approach (based on title, abstract, claims and description)
• obtain text information from bulk delivery services such as OPS, other public databases or via the EPO‘s data products
• process text elements (cleaning and standardization, stemming, … ) to generate keyword vector
• apply similarity calculations (cosine, Jacard, …)
7
Methods and First Checks
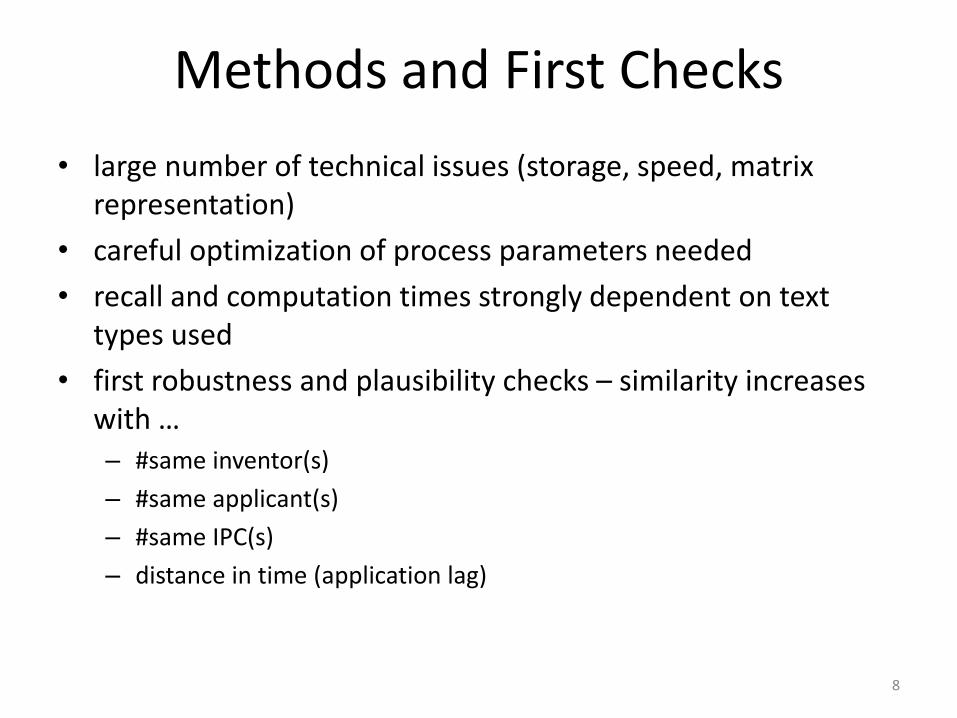
• large number of technical issues (storage, speed, matrix representation)
• careful optimization of process parameters needed
• recall and computation times strongly dependent on text types used
• first robustness and plausibility checks – similarity increases with … – #same inventor(s)
– #same applicant(s)
– #same IPC(s)
– distance in time (application lag)
8
Methods and First Checks
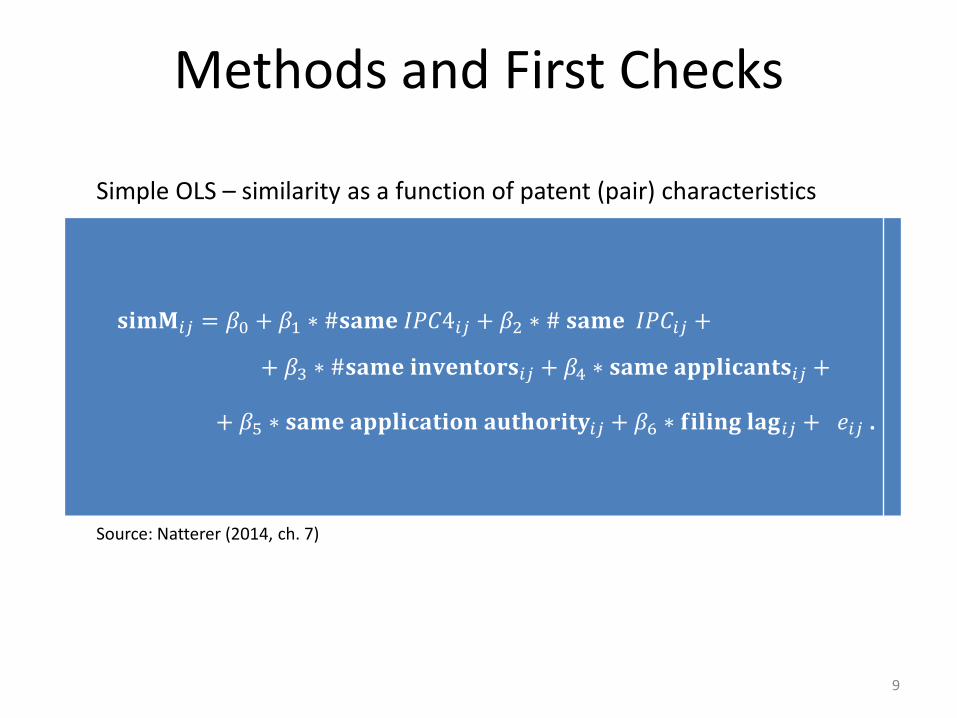
Source: Natterer (2014, ch. 7)
𝐬𝐢𝐦𝐌𝑖𝑗 = 𝛽0 + 𝛽1 ∗ #𝐬𝐚𝐦𝐞 𝐼𝑃𝐶4𝑖𝑗 + 𝛽2 ∗ # 𝐬𝐚𝐦𝐞 𝐼𝑃𝐶𝑖𝑗 +
+ 𝛽3 ∗ #𝐬𝐚𝐦𝐞 𝐢𝐧𝐯𝐞𝐧𝐭𝐨𝐫𝐬𝑖𝑗 + 𝛽4 ∗ 𝐬𝐚𝐦𝐞 𝐚𝐩𝐩𝐥𝐢𝐜𝐚𝐧𝐭𝐬𝑖𝑗 +
+ 𝛽5 ∗ 𝐬𝐚𝐦𝐞 𝐚𝐩𝐩𝐥𝐢𝐜𝐚𝐭𝐢𝐨𝐧 𝐚𝐮𝐭𝐡𝐨𝐫𝐢𝐭𝐲𝑖𝑗 + 𝛽6 ∗ 𝐟𝐢𝐥𝐢𝐧𝐠 𝐥𝐚𝐠𝑖𝑗 + 𝑒𝑖𝑗 .
Simple OLS – similarity as a function of patent (pair) characteristics
9
Methods and First Checks
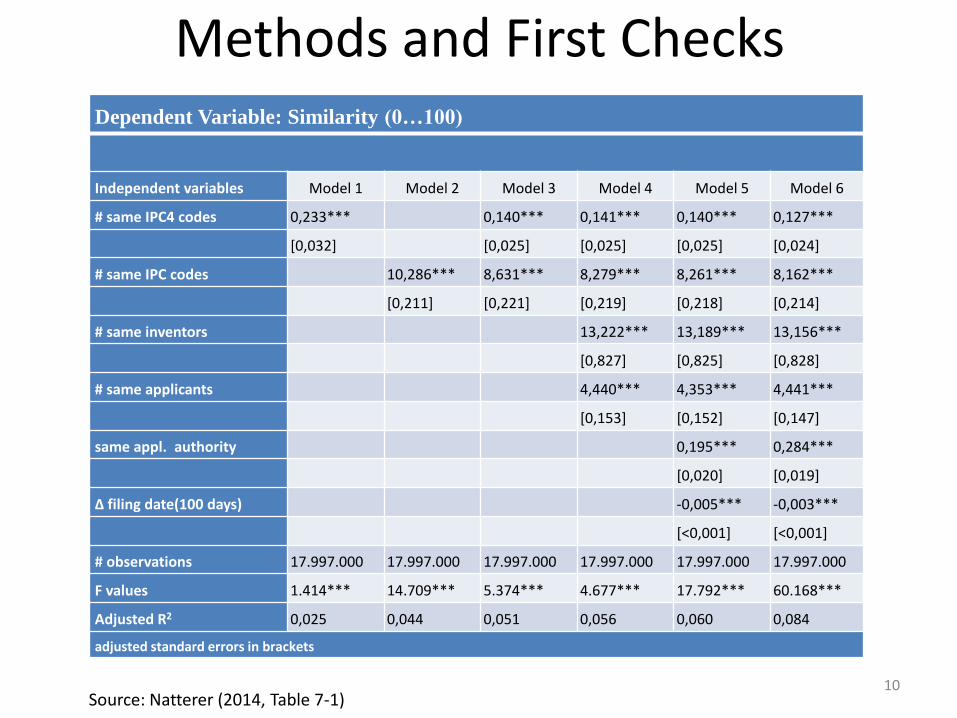
Source: Natterer (2014, Table 7-1)
Dependent Variable: Similarity (0…100)
Independent variables Model 1 Model 2 Model 3 Model 4 Model 5 Model 6
# same IPC4 codes 0,233*** 0,140*** 0,141*** 0,140*** 0,127***
[0,032] [0,025] [0,025] [0,025] [0,024]
# same IPC codes 10,286*** 8,631*** 8,279*** 8,261*** 8,162***
[0,211] [0,221] [0,219] [0,218] [0,214]
# same inventors 13,222*** 13,189*** 13,156***
[0,827] [0,825] [0,828]
# same applicants 4,440*** 4,353*** 4,441***
[0,153] [0,152] [0,147]
same appl. authority 0,195*** 0,284***
[0,020] [0,019]
Δ filing date(100 days) -0,005*** -0,003***
[<0,001] [<0,001]
# observations 17.997.000 17.997.000 17.997.000 17.997.000 17.997.000 17.997.000
F values 1.414*** 14.709*** 5.374*** 4.677*** 17.792*** 60.168***
Adjusted R2 0,025 0,044 0,051 0,056 0,060 0,084
adjusted standard errors in brackets
10
Methods and First Checks Results for Electrical Engineering
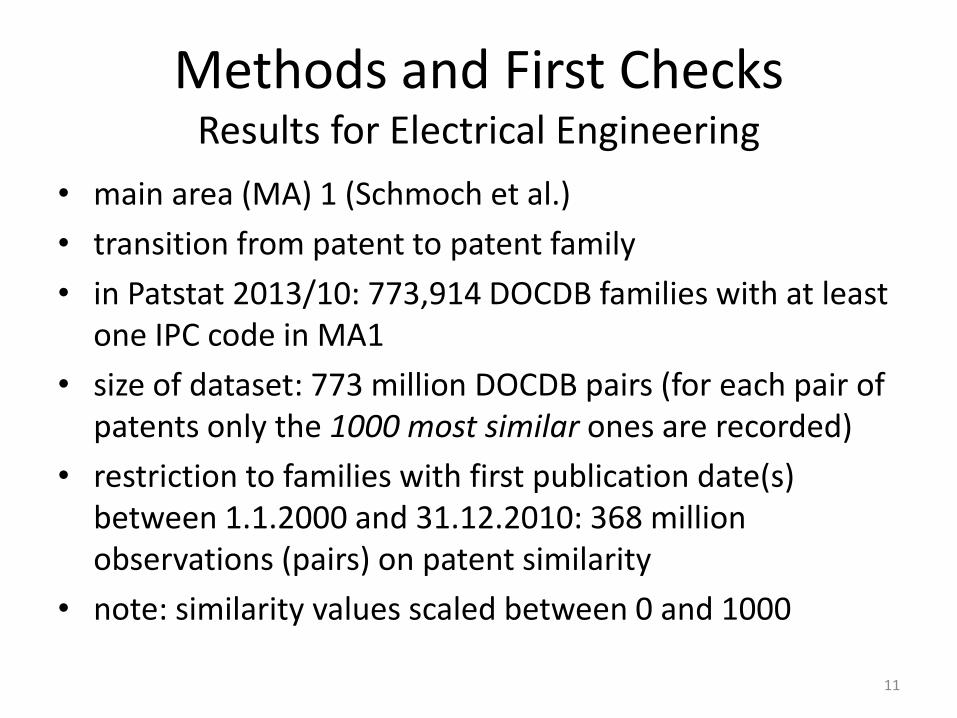
• main area (MA) 1 (Schmoch et al.)
• transition from patent to patent family
• in Patstat 2013/10: 773,914 DOCDB families with at least one IPC code in MA1
• size of dataset: 773 million DOCDB pairs (for each pair of patents only the 1000 most similar ones are recorded)
• restriction to families with first publication date(s) between 1.1.2000 and 31.12.2010: 368 million observations (pairs) on patent similarity
• note: similarity values scaled between 0 and 1000
11
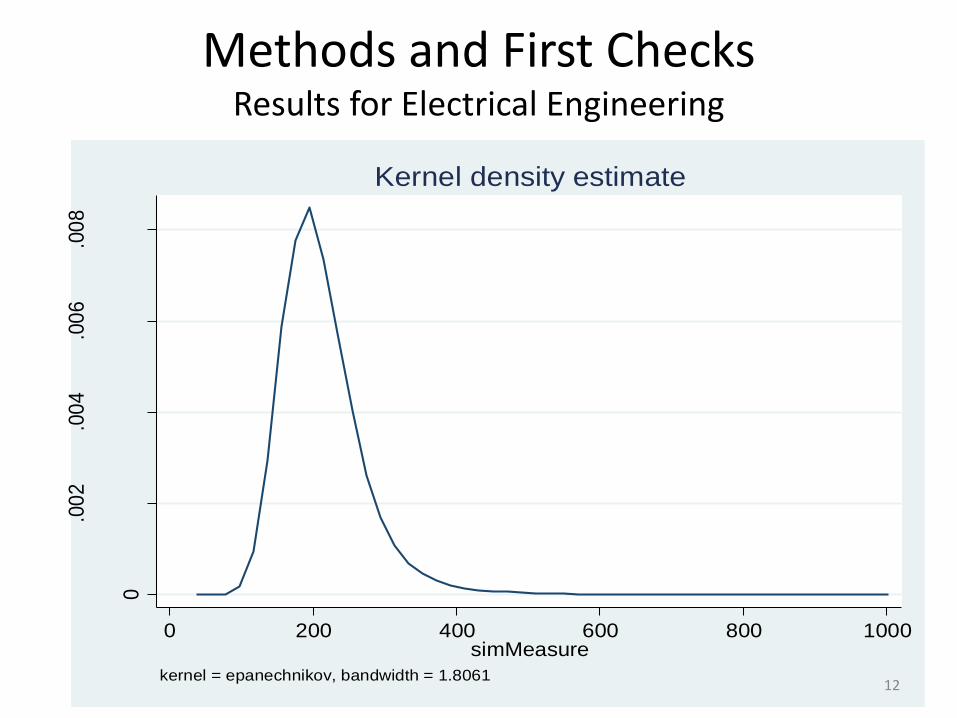
Methods and First Checks Results for Electrical Engineering
simM
-------------------------------------------------------------
Percentiles Smallest
1% 117 40
5% 140 40
10% 153 40 Obs 63285982
25% 177 40 Sum of Wgt. 63285982
50% 208 Mean 218.2156
Largest Std. Dev. 65.01625
75% 246 1000
90% 292 1000 Variance 4227.113
95% 329 1000 Skewness 2.224744
99% 440 1000 Kurtosis 15.35329
random sample
0
.00
2.0
04
.00
6.0
08
Den
sity
0 200 400 600 800 1000simMeasure
kernel = epanechnikov, bandwidth = 1.8061
Kernel density estimate
12
Methods and First Checks Results for Electrical Engineering
• DOCDB families „under-aggregate“ – several thousand cases with (almost) identical documents and same applicant
• (early) measures of „performance“ (without use of descriptions) – about 50 percent of EPO references (mostly provided by
examiner) found among most similar patents
– half of these among the 50 most similar patents
• analysis and application to USPTO references (mostly applicant provided) still going on
13
26 Concluding Comments 5
22 Application 2: International Search Report 4
14 Application 1: Patent Thickets 3
6 Methods and First Checks 2
3 The Basic Idea 1
Agenda
Max Planck Institute for Innovation and Competition | Munich 14
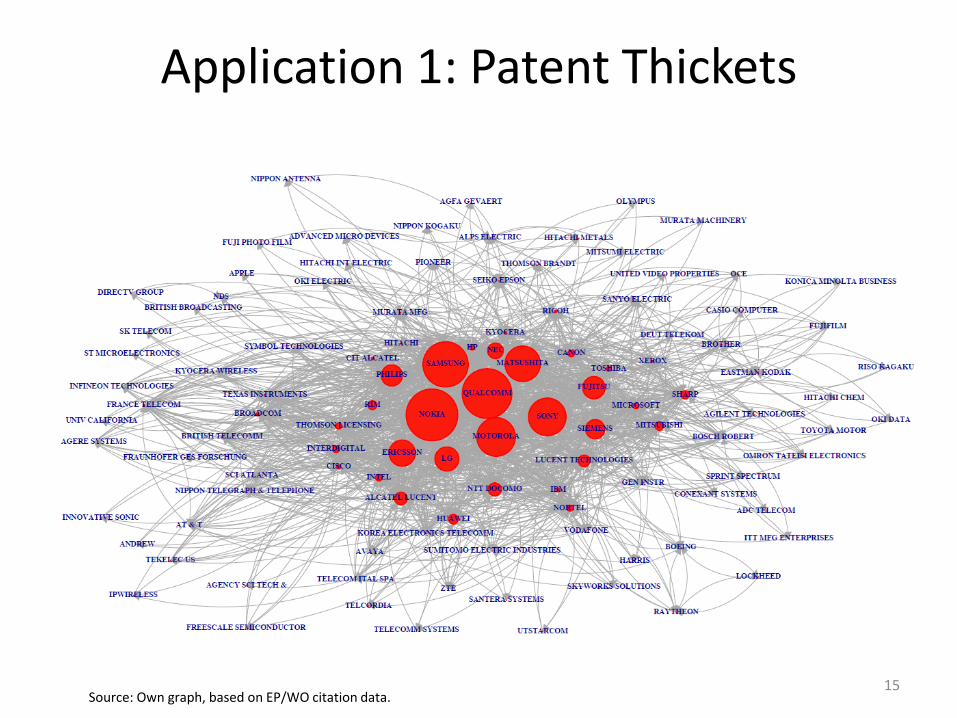
Application 1: Patent Thickets
15 Source: Own graph, based on EP/WO citation data.
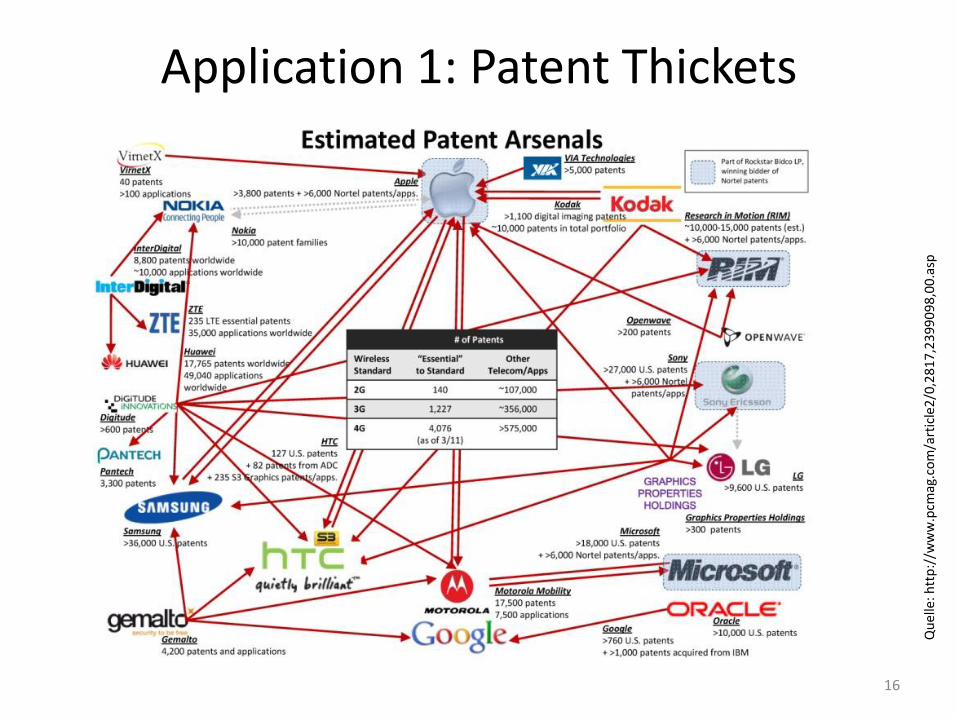
Application 1: Patent Thickets
16
Qu
elle
: htt
p:/
/ww
w.p
cmag
.co
m/a
rtic
le2
/0,2
81
7,2
39
90
98
,00
.asp
Application 1: Patent Thickets
• Demand for patent rights has been growing steadily • Large portion is argued to be “weak” or marginal in
terms of their contribution to the state of the art (Jaffe and Lerner 2004, Bessen and Meurer 2008, Lei and Wright 2009)
• Patent thickets are characterized in the literature by overlapping claims and/or dispersed ownership. The exact definition is controversial (Cockburn and MacGarvie 2009, Noel and Schankermann 2006, Hall and Ziedonis 2001)
• in extant literature two „measures“ of thickets – fragmentation of ownership (Ziedonis 2004) – „triples“ (Graevenitz et al 2011)
17
Application 1: Patent Thickets
• Fragmentation (Ziedonis 2004)
– focus on who owns relevant prior art to which the owner of the focal patent may have to gain access
– extreme concentration: simple one-to-one negotiations
– extreme fragmentation: complex negotiation with high transactions costs
– usually computed as a Herfindahl measure (more reliable for cases with many prior art references)
18
Application 1: Patent Thickets
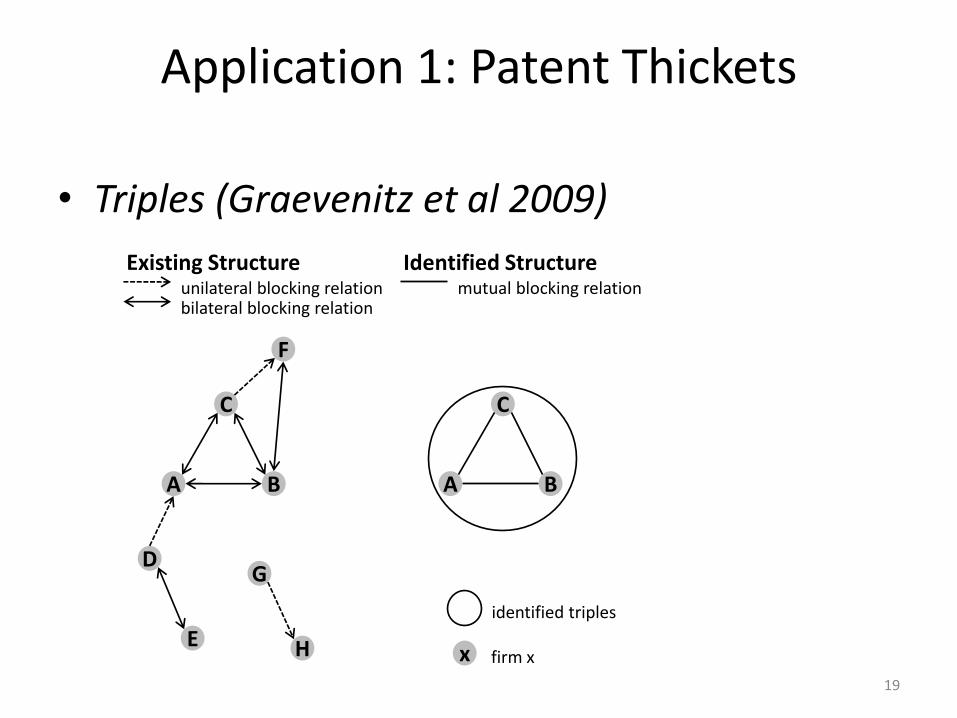
• Triples (Graevenitz et al 2009)
F
C
B A
D
E
G
H
Existing Structure unilateral blocking relation bilateral blocking relation
C
B A
Identified Structure mutual blocking relation
identified triples
x firm x
19
Application 1: Patent Thickets
• Both measures based on references (citations) – concentration of ownership – incidence of interrelated and complex patenting positions – apparently independent, but related effects (no
substitutes)
• Both measures may have disadvantages when the number of references is small.
• Similarity measures may help to detect additional effects of patent density, i.e. of encountering a large number of similar patents in one‘s environment.
• They do not suffer from detrimental effects of low numbers of references.
• Measure used here: p95 of simM 20
Application 1: Patent Thickets
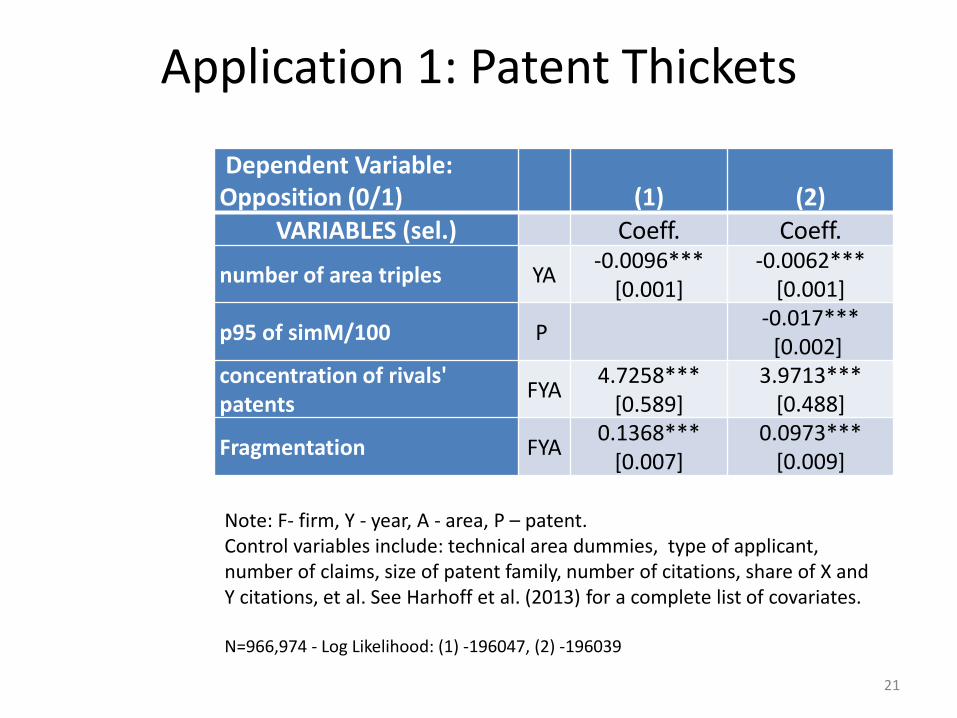
Dependent Variable: Opposition (0/1) (1) (2)
VARIABLES (sel.) Coeff. Coeff.
number of area triples YA -0.0096***
[0.001] -0.0062***
[0.001]
p95 of simM/100 P -0.017***
[0.002] concentration of rivals' patents
FYA 4.7258***
[0.589] 3.9713***
[0.488]
Fragmentation FYA 0.1368***
[0.007] 0.0973***
[0.009]
Note: F- firm, Y - year, A - area, P – patent. Control variables include: technical area dummies, type of applicant, number of claims, size of patent family, number of citations, share of X and Y citations, et al. See Harhoff et al. (2013) for a complete list of covariates. N=966,974 - Log Likelihood: (1) -196047, (2) -196039
21
26 Concluding Comments 5
22 Application 2: International Search Report 4
14 Application 1: Patent Thickets 3
6 Methods and First Checks 2
3 The Basic Idea 1
Agenda
Max Planck Institute for Innovation and Competition | Munich 22
Application 2: International Search Reports
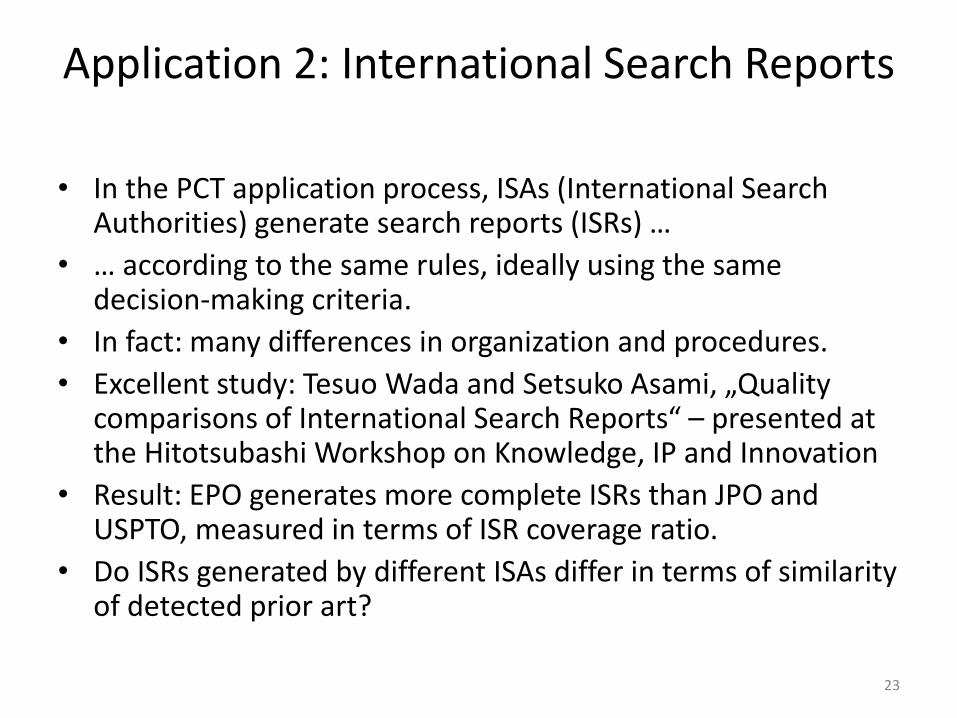
• In the PCT application process, ISAs (International Search Authorities) generate search reports (ISRs) …
• … according to the same rules, ideally using the same decision-making criteria.
• In fact: many differences in organization and procedures.
• Excellent study: Tesuo Wada and Setsuko Asami, „Quality comparisons of International Search Reports“ – presented at the Hitotsubashi Workshop on Knowledge, IP and Innovation
• Result: EPO generates more complete ISRs than JPO and USPTO, measured in terms of ISR coverage ratio.
• Do ISRs generated by different ISAs differ in terms of similarity of detected prior art?
23
Application 2: International Search Reports
24
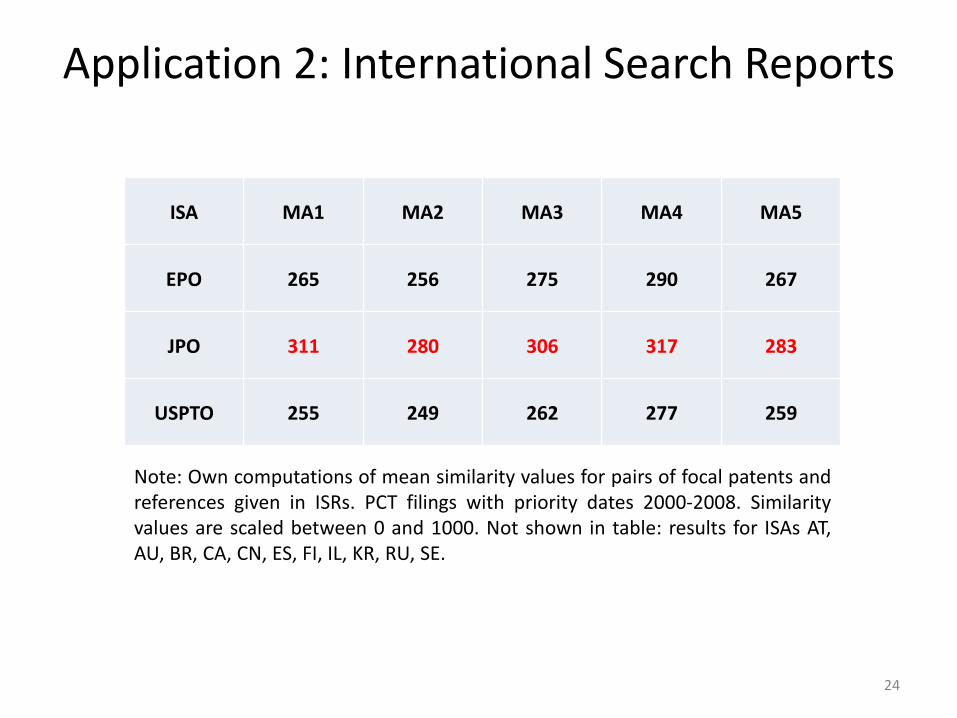
Note: Own computations of mean similarity values for pairs of focal patents and references given in ISRs. PCT filings with priority dates 2000-2008. Similarity values are scaled between 0 and 1000. Not shown in table: results for ISAs AT, AU, BR, CA, CN, ES, FI, IL, KR, RU, SE.
ISA MA1 MA2 MA3 MA4 MA5
EPO 265 256 275 290 267
JPO 311 280 306 317 283
USPTO 255 249 262 277 259
Application 2: International Search Reports
• Hence, ISR coverage points to quality advantages for EPO, similarity values are not fully congruent with that result.
Further results (preliminary – to be explored)
• Low similarity values in non-EPO ISRs trigger A4 publications (supplementary search).
• Ranking of similarity values by source of references in EPO search reports: applicant > examiner > opposition > Rule 115.
25
26 Concluding Comments 5
22 Application 2: International Search Report 4
14 Application 1: Patent Thickets 3
6 Methods and First Checks 2
3 The Basic Idea 1
Agenda
Max Planck Institute for Innovation and Competition | Munich 26
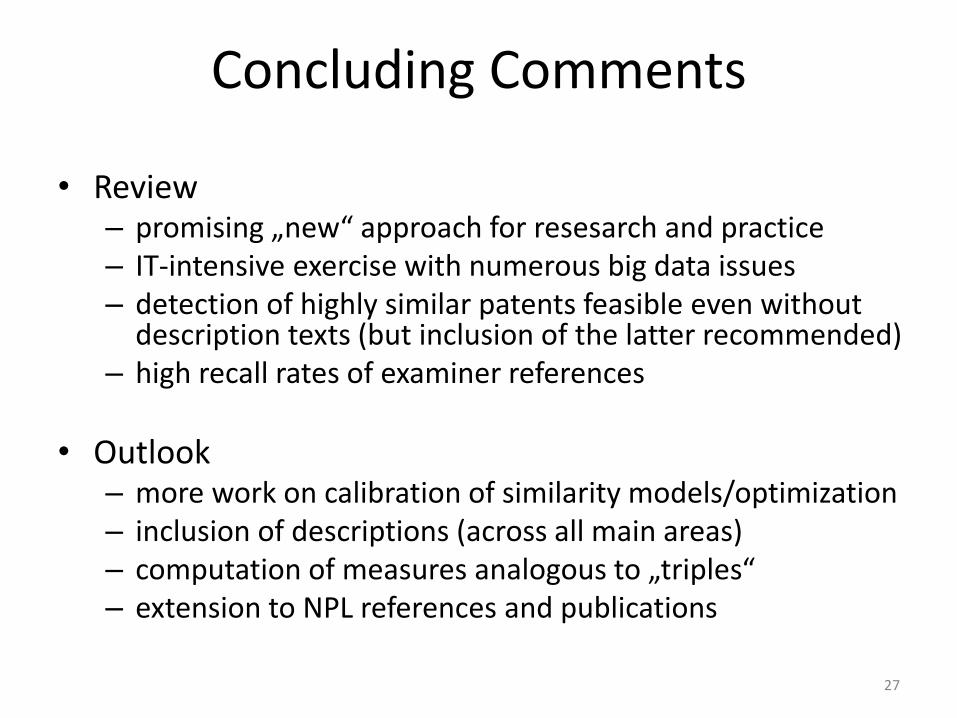
Concluding Comments
• Review – promising „new“ approach for resesarch and practice – IT-intensive exercise with numerous big data issues – detection of highly similar patents feasible even without
description texts (but inclusion of the latter recommended) – high recall rates of examiner references
• Outlook – more work on calibration of similarity models/optimization – inclusion of descriptions (across all main areas) – computation of measures analogous to „triples“ – extension to NPL references and publications
27
Thank you for your attention Dietmar Harhoff Max Planck Institute for Innovation and Competition


![User profile correlation-based similarity (UPCSim) algorithm ......collaborative ltering similarity [29], the Triangle Multiplying Jaccard (TMJ) similarity [30], and the similarity](https://img.pdfslide.us/doc/110x75/6147013af4263007b1358a2c/user-profile-correlation-based-similarity-upcsim-algorithm-collaborative.jpg)