Embed Size (px)
Citation preview
A RANGE-WIDE DISTURBANCE HISTORY
FOR QUERCUS ALBA
IN THE EASTERN US
by
MEGAN LINDSAY BUCHANAN
A THESIS
Submitted in partial fulfillment of the requirements
for the degree of Master of Science
in the Department of Geography
in the Graduate School of
The University of Alabama
TUSCALOOSA, ALABAMA
2011

Copyright Megan Lindsay Buchanan 2011
ALL RIGHTS RESERVED
ii
ABSTRACT
Throughout much of the eastern US, forests are undergoing a transition from Quercus to
Acer-Fagus dominance. While the pattern has been reported in many site-specific analyses and
is often linked to changes in disturbance regimes, a landscape-level analysis of historical
establishment and disturbance throughout the region has not been conducted. I used tree-ring
chronologies to analyze the disturbance history from old-growth Q. alba sites located throughout
the species’ range with the ultimate goal of determining the environmental conditions and
disturbance dynamics that existed throughout the latter period of Quercus dominance and early
period of Quercus decline. My analysis provided regional- and range-wide data regarding the
frequency of disturbance throughout the development of old-growth Q. alba stands. In general,
the temporal distribution of tree establishment dates was bimodal and corresponded to the period
of Native American depopulation and the period following European settlement. Drought,
Castanea dentata decline, and logging activities also significantly contributed to the long-term,
range-wide disturbance regime.
Regional discrepancies in release characteristics were identified. The Northern
Hardwood Forest Region featured the highest level of disturbance as compared to all other
regions. The Central Hardwood Forest Region exhibited the second lowest rate of disturbance
(as evidenced by the relativized release descriptors). In general, high-magnitude disturbances
occurred throughout the Q. alba range every 234–556 years. My findings confirm that Quercus
dominance throughout the latter part of the Holocene was maintained, in part, by high magnitude
disturbance events ca. every 400 years. Such high magnitude disturbances remove many

iii
disturbance-intolerant species, fragment large areas of the canopy, cause significant damage to
subcanopy individuals, and allow disturbance-oriented and mid-successional taxa, such as
Quercus, to establish. This return interval for high magnitude disturbance events can be imitated
by land managers throughout the region in effort to promote Quercus regeneration.

iv
ACKNOWLEDGMENTS
I would like to thank the many contributors of Quercus alba chronologies to the ITRDB. I also
thank Laura Wesley and Craig Remington of the University of Alabama Cartographic Research
Laboratory for assistance with figure preparation, Ian Comstock for assistance with database
management, and Jacob Richards for helpful comments on earlier drafts of the manuscript. I
especially thank Dr. Justin Hart for his invaluable guidance throughout the entire research
process. Additionally I sincerely thank Drs. David Shankman, and Gregory Starr for their valued
assistance and service on my thesis committee.

v
CONTENTS
ABSTRACT .................................................................................................................................... ii
ACKNOWLEDGMENTS ............................................................................................................. iv
LIST OF TABLES ........................................................................................................................ vii
LIST OF FIGURES ..................................................................................................................... viii
1. INTRODUCTION .......................................................................................................................1
2. QUERCUS ALBA .........................................................................................................................4
3. METHODS ..................................................................................................................................5
3.1. Radial growth release analyses .................................................................................................5
3.2. Statistical analyses ..................................................................................................................10
4. RESULTS ..................................................................................................................................12
4.1. Tree .........................................................................................................................................12
4.2. Stand .......................................................................................................................................12
4.3. Forest region ...........................................................................................................................14
4.4. Range ......................................................................................................................................17
5. DISCUSSION ............................................................................................................................19
5.1. Tree .........................................................................................................................................19
5.2. Stand .......................................................................................................................................21
5.3. Forest region ...........................................................................................................................23
5.4. Range ......................................................................................................................................28
6. CONCLUSION ..........................................................................................................................33

vi
7. REFERENCES ..........................................................................................................................35

vii
LIST OF TABLES
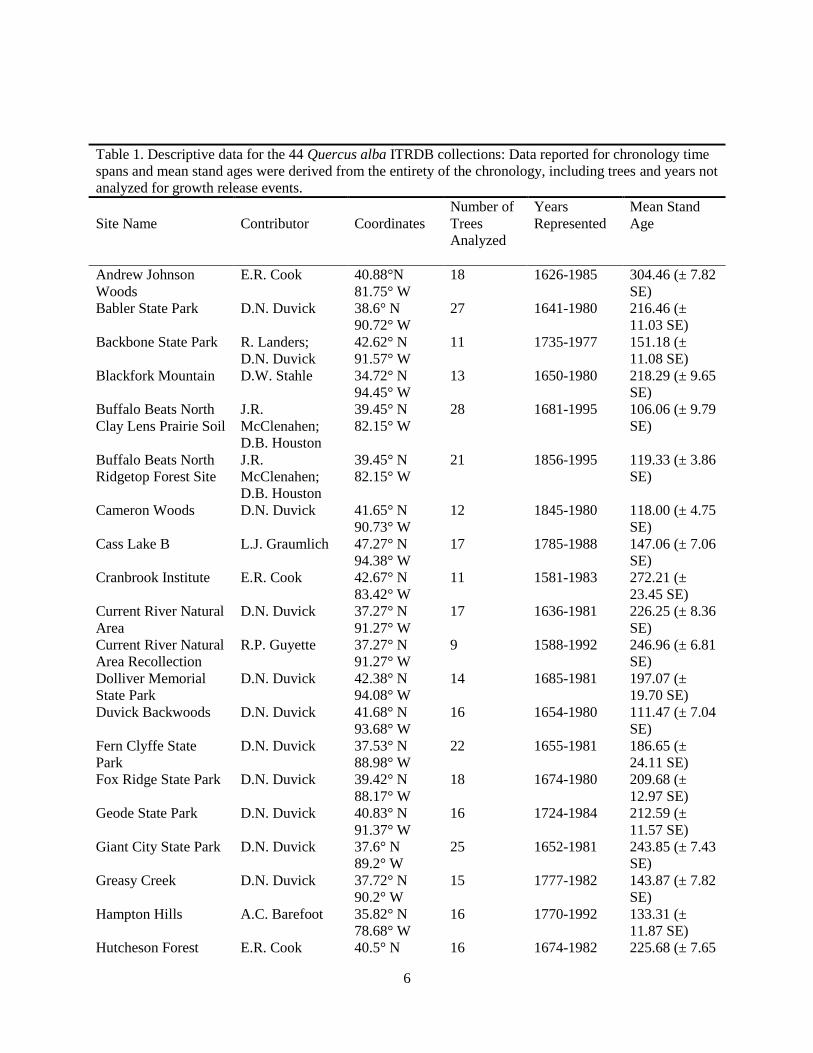
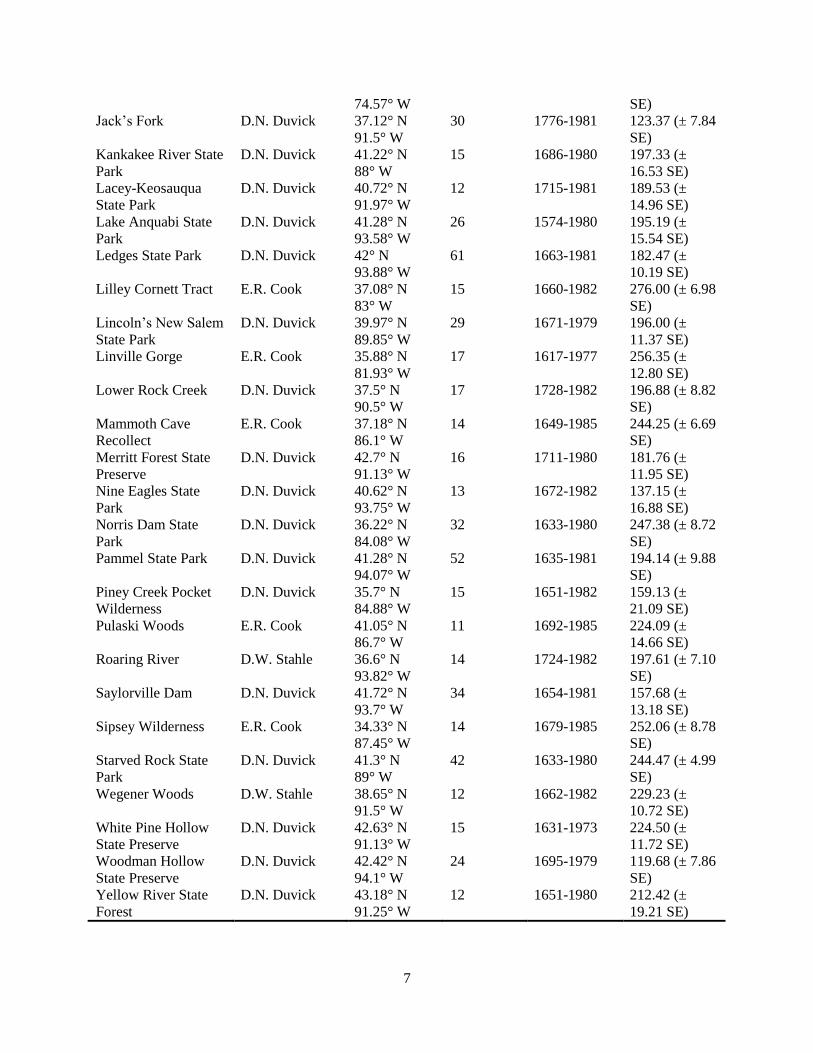
1. Descriptive data for the 44 Quercus alba ITRDB collections ...................................................6
2. Release characteristics for the 44 Quercus alba ITRDB collections .......................................13
3. Descriptive data and release characteristics for the four forest regions ...................................15

viii
LIST OF FIGURES
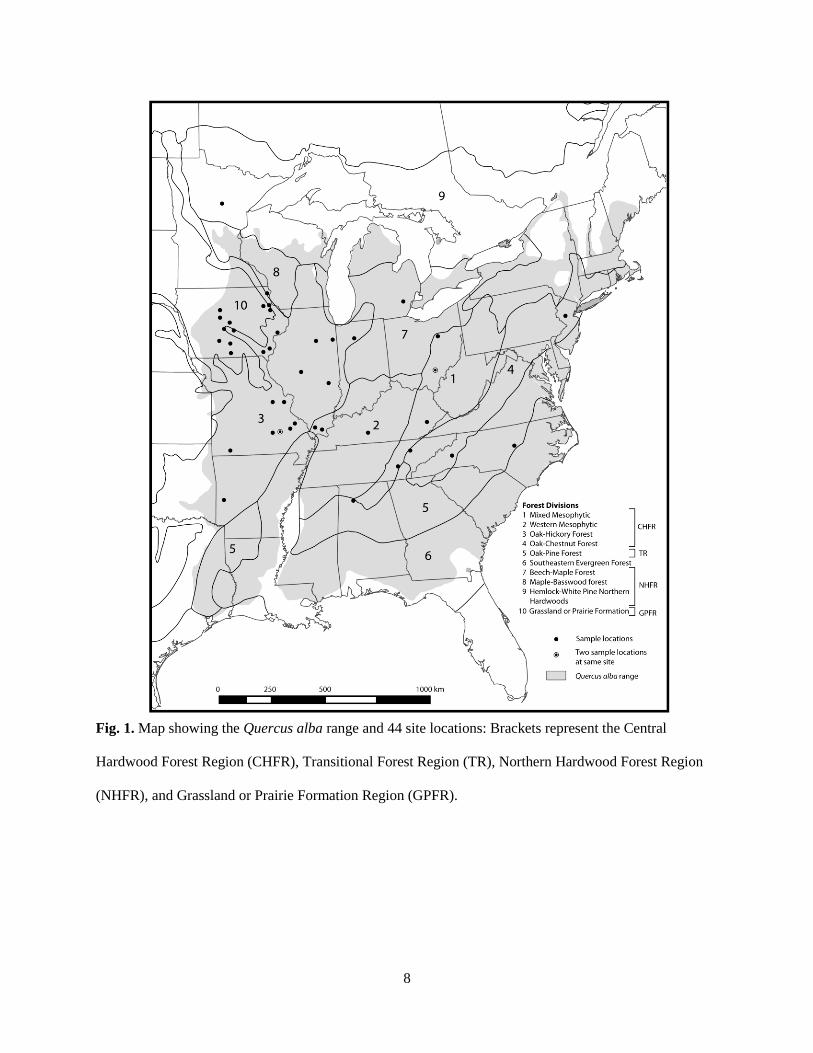
1. Map showing the Quercus alba range and 44 site locations .....................................................8
2. Establishment frequency, release frequency, and sample depth of the four forest regions .....16
3. The release frequency and dates from the 44 Quercus alba ITRDB collections .....................18
4. Establishment frequency, release frequency, and sample depth for the 44 sites ....................29

1
1. Introduction
Throughout much of the Holocene epoch, Quercus species have dominated forests in the
eastern United States (Abrams, 1992; Abrams, 2002; McWilliams et al., 2002). The importance
of the genus has been widely documented throughout a variety of forest regions and site types.
However, many forest regions historically dominated by Quercus species have undergone recent
shifts in composition in which the importance of Quercus, especially Quercus alba L., is
declining (Abrams, 2003). Throughout the East, Quercus species have exhibited an apparent
regeneration failure concomitant with increased density of more mesic, shade-tolerant species
such as Fagus grandifolia Ehrh., Acer saccharum Marsh., and Acer rubrum L. throughout all
size classes (Lorimer, 1984; Abrams et al., 1995; McCarthy and Bailey, 1996; McEwan et al.,
2010). In light of this widespread successional shift, a broad-scale analysis of historical Quercus
forest dynamics is warranted.
Long-term oscillations in canopy disturbance characteristics such as frequency,
magnitude, and spatial extent, impart lasting legacies upon forest composition, structure, and
successional trajectories. Since the onset of European settlement, increased land-use intensity
and spatial extent have drastically altered the disturbance regime dynamics occurring in Quercus
forests (Foster et al., 1998, 2002; Abrams, 2003). Low magnitude disturbance regimes such as
surface fires and windthrow events have been documented to support the historical dominance of
Quercus species, especially Quercus alba (Abrams, 2003). However, the frequency, magnitude,
and extent of disturbance such as these have been altered since the onset of European settlement;
in particular, direct and indirect anthropogenic impacts during the late 19th
and early 20th

2
Centuries have imparted changes in forest composition, structure, and disturbance throughout the
eastern US (Foster et al., 1998; Abrams, 2003).
Numerous local-scale canopy disturbance reconstructions throughout the region have
been conducted and have empirically identified mechanisms that have historically maintained
Quercus dominance as well as mechanisms that favor the recruitment and regeneration of mesic
taxa (e.g. Nowacki and Abrams, 1994; Abrams et al., 1995; Goebel and Hix, 1997; Rentch et al.,
2002). However, the broad-scale effects of disturbance regime variability remain largely
uninvestigated. My study fills this void with an analysis of Q. alba tree-ring chronologies from
many of the remaining old-growth stands located throughout the species’ range. As the
distributional range of Q. alba encompasses the entirety of the eastern US, the historical
disturbance regime characteristics uncovered through analysis of the old-growth Q. alba tree-
ring record are representative not only of the disturbance dynamics occurring in old-growth Q.
alba stands, but also of all eastern Quercus forests. Comparisons of disturbance characteristics
between the four forest regions within the Q. alba range (Northern Hardwood Forest Region,
Central Hardwood Forest Region, Transitional Forest Region, and Grassland or Prairie
Formation Region) also provided information regarding the spatial variability of disturbance
regimes.
For my research, I used Q. alba tree-ring chronologies to determine the long-term
dynamics of historical disturbance regimes throughout the eastern US. I chose to analyze Q.
alba because the species is a common component of hardwood forests in eastern North America
(Rogers, 1990; Abrams, 2003), the species (and genus) is commonly used to reconstruct stand
disturbance histories (Nowacki and Abrams, 1997; Rubino and McCarthy, 2000; Hart and
3
Grissino-Mayer, 2008; Hart et al., 2008), and the International Tree Ring Data Bank (ITRDB;
Grissino-Mayer and Fritts, 1996) contains chronologies located throughout the species’ range.
The ultimate goal of my research was to develop a broad-scale, long-term understanding
regarding Quercus forest dynamics in the eastern US. The specific objectives of this study were
to: (1) construct an old-growth Q. alba disturbance chronology from the identification of release
events using the ten-year running mean method; (2) determine the release characteristics (i.e.
release frequency, mean releases tree-1
century-1
, mean disturbance return interval, stand-wide
disturbance frequency, and a ratio of sample size to releases) for each site and forest region; (3)
identify range-wide and regional disturbance regime patterns and develop a mechanistic
understanding of the causal factors (e.g. stand age, land-use history, atmospheric disturbance
frequency, and Castanea dentata March. decline). The results of my research provided a long-
term, broad-scale perspective of the disturbance regime dynamics in old-growth Q. alba stands.
The results from these stands can be scaled-up to the region level as the sites are representative
of the environmental conditions and disturbance characteristics that existed throughout the
region during the past ca. 400 years. Furthermore, the long-term disturbance characteristics
identified in my study provide practical information to land management agencies aiming to
maintain Quercus importance via the imitation of historical disturbance regimes.
4
2. Quercus alba
Quercus alba is a common component to every major forest type throughout the US
eastern deciduous forest (Abrams, 2003). Throughout the East, the species is commonly
associated with other Quercus species and Carya species and reaches peak dominance in the
oak-hickory and oak-pine forest types (Braun, 1950). Quercus alba flowers and disseminates
pollen in the spring whereas acorns reach the ground and germinate in the fall (Rogers, 1990).
Acorn production is irregular and good acorn crops generally occur every four to ten years (an
occurrence largely dependent on spring temperature fluxes; Rogers, 1990). Sexual maturity for
the species is size-dependent but commonly occurs in closed-canopy forests when individuals are
over 40 years of age (Rogers, 1990). Quercus alba is considered moderately shade tolerant and
has several morphological and physiological adaptations that allow the species to tolerate fire
and drought (e.g. thick bark, deep rooting, wound compartmentalization, sprouting ability, high
stomatal density; Rogers, 1990; Abrams, 2003). The species exhibits slower growth rates than
other Quercus species common to eastern deciduous forests (e.g. Quercus prinus L., Quercus
rubra L.); a factor that has possibly contributed to the decline of the species in recent decades
(Abrams, 2003). Therefore, in deeply shaded understory positions, the slow-growing Q. alba is
often overtopped by competitors (Braun, 1950; Abrams, 2003). As a result of these
phenological, morphological, and physiological characteristics, Q. alba generally does best in
areas with low magnitude disturbance regimes, including surface fires, and gap-phase
regeneration (Abrams, 2003).
5
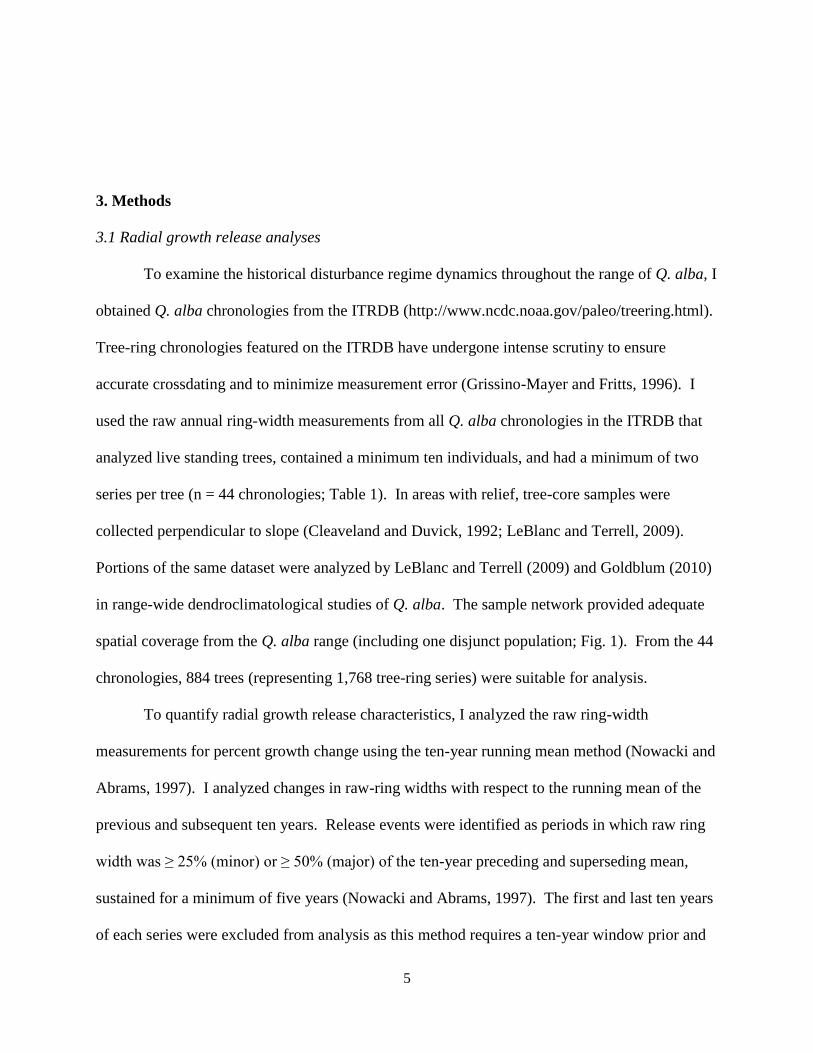
3. Methods
3.1 Radial growth release analyses
To examine the historical disturbance regime dynamics throughout the range of Q. alba, I
obtained Q. alba chronologies from the ITRDB (http://www.ncdc.noaa.gov/paleo/treering.html).
Tree-ring chronologies featured on the ITRDB have undergone intense scrutiny to ensure
accurate crossdating and to minimize measurement error (Grissino-Mayer and Fritts, 1996). I
used the raw annual ring-width measurements from all Q. alba chronologies in the ITRDB that
analyzed live standing trees, contained a minimum ten individuals, and had a minimum of two
series per tree (n = 44 chronologies; Table 1). In areas with relief, tree-core samples were
collected perpendicular to slope (Cleaveland and Duvick, 1992; LeBlanc and Terrell, 2009).
Portions of the same dataset were analyzed by LeBlanc and Terrell (2009) and Goldblum (2010)
in range-wide dendroclimatological studies of Q. alba. The sample network provided adequate
spatial coverage from the Q. alba range (including one disjunct population; Fig. 1). From the 44
chronologies, 884 trees (representing 1,768 tree-ring series) were suitable for analysis.
To quantify radial growth release characteristics, I analyzed the raw ring-width
measurements for percent growth change using the ten-year running mean method (Nowacki and
Abrams, 1997). I analyzed changes in raw-ring widths with respect to the running mean of the
previous and subsequent ten years. Release events were identified as periods in which raw ring
width was ≥ 25% (minor) or ≥ 50% (major) of the ten-year preceding and superseding mean,
sustained for a minimum of five years (Nowacki and Abrams, 1997). The first and last ten years
of each series were excluded from analysis as this method requires a ten-year window prior and
6
Table 1. Descriptive data for the 44 Quercus alba ITRDB collections: Data reported for chronology time
spans and mean stand ages were derived from the entirety of the chronology, including trees and years not
analyzed for growth release events.
Site Name
Contributor
Coordinates
Number of
Trees
Analyzed
Years
Represented
Mean Stand
Age
Andrew Johnson
Woods
E.R. Cook 40.88°N
81.75° W
18 1626-1985 304.46 (± 7.82
SE)
Babler State Park D.N. Duvick 38.6° N
90.72° W
27 1641-1980 216.46 (±
11.03 SE)
Backbone State Park R. Landers;
D.N. Duvick
42.62° N
91.57° W
11 1735-1977 151.18 (±
11.08 SE)
Blackfork Mountain D.W. Stahle 34.72° N
94.45° W
13 1650-1980 218.29 (± 9.65
SE)
Buffalo Beats North
Clay Lens Prairie Soil
J.R.
McClenahen;
D.B. Houston
39.45° N
82.15° W
28 1681-1995 106.06 (± 9.79
SE)
Buffalo Beats North
Ridgetop Forest Site
J.R.
McClenahen;
D.B. Houston
39.45° N
82.15° W
21 1856-1995 119.33 (± 3.86
SE)
Cameron Woods D.N. Duvick 41.65° N
90.73° W
12 1845-1980 118.00 (± 4.75
SE)
Cass Lake B L.J. Graumlich 47.27° N
94.38° W
17 1785-1988 147.06 (± 7.06
SE)
Cranbrook Institute E.R. Cook 42.67° N
83.42° W
11 1581-1983 272.21 (±
23.45 SE)
Current River Natural
Area
D.N. Duvick 37.27° N
91.27° W
17 1636-1981 226.25 (± 8.36
SE)
Current River Natural
Area Recollection
R.P. Guyette 37.27° N
91.27° W
9 1588-1992 246.96 (± 6.81
SE)
Dolliver Memorial
State Park
D.N. Duvick 42.38° N
94.08° W
14 1685-1981 197.07 (±
19.70 SE)
Duvick Backwoods D.N. Duvick 41.68° N
93.68° W
16 1654-1980 111.47 (± 7.04
SE)
Fern Clyffe State
Park
D.N. Duvick 37.53° N
88.98° W
22 1655-1981 186.65 (±
24.11 SE)
Fox Ridge State Park D.N. Duvick 39.42° N
88.17° W
18 1674-1980 209.68 (±
12.97 SE)
Geode State Park D.N. Duvick 40.83° N
91.37° W
16 1724-1984 212.59 (±
11.57 SE)
Giant City State Park D.N. Duvick 37.6° N
89.2° W
25 1652-1981 243.85 (± 7.43
SE)
Greasy Creek D.N. Duvick 37.72° N
90.2° W
15 1777-1982 143.87 (± 7.82
SE)
Hampton Hills A.C. Barefoot 35.82° N
78.68° W
16 1770-1992 133.31 (±
11.87 SE)
Hutcheson Forest E.R. Cook 40.5° N 16 1674-1982 225.68 (± 7.65
7
74.57° W SE)
Jack’s Fork D.N. Duvick 37.12° N
91.5° W
30 1776-1981 123.37 (± 7.84
SE)
Kankakee River State
Park
D.N. Duvick 41.22° N
88° W
15 1686-1980 197.33 (±
16.53 SE)
Lacey-Keosauqua
State Park
D.N. Duvick 40.72° N
91.97° W
12 1715-1981 189.53 (±
14.96 SE)
Lake Anquabi State
Park
D.N. Duvick 41.28° N
93.58° W
26 1574-1980 195.19 (±
15.54 SE)
Ledges State Park D.N. Duvick 42° N
93.88° W
61 1663-1981 182.47 (±
10.19 SE)
Lilley Cornett Tract E.R. Cook 37.08° N
83° W
15 1660-1982 276.00 (± 6.98
SE)
Lincoln’s New Salem
State Park
D.N. Duvick 39.97° N
89.85° W
29 1671-1979 196.00 (±
11.37 SE)
Linville Gorge E.R. Cook 35.88° N
81.93° W
17 1617-1977 256.35 (±
12.80 SE)
Lower Rock Creek D.N. Duvick 37.5° N
90.5° W
17 1728-1982 196.88 (± 8.82
SE)
Mammoth Cave
Recollect
E.R. Cook 37.18° N
86.1° W
14 1649-1985 244.25 (± 6.69
SE)
Merritt Forest State
Preserve
D.N. Duvick 42.7° N
91.13° W
16 1711-1980 181.76 (±
11.95 SE)
Nine Eagles State
Park
D.N. Duvick 40.62° N
93.75° W
13 1672-1982 137.15 (±
16.88 SE)
Norris Dam State
Park
D.N. Duvick 36.22° N
84.08° W
32 1633-1980 247.38 (± 8.72
SE)
Pammel State Park D.N. Duvick 41.28° N
94.07° W
52 1635-1981 194.14 (± 9.88
SE)
Piney Creek Pocket
Wilderness
D.N. Duvick 35.7° N
84.88° W
15 1651-1982 159.13 (±
21.09 SE)
Pulaski Woods E.R. Cook 41.05° N
86.7° W
11 1692-1985 224.09 (±
14.66 SE)
Roaring River D.W. Stahle 36.6° N
93.82° W
14 1724-1982 197.61 (± 7.10
SE)
Saylorville Dam D.N. Duvick 41.72° N
93.7° W
34 1654-1981 157.68 (±
13.18 SE)
Sipsey Wilderness E.R. Cook 34.33° N
87.45° W
14 1679-1985 252.06 (± 8.78
SE)
Starved Rock State
Park
D.N. Duvick 41.3° N
89° W
42 1633-1980 244.47 (± 4.99
SE)
Wegener Woods D.W. Stahle 38.65° N
91.5° W
12 1662-1982 229.23 (±
10.72 SE)
White Pine Hollow
State Preserve
D.N. Duvick 42.63° N
91.13° W
15 1631-1973 224.50 (±
11.72 SE)
Woodman Hollow
State Preserve
D.N. Duvick 42.42° N
94.1° W
24 1695-1979 119.68 (± 7.86
SE)
Yellow River State
Forest
D.N. Duvick 43.18° N
91.25° W
12 1651-1980 212.42 (±
19.21 SE)
8
Fig. 1. Map showing the Quercus alba range and 44 site locations: Brackets represent the Central
Hardwood Forest Region (CHFR), Transitional Forest Region (TR), Northern Hardwood Forest Region
(NHFR), and Grassland or Prairie Formation Region (GPFR).

9
subsequent to each individual growth ring analyzed. Though a myriad of release identification
methods exist (Rubino and McCarthy, 2004), I selected these specific criteria as they were
developed using overstory Quercus species in complex-stage stands of eastern North America
and have been empirically tested and verified (Nowacki and Abrams, 1997; Rentch et al., 2002,
2003). Furthermore, I chose a release duration criterion that was more conservative than many
used in disturbance reconstructions in the eastern US (e.g. Schwartz and Hermann, 1999; Hart et
al., 2008; Hart and Grissino-Mayer, 2009) to only capture the high magnitude disturbance events
that create large canopy gaps in which growing space and resource availability are heightened for
a minimum of five years. Establishment of woody species is often limited to the 1–5 years
following canopy gap creation (Canham and Marks, 1985) and species density within gaps often
peaks between gap ages of 7–12 years (Runkle, 1982). These longer-lasting canopy gaps,
represented by the longer duration criterion, are indicative of relatively large canopy disturbance
events and provide a greater potential for new species to establish and therefore directly alter
successional trajectories (Runkle, 1982; Clinton et al., 1994; Hart and Grissino-Mayer, 2009).
I used the ten-year running mean method to identify releases in both of the paired tree-
ring series from all 844 individuals. Contemporaneous releases occurring in both of the paired
series were counted as a single release event. I used a five-year threshold to identify releases
recorded in both of the paired series as resulting from the same disturbance event (i.e. intra-tree
releases exhibiting an initiation lag-time of five years or less were considered simultaneous).
Release detection analyses were performed on both of the paired tree-ring series as to avoid the
underrepresentation of release events associated with the analysis of only a single increment core
per tree (Buchanan and Hart, in press). The release frequency of all individuals was then totaled
to construct canopy disturbance chronologies at the stand- and forest region-levels. I analyzed
10
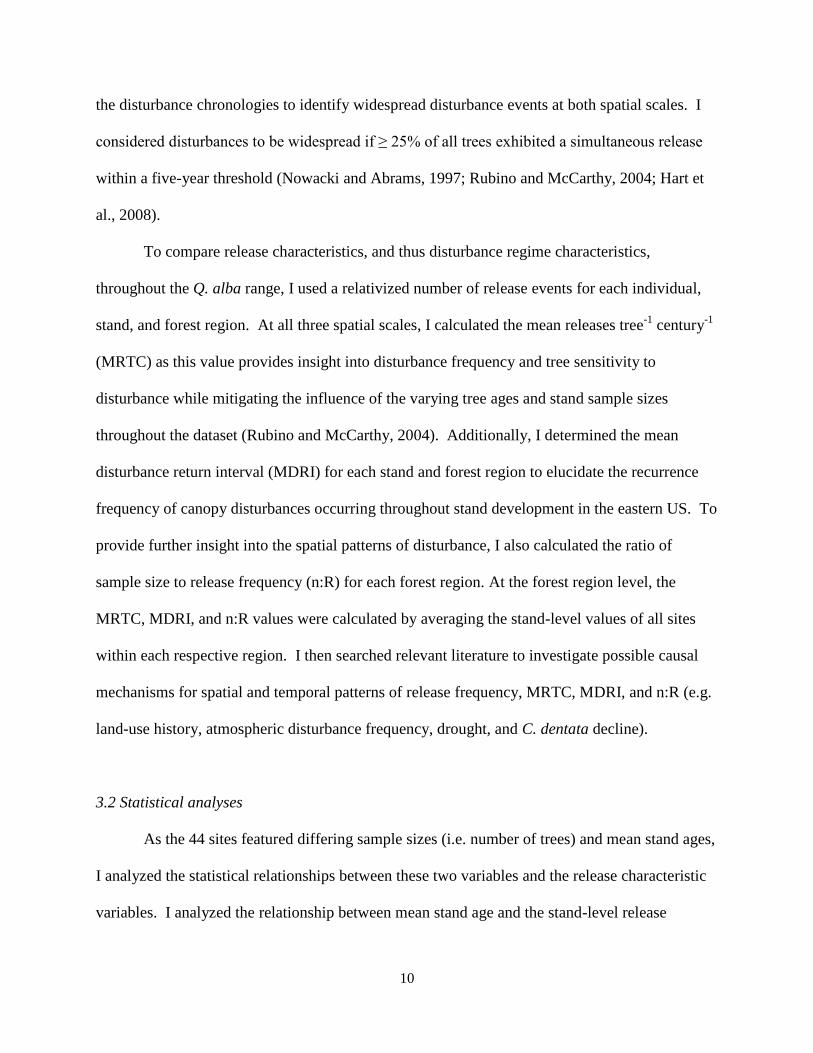
the disturbance chronologies to identify widespread disturbance events at both spatial scales. I
considered disturbances to be widespread if ≥ 25% of all trees exhibited a simultaneous release
within a five-year threshold (Nowacki and Abrams, 1997; Rubino and McCarthy, 2004; Hart et
al., 2008).
To compare release characteristics, and thus disturbance regime characteristics,
throughout the Q. alba range, I used a relativized number of release events for each individual,
stand, and forest region. At all three spatial scales, I calculated the mean releases tree-1
century-1
(MRTC) as this value provides insight into disturbance frequency and tree sensitivity to
disturbance while mitigating the influence of the varying tree ages and stand sample sizes
throughout the dataset (Rubino and McCarthy, 2004). Additionally, I determined the mean
disturbance return interval (MDRI) for each stand and forest region to elucidate the recurrence
frequency of canopy disturbances occurring throughout stand development in the eastern US. To
provide further insight into the spatial patterns of disturbance, I also calculated the ratio of
sample size to release frequency (n:R) for each forest region. At the forest region level, the
MRTC, MDRI, and n:R values were calculated by averaging the stand-level values of all sites
within each respective region. I then searched relevant literature to investigate possible causal
mechanisms for spatial and temporal patterns of release frequency, MRTC, MDRI, and n:R (e.g.
land-use history, atmospheric disturbance frequency, drought, and C. dentata decline).
3.2 Statistical analyses
As the 44 sites featured differing sample sizes (i.e. number of trees) and mean stand ages,
I analyzed the statistical relationships between these two variables and the release characteristic
variables. I analyzed the relationship between mean stand age and the stand-level release

11
frequency, MRTC, and MDRI using Pearson correlation analysis in SAS 9.1. Similarly, I used
Pearson correlation analysis to determine the relationship between stand sample size and stand-
level release frequency, MRTC, and MDRI. At the forest region level, I used ANOVA to
compare the variance in mean age, sample size, MRTC, and MDRI values between the four
forest regions. I used stand-level values for this analysis (i.e. the Northern Hardwood Region
had 3 data entries for each parameter, the Central Hardwood Region had 29 entries, the
Transitional Region had 2 entries, and the Grassland or Prairie Region had 10 data entries).
12
4. Results
4.1 Tree
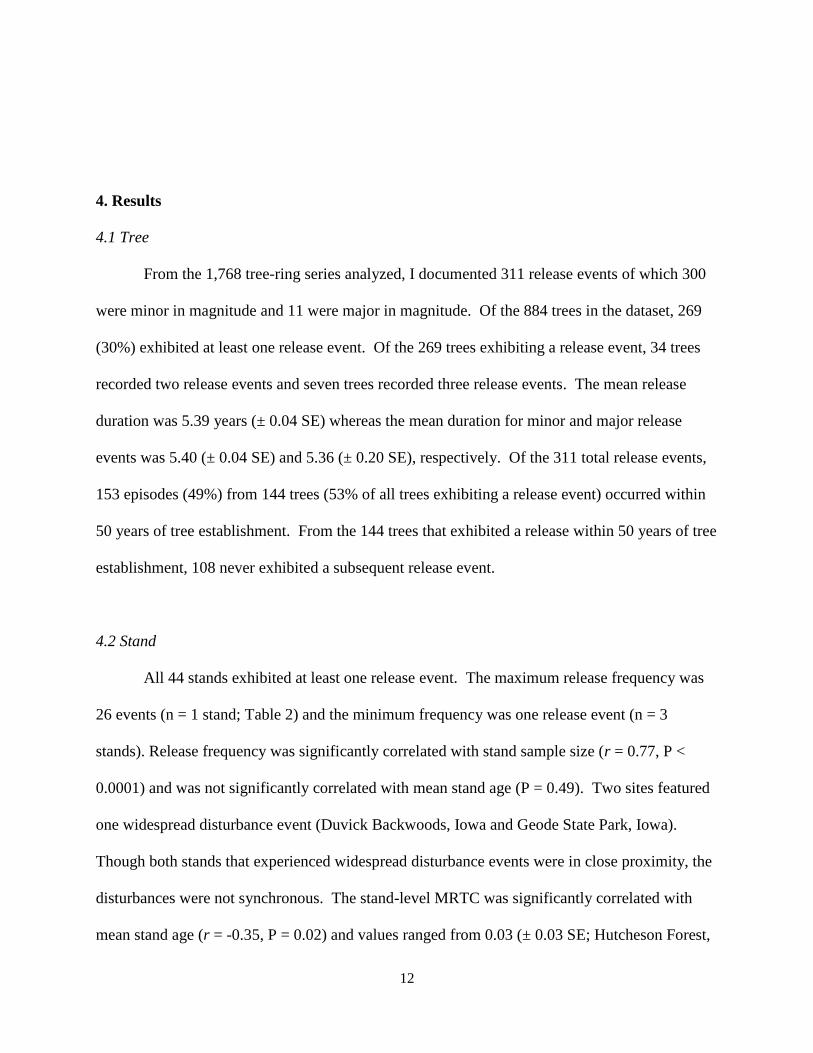
From the 1,768 tree-ring series analyzed, I documented 311 release events of which 300
were minor in magnitude and 11 were major in magnitude. Of the 884 trees in the dataset, 269
(30%) exhibited at least one release event. Of the 269 trees exhibiting a release event, 34 trees
recorded two release events and seven trees recorded three release events. The mean release
duration was 5.39 years (± 0.04 SE) whereas the mean duration for minor and major release
events was 5.40 (± 0.04 SE) and 5.36 (± 0.20 SE), respectively. Of the 311 total release events,
153 episodes (49%) from 144 trees (53% of all trees exhibiting a release event) occurred within
50 years of tree establishment. From the 144 trees that exhibited a release within 50 years of tree
establishment, 108 never exhibited a subsequent release event.
4.2 Stand
All 44 stands exhibited at least one release event. The maximum release frequency was
26 events (n = 1 stand; Table 2) and the minimum frequency was one release event (n = 3
stands). Release frequency was significantly correlated with stand sample size (r = 0.77, P <
0.0001) and was not significantly correlated with mean stand age (P = 0.49). Two sites featured
one widespread disturbance event (Duvick Backwoods, Iowa and Geode State Park, Iowa).
Though both stands that experienced widespread disturbance events were in close proximity, the
disturbances were not synchronous. The stand-level MRTC was significantly correlated with
mean stand age (r = -0.35, P = 0.02) and values ranged from 0.03 (± 0.03 SE; Hutcheson Forest,
13
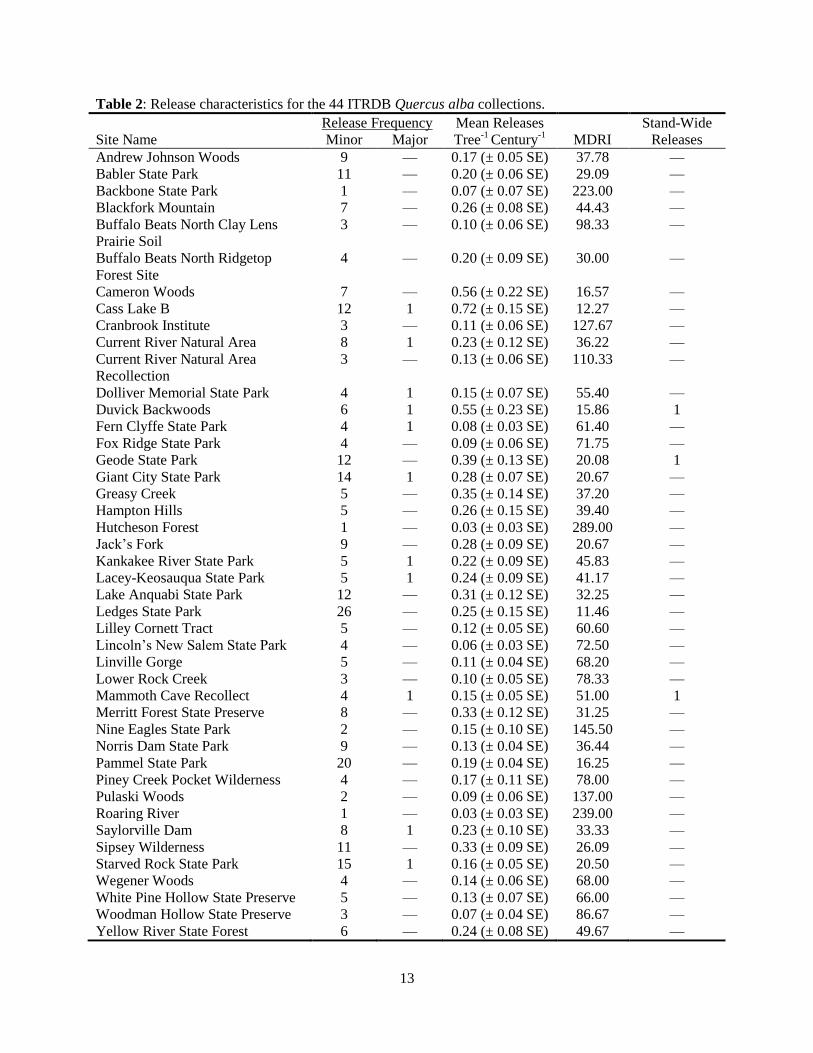
Table 2: Release characteristics for the 44 ITRDB Quercus alba collections.
Release Frequency Mean Releases Stand-Wide
Site Name Minor Major Tree-1
Century-1
MDRI Releases
Andrew Johnson Woods 9 — 0.17 (± 0.05 SE) 37.78 —
Babler State Park 11 — 0.20 (± 0.06 SE) 29.09 —
Backbone State Park 1 — 0.07 (± 0.07 SE) 223.00 —
Blackfork Mountain 7 — 0.26 (± 0.08 SE) 44.43 —
Buffalo Beats North Clay Lens
Prairie Soil
3 — 0.10 (± 0.06 SE) 98.33 —
Buffalo Beats North Ridgetop
Forest Site
4 — 0.20 (± 0.09 SE) 30.00 —
Cameron Woods 7 — 0.56 (± 0.22 SE) 16.57 —
Cass Lake B 12 1 0.72 (± 0.15 SE) 12.27 —
Cranbrook Institute 3 — 0.11 (± 0.06 SE) 127.67 —
Current River Natural Area 8 1 0.23 (± 0.12 SE) 36.22 —
Current River Natural Area
Recollection
3 — 0.13 (± 0.06 SE) 110.33 —
Dolliver Memorial State Park 4 1 0.15 (± 0.07 SE) 55.40 —
Duvick Backwoods 6 1 0.55 (± 0.23 SE) 15.86 1
Fern Clyffe State Park 4 1 0.08 (± 0.03 SE) 61.40 —
Fox Ridge State Park 4 — 0.09 (± 0.06 SE) 71.75 —
Geode State Park 12 — 0.39 (± 0.13 SE) 20.08 1
Giant City State Park 14 1 0.28 (± 0.07 SE) 20.67 —
Greasy Creek 5 — 0.35 (± 0.14 SE) 37.20 —
Hampton Hills 5 — 0.26 (± 0.15 SE) 39.40 —
Hutcheson Forest 1 — 0.03 (± 0.03 SE) 289.00 —
Jack’s Fork 9 — 0.28 (± 0.09 SE) 20.67 —
Kankakee River State Park 5 1 0.22 (± 0.09 SE) 45.83 —
Lacey-Keosauqua State Park 5 1 0.24 (± 0.09 SE) 41.17 —
Lake Anquabi State Park 12 — 0.31 (± 0.12 SE) 32.25 —
Ledges State Park 26 — 0.25 (± 0.15 SE) 11.46 —
Lilley Cornett Tract 5 — 0.12 (± 0.05 SE) 60.60 —
Lincoln’s New Salem State Park 4 — 0.06 (± 0.03 SE) 72.50 —
Linville Gorge 5 — 0.11 (± 0.04 SE) 68.20 —
Lower Rock Creek 3 — 0.10 (± 0.05 SE) 78.33 —
Mammoth Cave Recollect 4 1 0.15 (± 0.05 SE) 51.00 1
Merritt Forest State Preserve 8 — 0.33 (± 0.12 SE) 31.25 —
Nine Eagles State Park 2 — 0.15 (± 0.10 SE) 145.50 —
Norris Dam State Park 9 — 0.13 (± 0.04 SE) 36.44 —
Pammel State Park 20 — 0.19 (± 0.04 SE) 16.25 —
Piney Creek Pocket Wilderness 4 — 0.17 (± 0.11 SE) 78.00 —
Pulaski Woods 2 — 0.09 (± 0.06 SE) 137.00 —
Roaring River 1 — 0.03 (± 0.03 SE) 239.00 —
Saylorville Dam 8 1 0.23 (± 0.10 SE) 33.33 —
Sipsey Wilderness 11 — 0.33 (± 0.09 SE) 26.09 —
Starved Rock State Park 15 1 0.16 (± 0.05 SE) 20.50 —
Wegener Woods 4 — 0.14 (± 0.06 SE) 68.00 —
White Pine Hollow State Preserve 5 — 0.13 (± 0.07 SE) 66.00 —
Woodman Hollow State Preserve 3 — 0.07 (± 0.04 SE) 86.67 —
Yellow River State Forest 6 — 0.24 (± 0.08 SE) 49.67 —

14
New Jersey and Roaring River, Missouri) to 0.72 (± 0.15 SE; Cass Lake B, Minnesota). The
Hutcheson Forest collection also exhibited the highest MDRI (289.00 years) whereas the Cass
Lake B collection located in Minnesota featured the lowest MDRI (12.27 years). Stand-level
MDRI was significantly correlated with stand sample size (r = -0.34, P= 0.02).
4.3 Forest region
At the forest region-level, the Central Hardwood Forest Region exhibited the highest
release frequency (n = 227; Table 3) followed by the Grassland Prairie Formation Region (n =
51). The Transitional Forest Region exhibited the lowest release frequency (n = 16). The
Grassland or Prairie Region exhibited the lowest MRTC with a value of 0.18 (± 0.03 SE) and the
Northern Hardwood Region exhibited the highest MRTC with a value of 0.41 (± 0.30 SE). The
shortest MDRI occurred in the Transition Region (32.75 years) whereas the longest MDRI
occurred in the Northern Hardwood Forest Region (75.02 years). The Grassland or Prairie
Region n:R of 4.31:1 was the highest between the four regions. The Transitional Region
exhibited the lowest n:R with a ratio of 2.24:1. Importantly, neither mean stand age nor sample
size different significantly between the regions.
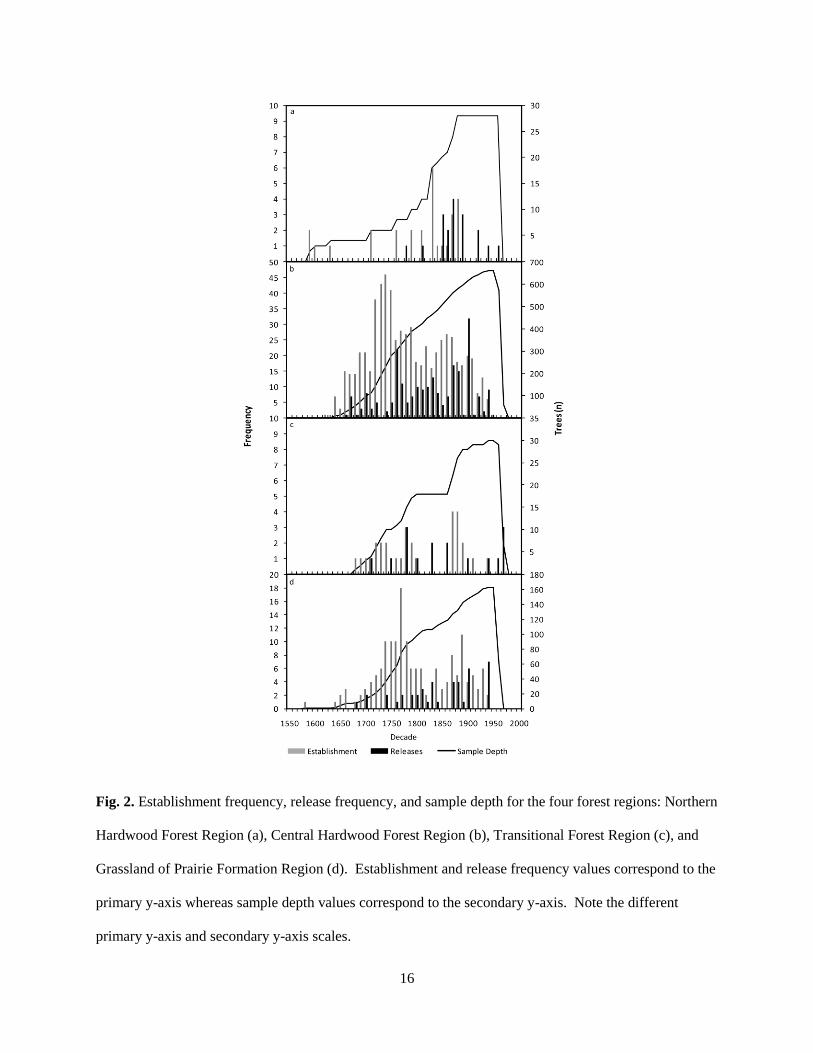
The Northern Hardwood Region experienced pulses in release frequency during the
1850s, 1870s, 1890s, and 1920s whereas establishment dates exhibited a pulse in the 1830s (Fig.
2). Release frequency in the Central Hardwood Region was highest in the 1760s and from 1870–
1889 and 1900–1909. Establishment in this region peaked from 1720–1759, 1770–1799, and
1850–1889. The Transitional Region experienced elevated release frequency values in the
1780s, 1830s, 1860s, and 1970s with the highest establishment rates during the 1780s and from
1870–1889. In the Grassland or Prairie Region, release frequency was highest from 1900–1909
15
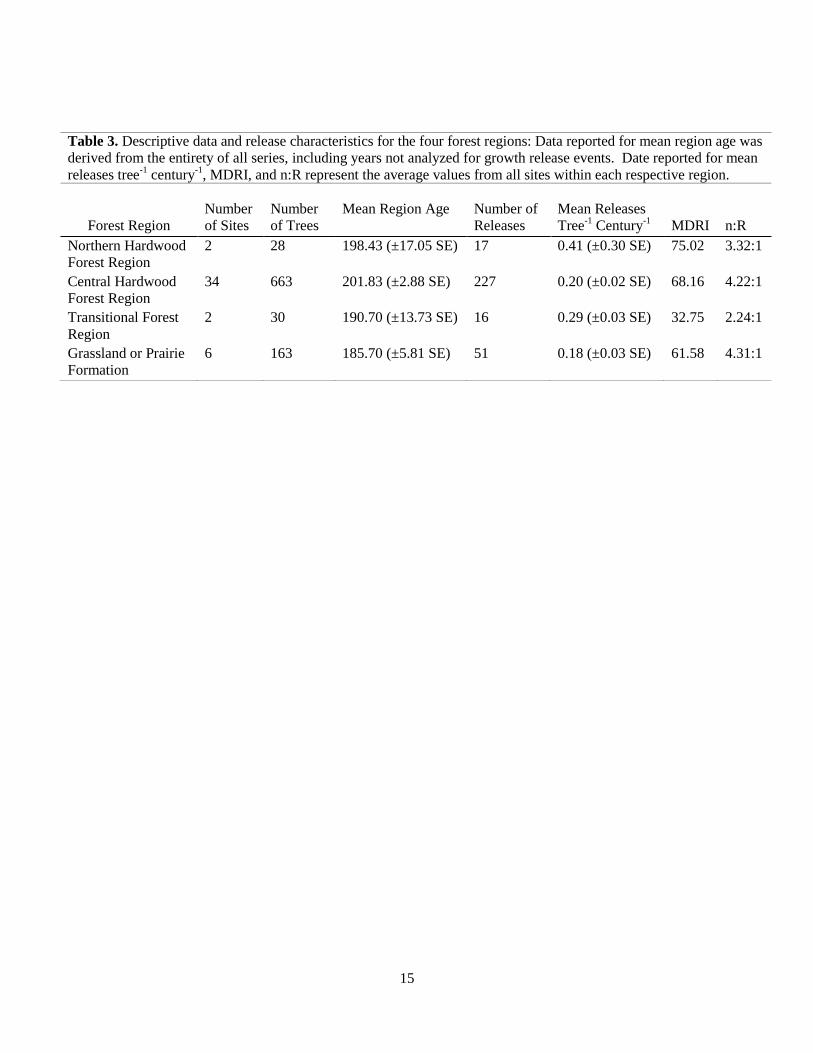
Table 3. Descriptive data and release characteristics for the four forest regions: Data reported for mean region age was
derived from the entirety of all series, including years not analyzed for growth release events. Date reported for mean
releases tree-1
century-1
, MDRI, and n:R represent the average values from all sites within each respective region.
Forest Region
Number
of Sites
Number
of Trees
Mean Region Age
Number of
Releases
Mean Releases
Tree-1
Century-1
MDRI
n:R
Northern Hardwood
Forest Region
2 28 198.43 (±17.05 SE) 17 0.41 (±0.30 SE) 75.02 3.32:1
Central Hardwood
Forest Region
34 663 201.83 (±2.88 SE) 227 0.20 (±0.02 SE) 68.16 4.22:1
Transitional Forest
Region
2 30 190.70 (±13.73 SE) 16 0.29 (±0.03 SE) 32.75 2.24:1
Grassland or Prairie
Formation
6 163 185.70 (±5.81 SE) 51 0.18 (±0.03 SE) 61.58 4.31:1
16
Fig. 2. Establishment frequency, release frequency, and sample depth for the four forest regions: Northern
Hardwood Forest Region (a), Central Hardwood Forest Region (b), Transitional Forest Region (c), and
Grassland of Prairie Formation Region (d). Establishment and release frequency values correspond to the
primary y-axis whereas sample depth values correspond to the secondary y-axis. Note the different
primary y-axis and secondary y-axis scales.

17
and during the 1940s whereas tree establishment peaked during 1740–1789 and subsequently
during the 1870s and 1890s.
4.4 Range
At the range level, the release record extended from 1584 to 1985. Range-wide release
frequency exhibited peak values during the 1760s, 1830s, 1870s, 1900s, and 1940s (Fig. 3).
Range-wide establishment dates were highest during a period from 1720–1799 and exhibited a
subsequent pulse of lesser magnitude from 1840–1919. A relatively constant level of
―background‖ establishment existed from ca. 1690 to 1939. Similarly, a constant level of
―background‖ release frequency occurred from ca. 1700–1900.

18
Fig. 3. The release frequency and dates from the 44 Quercus alba ITRDB collections: Each horizontal
line represents the record for one site. The site name abbreviation and corresponding forest region are
given to the right of the horizontal line. Long vertical bars indicate release events and short vertical bars
indicate release duration. The thinnest vertical bars indicate one tree exhibiting a release, the intermediate
vertical bars represent two trees exhibiting a release, and the thickest vertical bars indicate three or more
trees exhibiting a release event. A composite of all release events is shown across the bottom of the graph
and the range-wide sample depth is shown across the top.
19
5. Discussion
5.1 Tree
Radial growth release events recorded in the tree-ring record provide information
regarding historical disturbance regimes at fine spatial and temporal resolution. For my study, I
aimed to analyze only the high magnitude disturbance events that occurred during stand
development in old-growth Q. alba stands located throughout the eastern US. Such disturbance
events, whether exogenous or endogenous, generally create larger voids in the canopy
subsequent to tree removal (Oliver and Larson, 1996). For this study, these larger canopy gaps
are indicative of at least 35–40% of the canopy of the released tree being exposed to increased
sunlight for a minimum of five years (Nowacki and Abrams, 1997; Rentch et al., 2002). Larger
canopy gaps remain on the landscape for longer periods and thus have an enhanced potential to
allow increased species recruitment thereby directly altering successional trajectories (Runkle,
1982; Clinton et al., 1994; Hart and Grissino-Mayer, 2009). Additionally, the five-year duration
threshold coincides with the general length of time species establishment occurs within canopy
gaps subsequent to disturbance (Canham and Marks, 1985). Furthermore, canopy gaps have
been documented to exhibit peak species densities between gap ages of 7–12 years. As such, the
five-year duration criterion (i.e. minimum gap age threshold) successfully captures only the
canopy gaps that allow significant levels of species recruitment. As a result of the conservative
duration criterion, the total release frequency (i.e. disturbance frequency) throughout the 44 Q.
alba was relatively low (n = 311 events throughout the Q. alba range from 1574 to 1985). Had a
more liberal duration criterion been used (e.g. four years), the release frequency would have
20
more than doubled and thereby potentially masked region- and range-wide patterns of high
magnitude disturbances. As the mean release duration value of 5.39 (± 0.04 SE) only minimally
exceeds the five-year criterion, I am confident that only high magnitude disturbance events that
greatly influence stand dynamics were analyzed.
Interestingly, 144 (54%) of the 269 trees exhibiting release events featured a release
episode within 50 years of tree establishment. I hypothesize that this early-onset of release
episodes, and thus of canopy disturbances, corresponds to stand self-thinning. Self-thinning has
been documented in eastern Quercus forests to occur ca. 40 years post-stand establishment (Hart
and Grissino-Mayer, 2008; Hart et al., 2011). At this time, the self-thinning process becomes
discernable the tree-ring record as the high frequency of mortality exerts a relatively strong
influence on the productivity of remnant individuals. Self-thinning occurs several decades after
a stand-initiating disturbance event. During this phase of stand development, new individuals
are prevented from successfully establishing underneath a dense, closed canopy and the
increasing diameter of the even-aged stand causes many existing individuals die because of
limited growing space (Oliver and Larson, 1996; Zeide 2010). In this study, the death of existing
individuals ca. 40–50 years after the respective stand establishment dates provides evidence of
the self-thinning process. I therefore speculate that stand-replacing disturbance events have
occurred in a majority of the old-growth Q. alba stands in this dataset. However, as the gaps
created by the death of 50-year old individuals are not large, other disturbance agents were likely
operating simultaneously to produce this trend.
21
5.2 Stand
Release frequency at the stand scale ranged from a single event to 26 canopy disturbances
occurring at one site (Ledges State Park, Iowa). The three sites that exhibited only one release
event (Backbone State Park, Iowa; Hutcheson Forest, New Jersey; and Roaring River, Missouri)
featured sample sizes below the mean sample size of 20.09 trees (n = 11, 16, and 14,
respectively). As release frequency was positively correlated with sample size, it is possible the
low release frequency is an artifact of the number of trees sampled. However, numerous sites
exhibited multiple release events despite small sample sizes (e.g. Cameron Woods, Iowa
exhibited seven release events from 12 sampled trees). Therefore, the low release frequency
exhibited at these sites could possibly be the result of a spatially-restricted sampling scheme in
which sampled trees were located within a relatively small geographic area possessing site-
specific factors that made the sampled stands less susceptible to disturbance and/or the trees less
likely to record disturbance in radial growth patterns (e.g. mesic conditions, protected slope
position). Ledges State Park, Iowa featured the maximum release frequency of 26 events and
also exhibited the largest sample size (n = 61 trees). Similar to the collections with the lowest
release frequency, the high frequency value could be an artifact of the large sample size.
However, the site’s 0.25 MRTC value, a parameter that mitigates the influences of sample size,
was within the upper 30% of all sites. Therefore, I again speculate that site-specific factors
likely rendered the stand more susceptible to disturbance and the trees more likely to record the
events (e.g. ridgetop position, west-facing slopes, shallow soils). Indeed, Ledges State Park
features dissected topography with canyons and bluffs creating many ridgetop and upper-slope
positions in which trees are more exposed to strong wind events (Johnson-Groh, 1985; Johnson-
Groh and Farrar, 1985).

22
The only two stands that exhibited widespread release events were Duvick Backwoods,
Iowa and Geode State Park, Iowa. Interestingly, the tree-ring record at both sites was derived
from 16 trees, a sample size below the range-wide mean. Therefore, although release frequency
and sample size were positively correlated, the only two instances of widespread disturbance
occurred in stands with relatively low sample sizes.
The two stands with the lowest MRTC values (Hutcheson Forest, New Jersey and
Roaring River, Missouri) both exhibited only a single release event and thus the low MRTC
values are expected. Cass Lake B, Minnesota exhibited the highest MRTC value of 0.72 (i.e. a
given tree exhibits a release event every ca. 139 years). The Cass Lake B mean stand age was
147.06 years (± 7.06 SE), an age below the range-wide mean stand age of 178.37 (± 2.52 SE).
Cass Lake B also featured the shortest MDRI and a relatively high frequency of release events (n
= 12). The site is located just outside of the northwest boundary of the Q. alba range; an area in
which Q. alba individuals have documented mean sensitivity values higher than those
throughout the remainder of the range (Sakulich et al., 2011). As the site is geographically
situated outside the contiguous range in which conditions are most favorable, the stand is likely
even more sensitive and susceptible to environmental variability (e.g. disturbance events,
drought) and individuals are more likely to respond to canopy fragmentation by increasing radial
growth (Fritts, 2001).
However, the maximum MRTC value exhibited at the Cass Lake B site is possibly an
artifact of mean stand age as the two factors exhibited a significant negative correlation.
Younger stands generally exhibited higher MRTC values as these stands have likely undergone
frequent endogenous canopy disturbances during the period of self-thinning (Oliver and Larson,
1996). When calculating the relativized MRTC value, only this elevated disturbance frequency
23
rate is captured. However, release frequency has been shown to decrease in older-aged stands as
these trees have reduced phenotypic plasticity and are therefore less likely to capitalize on
increased growing space and resource availability as evidenced by increased radial growth
(Nowacki and Abrams, 1997; Fritts, 2001; Hart et al., 2010). Therefore, younger stands may
exhibit exaggerated MRTC values as the release frequency rate has not yet declined with
increasing age. Nonetheless, this possible bias does not negate the likely relationship between
the high release frequency at Cass Lake B and its location being outside the contiguous Q. alba
range.
Similarly, the short MDRI values at Cass Lake B and other sites could be the result of
sample size as the variables were negatively correlated. The MDRI value is not relativized and
therefore introduces possible sample-size bias into the return-interval calculations. At the stand-
level, this bias is possibly amplified as sample sizes are inherently the lowest and also more
variable than at the forest-region scale.
5.3 Forest region
Analysis at the forest region-level allowed for the comparison of regional differences in
disturbance characteristics and the identification of spatial and temporal trends. The Northern
Hardwood Region exhibited the highest and second highest values in both of the relativized
disturbance parameters: MRTC and n:R, respectively. Conversely, the Central Hardwood
Region featured the second lowest MRTC value and n:R ratio. Therefore, although the Central
Hardwood Region exhibited the highest release frequency, the relativized factors revealed the
region experienced one of the lowest levels of disturbance. However, though the mean stand
24
sample sizes did not differ significantly between the regions, I acknowledge that the large range
in region sample size precludes statistically robust comparisons at the forest region level.
A host of factors likely contribute to the high level of disturbance in the Northern
Hardwood Region; factors that are not encountered in the other forest regions. The Northern
Hardwood Region occupies the northern extent of the Q. alba range and, as a result of this high
latitude and proximity to the polar jet stream, experiences an increased frequency of winter storm
events (Zishka and Smith, 1980). These frequent storm events, especially during winter months,
cause increased instances of windthrow at both fine and broad spatial scales (e.g. Foster, 1988;
Peterson and Pickett, 1991; Canham et al., 2001). Furthermore, the dominant species in the
region likely contribute to the increased rates of canopy disturbance. Both F. grandifolia and
Acer species occur at high densities throughout parts of the region (i.e. the Beech-Maple and
Maple-Basswood forest divisions). As these taxa are more shallow-rooted than the Quercus
species within the old-growth Q. alba stands, they are more vulnerable to drought, surface fire,
and uprooting from windthrow (Abrams, 1998). The evergreen species Tsuga canadensis (L.)
Carr. and Pinus strobus L. are also more abundant in the Northern Hardwood Region (i.e. the
Hemlock-White Pine Northern Hardwoods Forest district) than in the Central Hardwood Region.
These two species feature foliage year round and are therefore more susceptible to high wind
events during the winter season; indeed, T. canadensis windthrow has been documented as a
common occurrence in the region (Foster, 1988; Davis et al., 1996). Pinus strobus is also one of
the tallest trees in eastern North America and features soft wood making the species susceptible
to snapping (Foster, 1988). Furthermore, stands within the Northern Hardwood Forest Region
often experience snow and ice loading, both of which commonly cause stem and bole breakage
(Duguay et al., 2001).
25
Several temporal trends in release and establishment frequency were noted throughout all
four regions. Establishment frequency in the Central Hardwood Region exhibited a pulse from
1720–1759 and the Grassland of Prairie Formation Region exhibited a subsequent pulse in
establishment frequency from 1740–1789. Additionally, release frequency in the Central
Hardwood and Transitional Forest regions exhibited pulses in the 1760s and 1780s, respectively.
This multi-decadal period of significantly increased establishment and release frequency
coincides with period of drastically reduced Native American population density (ca. 1650–
1760; Ramenofsky, 1987). Native American populations throughout eastern North America
plummeted after introduction of infectious diseases (e.g. smallpox) from early European
colonizers (Ramenofsky, 1987; Denevan, 1992). This period of depopulation effectively caused
a cessation in Native American land-use practices throughout the East. Thus, in the century prior
to European settlement, reforestation occurred throughout much of the region, as evidenced by
both the high rates of establishment between 1720 and 1789. In the Central Hardwood and
Transitional Regions, the subsequent pulses in release frequency in the 1760s and 1780s,
respectively, likely represent self-thinning occurring in the recently established stands as this
process generally beings ca. 40 years after establishment (Hart and Grissino-Mayer, 2008). This
hypothesis is strengthened by the fact that 49% of all releases occurred within 50 years of tree
establishment and therefore represent widespread stand-level self-thinning. Furthermore, during
the twenty-year period of increased release frequency, large portions of Central Hardwood and
Transitional Forest Regions experienced moderate high-frequency drought periods followed by
significantly wetter years as indicated by reconstructed Palmer Drought Severity Index (PDSI)
values (PDSI values ranging from -3.0 to -1.0 during the drought years and ranging from 1.0 to
4.0 during the wetter years; Cook and Krusic, 2004). Moderate, periodic droughts potentially

26
caused increased overstory mortality either directly or indirectly as water stressed trees in eastern
Quercus forests have been shown to exhibit reduced growth and vigor and be susceptible to other
killing agents such as soil fungi that damage root systems (e.g. Armillaria mellea Vahl ex Fr.;
Clinton et al., 1993, 1994; Klos et al., 2009; Hart and Kupfer, in review). In the subsequent
wetter years, remnant trees responded to the increased resource availability resulting from both
the canopy gaps and the increased moisture availability.
In the Northern Hardwood Forest Region, establishment frequency was relatively sparse
until a pulse of establishment occurred in the 1830s. Similarly, release frequency in the region
was relatively sparse until the 1850s when release frequency suddenly increased. Both of these
occurrences coincide with the period of settlement for the region and therefore likely result from
the sudden increase in land-use intensity and spatial extent by European settlers (Exploration and
Settlement 1835–1850, 1966).
All regions except the Northern Hardwood Region exhibited multiple decades of
increased establishment and release frequency during a period from 1850 to 1919. The increased
establishment during the early potion of this period corresponds to settlement of the region
(Exploration and Settlement 1850–1890, 1966) and the corresponding increase in land use extent
and intensity for both building and agriculture. Moderate multi-year droughts beginning in both
1856 and 1872 (Cook and Krusic, 2004) likely contributed to the increased mortality and
subsequent periods of increased establishment and release frequency throughout these regions.
During the early 20th
Century, logging activity throughout the eastern US was nearing a peak in
intensity (Whitney, 1994). Though many of the stands in the dataset were classified as old
growth by the respective ITRDB contributors, I speculate many of these stands experienced
27
selective cutting (whether by diameter limit cutting or species-specific cutting) during this period
of intense logging.
As all regions excepting the Transitional Forest Region exhibited high rates of
establishment and release frequency during the early 20th
Century, it is likely these pulses in tree
recruitment and growth corresponded to the selective cutting of neighboring individuals or
cohorts. Additionally, increased establishment and release frequency occurring in these three
regions from 1900–1929 likely corresponds to onset of C. dentata population decimation by the
fungal pathogen Cryphonectria parasitica (Murrill) Barr. (Agrawal and Stephenson, 1995; Hart
et al., 2008; McEwan et al., in press). As this pathogen spread throughout the eastern US, genera
such as Quercus and Acer were able to fill the niche vacated by C. dentata (Woods and Shanks,
1959; McEwan et al., in press). The decimation of C. dentata has also been documented in the
radial growth of remnant trees from sites in Tennessee (Hart et al., 2008), Virginia (Agrawal and
Stephenson, 1995), and Maryland (McCarthy and Bailey, 1996).
The Grassland or Prairie Region exhibited a significant pulse in release frequency during
the 1940s. A majority of the sites within this region are located in Iowa. Iowa experienced
drought conditions from 1939–1940 (PDSI values ranging from -2 to -4; Cook and Krusic, 2004)
followed by generally wet conditions for the remainder of the decade. Drought conditions were
less intense or non-existent throughout the other regions at this time; therefore, I speculate the
significant pulse in release frequency in the Grassland or Prairie Region directly corresponds to
drought-induced tree mortality and subsequent increased growth exhibited by remnant
individuals.
28
5.4 Range
Results at the range level allowed for broad-scale analysis of disturbance characteristics
throughout the eastern US. Several widespread temporal trends of establishment and release
frequency were identified. The cumulative establishment frequency from the 44 Q. alba old-
growth sites exhibited a bimodal temporal distribution with a peak from 1720–1799 and a
subsequent pulse of lesser magnitude from 1840–1919 (Fig. 4). Prior to the peak beginning in
1720, establishment frequency was relatively sparse until 1650 when constant level of
―background‖ establishment was begun. The range-wide background establishment rate is likely
the result of multiple disturbance mechanisms interacting at varying spatial and temporal scales:
Ectopistes migratorious L. (Passenger Pigeon) decline, stand high-grading, settlement activities,
agriculture land clearance, C. dentata decline, insect outbreaks, small localized wind events,
surface fire that removes fire-sensitive species and increases local resource availability, and
general region-level natural background mortality (Whitney, 1994; Ruffner and Abrams 1998;
McEwan et al., in press).
The first, higher magnitude peak in establishment (1720–1799) corresponds to the
aforementioned period of Native American depopulation (ca. 1650–1760) and subsequent
decrease in land-use extent and intensity. A pulse in release frequency in the 1760s likely
represents self-thinning in the newly established stands (ca. 40 years post-establishment; Hart
and Grissino-Mayer, 2008). Though, again, this pulse attributed to self-thinning is likely also the
result of simultaneous disturbance events that create larger canopy voids than the removal of 50-
year old individuals. Following this period of reforestation, establishment frequency decreased
to a constant level of background establishment (i.e. background disturbance) between 1790 and
1849. A second pulse in release frequency during the 1830s preceded the second peak in
29
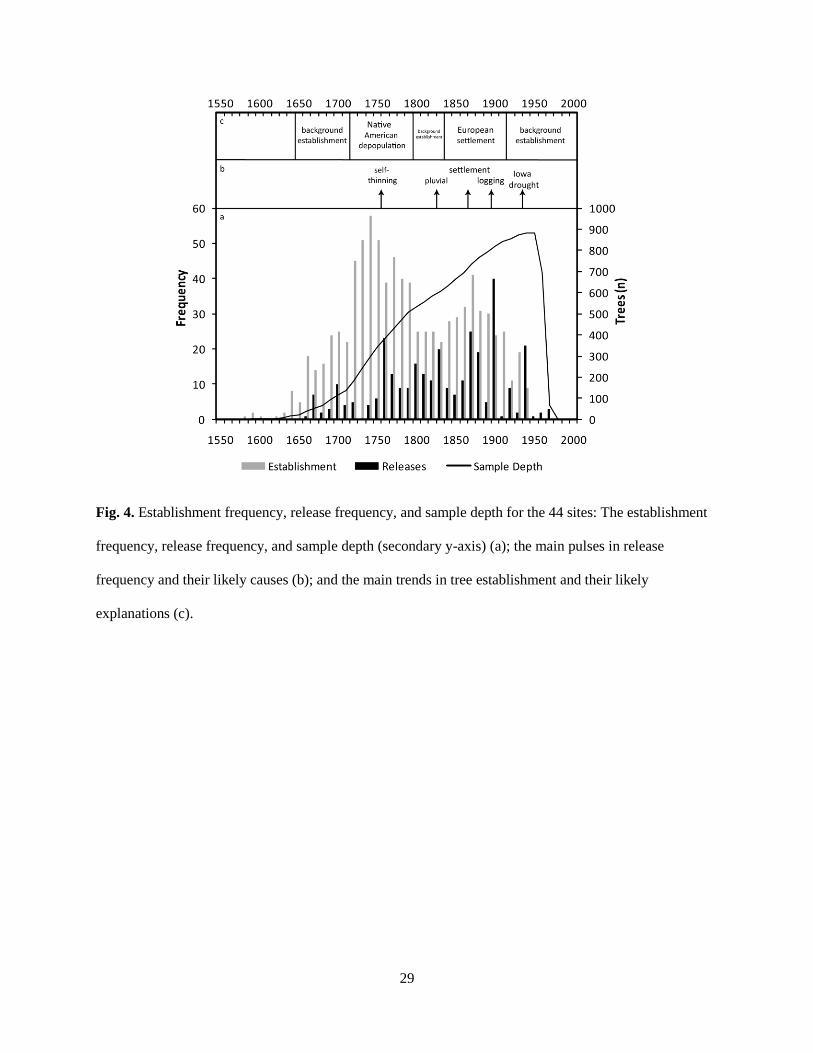
Fig. 4. Establishment frequency, release frequency, and sample depth for the 44 sites: The establishment
frequency, release frequency, and sample depth (secondary y-axis) (a); the main pulses in release
frequency and their likely causes (b); and the main trends in tree establishment and their likely
explanations (c).

30
establishment frequency beginning in the 1840s and corresponds to a pluvial period (i.e.
increased moisture availability) in the eastern US (Cook and Krusic, 2004; McEwan et al., in
press). The second peak in establishment frequency from 1840–1919 coincides with the
westward expansion of human settlement (Exploration and Settlement 1835–1850, 1850–1890,
1966) and regional development throughout the eastern US (e.g. intense agriculture, clear- or
selective-cutting for building materials; Stambaugh and Guyette, 2006). A third pulse in release
frequency occurred during the 1870s and likely corresponds to both settlement activities and a
multi-year drought that began in 1872 (Cook and Krusic, 204; McEwan et al., in press).
The largest pulse in release frequency occurred between 1900 and 1909. This high
frequency of release events presumably represents intense logging activity throughout the region
and, to a lesser extent, canopy disturbance arising from the decline of C. dentata (at this time, the
population decimation was not at its full extent; Lorimer, 1980; Woods and Shanks, 1959).
Importantly, the release frequency nearly ceases subsequent to 1900 excepting the final pulse in
release frequency in the 1940s. This decrease in release frequency throughout the old-age Q.
alba stands is concomitant with the decline of Quercus dominance throughout the eastern US.
Therefore, a decreased frequency of high-magnitude disturbance could be a possible contributor
to the compositional shift documented throughout eastern Quercus forests in recent decades.
However, this cessation could possibly be an artifact of the old age of the sampled trees as trees
exhibit decreased phenotypic plasticity with increasing age (Nowacki and Abrams, 1997; Fritts,
2001; Hart et al., 2010)
Subsequent to 1919, tree establishment rates resume to background disturbance levels
until tapering off at 1940. However, the apparent cessation of establishment in 1940 is solely an
artifact of sample collection rather than environmental factors. A large majority of tree-ring
31
series in the dataset was sampled during the 1980s and 1990s and therefore trees establishing
subsequent to 1940 were likely not sampled because of their young age. A fifth pulse in release
frequency was identified in the 1940s. As mentioned before, the Grassland or Prairie Region
experienced a moderate drought followed by five years of wetter conditions (Cook and Krusic,
2004). This climatic factor, in tandem with high grading throughout the region and C. dentate
decline in the eastern portion of the range, likely led to the increased disturbance frequency
during the 1940s.
Throughout the range of Q. alba, the mean releases per tree every 100 years ranged from
0.18 (Grassland or Prairie Formation Region) to 0.41 (Northern Hardwood and Grassland or
Prairie Formation Regions). Therefore, any given Q. alba individual is likely to experience a
high-magnitude canopy disturbance event every 244–556 years. This range of disturbance
recurrence exceeds the documented canopy disturbance return interval in the eastern US (i.e.
every 50–200 years; Runkle, 1984, 1985; Foster, 1988). This longer return interval was expected
as I only documented high-magnitude events that create a patchwork landscape and are generally
less frequent than localized disturbances (Lorimer, 1980; Foster, 1988; Rentch et al., 2003). The
data presented here confirm that historical Quercus dominance throughout much of the Holocene
was maintained, in part, by high-magnitude disturbance events ca. every 400 years. These high
magnitude disturbances remove many disturbance-intolerant species, fragment large areas of the
canopy, cause significant damage to subcanopy individuals, and allow disturbance-oriented and
mid-successional taxa such as Quercus to establish.
However, with an increased abundance of mesic, shade-tolerant taxa throughout the
central portions of the Q. alba range, Quercus species are failing to regenerate as they cannot
establish and recruit under a layer of supcanopy mesic species. In the Northern Hardwood

32
Region, Quercus is generally less dominant and mesic taxa such as A. saccharum and F.
grandifolia are more important. As these species are also increasing in importance throughout
the Central Hardwood Region, and as this region had one of the lowest level of disturbance,
Quercus regeneration will likely continue to decline without the presence of frequent, high-
magnitude disturbance. I suspect that the high-magnitude disturbance events occurring
throughout the period of Quercus dominance also removed significant portions of the understory
vegetation. The removal of subcanopy vegetation, in addition to canopy individuals, increases
the regeneration prospects of shade-intolerant Quercus species by allowing more sunlight to
reach the understory and forest floor. Experimental midstory thinning in the Central Hardwood
Region has shown successful Quercus regeneration on certain site types (Brose and Van Lear,
1998; Loftis, 1990; Iverson et al., 2008). Broad-scale experiments have yet to be conducted but I
contend the removal of both overstory and understory individuals, as would occur in high-
magnitude disturbance events, would improve the regeneration potential of Quercus species.
33
6. Conclusion
The long-term, broad-scale perspective of disturbance history throughout the Q. alba
range provided insight into the disturbance characteristics that prevailed during the latter period
of Quercus dominance in the eastern US. The ca. 400-year record presented in this study
provides disturbance regime characteristics for both the latter period of Quercus dominance as
well as the onset of Quercus decline. Importantly, I noted a decrease in the ―background
disturbance‖ rates in the late 19th
and early 20th
Centuries, the period in which the compositional
shift from Quercus to mesic taxa occurred. This decrease signifies a reduction in the frequency
of high magnitude disturbance events throughout the eastern deciduous forest region.
Furthermore, my analysis provided information regarding regional- and range-wide temporal
trends in disturbance. In general, the temporal distribution of tree establishment dates was
bimodal and corresponded to the period of Native American depopulation and the period
following European settlement. Reforestation during both of these establishment peaks was
generally followed by pulses of increased release frequency that signified self-thinning within
the newly established stands. Drought, C. dentata decline, and logging activities also
significantly contributed to the long-term, range-wide disturbance regime.
Regional discrepancies in release characteristics were identified. The Northern
Hardwood Forest region featured the highest level of disturbance as compared to all other
regions. Surprisingly, the Central Hardwood Forest Region exhibited the second lowest rate of
disturbance (as evidenced by the lowest MRTC value and n:R ratio). In general, disturbances
occured throughout the Q. alba range every 244–556 years. This return interval for high

34
magnitude disturbance events can be imitated by land managers in effort to promote Quercus
regeneration. However, significant portions of understory vegetation likely need to be removed
as I suspect the high-magnitude disturbance during the period of historical Quercus dominance
removed more than just the overstory vegetation. Removal of multiple forest strata should
improve the regeneration potential of Quercus throughout the eastern US.
35
7. References
Abrams, M.D. 1992. Fire and the development of oak forests. BioScience 42: 346–353.
Abrams, M.D. 1998. The red maple paradox. BioScience 48: 355–364.
Abrams, M.D. 2002. The postglacial history of oak forests in eastern North America. In:
McShea, W.J., and Healy, W.M. (Eds.), Oak Forest Ecosystems: Ecology and
Management for Wildlife. The John Hopkins University Press, Baltimore, pp. 34–45.
Abrams, M.D. 2003. Where has all the white oak gone? BioScience 53: 927–393.
Abrams, M.D., D.A. Orwig, and T.E. Demeo. 1995. Dendroecological analysis of successional
dynamics for a presettlement-origin white pine-mixed oak forest in the southern
Appalachians, USA. Journal of Ecology 83: 123–133.
Agrawal, A. and Stephenson, S.L. 1995. Recent successional changes in a former chestnut-
dominated forest in southwestern Virginia. Castanea 60: 107 – 113.
Brose, P.H. and Van Lear, D.H. 1998. Responses of hardwood advance regeneration to seasonal
prescribed fires in oak-dominated shelterwood stands. Canadian Journal of Forest
Research 28: 331–339.
Buchanan, M.B., and Hart, J.L. A methodological analysis of canopy disturbance
reconstructions using Quercus alba. Canadian Journal of Forest Research. In press.
Canham, C.D., and Marks, P.L. 1985. The response of woody plants to disturbance: patterns of
establishment and growth. In: Pickett, S.T.A., and White, P.S. (Eds.), The Ecology of
Natural Disturbance and Patch Dynamics. Academic Press, San Diego, pp.197–217.
Canham, C.D., Papaik, M.J., and Latty, E.K. 2001. Interspecific variation in susceptibility to
windthrow as a function of tree size and storm severity for northern temperate tree
species. Canadian Journal of Forest Research 31: 1–10.
Cleaveland, M.K. and Duvick, D.N. 1992. Iowa climate reconstructed from tree rings 1640–
1982. Water Resources Research 28: 2607–2615.
Clinton, B.D., Boring, L.R., and Swank, W.T. 1993. Canopy gap characteristics and drought
influences in oak forests of the Coweeta Basin. Ecology 74: 1551–1558.
36
Clinton, B.D., Boring, L.R., and Swank, W.T. 1994. Regeneration patterns in canopy gaps of
mixed-oak forests of the Southern Appalachians: influences of topographic position and
evergreen understory. American Midland Naturalist 132: 308–319.
Cook, E.R., and Krusic, P.J. 2004. The North American drought atlas. Lamont-Doherty Earth
Observatory and the National Science Foundation, Web document accessed 9 February
2011: <http://iridl.ldeo.columbia.edu/SOURCES/.LDEO/.TRL/.NADA2004/.pdsi-
atlas.html>, accessed 9 February 2011.
Davis, M.B., Parshall, T.E., and Ferrari, J.B. 1996. Landscape heterogeneity of hemlock-
hardwood forest in northern Michigan. In: Davis, M.B. (ed.), Eastern Old-Growth
Forests. Island Press, Washington, pp. 291–304.
Denevan, W.M. 1992. The pristine myth: the landscape of the Americas in 1492. Annals of the
Association of American Geographers 82: 369–385.
Duguay, S.M., Arii, K., Hooper, M., and Lechowicz, M.J. 2001. Ice storm damage and early
recovery in an old-growth forest. Environmental Monitoring and Assessment 67: 97–
108.
Exploration and Settlement 1835–1850 [Map]. 1966. Retrieved from University of Texas
Libraries, Perry-Castaneda Library Map Collection. Accessed 9 February 2011.
Exploration and Settlement 1850–1890 [Map]. 1966. Retrieved from University of Texas
Libraries, Perry-Castaneda Library Map Collection. Accessed 9 February 2011.
Foster, D.R. 1988. Species and stand response to catastrophic wind in Central New England,
U.S.A. Journal of Ecology 76: 135–151.
Foster, D.R., G. Motzkin, and B. Slater. 1998. Land-use history as long-term broad-scale
disturbance: regional forest dynamics in central New England. Ecosystems 1: 96–119.
Foster, D.R., S. Clayden, D.A. Orwig, B. Hall, and S. Barry. 2002. Oak, chestnut and fire:
climatic and cultural controls of long-term forest dynamics in New England, USA.
Journal of Biogeography 29: 1359–1379.
Fritts, H.C. 2001. Tree Rings and Climate. Blackburn Press, Caldwell, New Jersey.
Goebel, P.C. and Hix, D.M. 1997. Changes in the composition and structure of mixed-oak,
second-growth forest ecosystems during the understory reinitiation stage of stand
development. Ecoscience 4: 327–339.
Goldblum, D. 2010. The geography of white oak’s (Quercus alba L.) response to climatic
variables in North America and speculation on its sensitivity to climate change across its
range. Dendrochronologia 28: 73–83.
37
Grissino-Mayer, H.D. and Fritts, H.C. 1997. The International Tree-Ring Data Bank: An
enhanced global database serving the global scientific community. Holocene 7: 235–238.
Hart, J.L., and Grissino-Mayer, H.D. 2008. Vegetation patterns and dendroecology of a mixed
hardwood forest on the Cumberland Plateau: Implications for stand development. Forest
Ecology and Management 255: 1960–1975.
Hart, J.L., and Grissino-Mayer, H.D. 2009. Gap-scale disturbance processes in secondary
stands on the Cumberland Plateau, Tennessee, USA. Plant Ecology 201: 131–146.
Hart, J.L., and Kupfer, J.A. in review. Sapling richness and composition in canopy gaps of a
southern Appalachian mixed Quercus forest.
Hart, J.L., van de Gevel, S.L., and Grissino-Mayer, H.D. 2008. Forest dynamics in a natural
area of the southern Ridge and Valley, Tennessee. Natural Areas Journal 28: 275–289.
Hart, J.L., Austin, D.A., and van de Gevel, S.L. 2010. Radial growth responses of three co-
occurring species to small canopy disturbances in a secondary hardwood forest on the
Cumberland Plateau, Tennessee. Physical Geography 31: 1–22.
Hart, J.L., Bhuta, A.A.R., and Schneider, R.M. 2011. Canopy disturbance patterns in secondary
hardwood stands on the Highland Rim of Alabama. Castanea. In press.
Hutchinson, T.F., Long, R.P., Ford, R.D., and Sutherland, E.K. 2008. Fire history and the
establishment of oaks and maples in second-growth forests. Canadian Journal of Forest
Research 38: 1184–1198.
International Tree-Ring Data Bank (ITRDB). 2005. Data available at
http://www.ngdc.noaa.gov/paleo/treering.html.
Iverson, L.R., Hutchinson, T.F., Prasad, A.M., and Peters, M.P. 2008. Thinning, fire, and oak
regeneration across a heterogeneous landscape in the eastern U.S.: 7-year results. Forest
Ecology and Management 244: 3035–3050.
Johnson-Grohl, C.L. 1985. Vegetation communities of Ledges State Park, Boone County, Iowa.
Proceedings of the Iowa Academy of Science 92: 129–136.
Johnson-Grohl, C.L., and Farrar, D.R. 1985. Flora and phytogeographical history of Ledges
State Park, Boone County, Iowa. Proceedings of the Iowa Academy of Science 92: 137–
143.
Klos, R.J., Wang, G.G., Bauerle, W.L., and Rieck, J.R. 2009. Drought impact on forest growth
and mortality in the southeast USA: an analysis using Forest Health and Monitoring data.
Ecological Applications 19: 699–708.
38
LeBlanc, D.C., and Terrell, M.A. 2009. Radial growth response of white oak to climate in
eastern North America. Canadian Journal of Forest Research 39: 2180–2192.
Loftis, D.L. 1990. A shelterwood method for regenerating red oak in the southern
Appalachians. Forest Science 36: 917–929.
Lorimer, C.G. 1980. Age structure and disturbance history of a southern Appalachian virgin
forest. Ecology 61: 1169–1184.
Lorimer, C.G. 1984. Development of the red maple understory in northeastern oak forests.
Forest Science 30: 3–22.
McCarthy, B.C., and Bailey, D.R. 1996. Composition, structure, and disturbance history of
Crabtree Woods: an old-growth forest of western Maryland. Bulletin of the Torrey
Botanical Club 123: 350–365.
McEwan, R.W., and McCarthy, B.C. 2008. Anthropogenic disturbance and the formation of
oak savanna in central Kentucky, USA. Journal of Biogeography 35: 965–975.
McEwan, R.W., Dyer, J.M., Pederson, N. in press. Multiple interacting ecosystem drivers:
toward an encompassing hypothesis of oak forest dynamics across eastern North
America. Ecography doi: 10.1111/j.1600-0587.2010.06390.x.
McWilliams, W.H., O’Brien, R.A., Reese, G.C., Waddell, K.L. 2002. Distribution and
abundance of oaks in North America. In: McShea, W.J., and Healy, W.M. (Eds.), Oak
Forest Ecosystems: Ecology and Management for Wildlife. The John Hopkins
University Press, Baltimore, pp. 13–33.
Nowacki, G.J. and M.D. Abrams. 1994. Forest composition, structure, and disturbance history
of the Alan Seeger Natural Area, Huntington County, Pennsylvania. Bulletin of the
Torrey Botanical Club. 121: 277–291.
Nowacki, G.J. and Abrams, M.D. 1997. Radial-growth averaging criteria for reconstructing
disturbance histories from presettlement-origin oaks. Ecological Monographs 67: 225–
249.
Oliver, C.D., and Larson, B.C. 1996. Forest Stand Dynamics, Update edition. John Wiley and
Sons, New York.
Peterson, C.J., and Pickett, S.T.A. 1991. Treefall and resprouting following catastrophic
windthrow in an old-growth hemlock-hardwoods forest. Forest Ecology and
Management 42: 205–217.
Ramenofsky, A.F. 1987. Vectors of Death: the Archeology of European Contact. University of
New Mexico Press, Albuquerque, New Mexico.
39
Rentch, J.S., Desta, F., and Miller, G.W. 2002. Climate, canopy disturbance, and radial growth
averaging in a second-growth mixed-oak forest in West Virginia, U.S.A. Canadian
Journal of Forest Research 32: 915–927.
Rentch, J.S., Fajvan, M.A., and Hicks Jr., R.R. 2003. Spatial and temporal disturbance
characteristics of oak-dominated old-growth stands in the central hardwood forest region.
Forest Science 49: 778–789.
Rogers, R. 1990. Silvics of North America: 1. Conifers; 2. Hardwoods. Agricultural Handbook
654, U.S. Dept. of Agriculture, Forest Service, Washington, D.C. vol.2.
Runkle, J.R. 1982. Patterns of disturbance in some old-growth mesic forests of eastern North
America. Ecology 63: 1533–1546.
Runkle, J.R. 1984. Development of woody vegetation in treefall gaps in a beech-sugar maple
forest. Ecography 7: 157–164.
Runkle, J.R. 1985. Disturbance regimes in temperate forests. In: Pickett, S.T.A., and White,
P.S. (Eds.), The Ecology of Natural Disturbance and Patch Dynamics. Academic Press,
San Diego, pp.17–34.
Rubino, D.L. and McCarthy, B.C. 2000. Dendroclimatological analysis of white oak (Quercus
alba L., Fagaceae) from an old-growth forest of southeastern Ohio, USA. Journal of the
Torrey Botanical Society 127: 240–250.
Rubino, D.L. and McCarthy, B.C. 2004. Comparative analysis of dendroecological methods
used to assess disturbance events. Dendrochronologia 21: 97–115.
Ruffner, C.M., and Abrams, M.D. 1998. Relating land-use history and climate to the
dendroecology of a 326-year-old Quercus prinus talus slope forest. Canadian Journal of
Forest Research 28: 347–358.
Sakulich, J., Hart, J.L., van de Gevel, S.L., Nagle, N.N., and Grissino-Mayer, H.D. 2011.
Modeling spatial variability of climate response in annual growth of eastern North
American trees. Scheduled talk, 2011 Annual Meeting of the Association of American
Geographers, 12–16 April 2011, Seattle, Washington.
Schwartz, M.W., and Hermann, S.M. 1999. Is slow growth of the endangered Torreya taxifolia
(Arn.) normal? Journal of the Torrey Botanical Society 126: 307–312.
Stambaugh, M.C., and Guyette, R.P. 2006. Fire regime of an Ozark wilderness area, Arkansas.
American Midland Naturalist 156: 237–251.
Whitney, G.G. 1994. From Coastal Wilderness to Fruited Plain: A History of Environmental
Change in Temperate North America From 1500 to the Present. University Press,
Cambridge.

40
Woods, F.W., and Shanks, R.E. 1959. Natural replacement of chestnut by other species in the
Great Smoky Mountains National Park. Ecology 40: 349–361.
Zeide, B. 2010. Comparison of self-thinning models: an exercise in reasoning. Trees 24: 1117–
1126.
Zishka, K.M., and Smith, P.J. 1980. The climatology of cyclones and anticyclones over North
America and surrounding ocean environs for January and July, 1950–77. Monthly
Weather Review 108: 387–401.