Embed Size (px)
Citation preview

Law Faculty Scholarship WVU College of Law
2014
Patent Examiners and Litigation Outcomes Patent Examiners and Litigation Outcomes
Shine Tu
Follow this and additional works at: https://researchrepository.wvu.edu/law_faculty
Part of the Intellectual Property Law Commons

PATENT EXAMINERS
AND LITIGATION OUTCOMES
Shine Tu*
CITE AS: 17 STAN. TECH. L. REv. 507 (2014)http://stlr.stanford.edu/pdf/patentexaminers.pdf
ABSTRACT
Conventional wisdom argues that unnecessary litigation of low qualitypatents hinders innovation, and that the PTO could play a role with its high grantrates. Accordingly, it is important to answer these questions: (1) which patentexaminers are issuing litigated patents, (2) are examiners who are "rubberstamping" patents issuing litigated patents at a disproportionately higher rate,and (3) are examiners with less experience issuing more litigated patents? Insum, do patent examiners who issue litigated patents have commoncharacteristics? Intuition would argue that those examiners who issue the mostpatents (approximately one patent every three business days) would exhibit ahigher litigation rate. Surprisingly, this study suggests that this is wrong.
This study uses two new patent databases that code for nearly 1.7 millionpatents and approximately 12,000 patents that were litigated between 2010 and2011. This study determined that (1) litigated patents mainly come from primaryexaminers (those examiners with more experience), and (2) primary examinerswith between three to five years of experience and who grant between forty-fiveand sixty patents per year are contributing to the litigated patent pool at a higherrate than expected. Interestingly, the highest volume primary examiners(examiners who on average grant more than eighty patents per year and havemore than eight years of experience) do better than expected.
* Associate Professor, West Virginia University College of Law. Sincere thanks to the many
readers who offered comments on earlier drafts, including Michael Risch, Hal Wegner,Jason Rantanen, Courtney Brinckerhoff, Benjamin Berkowitz, the participants at the 2012 IPScholars Conference, and the 2012 Center for the Protection of Intellectual Property ThomasEdison Fellows. Additional thanks to the research assistants who were instrumental incoding the data: Ryan Campione, Gregory Pennington, Limian Fang, Evan Gallo, SamanthaStevfanov, Katherine Bomkamp, Andrew Hilber, Sean Conrecode, and Amy Purpura. Theauthor thanks Zomitsa Georgieva, Lucas Moore, and Reagan Curtis in the ProgramEvaluation and Research Center (PERC, www.perc.cehs.wvu.edu) of the College ofEducation and Human Services at West Virginia University for statistical analysis and datavisualization in this manuscript. This work was funded in part by the generous support of theWest Virginia University College of Law Hodges Research Fund.

508 STANFORD TECHNOLOGY LAW REVIEW [Vol. 17:507
TABLE OF CONTENTS
IN T R O D U C T IO N ....................................................................................................... 5 0 8I. B A C K G R O U N D ................................................................................................... 5 12
A . Patenting P rocedure ................................................................................... 512B . Patent Exam iners ....................................................................................... 515
II. E XISTIN G L ITERATURE ...................................................................................... 5 18III. D ESCRIPTION OF STUDY .................................................................................... 52 1
A . Overall Population (OP) Dataset ............................................................... 521B . Exam iner D ataset ....................................................................................... 522C . D ata C ollected ............................................................................................ 523D . H ypothesis to Be Tested .............................................................................. 523E . L im itations .................................................................................................. 524
IV .R ESU L TS ........................................................................................................... 5 24
A . Statistical A nalysis ...................................................................................... 524B . G enera l ....................................................................................................... 525C. The Overall Population (OP) Database ..................................................... 529D. Segmentation by Primary Versus Secondary Examiners ........................... 533E. Segmentation by Years of Service ............................................................... 535F. Segmentation by Technology Centers ........................................................ 538G . Segmenta tion by W orkgroup ...................................................................... 539H . Possible Solutions ....................................................................................... 542
V . C O N C LU SIO N S ................................................................................................... 54 4A PPE N D IX ............................................................................................................... 5 4 5
INTRODUCTION
Conventional wisdom argues that unnecessary litigation of low qualitypatents is a tax on innovation, and the Patent and Trademark Office (PTO)could play a role due to high grant rates.1 Intuition suggests that those
1. See, e.g., John R. Allison, Mark A. Lemley, Kimberly A. Moore & R. DerekTrunkey, Valuable Patents, 92 GEC. L.J. 435 (2004); John R. Allison, Mark A. Lemley &Joshua Walker, Extreme Value or Trolls on Top? The Characteristics of the Most-LitigatedPatents, 158 U. PA. L. REV. 1 (2009); John R. Allison & Mark A. Lemley, EmpiricalEvidence on the Validity of Litigated Patents, 26 AIPLA Q.J. 185 (1998); Colleen V. Chien,Predicting Patent Litigation, 90 TEX. L. REV. 283 (2011); Jean 0. Lanjouw & MarkSchankerman, Characteristics of Patent Litigation: A Window on Competition, 32 RAND J.EcON. 129 (2001) [hereinafter Lanjouw & Schankerman, Characteristics]; Jean 0. Lanjouw& Mark Schankerman, Patent Quality and Research Productivity: Measuring Innovationwith Multiple Indicators, 114 EcON. J. 441 (2004) [hereinafter Lanjouw & Schankerman,Patent Quality]; Jean 0. Lanjouw & Mark Schankerman, Protecting Intellectual PropertyRights: Are Small Firms Handicapped?, 47 J.L. & EcON. 45 (2004) [hereinafter Lanjouw &Schankerman, Protecting IP]; Kimberly A. Moore, Worthless Patents, 20 BERKELEY TECH.L.J. 1521 (2005); see also U.S. DEPT. OF COMMERCE, PATENT REFORM: UNLEASHINGINNOVATION, PROMOTING ECONOMIC GROWTH & PRODUCING HIGH-PAYING JOBS (2010),available at http://www.commerce.gov/sites/default/files/documents/migrated/PatentReform-paper.pdf; JAMES BESSEN & MICHAEL MEURER, PATENT FAILURE: HOW JUDGES,
BUREAUCRATS, AND LAWYERS PUT INNOVATORS AT RISK (2008); Joseph Farrell & Robert P.Merges, Incentives to Challenge and Defend Patents: Why Litigation Won't Reliably FixPatent Office Errors and Why Administrative Patent Review Might Help, 19 BERKELEY

Winter 2014] PATENT EXAMINERS & LITIGATION
examiners who issue a high number of patents (average of eighty or morepatents per year) will issue a disproportionately high number of litigatedpatents. However, this study argues that this is not the case.
Previous studies have shown that the majority of patents go unenforced,2
and many may be worthless.3 However, those patents that are valuable have theability to demand large royalty rates and keep competitors out of the market.This Article focuses on the "valuable" patents by using litigated patents as aproxy for the valuable patent population. Specifically, this Article attempts totie examiner characteristics to more objective measures of the performance ofthe examination process. These objective measures of performance includeexperience level of the examiner, average time it takes the examiner to issue apatent, and primary signatory authority. This Article then examines judicialdecisions to determine if there are common characteristics between thoseexaminers who issue patents that are subsequently litigated.
Only around 1.5% of patents are ever litigated in court.4 However, whenpatents do get litigated, the process is expensive, disruptive, and somewhatinconsistent. In a 2011 study, the American Intellectual Property LawAssociation (AIPLA) found that for a claim that is less than $1 million, themedian legal costs are $700,000.5 When $10 million to $25 million isconsidered "at risk," median litigation costs can hit $3.3 million. 6 For a claimover $25 million, median legal costs are $5.5 million.7 Academics andpractitioners alike have attempted to quantify characteristics for those patents
TECH. L.J. 943 (2004); Paul M. Janicke, On the Causes of Unpredictability of FederalCircuit Decisions in Patent Cases, 3 Nw. J. TECH. & INTELL. PROP. 93, 93-94 (2005); Jay P.Kesan, David L. Schwartz & Ted Sichelman, Paving the Path to Accurately PredictingLegal Outcomes: A Comment on Projessor Chien's Predicting Patent Litigation, 90 TEX. L.REV. 97 (2012); Gerald Mossinghoff & Donald R. Dunner, Increasing the Certainty inPatent Litigation: The Need Jor Federal Circuit Approved Pattern Jury Instructions, 83 J.PAT. & TRADEMARK OFF. Soc'Y 431,432-33 (2001); Lee Petherbridge, On Predicting PatentLitigation, 90 TEX. L. REV. 75 (2012); Shine S. Tu, Unluck/Luck of the Draw: An EmpiricalAnalysis of Examiner Allowance Rates, 20 STAN. TECH. L. REV. 10 (2012). But see TedSichelman, Myths of(Un)certainty at the Federal Circuit, 43 Loy. L.A. L. REV. 1161, 1188-89 (2010).
2. Moore, supra note 1, at 1521-22 (arguing that in 2005 there were approximately180,000 patents issued per year, in contrast to approximately 4,500 patents enforced againstinfringers in patent lawsuits).
3. Id. at 1525-26 (finding that most patentees fail to pay maintenance fees of only afew thousand dollars). Maintenance fees are due at 3.5 years ($1600), 7.5 years ($3,600) and11.5 years ($7,400), set in 37 CFR 1.20(e), (f) and (g), respectively. These fees are cut by50% for small entities and cut by 75% for micro entities. Fee Schedule, U.S. PAT. &TRADEMARK OFF. (Mar. 13, 2014), http://www.uspto.gov/web/offices/ac/qs/ope/fee0101 14.htm (under heading "Patent Maintenance Fees").
4. Mark A. Lemley, Rational Ignorance at the Patent Office, 95 Nw. U. L. REV.1495, 1507 (2001).
5. AM. INTELLECTUAL PROP. LAW ASS'N, REPORT OF THE ECONOMIC SURVEY (2013)at 1-129.
6. Id. at 1-130.7. Id. at1 131.

STANFORD TECHNOLOGY LAW REVIEW [Vol. 17:507
that are most litigated to better determine those characteristics of patents thatare more frequently litigated.8
Patent quality is important because a higher quality patent system is likelyto be taken more seriously at the litigation stage. Some commentators arguethat the initial process of patent review is unreliable and thus produces aninaccurate signal.9 All parties would prefer only valid patents be asserted;however, this is impossible. Thus, understanding facts about the patents canhelp us determine their validity before litigation is the next best option. Whileothers have studied characteristics such as number of claims,10 references,11
family size,12 assignments,13 post-issuance events,14 and forward citations,15
this study attempts to measure patent quality by determining if there are anycommon characteristics between those examiners who issue litigated patents.
We previously collected and coded for every patent issued in the pastdecade (from 2001 to 2011, approximately 1.7 million patents). 16 Additionally,we determined that there are two distinct populations of examiners who may beharming the patent system: (1) those examiners who grant patent applications ata disproportionately high rate, and (2) those examiners who grant patentapplications at a disproportionately low rate.17 However, this previous studydoes not answer the normative question: which population is harminginnovation more?
To address this question, we have collected and analyzed a new datasetlinking patent litigation filings with our previously generated database onpatent examiners. This current dataset comprises patent litigations thatterminated between 2010 and 2011. The dataset includes 12,923 litigations thatcorresponded to 15,161 patents matched to 11,748 patent examiners. 18 For eachpatent, we identified the primary and/or secondary examiner and collectedhistorical information regarding that examiner's entire examination history
8. Chien, supra note 1.9. Doug Licltman & Mark A. Lemley, Rethinking Patent Law's Presumption of
Validity, 60 STAN. L. REV. 45, 68 (2007).10. Lanjouw & Schankerman, Characteristics, supra note 1, at 140-41.11. Allison, Lemley, Moore & Tnmkey, supra note 1, at 436-37.12. Katrin Cremers, Determinants of Patent Litigation in Germany 13 (Ctr. for
European Econ. Research, Discussion Paper No. 04-72, 2004), available atftp://ftp.zew.de/pub/zew-docs/dp/dpO472.pdf (reporting that "the average family size oflitigated patents differs significantly from that of unlitigated patents (5.6 and 4.7)").
13. Chien, supra note 1, at 298-99.14. Id.15. Id.
16. Tu, supra note 1.17. Id.
18. We coded for 12,923 litigations that corresponded to 15,161 patents. However, wewere only able to match 11,748 patents to the examiner database described in Tu, supra note1. Accordingly, 3,413 patents fell outside of our examiner database. The examiner databaseincluded only those patents that issued between January 1, 2001 and July 15, 2011. Thus,many of the patents that were not included were issued before the January 1, 2001 date.
510

Winter 2014] PATENT EXAMINERS & LITIGATION
(including art unit, average examination duration, and average number ofpatents granted per year). We then detennined if there were patterns betweenprior examination experience and patent litigations.
Several scholars have quantified specific characteristics that are commonamong litigated and/or valuable patents.19 Additionally, some scholars haveattempted to link examiner characteristics to litigation outcomes. However,many of these studies have looked only at the results from litigations thatreached a "final" decision.21 In contrast, this study includes not only thosepatents appealed to the Court of Appeals for the Federal Circuit (CAFC), butalso litigation terminated in the district court system. Accordingly, this study ismore inclusive because it reviews all litigation, not just litigation that hasreached a final decision.
This study examines three possible hypotheses: (1) patent examiners whoissue patents at the highest rate (more than eighty patents per year) will issuemore litigated patents than expected; (2) patent examiners who issue at a verylow rate (fewer than ten patents per year) will issue fewer litigated patents thanexpected; and (3) patent examiners with the least amount of experience willissue more litigated patents than expected. The first hypothesis is born from theintuition that higher-volume examiners who may not be examining patentsclosely will issue patents that more frequently end up in litigation. The secondhypothesis is the corollary to the first hypothesis. Specifically, intuitionsuggests that examiners who spend more time examining a patent will issuefewer patents that end up in litigation because the examiner spends more timeon prior art searches and/or drafting well-crafted rejections. Finally, the thirdhypothesis comes from the intuition that more experience at the FfO may leadto less litigation, while less experience may lead to more litigation.
Many of these intuitive hypotheses are wrong. Specifically, this study findsthat: (1) patent examiners who issue the most patents actually issue relativelyfewer litigated patents, (2) patent examiners who issue at a very low rate issuelitigated patents at an expected rate, and (3) primary patent examiners who arerelatively early in their careers issue litigated patents at a disproportionally highrate. These data suggest that continued scrutiny of primary examiners whorecently obtained full signatory authority might reduce the granting of litigatedpatents.
Additionally, because the highest-volume primary examiners grant fewer
19. lain M. Cockburn, Samuel Kortum & Scott Stem, Are All Patent ExaminersEqual? The Impact of Characteristics on Patent Statistics and Litigation Outcomes, inPATENTS IN THE KNOWLEDGE-BASED ECONOMY 19 (Wesley M. Cohen & Stephen A. Merrill
eds., 2003); Allison, Lemley, Moore & Trunkey, supra note 1; Allison, Lemley & Walker,supra note 1; Allison & Lemley, supra note 1; Chien, supra note 1; Lanjouw &Schankerman, Characteristics, supra note 1; Lanjouw & Schankerman, Patent Quality,supra note 1; Lanjouw & Schankerman, Protecting 1P, supra note 1; see also Kesan,Schwartz & Sichelman, supra note 1, at 97; Petherbridge, supra note 1, at 75.
20. Cockburn et al., supra note 19.21. Id.; Allison & Lemley, supra note 1, at 187.

STANFORD TECHNOLOGY LAW REVIEW [Vol. 17:507
than expected litigated patents, it may be efficient to create mechanisms togenerate more high volume primary examiners. One possible way to emulatethese high volume examiners who issue fewer litigated patents is to create atwo-track specialization system for patent examiners. If one group of examinersspecializes in prior-art searching, while another group of examiners specializesin drafting office actions, this division of labor could mimic the specializationof one senior examiner in a much shorter timeframe. This may allow the PTOto emulate the experience of one 10+ year examiner in a much shorter amountof time. This solution would help not only the backlog of request for continuedexamination applications (RCEs), but the general backlog of unexaminedpatent applications while increasing patent quality.
Part I of this article briefly summarizes the patent examination process.Part II summarizes some of the previous empirical literature in the field. Part IIIdetails the dataset, its compilation, and the methodology used to analyze thedata, and then identifies the intrinsic limitations in this dataset. Part IVinterprets and explains the results. Finally, Part V draws some generalconclusions based on the patent litigation data and suggests further avenues forresearch.
I. BACKGROUND
It is uncontested that the PTO wields an enormous budget and oversees alarge number of employees. The PTO employs some 7,800 patent examiners22
and manages a budget of approximately $3 billion dollars.23 The PTO plannedto hire an additional 3,000 patent examiners in 2012-2013 to help reduce thebacklog from 619,204 unexamined patent applications to 329,500 by 2015 andachieve a first action pendency of 10.1 months.24
A. Patenting Procedure
25Patent work flow is streamlined and fairly well defined. Applications first
arrive at the central receiving office to determine if all of the proceduralrequirements are met to qualify for a filing date. Patent applications are then
22. As of May 2014, there were 8,108 patent examiners. Data Visualization Center,U.S. PATENT & TRADEMARK OFF., http://www.uspto.gov/dashboards/patents/main.dashxml(last visited May 11, 2014). (The PT0 dashboard changes every week but gives the most upto date information about the PTO statistics.)
23. For fiscal year 2013 the PTO projected fee collections to 2.953 billion, which willfund the required $2.822 billion in 12,212 full-time equivalent (FTE). U.S. PATENT &TRADEMARK OFFICE, FISCAL YEAR 2013, PRESIDENT'S BUDGET 6 (2013), available athttp: //www.uspto. gov /about/ stratplan/budget/ fy l3pbr.pdf.
24. Id.; Data Visualization Center, supra note 22 (listing current backlog as 619,204).Currently the first action pendency is 18.9 months. Data Visualization Center, supra note 22.
25. See Cockburn et al., supra note 19. For a review of the patent work flowprocedure, see generally Tu, supra note 1, at 10-20.
512
Winter 2014] PATENT EXAMINERS & LITIGATION
sorted into the appropriate "Technology Center" in the Patent Office forexamination. Currently, the Patent Office has seven active technology centers(grouped by 100s).2 6 For example, Technology Center 1600 deals withbiotechnology and organic chemistry patent applications. Each technologycenter is further divided into "workgroups." Workgroups (grouped by 10s)further narrow the broad technology center into specific fields. For example,1640 is a workgroup that deals with immunology, receptor/ligands, cytokinesrecombinant hormones, and molecular biology. Finally, each workgroup isdivided into "art units." An art unit (grouped by Is) is a working group that isresponsible for reviewing a cluster of related patent art. For example, Art Unit1648 deals with viral immunology.
Each art unit is staffed by one supervisory patent examiner (SPE) and anumber of patent examiners. Once the patent application is assigned to an artunit, the SPE assigns the application to a specific working examiner.27
Assignment to the working examiner, for the most part, is done randomly.28
The working examiner will usually have responsibility for examination of theapplication until it is (1) allowed, (2) rejected, or (3) abandoned.
Patent examiners are given great discretion to reject claims based on thelegal formalities and requirements. For simplicity, this study groups rejectionsbased on issues: (1) internal to the application and (2) external to theapplication (prior art type rejections). Internal issues are flaws within the fourcorners of the application. Examples of internal issues include enablement,written description, indefiniteness, and best mode type rejections. Externalissues are usually third-party references (patent or non-patent literature) thatrender the application non-novel or obvious over the prior art.29
There are requirements that are internal to the application. Typically, theseinclude written description, enablement, definiteness, and/or utility typerejections. To overcome the written description bar, an applicant mustdescribe the claimed invention in sufficient detail that one skilled in the art canreasonably conclude that the inventor had possession of the claimed
26. See generally Patent Technology Centers, U.S. PAT. & TRADEMARK OFF. (Feb. 17,2010, 12:34 PM), http://www.uspto.gov/about/contacts/phone directory/pat tech (definingthe structure of the PTO technology centers).
27. This assignment is usually done in a random fashion. Mark A. Lemley & BhavenSampat, Examiner Characteristics and Patent Office Outcomes, 94 REv. EcON. & STAT. 817,822 (2012) (finding that "[w]ithin subclasses, SPEs for the most part assigned applicationsrandomly, assigning applications to particular examiners on the basis of the last digit of theapplication serial number').
28. Some SPEs will assign applications on the basis of the last digit of the applicationserial number. Other SPEs will assign based on docket management, giving the oldestunassigned application to the examiner who has finished examining a prior application. Id.
29. Prior art is defined generally as references such as a patent, printed publication,public use, on sale or something otherwise available to the public before the effective filingdate of the claimed invention. 35 U.S.C. § 102(a)(1) (2011).
30. See §§ 112(a), 112(a), 112(b), and 101 respectively.

514 STANFORD TECHNOLOGY LAW REVIEW [Vol. 17:507
invention.31 Second, the specification must enable the invention.32 Specifically,the specification must describe how to make and how to use the invention.Third, the application claims must meet a threshold level of clarity andprecision. The claims should define the patentable subject matter with areasonable degree of particularity and distinctness in light of the specification,prior art, and knowledge of the person of ordinary skill in the art at the time theinvention was made.33 Finally, the claimed invention must be useful.Specifically, an applicant must identify a specific, substantial, and credibleutility for the invention.
34
Additionally, there are requirements that affect patentability that areoutside the four corners of the patent application. These issues are typicallybased on "prior art." In general, prior art references disclose the claimedinvention (or parts of the claimed invention) prior to a critical date.35 Anexaminer then searches multiple databases for both patent and non-patentreferences to determine if any references anticipate or render the claimedinvention obvious.3 6 Typically, searches for prior art include prior U.S. patentsand patent applications in relevant technology classes and subclasses, foreignpatent documents, scientific and technical journals, and/or other databases andindexes. Efficient and effective keyword searches of these databases requiresignificant technical knowledge and time.
After reviewing the application specification, claims, and prior art theexaminer then issues a "first action" letter to the applicant. The examiner hastwo choices: (1) allow all or some of the claims in application, and/or (2) rejectall or some of the claims, based typically on the aforementioned rejections. Theapplicant then has no more than six months to respond by amending the claimsand/or arguing against the examiner's rejections. After reviewing theapplicant's response, the examiner can then (1) allow some or all of the claimsin the application if the arguments/amendments traverse the rejection, and/or(2) maintain some or all of the initial rejections, and/or (3) issue new groundsfor rejections based on the amendments/arguments made by the applicant. If theexaminer rejects claims for a second time, the examiner typically responds in a"final" office action. The applicant can then respond to a final office action by
31. § 112(a); see also Vas-Cath, Inc. v. Mahurkar, 935 F.2d 1555, 1563 (Fed. Cir.1991); MPEP § 2163 (9th ed. Mar. 2014), available at http://mpep.uspto.gov/RDMS/detail/manual /MPEP/e8r9/d0e 18.xml.
32. § 112(a); see also Ariad Pharm., Inc. v. Eli Lilly & Co., 598 F.3d 1336, 1344 (Fed.Cir. 2010) (en banc); Vas -Cath, 935 F.2d at 1563; MPEP, supra note 31, § 2164.
33. § 112(b); see also MPEP, supra note 31, § 2173.02.34. § 101; see also In re Fisher, 421 F.3d 1365, 1372 (Fed. Cir. 2005); MPEP, supra
note 31, § 2107.01.35. See MPEP, supra note 31, § 901 (describing what qualifies as prior art); see also §
102. The author notes that the critical date for prior art will change slightly based on passageof the Leahy-Smith America Invents Act, Pub. L. No. 112-29, 125 Stat. 284 (2011) (to becodified at scattered sections of 35 U.S.C.). However, that discussion is beyond the scope ofthis Article.
36. See §§ 102-103; see also MPEP, supra note 31, §§ 2131, 2164.

Winter 2014] PATENT EXAMINERS & LITIGATION
(1) filing a request for continued examination (RCE), which effectively allowsthe applicant one more round of review/responses with the examiner; (2) filinga continuation or a continuation in part application; (3) appealing theexaminer's decision; or (4) abandoning the application (simply by either notresponding within the six-month time period or expressly abandoning theapplication via a letter to the FfO).
B. Patent Examiners
Patent examiners vary in many respects. The most important differencesamong examiners are (1) experience at the PTO, (2) technical backgrounds, (3)art units, (4) workload and production goals, and (5) supervision and review.
Experience at the PTO varies dramatically. Primary examiners are usuallymore senior examiners with at least five years of experience, and usually havepartial or full signatory authority.37 Junior examiners are usually classified as"secondary examiners." Secondary examiners usually have less than five yearsof experience and do not have signatory authority. Each secondary examiner ispaired with a primary examiner who directly supervises and edits the workproduct generated by the secondary examiner. Over time, the secondaryexaminer takes greater control over his docket and may graduate to a primaryexaminer with "partial" signatory authority.
Technical backgrounds between examiners also vary radically. Certain artunits may require an advanced degree or more specialized training. Forexample, because of the technical nature required to examine applicationsdealing with antibody engineering and cancer immunology many examiners inArt Unit 1642 (biotechnology applications) have Ph.D.'s. In contrast,examiners in Art Unit 3636, which deals with chairs and seats, may not requirean advanced degree to understand the technology.
Variations in art unit practices also greatly affect examiner behavior. Someart units promote specialization by individual examiners. For example, inmechanical art units, a small group of examiners may be responsible for allpatent applications within a specific class or subclass. Accordingly, in these artunits, there is less supervision and fewer checks and balances on the examiner.In contrast, some art units rely on group organization. In these art units there isless technical specialization but an increased amount of group discussion,knowledge sharing, and collective thought between examiners. Accordingly,there are greater opportunities for monitoring and supervision as well as greaterknowledge transfer between examiners.38
Workload and production goals are one of the most significant differencesamong examiners, even within the same art unit. Examiners are allotted fixed
37. In general, signatory authority allows an examiner to respond to the applicantwithout further review. An allowance, however, still could be verified through qualitycontrol (QC) regardless of whether the allowance was by a secondary or primary examiner.
38. Cockburn, et al., supra note 19.
STANFORD TECHNOLOGY LAW REVIEW [Vol. 17:507
amounts of time to initially examine an application and for disposal of theapplication. As an examiner becomes promoted, the amount of time allotted forexamining an individual application is reduced. Regardless of technologycenter, the 100% benchmark is at the General Schedule (GS) GS-12 payscale.3 9 For example, a junior examiner who is a GS-10 (two levels under GS-12) may have to reach only 85% of the disposals required by a similar examinerin the same art unit who is a GS-12. Similarly, a senior examiner who is a GS-14 (two levels over GS-12) may have to reach 110% of the disposals requiredby a similarly situated GS-12 in the same art unit. Accordingly, primaryexaminers may have significantly less time to review an application comparedto a secondary examiner. This shorted time period may play an important role,especially for a detailed search for prior art. Differences in these timeallocations and percentages vary across technology centers, but are alwaysrelative to the GS-12 level in that art unit.40
Oversight and review is another significant difference among examiners.Examiners can be sorted into four groups: (1) secondary examiners with nosignatory authority, (2) secondary examiners with partial signatory authority,(3) primary examiners with temporary full signatory authority, and (4) primaryexaminers with full signatory authority. Secondary examiners, by definition,have no signatory authority, which means that all substantive office actions arereviewed by their supervisor before going out to the applicant. Secondaryexaminers with partial signatory authority can sign off most office actionswithout supervision, but are specifically reviewed by a primary examiner whenthey issue a final office action or an allowance.4 1 Primary examiners withtemporary full signatory authority can sign off on all actions,42 but arescrutinized for at least approximately six months (thirteen consecutive payperiods).43 Finally, primary examiners with full signatory authority can sign offon all actions without supervision.
An examiner must complete the Signatory Authority Review Program toachieve the position of primary examiner. The examiner's work is evaluatedduring two separate periods (partial signatory authority period and full
39. Telephone Interview with Senior Patent Examiner, U.S. Patent & TrademarkOffice (June 2013). The GS salaries and wages scale are determined by the U.S Office ofPersonnel Management.
40. Ron D. Katnelson, My 2010 Wishes for the U.S. Patent Examiner 5 (Jan. 8, 2010)(unpublished manuscript) (suggesting that the average production goal is set at 19.5 GS-12equivalent hours, based on the 1976 PTO annual report), available athttp://works.bepress.com/rkatznelson/60; see also id. at 8 fig.5 (showing PTO examinationhours per patent production unit by technology workgroup).
41. See MPEP, supra note 31, § 1005 (listing actions which cannot be delegated to anexaminer with partial signatory authority, thus requiring the signature of a primaryexaminer).
42. See id. § 1004 (listing actions which require the attention of a primary examiner.).43. Letter to All Patent Examiners from Edward E. Kubasiewicz, Assistant
Commissioner for Patents, regarding the Signatory Authority Program (Dec. 1, 1992) (onfile with author).
516

Winter 2014] PATENT EXAMINERS & LITIGATION
signatory authority period) to determine if the examiner is qualified topennanently represent the Director and sign all actions independently. Thelength of each trial period is at least thirteen consecutive pay periods(approximately six months), but can go longer. Additionally, for each step, theexaminer must perforn at least 700 hours of actual examination time. Uponcompletion of the first review period, the examiner can progress from GS-13 toGS-13 Partial Signatory Authority (PSA). Subsequently, when the secondreview period is completed, the examiner can move from GS-13 PSA to GS-14Full Signatory Authority (FSA) if the examiner performs at the "fullysuccessful" level in the PSA for at least ten consecutive weeks.44
Interestingly, U.S. patent examiners seem to issue patents at the same rateas their European and Japanese counterparts. According to the PTO, during2010 and 2011 the percentage of patents granted was approximately 44%.4 Inthe European Patent Office (EPO), the percentages of patents granted in 2010and 2011 were 38% and 43%, respectively. The Japanese Patent office (JPO)grant rates during the 2010 and 2011 years were 64% and 76%, respectively.Therefore, US patent examiners issue patents at a rate comparable to their EPOand JPO counterparts, even though US examiners examine more than twice thenumber of claims,4 6 while receiving a compensation package that is only about58% of EPO examiners and less than 50% of JPO examiners.47 Unsurprisingly,the annual staff turnover rate at the PTO was about 30% in 2008.48 In contrast,the turnover rate at the EPO was between 3-5%, and the turnover rate at theJPO was 0-3%.49
44. Design examiners undergo a slightly different review process. They start thepartial signatory authority program six months after receiving their promotion to GS-12.Examiners must be at 95% fully successful for the eleven weeks prior to starting theprogram. The PSA program lasts thirteen consecutive bi-weeks, each of which is fourteendays long, and requires that the PSA candidate finish the program at fully successful andwith no less than 700 examining hours during the trial period. The FSA program for designexaminers begins automatically after thirty-five consecutive pay periods after promotion toGS-13, as long as the examiner is performing at the fully successful level or higher. The FSAlasts thirteen consecutive pay periods, and must include 700 examining hours. Successfulcompletion of the FSA grants the examiner full signatory authority and promotion to GS-14.Telephone Interview with Senior Patent Examiner, supra note 39; see also Letter fromEdward E. Kubasiewicz, Assistant Commissioner For Patents to All Patent Examiners (Dec.1, 1992) (explaining the process for promotion to full signatory authority).
45. U.S. Patent Statistics Chart Calendar Years 1963-2013, U.S. PAT. & TRADEMARKOFF. (Mar. 26, 2014), http: //www.uspto.gov/web/offices/ ac/ido/oeip/taf/us stat.htm.
46. Pierre Picard & Bruno van Pottelsberghe de la Potterie, Patent Office Governanceand Patent System Quality 8 tbl.1 (Ctr. for Research & Econ. Analysis, Discussion Paper2011-06, 2011).
47. Id. at 12 tbl.4.48. Id. at 13.49. Id. at 13-14 & tbl.5 (showing that job satisfaction could be tied to different
compensation packages, types governance structures, tenured contracts, unionization rates,and severance clauses).

STANFORD TECHNOLOGY LAW REVIEW [Vol. 17:507
II. EXISTING LITERATURE
Intellectual property rights have become a crucial part of our nation'seconomy. However, as noted above, many patents fail to attain economicsuccess. Accordingly, many scholars have attempted to quantify thosecharacteristics that are common among litigated and/or valuable patents.5 0
However, many scholars come to the conclusion that patent litigation isuncertain and unpredictable.5 1 As noted above, it is uncontested that the FfOwields an enormous budget and oversees a large number of employees.However, the unanswered question is whether the PTO is issuing good patentsor not.
Many scholars have attempted to find common characteristics betweenlitigated patents. However, only a few focus on the examiners who issuelitigated patents,52 and those rare studies focus mainly on the patents that havebeen litigated to a CAFC-issued final decision. In contrast, this study focuseson examiners who issue litigated patents from all district courts and segmentsthe examiners by experience at the FfO as well as volume of patents issued.Below is a summary of some of the literature dealing with examinercharacteristics and litigation outcomes, as well as some of the literature thatdetails those characteristics in common with "valuable" patents.
Cockburn, Kortum, and Stem previously linked examiner characteristics tolitigation outcomes.5 3 This study was based on 182 patents from the Court ofAppeals for the Federal Circuit between 1997 and 2000. Cockburn et al. foundthat some examiners have a higher litigation rate at the CAFC than otherexaminers. Specifically, they discovered that there is substantial variation inexaminer experience, tenure, and the degree of forward citations (i.e.referenced more often by subsequent patents).4 Additionally, they explainedthat examiner experience and workload do not affect the probability that theCAFC will find a patent invalid. Finally, they found that patents which arefrequently cited have an increased probability of being found invalid by theCAFC.
Allison, Lemley, Moore and Trunkey (ALMT) examined characteristics ofvaluable patents by reviewing characteristics of patents litigated between 1999and 2000 (6,861 patents).5 5 In sum, ALMT found that valuable patents (1) arelitigated soon after obtained, (2) are owned by domestic companies, (3) areissued to individuals or small companies, (4) cite to more prior art, (5) are
50. See, e.g., Chien, supra note 1; Allison & Lemley, supra note 1; Allison, Lemley &Walker, supra note 1.
51. See, e.g., Janicke, supra note 1, at 93-94; Mossinghoff & Dunner, supra note 1, at432-33. For a competing opinion, see Sichelman, supra note 1, at 1188-89.
52. Cockburn et al., supra note 19.53. Id.
54. Id. at 28-30.55. Allison, Lemley, Moore & Trunkey, supra note 1, at 437.
518

Winter 2014] PATENT EXAMINERS & LITIGATION
referenced more often by subsequent patents ("forward citations"), (6) includemore claims, and (7) are disproportionately represented from certainindustries.56 Furthennore, in a follow-up study, Allison, Lemley and Walker(ALW) found that the "most-litigated" patents also have interestingcharacteristics. In sum, ALW found that the most litigated patents (1) had morepatent continuations, (2) are cited more than twice as often,57 (3) include morethan 50% more claims,58 (4) cite to more prior art (including nearly three timesas many U.S. and foreign patents, and almost ten times as many non-patentprior art references),59 (5) are cited more than twice as often by subsequentpatents, (6) are disproportionately represented from certain industries,6 1 and(7) are more likely to be owned by non-practicing entities.62
The Allison and Lemely (AL) study6 3 reviewed 299 patents litigated in 239different cases between 1989 and 1996 resulting in a final decision and awritten opinion.64 Of the patents reviewed, 54% (162 patents) were found
65valid, while 46% (138 patents) were found invalid. AL further segmented theinvalid patents and found that of the 138 patents that were found invalid, 26.8%were held invalid by § 102 prior art, 31% were held invalid by § 102 non-priorart, and 42% were held invalid by § 103 obviousness.6 6 Juries held valid morethan two-thirds of the patents tried before them.67 In contrast, only one quarterof the cases decided on pre-trial motion were decided in favor of the patentee.68
Interestingly, the AL study found that the majority of patents litigated camefrom "run-of-the-mill mechanical inventions" and not chemical or electricalinventions.69 Additionally, the AL study found that even though approximately42-48% of the patents issued in 1995 were of foreign origin, only 14% of thelitigated patents were of foreign ownership.70 Uncited prior art is more likely to
56. Id. at 438.57. Allison, Lemley, & Walker, supra note 1, at 14.58. Id. at 15 (finding that the most-litigated patents contain 39.3 claims on average
compared to 24.5 claims for once-litigated patents).59. Id.60. Id. at 14.61. Id. at 18 (showing that the most-litigated patents are mostly software patents); see
also Allison, Lemley, Moore & Trunkey, supra note 1, at 438.62. Allison, Lemley, & Walker, supra note 1, at 26; see also Michael Risch, Patent
Troll Myths, 42 SETON HALL L. REv. (2012) (arguing that patents enforced by non-practicingentities are similar to many other litigated patents).
63. I note that the AL study covers many other issues that I do not review in thissummary. I have only summarized those issues germane to this paper. A complete summaryof their findings can be found at Allison & Lemley, supra note 1, at 251-52.
64. Id. at 194.65. Id. at 205.66. Id. at 208.67. Id. at 212.
68. Id.69. Id. at 217.70. Id. at 226.

STANFORD TECHNOLOGY LAW REVIEW [Vol. 17:507
invalidate a patent than previously cited art.7 1 Finally, patent litigation involvedpatents that were fairly old and patented for several years before enforcement.72
Lanjouw and Schankerman also published several studies linkinginfonnation on patent suits from the U.S. court system to the detailedinfonnation about inventions and their owners.73 Lanjouw coded forcharacteristics such as number of claims, IPC assignments, citations, ownership(nationality and type of ownership: corporate or individual), and case types(patent owner as plaintiff or defendant).74 Generally, the authors found thatthere is an increased probability of patent litigation if the patent is core to a setof follow-on innovations for a corporation (as opposed to an individual).Additionally, the authors found that litigated patents are much more frequentlycited75 and have far more claims76 than the control group.
Colleen Chien also published a study analyzing some of the characteristicsof litigated patents versus non-litigated patents.77 In this study, Chien generatesa model for predicting the patents that are most likely to be litigated based on acombination of intrinsic and acquired patent file characteristics. Intrinsic traitsinclude characteristics such as number of claims, issuance to small entity orlarge entity, number of foreign counterparts, number of family members,78 andtime spent in prosecution.7 9 Acquired traits include characteristics such asownership (including whether the patent has been subsequentlyassigned/transferred and changes in owner size80 ), investment (includingmaintenance fee payment, reexamination, and/or reissue), collateralized(security interest in the patent), financing, forward citations, and enforcement(including licensing and/or litigation). 81 Focusing on acquired traits, Chien'sstudy found that litigated patents are more likely to (1) be transferred, (2)experience a change in owner size, (3) undergo ex parte reexamination, (4)have maintenance fees paid, (5) be collateralized, and (6) be cited. 82
71. Id. at 233.
72. Id. at 237.
73. Lanjouw & Schankerman, Characteristics, supra note 1; Lanjouw &Schankerman, Patent Quality, supra note 1; Lanjouw & Schankerman, Protecting IP, supranote 1.
74. Lanjouw & Schankerman, Characteristics, supra note 1, at 133-34.75. Id. at 137.76. Id. at 141.
77. Chien, supra note 1; see also Kesan,. Schwartz & Sichelman, supra note 1;Petherbridge, supra note 1.
78. Chien, supra note 1, at 299. (Professor Chien also analyzed "ancestor" patents fromwhich the patent claimed priority and "descendant" patents that claimed the benefit ofpriority.)
79. Id. at 298-99.
80. See 37 C.F.R. § 1.27 (2013) (defining small entity status, as well as change inowner size from small entity to large entity or vice versa).
81. Chien, supra note 1, at 299-301.82. Id. at 317.
520
Winter 2014] PATENT EXAMINERS & LITIGATION
III. DESCRIPTION OF STUDY
This study examines the "overall population" (OP) of litigated patents. Thedataset includes all patents that were litigated in 2010 and 2011 that we couldkey to their corresponding patent examiner. The dataset is not segmented bythose patents held invalid or valid, or infringed or non-infringed. It is alsoimportant to note that this study analyzes the incidence and characteristics ofcase filings. Because the vast majority of patent cases do not reach finaljudgment, we focus on all patent case filings in this study.
Additionally, the datasets are defined in terms of patents, not cases. Manycases reviewed had more than one patent in question. Accordingly, we revieweach of those patents as an independent unit for analysis.83
A. Overall Population (OP) Dataset
This study coded for every litigation that "terminated" in 2010 to 2011.Thus, any case that ended in either district court or the Federal Circuit wascoded. The dataset includes 12,923 litigations that corresponded to 15,161patents matched to 11,748 patent examiners.84 This Article focuses only onvalidity decisions based on United States issued patents. Because we focus onissued patents, the dataset does not include appeals from the rejection of apatent application by the PTO Board of Patent Appeals and Interferences(BPAI).85 Additionally, we do not include decisions of foreign courts ordecisions or appeals from the United States International Trade Commission(ITC). Finally, it is important to note that this data set is a highly selectivesample, and not representative of the majority of patents granted.
This dataset significantly differs from that described in Cockburn et al.because Cockburn et al. included only "CAFC-tested" patents that reached afinal appellate decision.86 In contrast, this dataset includes not only thosepatents appealed to the Federal Circuit, but also those patents whose litigation
83. When necessary, this analysis was bifurcated even further by independent claimsin each patent. For example, if in one patent, a set of claims were held valid while anotherset of claims were held invalid, we broke this down into two different patents for purposes ofour analysis.
84. See supra note 18. Accordingly, 3,413 patents fell outside of our examinerdatabase. The examiner database included only those patents that issued between January 1,2001 and July 15, 2011. Thus, many of the patents that were not included were issued beforeJanuary 1, 2001.
85. BPAI appeals were not included because the standard of review for appeals fromthe BPAI introduces data that are not completely comparable with the data derived frominfringement actions in the district courts or the Federal Circuit. For example, the burdens ofproof and the nature of the parties are dissimilar. Additionally, as noted by Allison et al.,other problems include (1) the ex parte nature of the BPAI proceedings, (2) the absence ofjuries, and (3) the absence of the presumption of validity. See Allison & Lemley, supra note1, at 195 n.23.
86. Cockburn et al., supra note 19.

STANFORD TECHNOLOGY LAW REVIEW [Vol. 17:507
terminated in the district court system. However, Cockburn et al. were able tolink overall examiner experiences (in terns of years as well as total number ofissued patents) with the litigated patents. In contrast, this study is limited toexaminer information gleaned from the last ten years of issued patents.87
One might argue that a more accurate determination may be to use theaverage number of patents issued by a specific examiner during the year thelitigated patent was issued. However, the average number of patents issued peryear gives a more accurate view of the examiner's allowance profile because itis not a snapshot, but a moving average of the examiner's allowance rate overthe examiner's career at the PTO between 2001 and 2012.
B. Examiner Dataset
In a previous study, we created a database of every patent issued between2001 and 2012.88 The collection, limitations, and interpretation of this databasehave also previously been described.89 Briefly, we coded for every patentissued between January 2001 and June 2012 (approximately 1.7 millionpatents). Each patent was matched with a specific "working" examiner.90 Anaverage number of patents issued per year could be calculated for eachexaminer by simply summing the "number of patents issued"9 1 divided by the"years of service" as an examiner.92 The examiner database includes onlyutility patents and is unfiltered for continuations, CIPs, divisional applications,and applications directed at foreign filings. Plant, design, reexamination andreissue patents are not included in this dataset.
Each patent that was litigated in the OP database was matched with theexaminer database that was previously created. Accordingly, the OP databasecontains a profile of examiners who issued patents that later underwentlitigation.
87. Our examiner dataset includes only data starting from January 2001, which is theearliest timeframe for which electronic records regarding specific examiners were kept.
88. Tu, supra note 1.89. See id. at 54-63.90. The "working examiner" is the examiner who did the most direct work on that
application: the secondary examiner (if present) or the primary examiner if there was nosecondary examiner.
91. The "number of patents" issued includes all patents issued by the specificexaminer between January 2001 and July 2012.
92. The "years of service" does not include those years where the examiner issues onlyone patent. This was done to remove examiners that could fall within these categories: (1)those examiners who were only briefly at the PTO, but left before issuing more than onepatent, (2) those examiners who are primary examiners who mainly review the work ofsecondary examiners but issued one patent by themselves, (3) those examiners who haveissued one patent, but have not issued any since, (4) those examiners hired at the end of theyear, who may have issued only one patent due to the ramp up time, and (5) examiners whocame back to the PTO and needed time to ramp up during their return year.
522
Winter 2014] PATENT EXAMINERS & LITIGATION
C. Data Collected
For each patent in the OP dataset, we collected the following data points, tothe extent that it could be detennined from the court's opinion:
case name and citation;patent number and art unit;secondary and/or primary examiner's name;years of examination experience;average time it takes the specific examiner to issue a patent;title of examiner93 at the time the patent issued;filing date of patent; andissue date of the patent.
D. Hypothesis to Be Tested
The OP database was used to determine which examiners were issuinglitigated patents. We first wanted to determine if there was a correlationbetween examiner allowance rates and frequency of litigation. Severalhypotheses were tested using this database:
Hypothesis 1: Patent examiners who issue patents at the highest rate (thosepatent examiners who issue more than eighty patents per year) will issue morepatents that end up in litigation.
The hypothesis is that these high-volume examiners will end up inlitigation more often because they are "rubber stamping" patents,94 and thus arenot completing a thorough review of the prior art or specification, and aregranting broader claims.
Hypothesis 2: Patent examiners who issue at a very low rate (those patentexaminers who issue less than ten patents per year) will issue relatively fewerpatents that end up in litigation.
The hypothesis in this case is that these examiners will end up in litigationat a lower rate because they are able to spend more time reviewing and findingprior art as well as completing a thorough analysis of the specification.
Hypothesis 3: Patent examiners who have the least experience will havemore litigated patents than those examiners with four or more years ofexperience.
Similar to Hypothesis 2, we segment the data based not on allowance rates,but on years of experience at the PTO to determine if there is a higher rate of
93. The title of the examiner could fall into one of three categories: (1) Primary, (2)Secondary, or (3) Both. The "Both" category simply means that the year that the patentissued, the examiner was a primary on some patents and a secondary examiner on otherpatents.
94. See Mark A. Lemley & Bhaven Sampat, Is the Patent Office a Rubber Stamp?, 58EMORY L.J. 181 (2008).

524 STANFORD TECHNOLOGY LAW REVIEW [Vol. 17:507
litigation for those examiners early in their career versus later in their career.
E. Limitations
The OP database is a broad database but suffers from some selection biasdue to the examiner-matching step. Specifically, temporal selection bias occursin the OP database since the examiner database contains only those patents thatwere issued between 2001 and 2012. Accordingly, litigations dealing with"older patents" (i.e., those patents issued before 2001) are not included in theOP database.
There are also many inherent limitations with using a litigation-baseddatabase. For example, litigated patents may inherently represent asubpopulation of patents with unique characteristics.9 5 Additionally, there aremany variables associated with litigation in general; for example, theexperience and skill of the lawyers, differing jury pools, the experience of thejudges (experience with both patent cases and the specific technology inquestion), witnesses, and resources available to both parties.9 6 Accordingly, itis important to note that this subpopulation of patents is not representative ofmost patents that are issued.
Finally, there are many reasons to bring litigation, but many of thesereasons may not represent errors by the patent examiner. For example, a patentcould be litigated and found invalid because of inequitable conduct. In thissituation, the patent examiner may have issued a valid patent based on thefraudulent information given to her by the applicant. Another example dealswith a patent that was found valid, but non-infringed. Here, the litigated patentmay have been correctly issued, but litigated due to incorrect interpretation ofthe scope of the claims. Accordingly, simply because a patent is litigated, doesnot mean that there were errors made at the patent office.
To address these issues, we are currently working on a study that reviewsonly those patents that have been litigated to final judgment and found invalid.We then connect these invalidated patents to their corresponding examiners todetermine if there are any common characteristics among the examiners whoissue invalidated patents. However, we note that the pool of litigations that arelitigated to final judgment dramatically reduces the sample size.
IV RESULTS
A. Statistical Analysis
To determine whether the actual count of litigations was significantlydifferent than the weighted average, we calculated the 95% confidence
95. Allison & Lemley, supra note 1, at 203; Chien, supra note 1, at 283.96. Allison & Lemley, supra note 1, at 204.

Winter 2014] PATENT EXAMINERS & LITIGATION
intervals for both actual and weighted average distributions. Each confidenceinterval is centered around the actual count and the weighted average count foreach observed data point and is visually represented by a vertical linedesignating the range of the interval. When the confidence interval of the actualobservation overlaps with the confidence interval of the expected count, nosignificant difference between the two is detected. However, when the twoconfidence intervals are not overlapping at a particular data point, thedifference between the two confidence intervals is significant at that specificdata point (p < 0.05).
The examined data is assumed to follow a Poisson distribution because (a)Poisson is a model for counting successes (number of litigations) and (b) theobservation of successes (number of litigations) in each interval isindependent. 97 The mean of every Poisson distribution is usually utilized tocalculate confidence intervals. However, when the mean is unknown, the actualcount value (X) in each observational point (in this case number of litigations)can be used as an estimate. As a result, the following formula was utilizedwhere z =1.96 corresponds to a 95% confidence interval:
X + Za/2I"f
In its nature, the Poisson distribution is non-normal,98 being skewedlimited by zero on the left because count data cannot be negative andapproaching infinity on the right.99 However, the Poisson distributionapproximates the normal distribution when X is large,1° ° as it is in this case.The Poisson distribution is the most common and frequently utilized model foranalyzing count data relative to the number of occurrences of a specificphenomenon.101
B. General
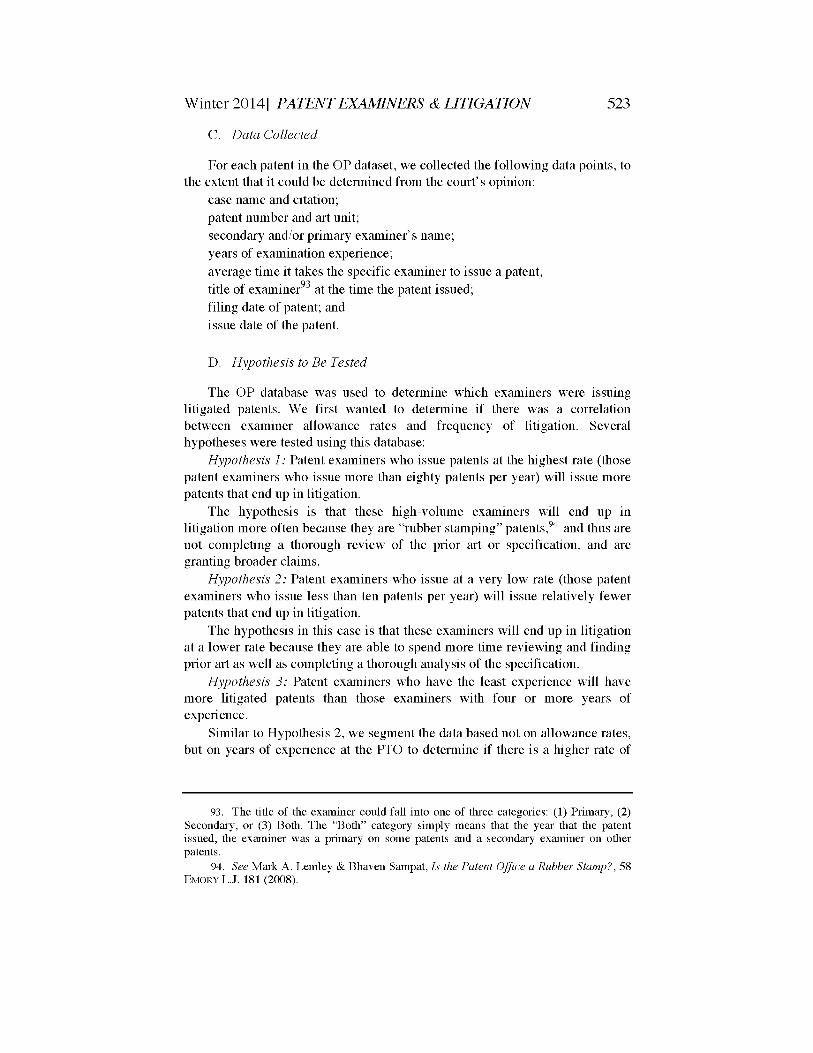
As a preliminary matter, we examined the frequency of litigation betweentechnology centers. Because we did not need to match patent examiners toanswer this question, we used the full database, which includes all litigationsfrom 2010 and 2011. As shown in Figure 1, the most litigated patents comefrom technology center 2600 (Communications). The art units are coded as
97. A. COLIN CAMERON & PRAVIN K. TRIVEDI, REGRESSION ANALYSIS OF COUNT DATA
(2d ed. 2013).98. DEREK BISSELL, STATISTICAL METHODS FOR SPC AND TQM (1994).
99. GERRY P. QUINN & MICHAEL J. KEOUGH, EXPERIMENTAL DESIGN AND DATA
ANALYSIS FOR BIOLOGISTS 11 (2002).
100. ANWER KHURSHID & 1JARDEO SAHAI, STATISTICS IN EPIDEMIOLOGY: METHODS,
TECHNIQUES, AND APPLICATIONS (1996).
101. Manad Khamkong, Approximate Confidence Interval for the Mean of PoissonDistribution, 2 OPEN J. STAT. 204 (2012).

526 STANFORD TECHNOLOGY LAW REVIEW [Vol. 17:507
follows102:
102. Patent Technology Centers, supra note 26.
Winter 2014] PATENT EXAMINERS & LITIGATION
Technology Center
Technology Center 1600Technology Center 1700Technology Center 2100
Technology Center 2400
Technology Center 2600Technology Center 2800
Technology Center 2900Technology Center 3600
Technology Center 3700
Technology Type
Biotechnology and Organic ChemistryChemical and Materials EngineeringComputer Architecture, Software, and InformationSecurityComputer Networks, Mutliplex communication,Video Distribution and SecurityCommunicationsSemiconductors, Electrical and Optical Systemsand ComponentsDesignsTransportation, Construction, ElectronicCommerce, Agriculture, National Security andLicense & ReviewMechanical Engineering, Manufacturing, Products
Note that Technology Center 2700 wasCenters 2100 and 2600 to accommodateapplications. 103
subdivided into Technologygrowth in computer-related
Figure ]
3500
" 3000
0- 2500
m 2000bb~
_ 15000
1000E= 500z
1600 1700 2100 2400 2600 2700
Art Units
2800 2900 3600 3700
U
103. Wynn Coggins, Technology Center 2700 Splits to Accommodate Growth inComputer-Related Applications, USPTO TODAY, Nov. 2000, at 12, available athttp://www.uspto.gov/web/offices/ac/ahrpa/opa/ptotoday/ptotodayl 1 .pdf.

STANFORD TECHNOLOGY LAW REVIEW [Vol. 17:507
Previously Allison, Lemley, and Walker predicted that the most litigatedpatents are "more likely to be software and telecommunications patents, notmechanical or other types of patents."04 This study confirms their finding.However, we also find that a significant number of litigated patents come fromTechnology Center 1600 (Biochemistry and Organic Chemistry). We note thatour dataset is based solely on the art unit. In contrast, the data in Allison,Lemley and Walker were categorized by hand into an industry and technologygroup. 105
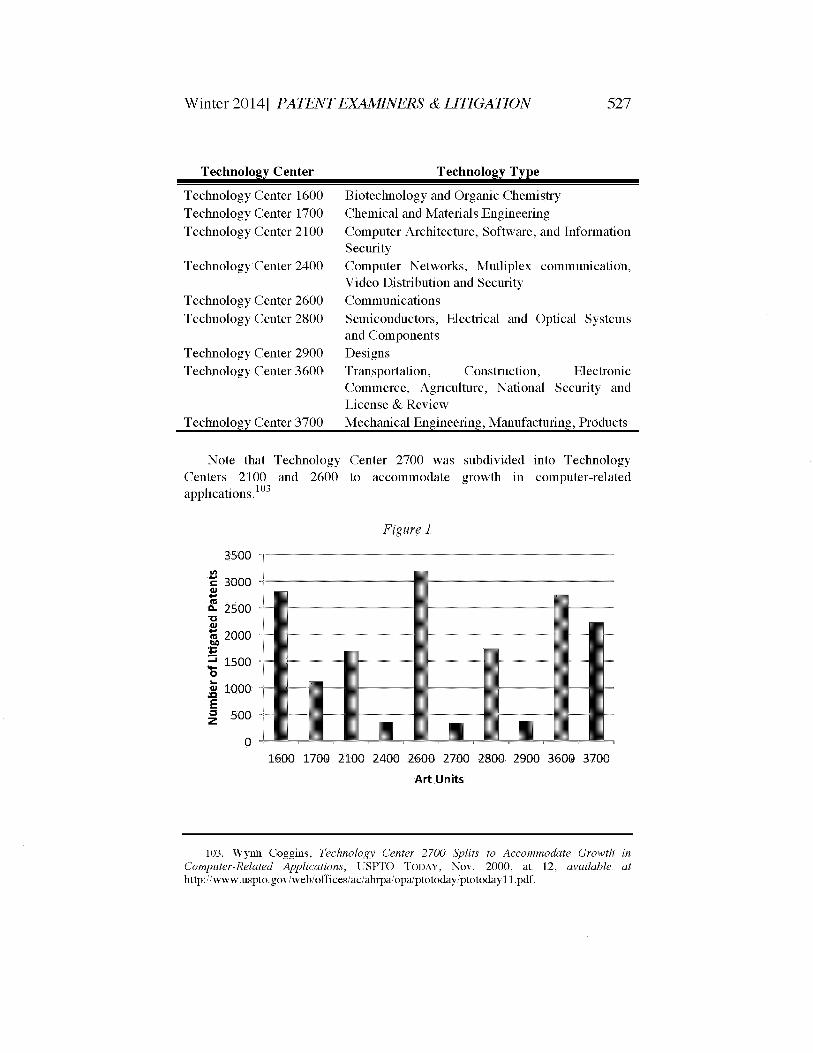
Figure 2 shows the type of examiners (primary or secondary examiners)that are issuing patents that later get litigated. These data required us to matchlitigations to specific examiners. Accordingly, we reviewed 15,161 litigatedpatents and matched them to 8,274 primary examiners, 2,349 secondaryexaminers and 1,125 examiners who were both primary and secondaryexaminers at the time the patent was issued. Primary examiners are issuinglitigated patents at a much higher frequency than secondary examiners, withprimary examiners issuing approximately 70% of the litigated patents, whilesecondary examiners issue approximately 20% of the litigated patents. Thisresult is somewhat unsurprising because primary examiners are issuing manymore patents than secondary examiners. We later control for this factor asshown in Figures 4 and 5. Finally, as shown in Figure 2, approximately 10% ofthe litigated patents are issued by examiners who were "both" primary andsecondary examiners. This smaller population "both" represents the fact thatsome examiners were transitioning from secondary to primary status and wereissuing patents as both a secondary and primary. Accordingly, the "both"category includes examiners who were most likely promoted from a secondaryexaminer to a primary examiner during the year the litigated patent issued.
104. Allison, Lemley & Walker, supra note 1, at 3.105. Id. at 6; see also John R. Allison & Mark A. Lemley, Who's Patenting What? An
Empirical Exploration of Patent Prosecution, 53 VAND. L. REv. 2099, 2114 (2000) (arguingthat the PTO classification system is flawed).
528
Winter 2014] PATENT EXAMINERS & LITIGATION 529
Figure 2
8000Primary
7000
C 6000
-, a- 5000
M 4000
300006 Secondary
2000
E Both= 1000z
0Type of Examiners on Litigated Patents
C. The Overall Population (OP) Database
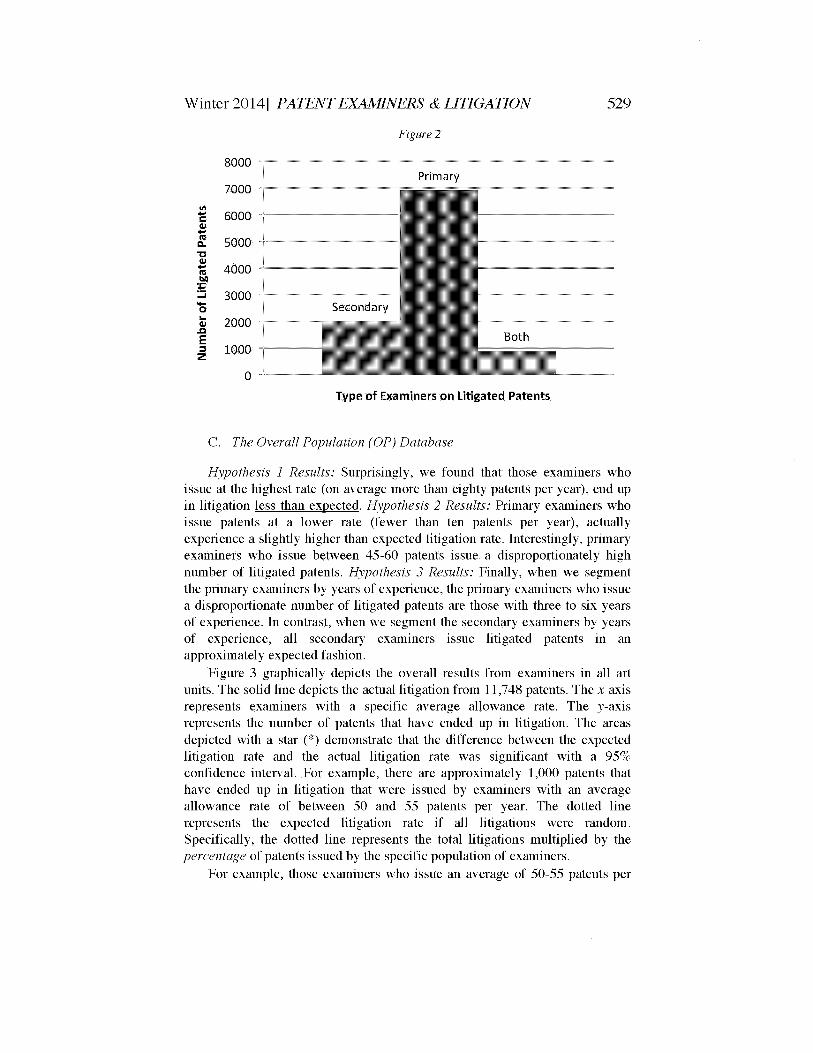
Hypothesis I Results: Surprisingly, we found that those examiners whoissue at the highest rate (on average more than eighty patents per year), end upin litigation less than expected. Hypothesis 2 Results: Primary examiners whoissue patents at a lower rate (fewer than ten patents per year), actuallyexperience a slightly higher than expected litigation rate. Interestingly, primaryexaminers who issue between 45-60 patents issue a disproportionately highnumber of litigated patents. Hypothesis 3 Results: Finally, when we segmentthe primary examiners by years of experience, the primary examiners who issuea disproportionate number of litigated patents are those with three to six yearsof experience. In contrast, when we segment the secondary examiners by yearsof experience, all secondary examiners issue litigated patents in anapproximately expected fashion.
Figure 3 graphically depicts the overall results from examiners in all artunits. The solid line depicts the actual litigation from 11,748 patents. The x-axisrepresents examiners with a specific average allowance rate. The y-axisrepresents the number of patents that have ended up in litigation. The areasdepicted with a star (*) demonstrate that the difference between the expectedlitigation rate and the actual litigation rate was significant with a 95%confidence interval. For example, there are approximately 1,000 patents thathave ended up in litigation that were issued by examiners with an averageallowance rate of between 50 and 55 patents per year. The dotted linerepresents the expected litigation rate if all litigations were random.Specifically, the dotted line represents the total litigations multiplied by thepercentage of patents issued by the specific population of examiners.
For example, those examiners who issue an average of 50-55 patents per

530 STANFORD TECHNOLOGY LAW REVIEW [Vol. 17:507
year issued approximately 6.24% of the total number of patents issued between2001 and 2012. Accordingly, if litigation was simply random, they shouldrepresent 6.24% multiplied by the total number of litigations (which isrepresented by the dotted line). Thus, when the dotted line is below the solidline, examiners are issuing litigated patents at a higher than expected rate.Conversely, when the dotted line is above the solid line, examiners are issuinglitigated patents at a lower than expected rate.
Figure 3
All Examiners
1 2 0 0 ................... t ......1000
0M 800
-b .... .....
0
z T sO a D-1 r-IA -4 M~ f Lfl WD N 00 O) C C C
Patents per Year (Grouped by 5's)
....... Weighted Average - Actual
As shown in Figure 3, examiners can be divided into three distinctpopulations. The first population includes those examiners who issue patents ata high rate (on average greater than 80 patents per year). This first population isissuing fewer than expected litigated patents. The second population includesthose examiners who issue patents at a lower rate (on average 35 patents or lessper year). This second population is issuing litigated patents at approximatelythe expected rate. Finally, the third population includes those examiners whoissue patents at a rate of between 40-65 patents per year. This third populationof examiners is issuing litigated patents at a higher than expected rate.
The results from the first population (examiners issuing on average greaterthan 80 patents per year) are expanded in Figure 3A. The results from the firstpopulation are surprising because one might expect that the highest volumeexaminers (those examiners who might be "rubber stamping" patents) may notbe reviewing patents as closely or searching the prior art as carefully as otherexaminers who spend more time on each application with less patent issuanceper year. However, these highest volume examiners are actually doing muchbetter than expected. Specifically, these examiners issue a lower than expectednumber of litigated patents. One possible explanation for this phenomenon may

Winter 2014] PATENT EXAMINERS & LITIGATION
be that these are the most experienced examiners, and thus they are veryfamiliar with the prior art, and can quickly administer the correct rejectionswhile allowing cases. Alternatively, it could be that these examiners candetermine which patent applications are commercially valuable, and are able tofilter out and allow only those patent applications that are not likely to belitigated.
Figure 3A
All Examiners Issuing 80 or morePatents per Year
°i0- 5 0 ............50 0................ ....
J0, . 4 04 ..............0............0 ...........;.....................................................................................................................................
.............* t.......
eee
*, *
C Ll C Lfl C Ll 0 Lfl 0
L) ) - -4 0 4 0M,00 -L- L Lf -0 Lf-
O) 0 0 s- -A (NJ r14s-A s-I s 1-I s-A -
Patents per Year (Grouped by 5's)
....... Weighted Average - Actual
The results from the second population (examiners issuing on average lessthan 35 patents per year) are expanded in Figure 3B. The second population isissuing litigated patents at a rate statistically proportional to the number ofpatents issued by this population. In general, these examiners are spendingmore time to issue a lower volume of patents.106 These results might beunexpected; because these examiners are issuing at a lower rate, one mightexpect that these examiners are conducting more comprehensive reviews of
106. Tu, supra note 16, at 17, fig. 3.

STANFORD TECHNOLOGY LAW REVIEW [Vol. 17:507
patent applications. However, one explanation is that these examiners consistlargely of secondary examiners, who are still inexperienced, and thereby morecareful because they are reviewed not only by quality control examiners, but bytheir supervising examiners.
Figure 3B
All Examiners Issuing less than 35Patents per Year
Patents per Year (Grouped by 5's)....... Weighted Average - Actual
The results from the third population (those examiners who issue onaverage between 40-65 patents per year) are expanded in Figure 3C.Interestingly, the results from the third population may also be explained bylevel of experience. We may see a higher litigation rate for these examinersbecause they have full signatory authority and are working independently for.... 107
the first time, but may still need guidance. Compounding the problem, theseprimary examiners with full signatory authority have a corresponding decreasein available examination time and increase in production rates. Thus, tocompensate, these examiners may be allowing cases from their docket that theywould not have issued given a lower production rate. This effect is morepronounced when we segment the data by years of service as a primaryexaminer. "'
107. See also infra Part IV.E (segmenting examiners by years of service).108. Id.
532

Winter 2014] PATENT EXAMINERS & LITIGATION
Figure 3C
All Examiners Issuing between 40and 65 Patents per Year
1200
1000
.......... .....
Patents per Year (Grouped by 5's)
....... Weighted Average Actual
D. Segmentation by Primary Versus Secondary Examiners
We segmented these overall results into two categories: (1) primaryexaminers and (2) secondary examiners. Accordingly, Figures 4 and 5 depictlitigated patents by primary and secondary examiners, respectively, who issuelitigated patents at specific rates.
Interestingly, as shown in Figure 4, primary examiners who issue patents ata rate lower than 40 patents per year are issuing litigated patents at a higher ratethan expected. Additionally, primary examiners who issue more than 80 patentsper year are issuing litigated patents at a lower rate than expected.

534 STANFORD TECHNOLOGY LAW REVIEW [Vol. 17:507
Figure 4
Primary Examiners900 ..
800
2 7000*M 600
500*** *
0B 400*
n 300 42 0 0 .......... ........... .................... ....I ... .......... .
100 .1 0 ........ ....... ....."r """ l"Il""'lIl"IlIf , - 1 11F"
0
Patents per Year (Grouped by 5's)
....... Weighted Average - Actual
One possible explanation for this phenomenon is that the examiners whoissue patents at the highest rate are the examiners with the most experience.Thus, these high rate examiners know how to quickly and correctly reject orgrant patents based on their knowledge of the prior art and patentabilitystandards. These high volume examiners may represent the best of both worlds,that is, granting valid patents and reducing the backlog of applications, allwhile avoiding costly litigation.
Another possible explanation for this phenomenon is that high volumeexaminers are not simulating innovation, but simply know how to filter outcommercially valuable patents to avoid issuing litigated patents. Thus, it ispossible that these examiners are simply better able to select out those patentapplications that may be litigated or broad enough to encompass competitors'commercial embodiments. This type of selection bias is difficult to control.Specifically, without examining each individual patent and comparing eachpatent against control patents (those issued by lower volume examiners), it isimpossible to determine if this selection bias is occurring.
As shown in Figure 5, we segment the data to assess secondary examiners.The general trend that higher volume examiners issue less litigated patentswhile lower volume examiners issue more than expected litigated patents alsoholds true for secondary examiners, albeit to a lesser extent. As shown inFigure 5, the magnitude of this result is less significant when applied tosecondary examiners. This may be unsurprising because the population of

Winter 2014] PATENT EXAMINERS & LITIGATION 535
secondary examiners is self-selecting. That is, those examiners who have themost experience will become primary examiners. Accordingly, the populationof highly experienced secondary examiners is small.
Figure 5
Secondary Examiners350
kA 300C.p 250 *'
bb200 I *
150100
50z 0
Patents per Year (Grouped by 5's)
....... Weighted Average Actual
E. Segmentation by Years of Service
The data was then segmented into the primary and secondary examiners byyears of service. Accordingly, Figures 6 and 7 depict litigated patents byprimary and secondary examiners segmented by the number of years of serviceat the PTO when the patent was litigated. 109
Interestingly, as shown in Figure 6, it was not the primary examiners withthe least experience (less than 2 years) who were issuing the highest number oflitigated patents. The examiners with 3-6 years of experience were issuing adisproportionate number of litigated patents. One explanation could be thatwhen an examiner first becomes a primary examiner, the examiner is still underreview.
To obtain permanent full signatory authority, an examiner must first gothrough a four-step program: (1) the examiner is granted temporary partialsignatory authority, (2) the examiner is granted permanent partial signatory
109. Years of service means issuing at least one patent per calendar year. To determinetotal years of service, we simply totaled lip the total number of years where the examinerissued at least one patent per calendar year.

536 STANFORD TECHNOLOGY LAW REVIEW [Vol. 17:507
authority, (3) the examiner is granted temporary full signatory authority, andfinally (4) the examiner is granted permanent full signatory authority. Thispartial signatory authority process takes at least 13 bi-weeks, or approximatelysix months, but could take more time depending on whether the examinerwishes to move to the next phase. When the partial signatory program iscomplete, then the examiner can be granted temporary full signatory authority.Again, the process to move from temporary full signatory authority topermanent full signatory authority can take more than six months to complete.Additionally, when an examiner has partial signatory authority or temporaryfull signatory authority, that examiner undergoes more scrutiny. Accordingly,the additional scrutiny during the first few years as a primary examiner couldact as a gatekeeper for litigated patents.
Figure 6
Primary Examiners
2000 *
0*r 1500* * **
21000o
E 500
0<1 1 2 3 4 5 6 7 8 9 10 >10
Years of Service
In contrast, primary examiners who have permanent full signatoryauthority (usually years 3 and above) are no longer heavily scrutinized.Compounding this problem is the fact that production rates increase whenprimary examiners acquire full signatory authority (usually an examiner movesto a GS-14 after gaining permanent full signatory status). Specifically, whenexaminers move to GS-14, they are usually required to produce at least 135%over the GS-12 benchmark.1 11 Thus, new primary examiners who have
110. See also supra Part I.B.iii. Additionally, there are other programs that could increase both the pay rate and the
production requirements of a primary examiner with permanent full signatory authority. Forexample, "Expert Level" rating will raise an examiner to a GS-15 level and require 150% ofthe GS-12 production numbers. Additionally, a "Senior Level" rating will raise an examinerto a GS-15 level and require 40% of the GS-12 production numbers. Finally, a "Generalist"or "Ph.D." credit can raise the full signatory authority examiner to a GS-15 level but will

Winter 2014] PATENT EXAMINERS & LITIGATION
permanent full signatory authority are in the new position of increasedproduction rates while experiencing reduced supervision. Accordingly, theseprimary examiners (usually with more than 2-3 years of experience as aprimary examiner) may issue those applications on their docket that they wouldhave been hesitant to allow beforehand. This phenomenon is supported by thefact that these applications that are "on the fence" might be more litigated thanmost patents. This is because strong patents could be allowed quickly by theexaminer, and competitors would most likely need to license these patents,thereby avoiding litigation. Correspondingly, weak patents might take longer toissue, but would most likely not be litigated because of their weak standing.However, applications where validity is unclear may require litigation. Theseunclear applications may be issued at a higher rate when the primary examinerfirst receives full signatory authority (without supervision), thereby explainingthe higher litigation rates in years 3-6. This explanation would comport withthe selection bias described by Priest-Klein. 112
Interestingly, primary examiners in years 4-6 steadily decrease the numberof litigated patents they issue. This could be because the numbers of unclearapplications are depleted from their docket. Alternatively, primary examinerswith more experience may be simply getting better at filtering outcommercially valuable patents as discussed in Part IV.B above. Most likely, itis a combination of these two factors.
As shown in Figure 7, secondary examiners issue litigated patents byexperience almost exactly as expected. That is, secondary examiners issuelitigated patents as a function of percentage patents issued. Again, thepopulation of secondary examiners who have more than five years ofexperience is self-excluding because the most experienced secondaryexaminers are most likely to become primary examiners.
keep the examiner at 135% of the GS-12 production numbers. These programs can take oneto five years to clear before credit is given.
112. George L. Priest & Benjamin Klein, The Selection of Disputes for Litigation, 13 J.LEGAL STUD. 1 (1984); George Priest, Selective Characteristics of Litigation, 9 J. LEGALSTUD. 399 (1980).

538 STANFORD TECHNOLOGY LAW REVIEW [Vol. 17:507
Figure 7
Secondary Examiners500
*ro 400 . 4.. *
bIA• 300 *
0 200
E 100
0<1 1 2 3 4 5 6 7 8 9 10 >10
Years of Service
F. Segmentation by Technology Centers
We segmented the data by specific technology centers in Appendix A. Forexample, Figure 8 represents the number of litigated patents from TechnologyCenter 3700 (Mechanical Engineering, Manufacturing and Products). Althoughnot all points along the spectrum are significant, the general trend holds true.Specifically, (1) examiners who issue patents at a lower rate are issuinglitigated patents at a rate similar to random chance, (2) examiners who issuepatents at a higher rate issue litigated patents at a lower than expected rate, and(3) those examiners who issue between 50 and 75 patents per year issuelitigated patents at a higher than expected rate.

Winter 2014] PATENT EXAMINERS & LITIGATION 539
Figure 8
3700 Tech Center20
%0
z d nrn& d L d nwwNNd o oa& O& CC s,- s- N C's- s 1 C 1 CJ Cfl Cf - - bL fl W WJ N0 N 00 oo oo o"Ll C Lfl C Lfl C
Patents per Year (Grouped by 5's) s- - - I
0Weighted Average
G. Segmentation by Workgroup
Finally, we segmented the data by workgroup, focusing on thoseworkgroups that contained a disproportionate number of litigated patents. Wefound some workgroups that could be targeted for secondary review, therebypossibly lowering the issuance of litigated patents. Targeting specificworkgroups and examiners within these specific workgroups for secondaryreview may be a cost effective means to decrease the number of litigatedpatents issued by the Patent Office.
One example is Workgroup 2610 (Digital Communications, GeneralCommunications, Optical Communications, Telephony, Audio, MultiplexCommunications, Cellular Telephony, Radio, and Satellite Communications) inTechnology Center 2600 (Computer Architecture, Software and InformationSecurity). The total number of litigated patents in Technology Center 2600 isshown in Figure 9a. Interestingly, many of the litigated patents are comingfrom W~orkgroup 2610, which encompasses digital communications, Figure 9b.More specifically, many of these litigated patents are coming from examinerswho issue on average between 55 and 70 patents per year. One solution may be
to target these examiners for quality review more frequently to ensure qualitycontrol.
A second example is Workgroup 3720! 1 (Manufacturing Devices andProcesses, Machine Tools, and Hand Tools) in Technology Center 3700
(Mechanical Engineering, Manufacturing and Products). The total number of
113. Art Units 3721 (Sheet Material Container Making, Package Making, ElongatedMember Driving, Tool Driving or Impacting) and 3728 (Shoes, Special Receptacle orPackage) are not included in this workgroup because they are included in Workgroup 3713
(Sheet Container Making, Package Making, Receptacles Shoes, Apparel, and Tool Drivingor Impacting).
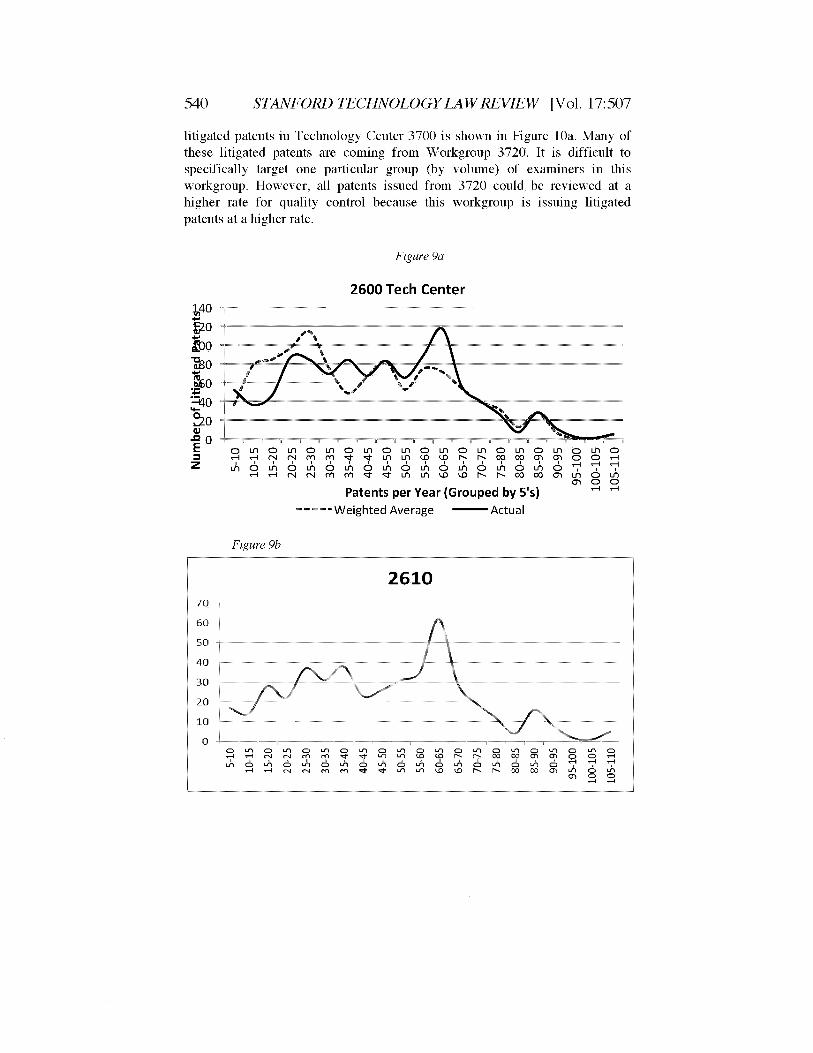
540 STANFORD TECHNOLOGY LAW REVIEW [Vol. 17:507
litigated patents in Technology Center 3700 is shown in Figure 10a. Many ofthese litigated patents are coming from Workgroup 3720. It is difficult tospecifically target one particular group (by volume) of examiners in thisworkgroup. However, all patents issued from 3720 could be reviewed at ahigher rate for quality control because this workgroup is issuing litigatedpatents at a higher rate.
Figure 9a
2600 Tech Center
o Lfl 0 Lfl 0 Lfl 0 Mf 0 Mf 0 Mf 0 Mf 0 Mf 0 Mf 0 Mf 0_-4 1 1 T T Lfl Lfl W' W' 1- 1- 00 0 OP o 0 0 '-1
Lfl 0Mf 0 Mf 0 Mf 0 Mf 0 Mf 0 Mf 0 Mf 0 Mf 0
Patents per Year (Grouped by 5s) ' '
----- Weighted Average Actual
Figure 9b
2610
CD~ CD J C) In C> In CDI CD In CD In CD n CD 'n CD 'n CD
-- 0D 'n CD Ln 0D Ln 0D L CD Ln CD L) CD L 0D CD 74~ _q 4 'J M r'I In D 0 r" f"0 03 M f In C I
M CD0:q-4
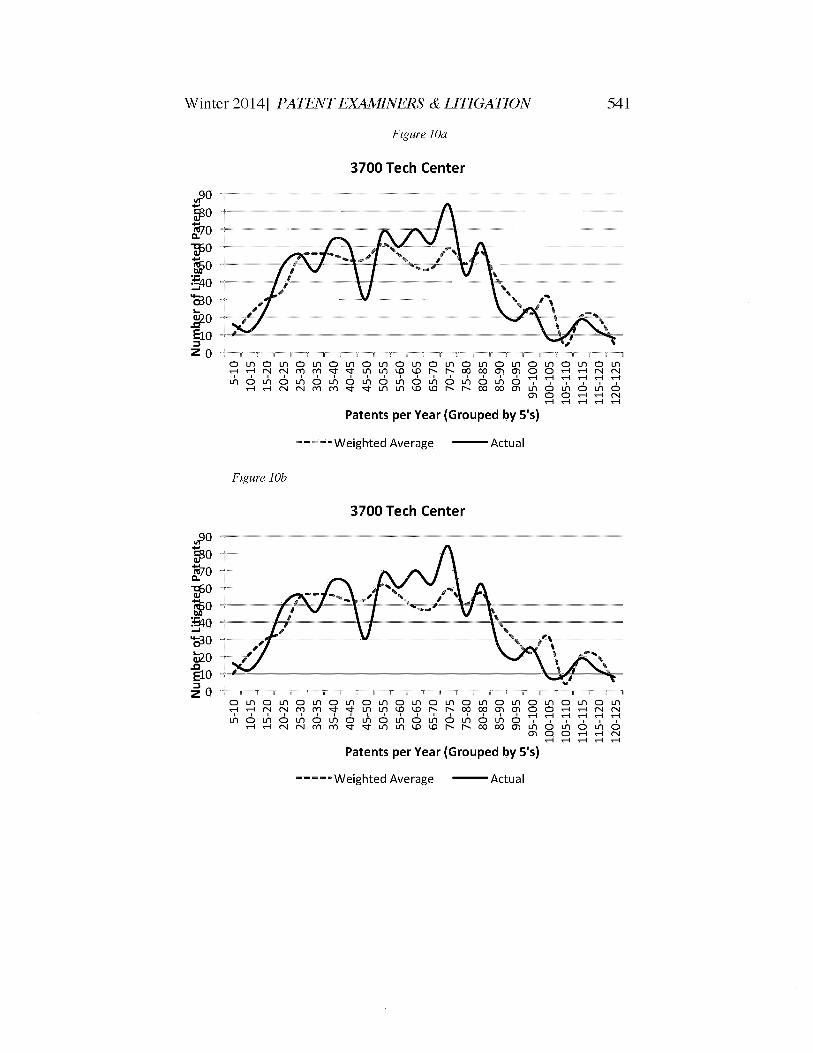
Winter 2014] PATENT EXAMINERS & LITIGATION
Figure l0a
3700 Tech Center
o Lfl 0 Lfl 0 Lfl 0 Lfl 0 Lfl 0 Lfl 0 Lfl 0 Lfl 0 Lfl 0 LflT~ T- ' - LA U? W1 1- 1- 1- 00 Op OpM 0 0 -1 '-1 r--
LA 0 LA 0 LA 0 LA 0 LA 0 LA 0 LA 0 -
~ ~~ A A W~ ~0000O~LA0-A 0A -A 0A
Patents per Year (Grouped by 5's)
--- Weighted Average - Actual
Figure 10b
3700 Tech Center
o LA 0 mA 0 mA 0 mA 0 mA 0 mA 0 mA 0 mA 0 mA 0 mA 0 mA 0 mA~~ 1 1- r1- A A' 9 r- r- Op 0 O M M 0 0 r-4 r-4
LA~~0 0 LA 0A LA 0rA0L-0L4 A0 A0L- ~ LALAW ~~ 0 0 A 0-A 0A LA 0A
Patents per Year (Grouped by 5's)
----- Weighted Average -Actual
o Lfl 0 Lfl
Lfl 0 Lfl 0,-A '-A r-
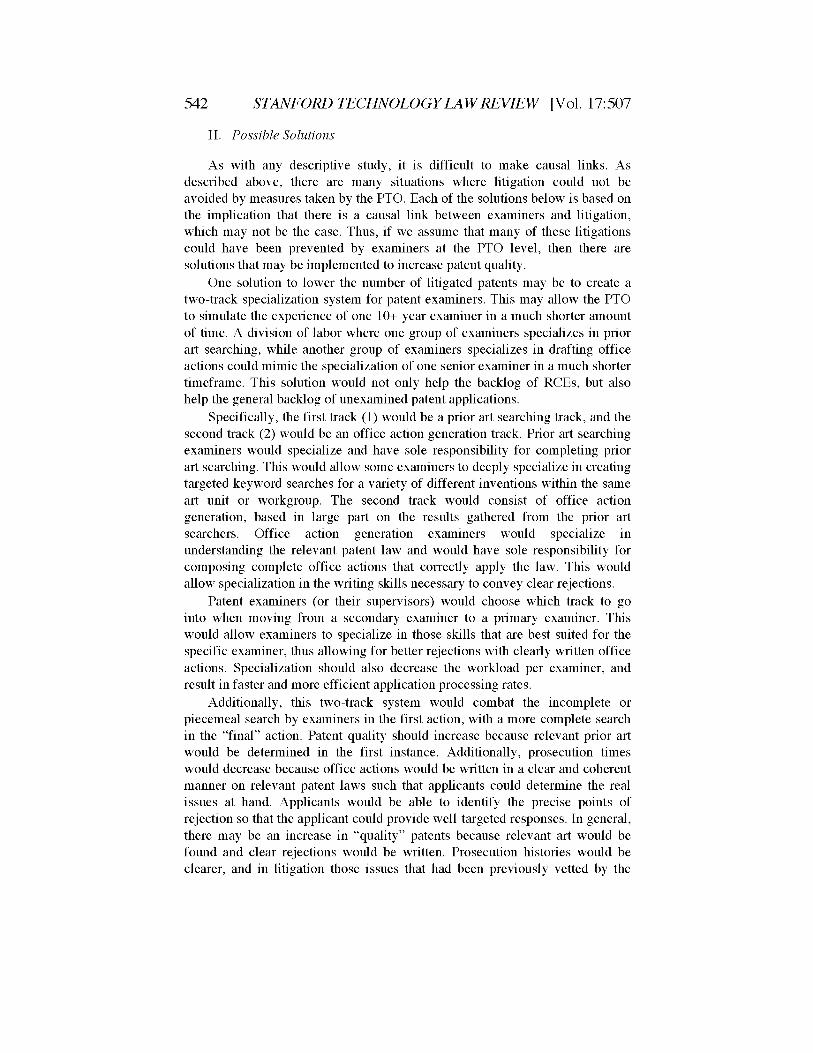
STANFORD TECHNOLOGY LAW REVIEW [Vol. 17:507
H. Possible Solutions
As with any descriptive study, it is difficult to make causal links. Asdescribed above, there are many situations where litigation could not beavoided by measures taken by the PTO. Each of the solutions below is based onthe implication that there is a causal link between examiners and litigation,which may not be the case. Thus, if we assume that many of these litigationscould have been prevented by examiners at the FfO level, then there aresolutions that may be implemented to increase patent quality.
One solution to lower the number of litigated patents may be to create atwo-track specialization system for patent examiners. This may allow the PTOto simulate the experience of one 10+ year examiner in a much shorter amountof time. A division of labor where one group of examiners specializes in priorart searching, while another group of examiners specializes in drafting officeactions could mimic the specialization of one senior examiner in a much shortertimeframe. This solution would not only help the backlog of RCEs, but alsohelp the general backlog of unexamined patent applications.
Specifically, the first track (1) would be a prior art searching track, and thesecond track (2) would be an office action generation track. Prior art searchingexaminers would specialize and have sole responsibility for completing priorart searching. This would allow some examiners to deeply specialize in creatingtargeted keyword searches for a variety of different inventions within the sameart unit or workgroup. The second track would consist of office actiongeneration, based in large part on the results gathered from the prior artsearchers. Office action generation examiners would specialize inunderstanding the relevant patent law and would have sole responsibility forcomposing complete office actions that correctly apply the law. This wouldallow specialization in the writing skills necessary to convey clear rejections.
Patent examiners (or their supervisors) would choose which track to gointo when moving from a secondary examiner to a primary examiner. Thiswould allow examiners to specialize in those skills that are best suited for thespecific examiner, thus allowing for better rejections with clearly written officeactions. Specialization should also decrease the workload per examiner, andresult in faster and more efficient application processing rates.
Additionally, this two-track system would combat the incomplete orpiecemeal search by examiners in the first action, with a more complete searchin the "final" action. Patent quality should increase because relevant prior artwould be determined in the first instance. Additionally, prosecution timeswould decrease because office actions would be written in a clear and coherentmanner on relevant patent laws such that applicants could determine the realissues at hand. Applicants would be able to identify the precise points ofrejection so that the applicant could provide well-targeted responses. In general,there may be an increase in "quality" patents because relevant art would befound and clear rejections would be written. Prosecution histories would beclearer, and in litigation those issues that had been previously vetted by the
542

Winter 2014] PATENT EXAMINERS & LITIGATION
examiner would be distinct.There are several possible limitations with this two track system. Foremost,
this division of labor would limit the "office action generation" examiners'knowledge of the relevant prior art, and therefore dull their ability to gauge thenovelty / non-obviousness of the invention.
The Japanese Patent Office (JPO) has embraced a variation of this modelby outsourcing its prior art searches. 114About 65% of all examined applicationsin 2010 (about 246,000 applications) were searched using an outsourced searchcompany.1 15 This outsourced search cost the JPO approximately $236 million,which represents approximately 40% of the direct cost of patentexamination.116 Interestingly, a study done by Yamauchi and Nagoka hasshown that outsourcing the prior art search led to decreased appeals againstrejection decisions as well as increased speed of examination.117 Althoughmost of the outsourced applications did not deal with "complex" technologies,Yamauchi and Nagoka argue that this outsourcing has led to not only increasedspeed, but also increased patent quality. 1 18
A second possible solution to increase the number of "quality" patentswould be to increase the number of experienced examiners. These data suggestthat one way to increase the number of "quality" patents is to retain patentexaminers to leverage their higher experience levels. A previous report hasshown that the percentage of examiners with less than three years' experiencehas grown from less than 50% in 1996 to about 80% in 2009.119 In contrast, thepercentage of examiners with ten or more years of experience has decreasedfrom 20% to less than 10% in the same period. These data are particularlydisturbing in light of the fact that it takes approximately three years for anexaminer to become proficient at searching and familiar with the nuances ofpatent law.
Finally, a third possible solution to decrease the number of litigated patentswould be to increase the length of time primary examiners are supervised.Alternatively, full signatory authority might be given only after the sixth yearas a primary examiner. This solution may, however, only simply delay thenumber of litigated patents to a period of time when the primary examinerbecomes independent.
114. Isanu Yamauchi & Sadao Nagaoka, Does the Outsourcing of Prior Art SearchIncrease the Efficiency of Patent Examination? (Institute of Innovation Research,Fitotsubashi Univ., Working Paper WP#13-12, 2013).
115. Id. at 2.116. Id.
117. Id. at 3.118. Id.
119. Dennis Crouch, Patent Examiner Experience Levels, PATENTLYO (Feb. 5, 2010),http:/ /www.patentlyo.com/patent/2010 02/patent-examiner-experience-levels.html.

544 STANFORD TECHNOLOGY LAW REVIEW [Vol. 17:507
V CONCLUSIONS
Patent litigation goes to the heart of the incentive structure established bythe patent system. However, patent litigation is costly and time consuming. Asdiscussed in Part I, previous studies have focused on patent characteristics thatmay lead to an increased chance of litigation. However, few studies havefocused on examiner characteristics that may lead to an increased likelihood oflitigation.
This study suggests that not all patent examiners issue litigated patents atthe same rate. As an initial matter, when we segment the data by secondaryexaminer, we find that secondary examiners are issuing litigated patents atapproximately the expected rate. In contrast, when we segment the data byprimary examiners, we find that primary examiners, who have 3-6 years ofexperience or issue on average between 45 and 65 patents per year, issuelitigated patents at a higher rate than expected. Furthermore, certainworkgroups within specific technology centers issue litigated patents at higherrates than other workgroups. These data suggest that some groups of examinersand some workgroups should be scrutinized more heavily before allowingapplications to issue as patents.
Interestingly, primary examiners who issue patents at the highest rate andhave the most years of experience are issuing litigated patents at a much lowerthan expected rate. One explanation is that this population of examiners isbetter able to quickly filter out commercially valuable patents. Alternatively, itcould be that this population of examiners is simply better able to determinethose claims that are too broad in scope, and/or do not meet the patentabilitystandards.
Finally, we note that there are many reasons why firms choose to engage inpatent litigation. However, some litigations are baseless and do not result ininvalidation of the patent. Thus, simply filing a patent suit may not be the idealmeasure of patent quality. To address this issue, we are currently creating adatabase that contains every patent that was litigated to final judgment from2010-2011. However, the major limitation to this new database is that thepower is greatly reduced because sample size is diminished (fromapproximately 15,000 to approximately 300).

Winter 2014] PATENT EXAMINERS & LITIGATION
APPENDIX A
1600 Tech Center
o Lfl 0 Lfl
Lfl 0 Lfl 0
o Lfl 0 mf 0 mf 0 mf 0 mf 0 mf 0 mf 0 mf 0 mf 0 mf 01- 1' Op Ofl Mf M - 0 0 ~ 0 0 -1 -4 -
M0 0 -A -A r- -
Patents per Year (Grouped by 5's)
----- Weighted Average - Actual
1700 Tech Center
Patents per Year (Grouped by 5's)
--..- Weighted Average

STANFORD TECHNOLOGY LAW REVIEW [Vol. 17:507
2100 Tech Center
0 L 0 Lm 0 LA 0 LA 0 LA 0 LA 0 LA 0 LA 0 m 0 L 0 L
----- Weighted Average -Actu
2600 Tech Center
m L 0 LA 0 LA 0 LA 0 LA 0 LA 0 LA 0 LA 0 LA 0 LA 0
Patents per Year (Grouped by 5's)
----- Weighted Average -Actual
546

Winter 2014] PATENT EXAMINERS & LITIGATION
2800 Tech Center
Patents per Year (Grouped by 5's)
----- Weighted Average - Actual
3600 Tech Center
0 Ln 0 Lu
Ln 0 L 0-I '-A r-
o Lfl 0 Lfl 0 Lfl 0 Lfl 0 Lfl 0 Lfl 0 Lfl 0 Lfl 0 Lfl 0 Lfl
r-4 M- M Lflf 'z* M M D 00 00 r W~ 0 0 M 0- M(n C C -A - -
- _A -A _ -APatents per Year (Grouped by 5's)
----- Weighted Average - Actual

548 STANFORD TECHNOLOGY LAW REVIEW [Vol. 17:507
3700 Tech Center
90
to
170
0
00 Lfl 0 mf 0 mf 0 mf 0 mf 0 mf 0 mf 0 mf 0 mf 0 mf 0 mf 0 mf
0 .............. ........ '
Patents per Year (Grouped by 5's)
----- Weighted Average - Actual