Embed Size (px)
Citation preview
Patent Applications – Structures, Trends and Recent
Developments 2015
Peter Neuhäusler, Oliver Rothengatter, Rainer Frietsch
Studien zum deutschen Innovationssystem Nr. 4-2016
Fraunhofer Institute for Systems and Innovation Research ISI
February 2016

This study was conducted on behalf of the Expertenkommission Forschung und Innovation (EFI). The results and inter-pretations are the sole responsibility of the institute conducting the study. The EFI exercised no influence on the writing
of this report.
Studien zum deutschen Innovationssystem
Nr. 4-2016
ISSN 1613-4338
Publisher:
Expertenkommission Forschung und Innovation (EFI)
Geschäftsstelle
c/o Stifterverband für die Deutsche Wissenschaft
Pariser Platz 6
10117 Berlin
http://www.e-fi.de/
All rights, in particular the right to copy and distribute as well as to translate this study, are reserved. No part of the work may be reproduced in any form (by means of photocopy, microfilm or any other process), or using electronic systems be saved, processed, duplicated or distributed, without the written permission of the EFI or of the Institute.
Contact address and further information:
Dr. Peter Neuhäusler Fraunhofer Institute for Systems
and Innovation Research ISI
Competence Center Policy and Regions
Breslauer Strasse 48
76139 Karlsruhe
Phone: +49-721-6809-335
Fax: +49-721-6809-176
E-Mail: [email protected]

Contents
I
Contents
0 Summary ....................................................................................................................... 3
1 Introduction .................................................................................................................. 4
2 Data and Methods......................................................................................................... 5
3 Indicators and their Interpretation ............................................................................ 6
4 Core indicators .............................................................................................................. 7
4.1 International Comparisons ........................................................................... 8
4.2 Technology Profiles and Specialization Patterns ...................................... 18
5 Patent Filings and Patent Citations as Performance Indicators for
German Universities ................................................................................................... 21
5.1 Data and Methods ...................................................................................... 23
5.1.1 The Data .................................................................................................... 23
5.1.2 The identification of patents from universities and public research
institutions ................................................................................................. 23
5.2 Results ....................................................................................................... 26
5.3 Summary and conclusions ......................................................................... 35
6 References ................................................................................................................... 36

Contents
II
Figures
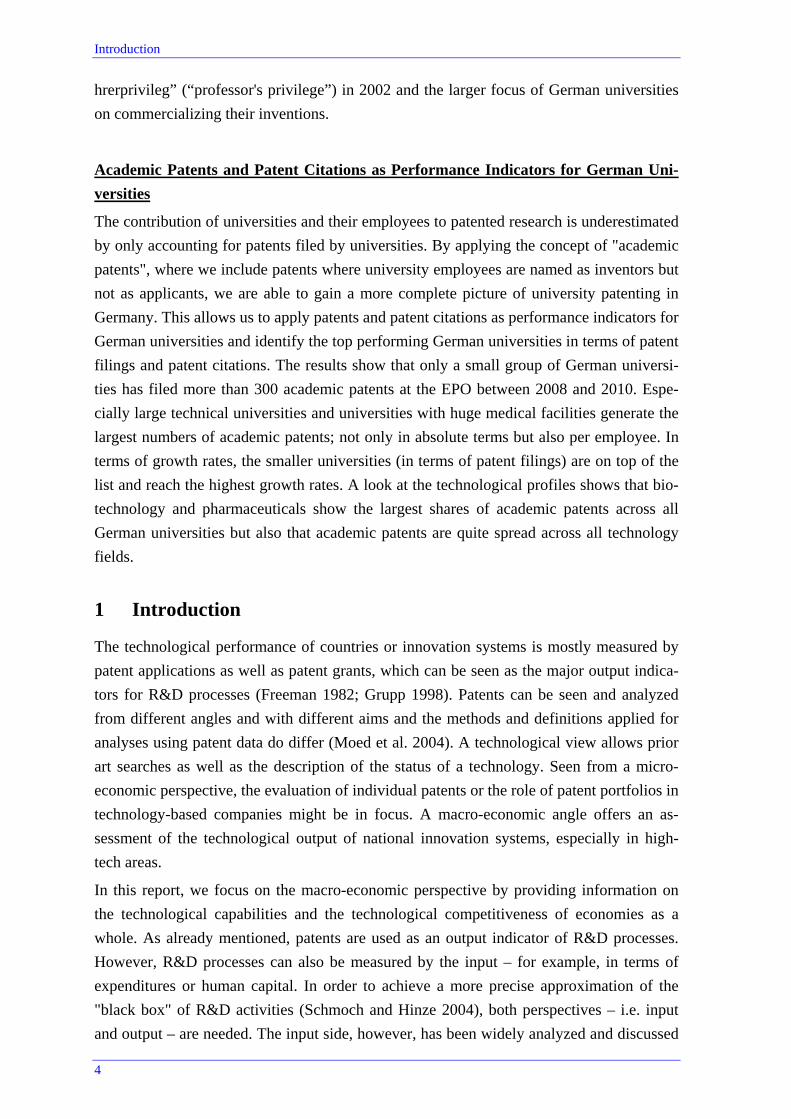
Figure 1: Absolute number of transnational patent applications for selected countries, 1991-2013 ........................................................................................... 9
Figure 2: Shares of high-tech patent applications in total patent applications for selected countries, 1991-2013 ........................................................................... 11
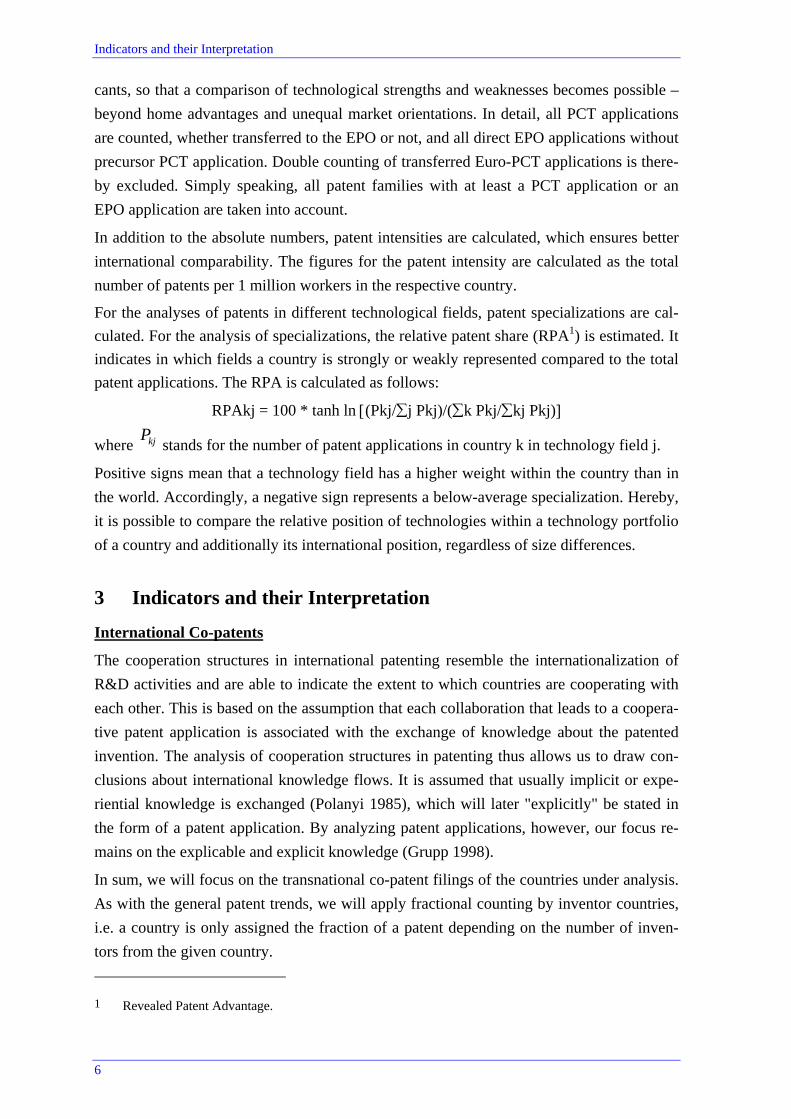
Figure 3: Shares of transnational co-patents in all transnational filings of the respective country .............................................................................................. 13
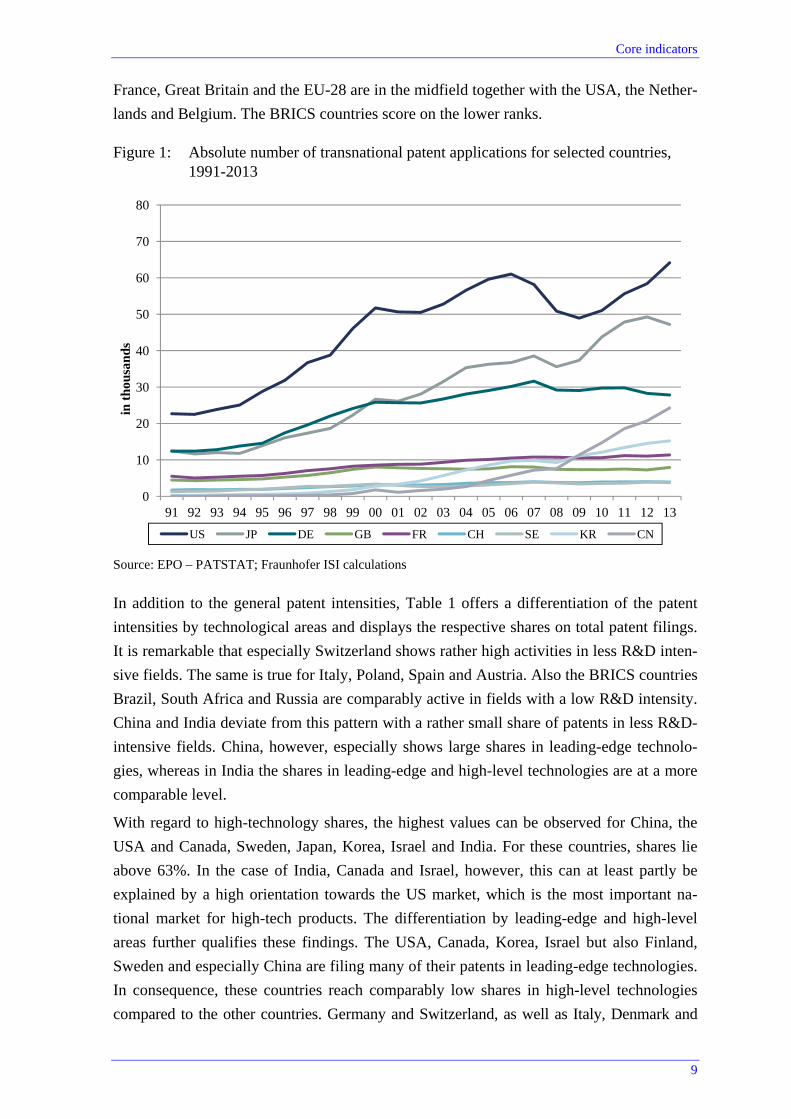
Figure 4: Shares of transnational co-patents in all transnational filings of the respective country .............................................................................................. 13
Figure 5: Number of transnational filings by federal states .............................................. 15
Figure 6: Patent intensities of the German federal states (per 1 million employees) ......................................................................................................... 16
Figure 7: Number of transnational filings by German research organizations ................. 17
Figure 8: Patent intensities (patents per 1,000 employees, full-time equivalents) by German research organizations .................................................................... 17
Figure 9: Germany’s technological profile, 2003-2005 vs. 2011-2013 ............................ 20
Figure 10: Selection criteria for academic patents .............................................................. 23
Figure 11: Estimated number of academic patents and average number of forward citations by German universities, EPO ................................................ 27
Figure 12: Compound Annual Growth Rate (CAGR) of academic patents, EPO, 2006-2010 .......................................................................................................... 30
Figure 13: Technological profile of German universities (total) ........................................ 32
Figure 14: Technological profile of the "Technische Universitaet Muenchen" ................. 33
Figure 15: Technological profile of the "LMU Muenchen" ............................................... 34
Figure 16: Technological profile of the "Freie Universitaet Berlin" .................................. 35
Tables
Table 1 Patent intensities (patent applications per 1m employees) and shares of technological areas, 2013 .............................................................................. 10
Table 2 Transnational Patent applications of Germany according by high-technology sectors (absolute, specialization, and growth), 2011-2013 ............. 19
Table 3 Recall, precision and F-Score ............................................................................ 24
Table 4 Estimated number of academic patents, patent intensities and average number forward citations by German universities, EPO ................................... 28

Summary
3
0 Summary
Core Indicators
The largest technology-providing country at the international level is the USA, where a
comparatively large growth in filings between 2012 and 2013 can be observed. The USA is
followed by Japan, where the opposite seems to be true. The figures have slightly declined
in the last year of the observation period. Germany scores third on this indicator. Here, also
a slight decrease in filings can be observed since 2011. In terms of patent intensities, how-
ever, rather the smaller countries Switzerland, Finland and Sweden are at the top of the list
of the technology-oriented countries analyzed. Japan scores fourth, followed by Germany.
A closer look at high-tech patent filings reveals a rate of about 63% of high-technology
patents in total worldwide patenting in the year 2013. Germany scores fourth on this indi-
cator but has slightly lost ground since 2002 and has fallen behind France in terms of high-
tech shares, although Germany files about twice as many high-tech patents than France in
absolute terms. Yet, Germany, Switzerland, Italy, Denmark are the countries that show the
strictest focus on high-level technologies, while many other countries are more active in
leading-edge technologies. When looking at Germany's country-specific technology pro-
files specializations, i.e. comparative advantages, in three main areas can be observed:
transport (automobiles and engines as well as rail vehicles), machinery and some areas of
electrical engineering like power machines and power generation. Germany also has a very
strong specialization within the field of electrical equipment for internal combustion en-
gines and vehicles.
In terms of international co-patents, the US shows the highest shares in all transnational
co-patents, followed by Germany, Great Britain and France. In relative terms, i.e. when
looking at the shares of transnational co-patents in all transnational patents of the respec-
tive inventor country, however, smaller countries like Belgium, Switzerland and Ireland
reach the highest values. Germany only has a rather low internationalization when regard-
ing this indicator, which is also true for the US.
The regionalization of German patent filings shows that Baden-Württemberg and Bavaria
are the largest German "Bundesländer" with regard to the number of patent filings, fol-
lowed by North-Rhine Westphalia. These three German regions account for about two
thirds of the German transnational filings, while only half of the employees are located in
these countries, i.e. the patent intensity is also comparably high. The Northern and Eastern
German states score at the lower ranks, seen from an absolute as well as a relative perspec-
tive.
The analysis of filings by universities and public research institutes shows that the number
of transnational patent filings has been increasing during the last 10 years. The growth is
even more pronounced for universities than for public research institutes. This has led to a
convergence in the number of patent filings between universities and public research insti-
tutes in the recent years, which can be attributed to the abolishment of the “Hochschulle-
Introduction
4
hrerprivileg” (“professor's privilege”) in 2002 and the larger focus of German universities
on commercializing their inventions.
Academic Patents and Patent Citations as Performance Indicators for German Uni-
versities
The contribution of universities and their employees to patented research is underestimated
by only accounting for patents filed by universities. By applying the concept of "academic
patents", where we include patents where university employees are named as inventors but
not as applicants, we are able to gain a more complete picture of university patenting in
Germany. This allows us to apply patents and patent citations as performance indicators for
German universities and identify the top performing German universities in terms of patent
filings and patent citations. The results show that only a small group of German universi-
ties has filed more than 300 academic patents at the EPO between 2008 and 2010. Espe-
cially large technical universities and universities with huge medical facilities generate the
largest numbers of academic patents; not only in absolute terms but also per employee. In
terms of growth rates, the smaller universities (in terms of patent filings) are on top of the
list and reach the highest growth rates. A look at the technological profiles shows that bio-
technology and pharmaceuticals show the largest shares of academic patents across all
German universities but also that academic patents are quite spread across all technology
fields.
1 Introduction
The technological performance of countries or innovation systems is mostly measured by
patent applications as well as patent grants, which can be seen as the major output indica-
tors for R&D processes (Freeman 1982; Grupp 1998). Patents can be seen and analyzed
from different angles and with different aims and the methods and definitions applied for
analyses using patent data do differ (Moed et al. 2004). A technological view allows prior
art searches as well as the description of the status of a technology. Seen from a micro-
economic perspective, the evaluation of individual patents or the role of patent portfolios in
technology-based companies might be in focus. A macro-economic angle offers an as-
sessment of the technological output of national innovation systems, especially in high-
tech areas.
In this report, we focus on the macro-economic perspective by providing information on
the technological capabilities and the technological competitiveness of economies as a
whole. As already mentioned, patents are used as an output indicator of R&D processes.
However, R&D processes can also be measured by the input – for example, in terms of
expenditures or human capital. In order to achieve a more precise approximation of the
"black box" of R&D activities (Schmoch and Hinze 2004), both perspectives – i.e. input
and output – are needed. The input side, however, has been widely analyzed and discussed

Data and Methods
5
in other reports, also in this series (see for example Schasse et al. 2012). Here, we therefore
strictly focus on patents as an indication of output (Griliches 1981; 1990; Grupp 1998; Pa-
vitt 1982).
This report gives a brief overview of the developments of transnational patent applications
since the early 1990s. However, we especially focus on the recent trends and structures.
We will further focus on analyses of international cooperation structures in terms of co-
patents. Moreover, we will provide a more differentiated look at the German technology
landscape at the level of regions, i.e. the German "Bundesländer". Finally, we will analyze
patents filed by German universities and public research institutes to gain insights into the
technological performance of the German science system. Since, however, universities
often are not named as patent applicants - especially when the patent filing is the result of
cooperation with partners from industry - we additionally include a special analysis of
"academic patents", which draws a more complete picture of the technological activities of
German universities.
Since this year's report is in the form of a short study, we will only provide a brief explana-
tion on data and methods as well as the indicators and their interpretation in the following
two chapters. More detailed explanations and interpretations can be consulted in the earlier
reports within this series.
2 Data and Methods
The patent data for this study were extracted from the "EPO Worldwide Patent Statistical
Database" (PATSTAT), which provides information about published patents collected
from 83 patent authorities worldwide. The list of research-intensive industries and goods
(NIW/ISI/ZEW-Lists 2012) are used for the differentiation of 38 high-technology fields
(Gehrke et al. 2013). By using PATSTAT as the basis of our analyses, we are able to apply
fractional counting of patent filings. We do this in two dimensions: on the one hand, we
fractionally count by inventor countries and, on the other hand, we also fractionally count
by the 38 technology fields of the high-tech list, implying that cross-classifications are tak-
en into account. The advantages of fractional counting are the representation of all coun-
tries or classes, respectively, as well as the fact that the sum of patents corresponds to the
total, so that the indicators are simpler to be calculated, understood, and therefore also
more intuitive.
The patents in our analyses are counted according to their year of worldwide first filing,
which is commonly known as the priority year. This is the earliest registered date in the
patent process and is therefore closest to the date of invention. As patents are in this report
– first and foremost – seen as an output of R&D processes, using this relation between in-
vention and filing seems appropriate.
At the core of the analysis, the data applied here follows a concept suggested by Frietsch
and Schmoch (2010), which is able to overcome the home advantage of domestic appli-
Indicators and their Interpretation
6
cants, so that a comparison of technological strengths and weaknesses becomes possible –
beyond home advantages and unequal market orientations. In detail, all PCT applications
are counted, whether transferred to the EPO or not, and all direct EPO applications without
precursor PCT application. Double counting of transferred Euro-PCT applications is there-
by excluded. Simply speaking, all patent families with at least a PCT application or an
EPO application are taken into account.
In addition to the absolute numbers, patent intensities are calculated, which ensures better
international comparability. The figures for the patent intensity are calculated as the total
number of patents per 1 million workers in the respective country.
For the analyses of patents in different technological fields, patent specializations are cal-
culated. For the analysis of specializations, the relative patent share (RPA1) is estimated. It
indicates in which fields a country is strongly or weakly represented compared to the total
patent applications. The RPA is calculated as follows:
RPAkj = 100 * tanh ln (Pkj/j Pkj)/(k Pkj/kj Pkj)
where kjP stands for the number of patent applications in country k in technology field j.
Positive signs mean that a technology field has a higher weight within the country than in
the world. Accordingly, a negative sign represents a below-average specialization. Hereby,
it is possible to compare the relative position of technologies within a technology portfolio
of a country and additionally its international position, regardless of size differences.
3 Indicators and their Interpretation
International Co-patents
The cooperation structures in international patenting resemble the internationalization of
R&D activities and are able to indicate the extent to which countries are cooperating with
each other. This is based on the assumption that each collaboration that leads to a coopera-
tive patent application is associated with the exchange of knowledge about the patented
invention. The analysis of cooperation structures in patenting thus allows us to draw con-
clusions about international knowledge flows. It is assumed that usually implicit or expe-
riential knowledge is exchanged (Polanyi 1985), which will later "explicitly" be stated in
the form of a patent application. By analyzing patent applications, however, our focus re-
mains on the explicable and explicit knowledge (Grupp 1998).
In sum, we will focus on the transnational co-patent filings of the countries under analysis.
As with the general patent trends, we will apply fractional counting by inventor countries,
i.e. a country is only assigned the fraction of a patent depending on the number of inven-
tors from the given country.
1 Revealed Patent Advantage.

Core indicators
7
Patent filings by German federal states
With the help of the regionalization of patent filings from Germany, we aim to answer the
question, which of the federal states contribute most strongly to the patent activities of
Germany as a whole. Economic, and thereby also innovative, activities are not equally dis-
tributed over geographical space. A regionalized patent statistic therefore allows to take a
closer look at the structural composition of the German innovation landscape, which al-
lows us to identify regional technology trends as an important precondition for the compo-
sition and framing of regional innovation policies in Germany.
As with the general patent trends, we will apply fractional counting by inventor countries.
For the identification of the German federal states in patent filings, we use the NUTS-code
information from the OECD REGPAT database, complemented with address information
obtained from the German Patent and Trademark Office (DPMA). For filings that could
not be assigned a NUTS code with the help of these two data sources, we resorted to the
patent family information within the PATSTAT database. In the case that address informa-
tion could be obtained from any other than the transnational filing, this address information
was assigned to the transnational filing.
Patent filings by German Universities and Public Research Institutes
Patents filed by universities and public research institutes (PRI) help us to assess the tech-
nological output of research organizations in Germany. Patents filed by universities and
PRI were identified within the PATSTAT database with the help of keyword searches,
including the names of the universities with different spelling variations and languages as
well as a search for the names of the respective cities, also including spelling variations
and languages. In the case of the Technical University of Munich, for example, patents are
filed under the names “TECHNICAL UNIVERSITY OF MUNICH”, “TECHNISCHE
UNIVERSITAET MUENCHEN”, or “TU MUENCHEN”. All different spelling variations
are taken into account.
The figures for the patent intensities are calculated as the total number of patent filings per
100 employees (full-time equivalents) in the respective universities. The data on university
employees were extracted from the German Federal Statistical Office (Statistisches Bunde-
samt 2013) as well as the Federal Report on Research and Innovation 2012 (Federal Minis-
try on Education and Research (BMBF) 2012). Gaps within the data for certain years were
estimated on the basis of the values of the preceding and following years.
4 Core indicators
Within this section, the recent trends of transnational patent filings since the beginning of
the 1990s will be described. The analyses will be carried out for a selected set of technolo-

Core indicators
8
gy-oriented countries2, although, for reasons of presentation, not every country is displayed
in each figure. Besides a country-specific view, we will provide a distinction between low-
and high-technology areas (Gehrke et al. 2013). Furthermore, we will analyze basic trends
in international co-patenting, differentiate the German filings by federal states and take a
quick look at patents filed by German universities and public research institutes (PRI).
4.1 International Comparisons
Basic Trends
The absolute number of transnational patent filings by inventor countries is displayed in
Figure 1Fehler! Verweisquelle konnte nicht gefunden werden.. The largest technology-
providing country at the international level is the USA, where a comparatively large
growth in filings between 2012 and 2013 can be observed. The USA is followed by Japan,
where the opposite seems to be true. The figures have slightly declined in the last year.
Germany scores third by this indicator. Here, also a slight decrease in filings can be ob-
served since 2011. China scores fourth in terms of the absolute number of filings since
2009 and has shown rather high growth rates since then. Following behind these four coun-
tries, there is a large group of countries led by Korea, followed by France and Great Brit-
ain. China and Korea have grown strongly in terms of patent filings since 2000 onwards
and have thus managed to leave behind France and Great Britain in the total number of
transnational applications. Sweden and Switzerland follow Great Britain with nearly 4,000
transnational filings in 2013.
The absolute data presented so far is affected by size effects. An adjustment to these size
effects is shown in Table 1, where patent intensities per one million employees are de-
picted. This size adjustment sheds new light on the country ranks. Although the US is the
largest country in absolute terms, it only scores eleventh in terms of patent intensities. Ra-
ther smaller countries like Switzerland, Finland and Sweden are at the top of the list of
technology-oriented countries analyzed here. Japan, Germany and South Korea are first
among the larger countries in terms of patent intensities. Japan even ranks fourth by this
indicator this year, directly followed by Germany. This on the one hand resembles a strong
technology orientation and the technological competitiveness. On the other hand, it is also
a sign of a clear and strict international orientation and an outflow of the export activities
of these countries. Patents are an important instrument to secure market shares in interna-
tional technology markets (Frietsch et al. 2014). With the perspective of this indicator,
2 These are: Belgium, Denmark, Germany, Finland, France Israel, Italy, Japan, Canada, Korea, The Ne-therland, Austria, Poland, Sweden, Switzerland, Spain, United Kingdom, USA, Brazil, Russia, India, China, South Africa as well as the group of EU-28 member states.
Core indicators
9
France, Great Britain and the EU-28 are in the midfield together with the USA, the Nether-
lands and Belgium. The BRICS countries score on the lower ranks.
Figure 1: Absolute number of transnational patent applications for selected countries, 1991-2013
Source: EPO – PATSTAT; Fraunhofer ISI calculations
In addition to the general patent intensities, Table 1 offers a differentiation of the patent
intensities by technological areas and displays the respective shares on total patent filings.
It is remarkable that especially Switzerland shows rather high activities in less R&D inten-
sive fields. The same is true for Italy, Poland, Spain and Austria. Also the BRICS countries
Brazil, South Africa and Russia are comparably active in fields with a low R&D intensity.
China and India deviate from this pattern with a rather small share of patents in less R&D-
intensive fields. China, however, especially shows large shares in leading-edge technolo-
gies, whereas in India the shares in leading-edge and high-level technologies are at a more
comparable level.
With regard to high-technology shares, the highest values can be observed for China, the
USA and Canada, Sweden, Japan, Korea, Israel and India. For these countries, shares lie
above 63%. In the case of India, Canada and Israel, however, this can at least partly be
explained by a high orientation towards the US market, which is the most important na-
tional market for high-tech products. The differentiation by leading-edge and high-level
areas further qualifies these findings. The USA, Canada, Korea, Israel but also Finland,
Sweden and especially China are filing many of their patents in leading-edge technologies.
In consequence, these countries reach comparably low shares in high-level technologies
compared to the other countries. Germany and Switzerland, as well as Italy, Denmark and
0
10
20
30
40
50
60
70
80
91 92 93 94 95 96 97 98 99 00 01 02 03 04 05 06 07 08 09 10 11 12 13
in t
hou
san
ds
US JP DE GB FR CH SE KR CN

Core indicators
10
also Japan are focused on high-level technologies, but reach comparably low shares in lead-
ing-edge areas.
Table 1 Patent intensities (patent applications per 1m employees) and shares of technological areas, 2013
Total Less R&D-intensive High-Tech of which are:
Leading-edge technologies
High-level
technologies SUI 882 437 50% 462 52% 165 19% 297 34% FIN 835 350 42% 489 59% 287 34% 202 24% SWE 795 269 34% 545 68% 287 36% 257 32% JPN 748 289 39% 473 63% 175 23% 297 40% GER 704 320 45% 395 56% 124 18% 272 39% ISR 637 209 33% 436 68% 240 38% 196 31% DEK 636 263 41% 380 60% 127 20% 253 40% KOR 608 218 36% 403 66% 184 30% 219 36% AUT 580 303 52% 282 49% 88 15% 194 33% NED 517 239 46% 282 55% 138 27% 144 28% USA 446 159 36% 292 66% 144 32% 148 33% FRA 441 183 41% 262 59% 118 27% 145 33% BEL 423 187 44% 240 57% 104 25% 135 32% EU-27/28 344 153 45% 196 57% 76 22% 120 35% GBR 264 109 41% 159 60% 74 28% 85 32% ITA 241 127 53% 123 51% 30 12% 93 39% CAN 216 82 38% 136 63% 73 34% 62 29% ESP 146 74 51% 74 51% 31 21% 44 30% POL 41 21 51% 20 48% 8 19% 12 29% CHN 32 9 28% 23 73% 15 47% 8 26% RSA 23 13 57% 9 37% 3 14% 5 23% RUS 17 8 46% 9 56% 5 30% 4 26% BRA 7 4 50% 4 51% 1 16% 3 35% IND 5 2 31% 4 71% 2 32% 2 39%
Source: EPO – PATSTAT; OECD, The World Bank, Fraunhofer ISI calculations
Note: In a few cases, shares of patents in certain IPC-classes are assigned to leading-edge as well as high-level technologies, which might lead to double-counts. The shares therefore might slightly exceed 100%.

Core indicators
11
Figure 2: Shares of high-tech patent applications in total patent applications for selected countries, 1991-2013
Source: EPO – PATSTAT; Fraunhofer ISI calculations
Figure 2 shows the trends in high-tech shares within the national profiles of selected large
countries. While the average share of total transnational high-tech patent applications rose
40%
45%
50%
55%
60%
65%
70%
91 92 93 94 95 96 97 98 99 00 01 02 03 04 05 06 07 08 09 10 11 12 13
USA JPN GER FRA ITA
40%
45%
50%
55%
60%
65%
70%
75%
80%
91 92 93 94 95 96 97 98 99 00 01 02 03 04 05 06 07 08 09 10 11 12 13
Total FIN KOR CHN

Core indicators
12
from about 57% at the beginning of the 1990s to about 63% in 2013, some countries un-
derwent a considerable change of their patenting patterns in high-tech areas. The USA is at
the top of the countries under analysis in this graph and shows rather constantly increasing
shares in high-tech patents over the years. Between 2012 and 2013, however, a slight de-
cline can be observed. Japan is the second most high-technology active country in terms of
transnational patenting in the year 2013. Japan, which had clearly lost ground and had low-
er shares of patenting activities in high-tech areas between 2003 and 2005, has managed to
catch up with the USA according to this indicator, although a slight decrease is visible
from 2011 onwards. France was able to increase its high-tech shares up to 2006, yet the
share remains mostly stable from this year onwards, although a slight growth, beginning in
2010, can be observed. Italy encountered a slight decrease in 2012, but seemed to recover
in 2013. Germany scores fourth by this indicator, however also with slightly decreasing
shares between 2012 and 2013.
The lower panel of Figure 2: Shares of high-tech patent applications in total patent applica-
tions for selected countries, 1991-2013
shows that the high-tech shares of Korea have been decreasing between 2006 and 2009,
although the absolute number of filings from Korea increased considerably. Since 2009, a
stabilization of Korea's high-tech shares can be observed. In the case of China, the number
of filings has slowly started to grow after it joined the WTO and the TRIPS agreement in
2001. This growth is especially visible between 2003 and 2006. Since 2010, however, a
slightly decreasing trend in high-technology shares can be observed.
International Co-Patenting Trends
Figure 3 depicts the transnational co-patents by country as a share of all transnational co-
patents world-wide. The US has the highest share of co-patents in all transnational co-
patents with a value of 25% in the period 2010-212. However, since this figure is affected
by size effects, this is not surprising as the US is also the largest filing country in terms of
the absolute number of transnational filings. The US is followed by Germany, with a share
of about 13% in the same time period. Germany is followed by Great Britain, with a share
of about 7% and France with a share of 6%. The decline in the shares for these countries
between 2000-2002 and 2010-2012 can mostly be attributed to the large number of filings
(and also co-patents) coming from Chinese and Indian inventors. For these two countries,
the largest growth of the number of co-patents can be observed between the two time peri-
ods.
Core indicators
13
Figure 3: Shares of transnational co-patents in all transnational filings of the respective country
Source: EPO – PATSTAT; Fraunhofer ISI calculations
Figure 4: Shares of transnational co-patents in all transnational filings of the respective country
Source: EPO – PATSTAT; Fraunhofer ISI calculations
0%
5%
10%
15%
20%
25%
30%
US DE GB FR CN CH CA JP NL BE IN SE IT AT ES KR FI IL DK RU IE PL BR ZA
2000-2002 2010-2012
0%
5%
10%
15%
20%
25%
30%
35%
40%
45%
BE CH IE IN CA PL GB AT NL RU DK SE BR FI IL FR ES ZA DE US IT CN KR JP
2000-2002 2010-2012
Core indicators
14
Belgium, Switzerland and Ireland reach the highest shares of co-patents within its transna-
tional patent portfolio, which is even increasing over the years. Similar effects can be
found for India and Canada, which score fourth and fifth, respectively. These three coun-
tries are the most internationalized countries in terms of co-patenting. With a value of 13%
in the period 2010-2012, Germany only has a medium internationalization level when re-
garding this indicator, which is also true for the US.
Figure 4 shows the shares of transnational co-patents in all transnational patents of the re-
spective inventor country. Japan and Korea rank last by this indicator with only a share of
2% and 3%, respectively. This result has already been found in earlier reports, not only for
the total number of patent filings but also within certain technology fields like Key Enabl-
ing Technologies (KETs) and Advanced Manufacturing Technologies (AMT) (Neuhäusler
et al. 2015), and resembles the general underrepresentation in international science and
innovation collaborations of Japan and Korea (Schubert et al. 2013; Weissenberger-Eibl et
al. 2011). The reason is that the large firms that are responsible for the majority of patents
within these two countries conduct most of their R&D at home and not in foreign coun-
tries.
Patent Activities of the German Federal States
In Figure 5, the absolute numbers of transnational patent filings based on the address of the
inventor are plotted.3 Over the years, the number of filings is increasing for all German
federal states, with slight decreases during the recent economic crisis. In 2012, also a slight
decline in the figures can be observed. This has already been found in the analyses above,
i.e. the number of transnational filings of Germany in total has slightly decreased com-
pared to 2011.
The largest number of transnational filings within the German comparison can be found in
the south. Bavaria ranks first, with over 8,000 filings in 2012, closely followed by Baden-
Württemberg (about 7,400 filings in 2012) and North Rhine-Westphalia, at a slightly lower
level (about 5,500 filings in 2012). Large parts of the German industry are located in these
three countries. Therefore, it is not surprising that they are responsible for about two thirds
of all German transnational filings. At the fourth rank is Hesse, followed by Lower-Saxony
and Rhineland-Palatinate, who both reach similar levels in terms of patenting. The re-
mainder of the federal states is at a similar level with 1,000 filings per year or less.
3 Due to the fact that employees cross regional borders when commuting to work, the differentiation by inventor and applicant country makes a difference for the profiles of the German federal states. This has been analyzed more deeply in last year's report (Neuhäusler et al. 2014).

Core indicators
15
Figure 5: Number of transnational filings by federal states
Source: EPO – PATSTAT; calculations by Fraunhofer ISI
Note: BW=Baden-Württemberg, BY=Bavaria, BE=Berlin, BB=Brandenburg, HB=Bremen, HH=Hamburg, HE=Hesse, MV=Mecklenburg-West Pomerania, ND=Lower-Saxony, NW=North Rhine-Westphalia, RP=Rhineland-Palatinate, SL=Saarland, SC=Saxony, SA=Saxony-Anhalt, SH=Schleswig-Holstein, TH=Thuringia.
Figure 6 shows the patent intensities, calculated as the number of patent filings by a federal
state divided by the number of employees (in millions) in the respective state. Baden-
Württemberg and Bavaria also score first by this indicator. North-Rhine Westphalia, on the
other hand, which scored third in absolute terms, loses ground and scores only fifth within
this comparison, after Rhineland-Palatinate and Hesse. The Eastern German states have the
lowest patent intensity in comparison.
0
1000
2000
3000
4000
5000
6000
7000
8000
9000
10000
BW BY BE BB HB HH HE MV
ND NW RP SL SC SA SH TH

Core indicators
16
Figure 6: Patent intensities of the German federal states (per 1 million employees)
Source: EPO – PATSTAT; Statistisches Bundesamt, calculations by Fraunhofer ISI
Patents filed by Universities and Public Research Institutes
Figure 7 presents the total number of patents filed by research organizations in total, as
well as differentiated by universities and public research organizations (PRO). The in-
crease in the number of filings, by PRO but especially by universities, indicates that patent-
ing has become more and more important for universities and PRO over the last 10 years.
In the year 2012, research organizations (in total) were responsible for about 1,500 transna-
tional patent filings. About 750 of those were filed by universities, while about 840 were
filed by PRO. For universities, however, higher growth rates can be observed. This in-
creased growth can be explained by a legislation change in 2002 that was targeted towards
promoting patent filings from universities and has led to a convergence in the number of
filings from PRO and universities in the last few years.
0
200
400
600
800
1000
1200
1400
BW BY RP HE NW BE HH SL SH ND SC TH BB HB MV SA
2012 2000

Core indicators
17
Figure 7: Number of transnational filings by German research organizations
Source: EPO – PATSTAT; calculations by Fraunhofer ISI
Note: The sum of patents filed by universities and public research institutes might exceed 100% in certain years due to cooperative patent filings between universities and PRO.
Figure 8: Patent intensities (patents per 1,000 employees, full-time equivalents) by Ger-man research organizations
Source: EPO – PATSTAT; BMBF Datenportal, calculations by Fraunhofer ISI
0
200
400
600
800
1000
1200
1400
1600
1800
PRO University Research Organizations (total)
0.00
0.20
0.40
0.60
0.80
1.00
1.20
1.40
1.60
1.80
2000 2001 2002 2003 2004 2005 2006 2007 2008 2009 2010 2011 2012
PRO University

Core indicators
18
In 2012, a slight decline in the number of filings by universities and PRO can be observed
compared to 2011. Besides the fact that the total number of filings by German inventors
has slightly decreased over the years, this can be explained by the fact that especially inter-
national filings by research organizations were slightly decreasing. When looking at the
national filings at the German Patent and Trademark Office (DPMA) (not shown), it can be
observed that the filings for universities as well as PRI have remained at similar level as in
2011.
When looking at the patent intensities (Figure 8), i.e. the number of transnational patent
filings per 1,000 employees (full-time equivalents), for universities as well as public re-
search institutes, we can see that although universities file nearly as many patents as PRO,
their patent intensity, at least in terms of patents where the university is named as an appli-
cant, is rather low. The intensity of PRI is nearly three times higher than the patent intensi-
ty of universities. Yet, this is mostly driven by the fact that PRO, especially the Fraunhofer
Society but also the Helmholtz Institutes and parts of the Leibniz Institutes, are more fo-
cused on applied research, which explains the high patent intensity compared to universi-
ties.
4.2 Technology Profiles and Specialization Patterns
In this section, we provide a discussion of transnational patent applications by German
inventors according to the classification of 38 technology fields of the high-tech sector
(Gehrke et al. 2013). The absolute number, specialization and the percentage growth of
German transnational patent applications by technology fields are displayed in Table 2.
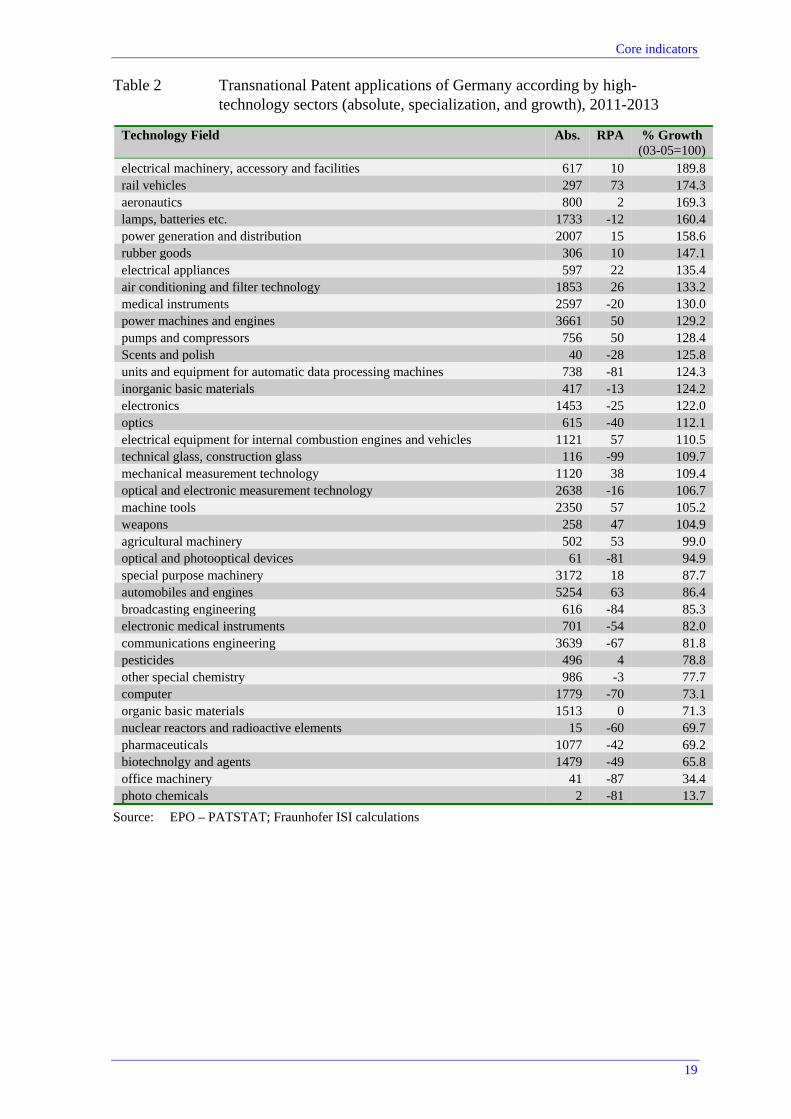
The highest growth rates between 2003-2005 and 2011-2013 can be found in the fields of
"electrical machinery, accessory and facilities", "rail vehicles", "aeronautics" and "lamps
and batteries".
Among the fields that are growing most slowly in Germany are two smaller fields, namely
"photo chemicals" and "office machinery". Yet, also the chemistry related fields "biotech-
nology and agents", "organic basic materials", "other special chemistry", "pesticides" and
"pharmaceuticals" can be seen as comparably slowly growing fields within the German
technology profile, followed by the ICT related fields of "computers" and "communica-
tions engineering" as well as the field "nuclear reactors and radioactive elements". This
confirms the results from last year's study. Most electronics related fields are growing ra-
ther strongly, whereas chemistry and pharmaceuticals as well as ICT related fields do not
show very high growth rates. The fields related to the mechanical engineering sector,
where Germany has its particular technological strengths, e.g. "machine tools", "agricultur-
al machinery", "automobiles and engines" or "special purpose machinery", show moderate
to low growth rates in recent years, which also resembles the trends that have been found
in earlier studies of this series.
Core indicators
19
Table 2 Transnational Patent applications of Germany according by high-technology sectors (absolute, specialization, and growth), 2011-2013
Technology Field Abs. RPA % Growth (03-05=100)
electrical machinery, accessory and facilities 617 10 189.8 rail vehicles 297 73 174.3 aeronautics 800 2 169.3 lamps, batteries etc. 1733 -12 160.4 power generation and distribution 2007 15 158.6 rubber goods 306 10 147.1 electrical appliances 597 22 135.4 air conditioning and filter technology 1853 26 133.2 medical instruments 2597 -20 130.0 power machines and engines 3661 50 129.2 pumps and compressors 756 50 128.4 Scents and polish 40 -28 125.8 units and equipment for automatic data processing machines 738 -81 124.3 inorganic basic materials 417 -13 124.2 electronics 1453 -25 122.0 optics 615 -40 112.1 electrical equipment for internal combustion engines and vehicles 1121 57 110.5 technical glass, construction glass 116 -99 109.7 mechanical measurement technology 1120 38 109.4 optical and electronic measurement technology 2638 -16 106.7 machine tools 2350 57 105.2 weapons 258 47 104.9 agricultural machinery 502 53 99.0 optical and photooptical devices 61 -81 94.9 special purpose machinery 3172 18 87.7 automobiles and engines 5254 63 86.4 broadcasting engineering 616 -84 85.3 electronic medical instruments 701 -54 82.0 communications engineering 3639 -67 81.8 pesticides 496 4 78.8 other special chemistry 986 -3 77.7 computer 1779 -70 73.1 organic basic materials 1513 0 71.3 nuclear reactors and radioactive elements 15 -60 69.7 pharmaceuticals 1077 -42 69.2 biotechnolgy and agents 1479 -49 65.8 office machinery 41 -87 34.4 photo chemicals 2 -81 13.7
Source: EPO – PATSTAT; Fraunhofer ISI calculations

Core indicators
20
Figure 9: Germany’s technological profile, 2003-2005 vs. 2011-2013
Source: EPO – PATSTAT; Fraunhofer ISI calculations
-100 -80 -60 -40 -20 0 20 40 60 80 100
rail vehicles
automobiles and engines
electrical equipment for internal combustion …
machine tools
agricultural machinery
power machines and engines
pumps and compressors
weapons
mechanical measurement technology
air conditioning and filter technology
electrical appliances
special purpose machinery
power generation and distribution
rubber goods
electrical machinery, accessory and facilities
aeronautics
pesticides
organic basic materials
other special chemistry
lamps, batteries etc.
inorganic basic materials
medical instruments
optical and electronic measurement technology
Scents and polish
electronics
optics
pharmaceuticals
biotechnolgy and agents
electronic medical instruments
communications engineering
nuclear reactors and radioactive elements
computer
optical and photooptical devices
units and equipment for automatic data …
broadcasting engineering
office machinery
photo chemicals
technical glass, construction glass
2003-2005
2011-2013

Patent Filings and Patent Citations as Performance Indicators for German Universities
21
The specialization (RPA) of the German technology profile of the years 2003-2005 and
2011-2013 is displayed in Figure 9. Germany is specialized, i.e. has comparative advantag-
es, in three main areas: transport (automobiles and engines as well as rail vehicles), machi-
nery and some areas of electrical engineering like power machines and power generation.
Germany also has a very strong specialization within "electrical equipment for internal
combustion engines and vehicles".
An average activity rate in patenting can be found in the chemical sectors ("organic basic
materials", "other special chemistry"). Comparative disadvantages, reflected in negative
specialization indices, can be found in pharmaceuticals, biotechnology, information and
communication technologies as well as optics and optical devices, meaning that Germany
does not have an outstanding profile in these sectors in international technology markets.
All of these trends can be found in both time periods, i.e. the specialization profile of Ger-
many is rather stable over time.
5 Patent Filings and Patent Citations as Performance Indica-tors for German Universities
Researchers usually publish their scientific achievements in journals, which enables other
researchers to access and eventually cite them if they deem them appropriate for their own
research (Michels et al. 2013). Besides publications, however, patent filings are a major
output of R&D activities of universities. In contrast to publications, they more directly
indicate the technological output of research organizations and can consequently be used to
assess this output. Patents are filed to achieve temporary protection of new products or
processes on the market place (Schmoch 1997). They indicate an interest in the commer-
cial exploitation of a new finding or a new technology. Thus, they are more strongly fo-
cused on measuring an orientation towards the technological application of a given inven-
tion compared to the publication of scientific results in journals. By employing patent sta-
tistics to assess the performance of German universities, we are able to draw conclusion
about the technology-oriented output of these research organizations.
The creation, diffusion and application of scientific and technological knowledge are cru-
cial foundations of technological activities and key elements for the performance of na-
tional innovation systems. Within this context, especially knowledge and technology trans-
fer from universities has been seen as an important approach towards the modernization of
economic structures and the promotion the economic dynamics (Achleitner et al. 2009;
Crespi et al. 2011; Egeln et al. 2007). In the recent years, a set of policy actions was under-
taken to strengthen and improve the efficiency of technology transfer between university
and industry. They mostly aimed towards giving universities a higher autonomy and flex-
ibility to enable them to introduce own regulations that apply to the management of tech-
nology transfer, contracts with industry and IPR. An important aspect has been seen in
promoting patent filings from universities. One step towards this end has been seen in ab-

Patent Filings and Patent Citations as Performance Indicators for German Universities
22
olishing the traditional professor’s privilege (Hochschullehrerprivileg) in 2002, where the
individual ownership of academic patents was replaced by a system of institutional owner-
ship by the universities (Geuna and Rossi 2011). Since then, employee inventions are
owned by the employing university and no longer by the inventors themselves. Similar
activities have been carried out in several European countries, with the Bayh-Dole Act in
the US serving as the prototype. However, research financed fully or partly by external
contractors as for example private companies, remains subject to negotiations regarding the
allocation of patent rights (Geuna and Rossi 2011).
Consequently, a large share of patent filings from universities is registered by companies
and the university staff only appears as inventors. Simply counting the number of patents
where the university appears as an applicant thus leads to an incomplete picture of patent
filings by universities (the part where firms or individual inventors are named as patent
applicants is missed). For a correct detection of trends in patent filings from German uni-
versities, an improved approach, which is able to detect patent filings that have not been
formally applied for by universities themselves, is needed. The approach followed here is
based on the idea of matching the names of scientific authors (research-active university
staff) with inventor names from the PATSTAT database.
Once the academic patents have been identified, we are able to capture the performance of
German universities in two dimensions, namely quantitatively and qualitatively. These two
dimensions are reflected in two indicators, the number of patent filings by universities as
well as the average number of citations these patents receive from subsequent patents
(forward citations). Although associated with a certain amount of noise (Alcacer and Git-
telman 2006; Harhoff et al. 2003), counts of forward citations signal the degree to which a
patent contributes to further developing advanced technology and therefore the technologi-
cal significance or importance of a patent (Carpenter et al. 1981; Hall et al. 2005; Harhoff
et al. 2003; Trajtenberg 1990).
This method allows us to detect the top universities in terms of patent filings in Germany.
Besides these two indicators, growth rates and patent intensities of the universities will be
provided in this chapter. Finally, we will take a closer look at the (aggregate) technological
profile of the German universities and the technological profile of the top 3 universities in
terms of patent filings and citations. Here, the question whether the filings are widely
spread across different technology fields or concentrated to only a few fields stands in the
focus of the analysis.

Patent Filings and Patent Citations as Performance Indicators for German Universities
23
5.1 Data and Methods
5.1.1 The Data
At the core of the analysis, patent filings at the European Patent Office (EPO) based on the
PATSTAT database will be analyzed. In addition to the absolute numbers, patent intensi-
ties are calculated, which ensures better comparability absent size effects. The figures for
the patent intensities are calculated as the total number of patent filings per 100 R&D em-
ployees (full-time equivalents) in the respective universities. The data on university em-
ployees were extracted from the German Federal Statistical Office (Statistisches Bunde-
samt 2013) as well as the Federal Report on Research and Innovation 2012 (Federal Minis-
try on Education and Research (BMBF) 2012). Gaps within the data for certain years were
estimated on the basis of the values of the preceding and following years.
5.1.2 The identification of patents from universities and public research institutions
Previous studies have shown that a simple count of the patents, for which the university is
named as the applicant, provides only a limited picture of the patent output from universi-
ties (c.f. Dornbusch et al. 2013; Lissoni et al. 2009; 2008). To draw a more complete pic-
ture of the patent output of universities, also inventions that were made within the universi-
ty and for which a patent was filed by a company, need to be taken into account to cover
the full inventive output of the respective university. The two groups, i.e. patents filed by
the university itself ("university filed") and patents filed by other applicants, where univer-
sity employees where involved in the invention leading to the patent ("university in-
vented"), are referred to as "academic patents" (c.f. Lissoni et al. 2008).
Figure 10: Selection criteria for academic patents
Source: Adapted from Dornbusch et al. (2013)
The approach for the identification of the whole set of academic patents, including univer-
sity-invented patents, is based on the examination of name matches of authors of scientific
publications from the Scopus database and inventors named on a patent filing. Patents do
Organization matching
Name matching Time windowmatching
Location matching
Classification matching
PATSTAT
?Full strings of last-and first name
Priority year NUTS3-Codesand distance matrix
IPC classification =
WIPO 34
SCOPUS Author affiliation =
university
Full strings of last-and first name
Publication year:One year time-lag and time-window
NUTS3-Codesand distance matrix
Scopus classification: fine-/ coarse-grained
x uni-inv = 1 if (a names match + b time match + c location match + d subject match)2) Organization 3) Names 4) Time 5) Location 6) Subject

Patent Filings and Patent Citations as Performance Indicators for German Universities
24
not indicate the employing institution of an inventor, while the publications list the au-
thors’ affiliation and enable us to identify academic inventors and the patents they have
contributed to. At the same time this also allows us to connect these patents to the publica-
tions of those university employees and academic authors.
Based on a keyword search and manual correction, the German universities were identified
and coded as such within Scopus. Their publications, including the adhering bibliographic
information, were stored in one and all EPO filings of German inventors were stored with-
in another separate table. Accordingly, the author-/inventor names from these two tables
are matched and, to ensure a high precision, complemented with additional selection crite-
ria, especially to avoid homonyms, i.e. different persons having identical names. A more
detailed description of the name matching and its validation can be found in Dornbusch et
al. (2013).
Table 3 Recall, precision and F-Score
Selection criteria:
Full name +
Recall Precision F-Scores
R=P (F1) P>R (F0,5)
Location* 0.71 0.77 0.74 0.76
Subject match 0.71 0.52 0.60 0.55
Location*, subject match 0.59 0.93 0.72 0.83
Source: Dornbusch et al. (2013)
*= Calculations were based on a match of two-digit postal codes, meanwhile NUTS3 Codes including a dis-tance matrix are implemented.
For the evaluation of the alogorithm a recall and precision analysis has been applied (Bae-
za-Yates and Ribeiro-Neto 2011).4 A precondition for this is to generate exact reference
datasets. As for the recall, namely the estimate of the proportion of correctly identified
documents in all documents, we identified the number of patents with universities them-
selves as applicants by simple keyword searches, as described above, and calculated the
share of correctly identified patents. The precision of the algorithm was validated by an
online-survey covering authors for whom academic patents have been identified.5 Due to
the large datasets with imperfect data, 100% for both recall and precision are impossible.
However, in order to obtain the best fit between the two, the F-score was calculated.6
It represents the harmonized mean between recall and precision. A set of different configu-
rations have been tested and the relevant ones, for our purpose of this study, are displayed
4 Recall: CR/(CR + CM), where CR is Correct Recall and CM is Correct Missing (error type I or false negative); Precision: CR/(CR + IR), where IR is Incorrect Recall (errors type II or false positive).
5 The survey addressed 1681 persons with 2782 patent applications at the German patent office. 435 exploitable answers amounting to 678 patents have been received, equaling a response rate of 26%.
6 F-Score: Fß = (1+ß²) (p*r)/(ß²*p*r); p = precision = tp/(tp+fn) and r = recall = tp/(tp+fp) where tp means true positive, fn false negative and fp false positive.

Patent Filings and Patent Citations as Performance Indicators for German Universities
25
in Table 3.7 The combination of full names with the location criterion as well as the subject
match obviously achieves the best results (F-Score: 0.83), particularly when giving preci-
sion a higher priority over recall. However, as a concession to high precision we have to
accept a reduced recall, i.e. the retrieved results are likely to underestimate the amount of
academic patents and our results so to say are only able to reflect a lower-bound estimate
of academic patents.
To give us at least an indication about how strongly the university patents are underesti-
mated, we have performed an additional analysis with the help of Scopus data. In detail,
we have collected lists of researchers of four faculties with different scientific and technol-
ogical profiles at selected German universities (LMU Munich - Faculty for Chemistry and
Pharmacy, TU Dresden - Faculty of Electrical and Computer Engineering, TU-Darmstadt -
Department of Mechanical Engineering, RWTH Aachen - Faculty of Mechanical Engi-
neering). We have then matched these lists with Scopus via a simple name matching algo-
rithm to find out which shares of researchers is actually publishing (and therefore can po-
tentially be matched to the PATSTAT dataset to search for possible patent filings). The
estimations show that about 75% of the researchers at the Faculty for Chemistry and Phar-
macy at the LMU Munich at least have published one article between 1996 and 2010. This
share lies at 85% for the Faculty of Electrical and Computer Engineering at the TU Dres-
den, 73% for the Faculty of Electrical and Computer Engineering at the RWTH Aachen
and 80% at the Department of Mechanical Engineering at the TU Darmstadt.8
However, the number of academic patents is slightly higher for all analyzed years com-
pared to the report from last year's series. This has several reasons that are connected to the
fact that the most recent version of Scopus (version 2014) was used for the matching. First,
the coverage of scientific journals (across all years) in the recent Scopus version is higher
than in the earlier versions. This implies that more publications - and as a consequence
more authors that can potentially be matched to inventors from PATSTAT - are included.
Second, new names or name variations of universities have been included and added to
Scopus' "Organization ID", which also enlarges the potential number of authors that can be
matched to PATSTAT. In sum, the coverage of authors at the Scopus side is higher in the
most recent version, ultimately leading to a better coverage of academic patents and thus to
overall larger filing numbers compared to last year's report.
7 Please compare Dornbusch et al. (2013) for a detailed discussion on the effects and the validation of the chosen selection criteria.
8 Due to the lack of data, only names of university professors were included for TU Darmstadt and the TU Dresden. This is supposed to result in somewhat higher figures compared to also including scientific coworkers etc..

Patent Filings and Patent Citations as Performance Indicators for German Universities
26
5.2 Results
The identification of the top German universities in terms of the number of patent filings,
i.e. the quantitative dimension, and in terms of citations received from subsequent patents,
the qualitative dimension, is plotted in Figure 11. This matrix shows which of the German
universities has the largest patent output compared to its quality, i.e. the universities
oriented towards the upper-right corner are the (technological) top-performers in Germany
as measured by these two indicators. The universities with the largest number of academic
patents within the time period from 2008 to 2010 in a descending order are the "Tech-
nische Universitaet Muenchen", the "Charité - Universitaetsmedizin Berlin" (which is a
special case as this is the university hospital of the "Humboldt Universitaet Berlin" and the
"Freie Universitaet Berlin"), the "LMU Muenchen", the "Freie Universitaet Berlin", the
"Humboldt Universitaet Berlin", the "Universitaet Heidelberg", the "Universitaet Jena" and
the "Universitaet Erlangen-Nuernberg". This rather small group constitutes the German
universities with more than 300 academic patents each in the 3-year time period. All other
universities have significantly fewer patents (below 250) within the same time frame. The
two universities with the highest number of citations received on average are the "Univer-
sitaet Siegen" and the "Universitaet Bayreuth" (upper left corner), which, however, have
filed only a very small number of patents between 2008 and 2010. The largest universities
in terms of patents filings listed above, however, also reach rather high citation rates be-
tween 2.4 and 3.3, i.e. a high quantity goes along with a comparably high quality.
Since the picture does not provide us with a "final answer" on the top 3 universities, we
sticked with the "Technische Universitaet Muenchen", the "LMU Muenchen" and the
"Freie Universitaet Berlin" for further analyses of technological profiles (provided below).

Patent Filings and Patent Citations as Performance Indicators for German Universities
27
Figure 11: Estimated number of academic patents and average number of forward cita-tions by German universities, EPO
Source: EPO – PATSTAT; Elsevier – SCOPUS; calculations by Fraunhofer ISI.
In addition to the absolute number of academic patents as well as the average number of
forward citations for all patenting German universities, Table 4 shows the patent intensi-
ties, i.e. the number of EPO patent filings per 100 R&D employees (full-time equivalents),
for German universities. This "size-corrected" measure shows that smaller universities gain
a “small size advantage” and rank higher than in terms of the absolute number of filings.
The top universities in terms of intensities are the "Universitaet Luebeck", "Humboldt Un-
iversitaet Berlin", "Freie Universitaet Berlin", "Charité - Universitaetsmedizin Berlin",
"Universitaet Jena" and the "Technische Universitaet Muenchen". As in last year's report,
it is striking that particularly universities in Munich and Berlin show high numbers of aca-
demic patents as well as high patent intensities. It should consequently be mentioned that
double counts due to co-patents are possible and that in large research clusters like Munich
and Berlin close and organizational networks are likely to exist. This is particularly true for
universities cooperating with medical facilities such as the Charité University Hospital in
Berlin. Besides this fact, however, it can still be stated as a general trend that large technic-
al universities and universities with huge medical facilities (e.g. Charité, Universitaet Hei-
delberg, LMU Muenchen), located in large agglomerations, generate the largest numbers
of academic patents not only in absolute terms but also per employee.
Charite -Universitaetsmedizin
Berlin
Freie Universitaet Berlin
Humboldt Universitaet Berlin LMU Muenchen Technische Universitaet
Muenchen
Universitaet Erlangen-Nuernberg Universitaet Heidelberg
Universitaet Jena
0.0
1.0
2.0
3.0
4.0
5.0
6.0
7.0
0 100 200 300 400 500 600 700
Avg
. Nr.
of
FW
-Cit
atio
ns
(200
4-20
06)
Nr. of academic patents (2008-2010)

Patent Filings and Patent Citations as Performance Indicators for German Universities
28
Table 4 Estimated number of academic patents, patent intensities and average number forward citations by German universities, EPO
University Name Nr. of filings (2008-2010)
Patent Intensities (2008-2010)
Avg. Nr. of FW-Citations (2004-2006)
Technische Universitaet Muenchen 624 3,33 2,5 Charite - Universitaetsmedizin Berlin 456 3,43 2,7 LMU Muenchen 428 1,89 2,4 Freie Universitaet Berlin 411 3,70 2,9 Universitaet Jena 384 3,37 2,8 Universitaet Heidelberg 383 1,91 3,2 Humboldt Universitaet Berlin 368 4,34 2,7 Universitaet Erlangen-Nuernberg 304 1,85 3,3 Technische Universitaet Dresden 243 1,41 2,7 Universitaet Duesseldorf 216 2,45 2,7 Universitaet Freiburg (i.Br.) 216 1,26 2,4 Technische Universitaet Berlin 210 1,89 3,0 Universitaet Mainz 195 1,53 2,3 RWTH Aachen 193 1,15 3,6 Universitaet Stuttgart 186 1,64 2,2 Medizinische Hochschule Hannover 178 2,88 2,8 Karlsruher Institut fuer Technologie 178 1,74 2,3 Universitaet Tuebingen 177 1,37 3,0 Universitaet Duisburg-Essen 169 1,45 2,5 Universitaet Ulm 167 2,30 3,1 Universitaet Hamburg 158 0,95 2,8 Ruhr-Universitaet Bochum 154 1,38 1,8 Universitaet Wuerzburg 150 1,17 2,4 Universitaet Kiel 145 1,15 1,8 Universitaet Muenster 142 0,88 2,0 Universitaet des Saarlandes 141 1,52 2,1 Universitaet Koeln 140 1,12 2,3 Universitaet Marburg 138 2,16 3,0 Technische Universitaet Darmstadt 135 1,71 2,2 Universitaet Regensburg 123 1,22 2,8 Universitaet Hannover 122 1,49 2,8 Universitaet Goettingen 119 1,03 2,2 Universitaet Frankfurt a.M. 110 0,90 2,9 Universitaet Dortmund 100 1,34 2,9 Universitaet Leipzig 93 0,79 1,5 Universitaet Giessen 86 0,76 2,2 Technische Universitaet Braunschweig 81 1,27 2,4 Universitaet Rostock 76 1,10 2,2 Universitaet Halle 67 0,80 3,8 Technische Universitaet Kaiserslautern 62 1,65 2,9 Universitaet Magdeburg 62 0,96 2,7 Universitaet Bonn 58 0,42 2,9 Universitaet Luebeck 56 7,79 1,9 Technische Universitaet Hamburg-Harburg 50 2,14 1,8 Universitaet Greifswald 45 0,79 1,9 Universitaet Konstanz 44 0,97 3,7 Universitaet Bayreuth 37 0,81 6,0 Technische Universitaet Ilmenau 34 1,23 2,2 Universitaet Mannheim 34 0,91 4,6 Universitaet Potsdam 33 0,54 4,7 Universitaet Wuppertal 31 0,73 2,5 Technische Universitaet Chemnitz 30 0,66 3,3 Technische Universitaet Clausthal 29 1,50 2,3 Universitaet Bielefeld 29 0,48 2,0 Universitaet Bremen 26 0,38 1,4 Universitaet Osnabrueck 25 0,70 1,0 Universitaet der Bundeswehr Hamburg 21 2,16 2,4 Universitaet Paderborn 21 0,51 2,4 Universitaet Kassel 19 0,31 3,3 Universitaet Hohenheim 12 0,40 2,2 Universitaet Siegen 12 0,28 6,1 Technische Universitaet Bergakademie Freiberg 11 0,38 2,5 Universitaet Augsburg 11 0,26 2,4 Universitaet der Bundeswehr Muenchen 9 0,40 1,5 Universitaet Trier 6 0,18 0,0 Brandenburgische Technische Universitaet Cottbus 5 0,20 1,0 Universität Vechta 4 0,38 0,0 Universitaet Koblenz-Landau 3 0,12 0,0 Universitaet Weimar 2 0,10 0,0 Universitaet Passau 2 0,09 0,0 Universitaet Lueneburg 1 0,04 0,0 FernUniversitaet Hagen 0 0,00 4,0 Universitaet Bamberg 0 0,00 0,0 Universitaet Frankfurt (Oder) 0 0,00 0,0 Universitaet Oldenburg 0 0,00 0,0 Universität Eichstätt - Ingolstadt 0 0,00 0,0
Source: EPO – PATSTAT; Elsevier – SCOPUS; Statistisches Bundesamt; calculations by Fraunhofer ISI.
In Figure 12, the growth rates of academic patents between 2006 and 2010 are shown. As
can be seen from the figure, especially smaller universities (in terms of patent filings) have

Patent Filings and Patent Citations as Performance Indicators for German Universities
29
the largest growth rates. On top is the "Technische Universitaet Kaiserslautern", followed
by the "Universitaet Osnabrueck", "Universitaet Bielefeld", "Universitaet Potsdam" and
the "Technische Universitaet Hamburg-Harburg". However, it has to be mentioned that all
these universities still have less than 50 academic patents in the time period from 2006 to
2010 and high growth rates can thus more easily be achieved.
Most of the larger universities in terms of patent filings reach medium growth rates be-
tween -3 and +4 percentage points between 2006 and 2010. Only the universities in the
Berlin region, i.e. the Charité - Universitaetsmedizin Berlin", the "Humboldt Universitaet
Berlin" and the "Freie Universitaet Berlin", show lower growth rates between -8 and -16
percentage points.
One further fact that is important to mention is that many of the technical universities have
rather high growth rates. From the TU9, the nine technical universities in Germany, five
are in the top10 list in terms of growth rates and all other technical universities also show
positive growth in patent filings between 2006 and 2010 (except for "the Technische Un-
iversitaet Braunschweig" with a slightly negative value).

Patent Filings and Patent Citations as Performance Indicators for German Universities
30
Figure 12: Compound Annual Growth Rate (CAGR) of academic patents, EPO, 2006-2010
Source: EPO – PATSTAT; Elsevier – SCOPUS; calculations by Fraunhofer ISI.
In the final step, we will take a closer look at the technological profiles of the universities.
On aggregate, i.e. across all German universities, this is shown in Figure 13. Here, the
above mentioned effect that large technical universities and universities with huge medical
facilities generate the largest numbers of academic patents becomes visible once more.
-100% -80% -60% -40% -20% 0% 20% 40% 60% 80%
FernUniversitaet HagenUniversitaet Greifswald
Universitaet SiegenUniversitaet Kassel
Universitaet KonstanzUniversitaet der Bundeswehr Muenchen
Universitaet LeipzigHumboldt Universitaet Berlin
Universitaet MannheimMedizinische Hochschule Hannover
Universitaet BremenCharite - Universitaetsmedizin Berlin
Technische Universitaet DarmstadtUniversitaet Regensburg
Universitaet Duisburg-EssenUniversitaet Goettingen
Universitaet BonnUniversitaet Frankfurt a.M.
Freie Universitaet BerlinTechnische Universitaet Ilmenau
Universitaet PaderbornUniversitaet Tuebingen
Universitaet LuebeckUniversitaet Augsburg
Universitaet RostockRuhr-Universitaet Bochum
Universitaet HannoverUniversitaet Heidelberg
Universitaet MuensterLMU Muenchen
Universitaet DortmundUniversitaet des Saarlandes
Universitaet StuttgartTechnische Universitaet Braunschweig
Universitaet MagdeburgTechnische Universitaet Muenchen
Universitaet Freiburg (i.Br.)Universitaet Wuerzburg
Universitaet HamburgKarlsruher Institut fuer Technologie
Universitaet UlmUniversitaet Bayreuth
Universitaet HalleRWTH Aachen
Universitaet Erlangen-NuernbergUniversitaet Giessen
Universitaet JenaTechnische Universitaet Dresden
Universitaet DuesseldorfUniversitaet Kiel
Universitaet MainzUniversitaet Koeln
Brandenburgische Technische Universitaet …Technische Universitaet Bergakademie Freiberg
Universitaet der Bundeswehr HamburgUniversitaet Hohenheim
Technische Universitaet ChemnitzTechnische Universitaet Berlin
Universitaet WuppertalUniversitaet Marburg
Technische Universitaet ClausthalTechnische Universitaet Hamburg-Harburg
Universitaet PotsdamUniversitaet Bielefeld
Universitaet OsnabrueckTechnische Universitaet Kaiserslautern

Patent Filings and Patent Citations as Performance Indicators for German Universities
31
Although the share has slightly decreased between 2000-2002 and 2008-2010 - due to in-
creases in other technology fields - biotechnology and pharmaceuticals show the largest
shares of academic patents across all German universities (14% and 13%, respectively),
followed by organic fine chemistry, medical technology and measurement. In chemistry
and related fields thus the highest shares of academic patents can be found, followed by
fields related to instruments and some sub-fields of electrical engineering, e.g. computer
technology and semiconductors. The smallest shares of academic patents can be observed
in mechanical engineering and related fields. A calculation of the Herfindahl-Hirschman-
Index, a concentration measure ranging from 0 (minimum concentration) and 1 (maximum
concentration), shows that the filings are rather evenly spread across technology fields
(HHI value of 0.08 in 2000-2002 and 0.06 in 2008-2010).
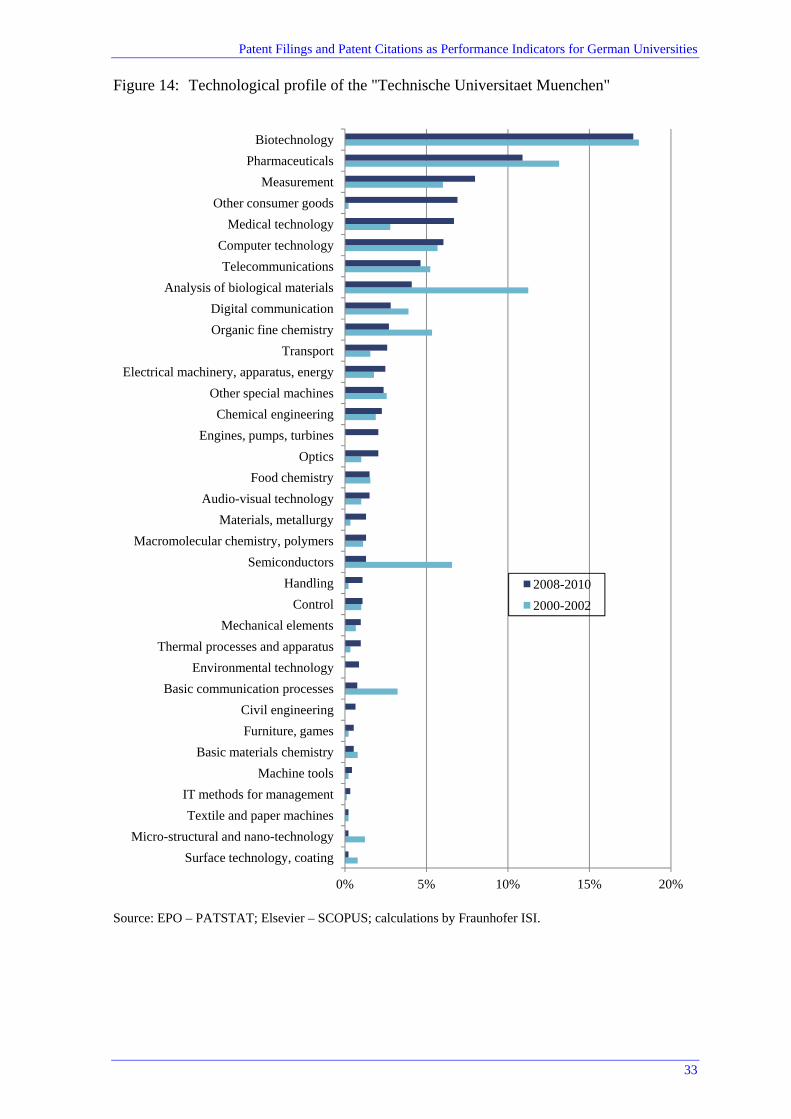
This changes only slightly when looking at the profiles of the top 3 universities listed
above. For the "Technische Universitaet Muenchen", for example (Figure 14), also the
fields biotechnology and pharmaceuticals reach the largest shares. However, in this univer-
sity's portfolio, electrical and mechanical engineering seem to play a larger role than on
average. The calculation of the HHI though shows a slightly higher concentration than av-
erage with a value of 0.09 in 2000-2002 and 0.07 in 2008-2010. At the "LMU Muenchen"
(Figure 15), on the other hand, a specialization on chemistry and related fields as well as
instruments (optics, medical technology, measurement) can be observed. In addition, the
HHI values are higher than at the "Technische Universitaet Muenchen" (0.15 in 2000-2002
and 0.12 in 2008-2010). Finally, at the "Freie Universitaet Berlin" (Figure 16), computer
technology and audio-visual technology play a comparably large role. This university has
the most uneven spread across technology fields with HHI values of 0.20 in 2000-2002 and
0.19 in 2008-2010, resulting from the largest shares of patents in biotechnology and phar-
maceuticals among the universities in comparison.

Patent Filings and Patent Citations as Performance Indicators for German Universities
32
Figure 13: Technological profile of German universities (total)
Source: EPO – PATSTAT; Elsevier – SCOPUS; calculations by Fraunhofer ISI.
0% 5% 10% 15% 20%
IT methods for management
Furniture, games
Civil engineering
Micro-structural and nano-technology
Basic communication processes
Environmental technology
Textile and paper machines
Food chemistry
Thermal processes and apparatus
Handling
Control
Machine tools
Mechanical elements
Audio-visual technology
Digital communication
Other consumer goods
Engines, pumps, turbines
Surface technology, coating
Telecommunications
Other special machines
Optics
Transport
Macromolecular chemistry, polymers
Basic materials chemistry
Materials, metallurgy
Semiconductors
Electrical machinery, apparatus, energy
Chemical engineering
Computer technology
Analysis of biological materials
Measurement
Medical technology
Organic fine chemistry
Pharmaceuticals
Biotechnology
2008-2010
2000-2002
Patent Filings and Patent Citations as Performance Indicators for German Universities
33
Figure 14: Technological profile of the "Technische Universitaet Muenchen"
Source: EPO – PATSTAT; Elsevier – SCOPUS; calculations by Fraunhofer ISI.
0% 5% 10% 15% 20%
Surface technology, coating
Micro-structural and nano-technology
Textile and paper machines
IT methods for management
Machine tools
Basic materials chemistry
Furniture, games
Civil engineering
Basic communication processes
Environmental technology
Thermal processes and apparatus
Mechanical elements
Control
Handling
Semiconductors
Macromolecular chemistry, polymers
Materials, metallurgy
Audio-visual technology
Food chemistry
Optics
Engines, pumps, turbines
Chemical engineering
Other special machines
Electrical machinery, apparatus, energy
Transport
Organic fine chemistry
Digital communication
Analysis of biological materials
Telecommunications
Computer technology
Medical technology
Other consumer goods
Measurement
Pharmaceuticals
Biotechnology
2008-2010
2000-2002
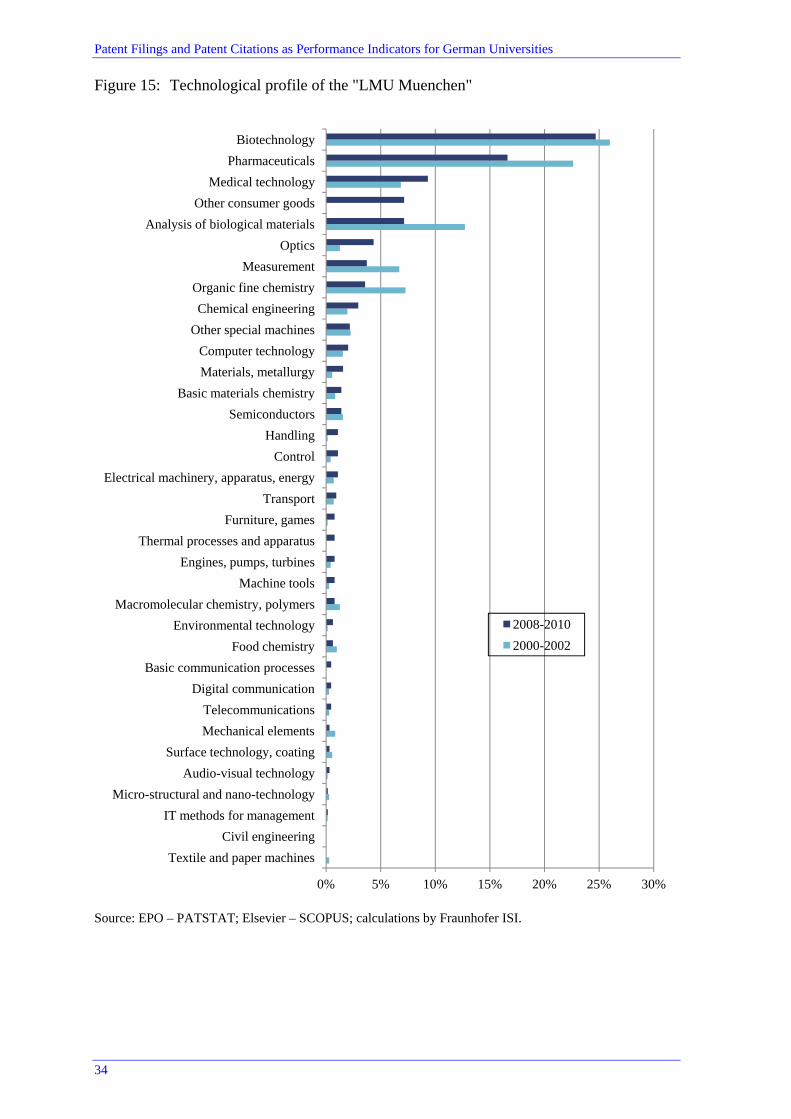
Patent Filings and Patent Citations as Performance Indicators for German Universities
34
Figure 15: Technological profile of the "LMU Muenchen"
Source: EPO – PATSTAT; Elsevier – SCOPUS; calculations by Fraunhofer ISI.
0% 5% 10% 15% 20% 25% 30%
Textile and paper machines
Civil engineering
IT methods for management
Micro-structural and nano-technology
Audio-visual technology
Surface technology, coating
Mechanical elements
Telecommunications
Digital communication
Basic communication processes
Food chemistry
Environmental technology
Macromolecular chemistry, polymers
Machine tools
Engines, pumps, turbines
Thermal processes and apparatus
Furniture, games
Transport
Electrical machinery, apparatus, energy
Control
Handling
Semiconductors
Basic materials chemistry
Materials, metallurgy
Computer technology
Other special machines
Chemical engineering
Organic fine chemistry
Measurement
Optics
Analysis of biological materials
Other consumer goods
Medical technology
Pharmaceuticals
Biotechnology
2008-2010
2000-2002

Patent Filings and Patent Citations as Performance Indicators for German Universities
35
Figure 16: Technological profile of the "Freie Universitaet Berlin"
Source: EPO – PATSTAT; Elsevier – SCOPUS; calculations by Fraunhofer ISI.
5.3 Summary and conclusions
In this chapter, we have analyzed the technological performance of German universities in
two dimensions, quantitatively and qualitatively. These two dimensions are reflected by
0% 5% 10% 15% 20% 25% 30% 35%
Basic communication processes
Environmental technology
Handling
Machine tools
Engines, pumps, turbines
Textile and paper machines
Mechanical elements
Transport
Civil engineering
IT methods for management
Thermal processes and apparatus
Furniture, games
Other consumer goods
Electrical machinery, apparatus, energy
Telecommunications
Control
Micro-structural and nano-technology
Digital communication
Optics
Food chemistry
Chemical engineering
Basic materials chemistry
Semiconductors
Materials, metallurgy
Other special machines
Measurement
Macromolecular chemistry, polymers
Surface technology, coating
Audio-visual technology
Computer technology
Organic fine chemistry
Medical technology
Analysis of biological materials
Biotechnology
Pharmaceuticals
2008-2010
2000-2002

References
36
two indicators, the number of patent filings by universities as well as the average number
of citations these patents receive from subsequent patents. Based on this method, we have
identified the top universities in terms of patent filings in Germany. These are the "Tech-
nische Universitaet Muenchen", the "Charité - Universitaetsmedizin Berlin, the "LMU
Muenchen", the "Freie Universitaet Berlin", the "Humboldt Universitaet Berlin", the "Un-
iversitaet Heidelberg", the "Universitaet Jena" and the "Universitaet Erlangen-Nuernberg",
each having more than 300 academic patent filings at the EPO between 2008 and 2010.
When looking at the patent intensities, smaller universities gain a “small size advantage”
and rank higher than in terms of the number of filings. However, the largest universities
listed above also reach rather high patent intensities. It can thus be stated that large tech-
nical universities and universities with huge medical facilities (e.g. Charité, Universitaet
Heidelberg, LMU Muenchen), located in large agglomerations, generate the largest num-
bers of academic patents not only in absolute terms but also per employee.
Yet, in terms of growth rates, the smaller universities (in terms of patent filings) are on top
of the list and reach the highest growth rates. Most of the larger universities in terms of
patent filings reach medium growth rates between -3 and +4 percentage points between
2006 and 2010. In addition, it could be found that especially the technical universities have
rather high growth rates.
A look at the technological profiles reveals that biotechnology and pharmaceuticals show
the largest shares of academic patents across all German universities. In chemistry and
related fields thus the highest shares of academic patents can be found, followed by fields
related to instruments and some sub-fields of electrical engineering, e.g. computer technol-
ogy and semiconductors. The smallest shares of academic patents can be observed in me-
chanical engineering and related fields. The Herfindahl-Hirschman-Index shows a rather
high spread of filings across all technology fields. The single universities within our com-
parison, however, show larger concentrations to certain fields, reflecting the technological
specializations of the universities in Germany.
6 References
Achleitner, A.-K.; Allmendinger, J.; Grupp, H.; Luther, J.; Soete, L.; Llerena, P.; Schmoch, U.; Stenke, G.; Meurer, P. and Ulbricht, L. (2009): Gutachten zu Forschung, Inno-vation und Technologischer Leistungsfähigkeit, EFI-Gutachten 2009. Berlin: Ex-pertenkommission Forschung und Innovation (EFI).
Alcacer, J. and Gittelman, M. (2006): Patent citations as a measure of knowledge flows: The influence of examiner citations. Review of Economics and Statistics, 88, 774-779.
Baeza-Yates, R. and Ribeiro-Neto, B. (2011): Modern Information Retrieval - The con-cepts and technology behind: Pearson Education Limited.

References
37
Carpenter, M.P.; Narin, F. and Woolf, P. (1981): Citation rates to technologically impor-tant patents. World Patent Information, 3, 160-163.
Crespi, G.; D'Este, P.; Fontana, R. and Geuna, A. (2011): The impact of academic patent-ing on university research and its transfer. Research Policy, 40, 55-68.
Dornbusch, F.; Schmoch, U.; Schulze, N. and Bethke, N. (2013): Identification of universi-ty-based patents: A new large-scale approach. Research Evaluation, 22, 52-63.
Egeln, J.; Gehrke, B.; Legler, H.; Licht, G.; Rammer, C. and Schmoch, U. (2007): Bericht zur technologischen Leistungsfähigkeit Deutschlands 2007. Berlin: BMBF.
Federal Ministry on Education and Research (BMBF) (2012): Federal Report on Research and Innovation 2012, Berlin: Federal Ministry on Education and Research (BMBF).
Freeman, C. (1982): The Economics of Industrial Innovation. London: Pinter Publishers.
Frietsch, R.; Neuhäusler, P.; Jung, T. and van Looy, B. (2014): Patent indicators for ma-croeconomic growth - The value of patents estimated by export volume. Technova-tion, 34, 546-558.
Frietsch, R. and Schmoch, U. (2010): Transnational Patents and International Markets. Scientometrics, 82, 185-200.
Gehrke, B.; Frietsch, R.; Neuhäusler, P.; Rammer, C. and Leidmann, M. (2013): Re-definition of research-intensive industries and goods - NIW/ISI/ZEW-Lists 2012 (= Studien zum deutschen Innovationssystem No. 8-2013). Berlin: Expertenkommis-sion Forschung und Innovation (EFI).
Geuna, A. and Rossi, F. (2011): Changes to university IPR regulations in Europe and the impact on academic patenting. Research Policy, 40, 1068-1076.
Griliches, Z. (1981): Market Value, R&D and Patents. Economics Letters, 7, 187.
Griliches, Z. (1990): Patent statistics as economic indicators: a survey. Journal of Econom-ic Literature, 18, 1661-1707.
Grupp, H. (1998): Foundations of the Economics of Innovation - Theory, Measurement and Practice. Cheltenham: Edward Elgar.
Hall, B.H.; Jaffe, A. and Trajtenberg, M. (2005): Market value and patent citations. The Rand Journal of Economics, 36 (1), 16-38.
Harhoff, D.; Scherer, F.M. and Vopel, K. (2003): Citations, Family Size, Opposition and the Value of Patent Rights. Research Policy, 32, 1343-1363.
Lissoni, F.; Lotz, P.; Schovsbo, J. and Treccani, A. (2009): Academic patenting and the professor's privilege: Evidence on Denmark from the KEINS database. Science and Public Policy, 36, 595-607.
Lissoni, F.; Llerena, P.; McKelvey, M. and Sanditov, B. (2008): Academic Patenting in Europe: New Evidence from the KEINS Database. Research Evaluation, 17, 87-102.

References
38
Michels, C.; Fu, J.; Neuhäusler, P. and Frietsch, R. (2013): Performance and Structures of the German Science System 2012 (= Studien zum deutschen Innovationssystem No. 6-2013), Expertenkommission Forschung und Innovation (EFI) (Hrsg.). Berlin.
Moed, H.F.; Glänzel, W. and Schmoch, U. (Eds.) (2004): Handbook of Quantitative Science and Technology Research. The Use of Publications and Patent Statistics in Studies of S&T Systems. Dordrecht: Kluwer Academic Publisher.
Neuhäusler, P.; Frietsch, R. and Rothengatter, O. (2014): Patent Applications - Structures, Trends and Recent Developments 2013 (= Studien zum deutschen Innovationssys-tem No. 4-2014). Berlin: Expertenkommission Forschung und Innovation (EFI).
Neuhäusler, P.; Frietsch, R.; Bethke, N. and Mund, C. (2015): Assessing companies' capa-bility to develop advanced manufacturing technologies in selected industrial sec-tors, Report to IPTS in the AMCAP project. Karlsruhe: Fraunhofer ISI.
Pavitt, K. (1982): R & D, patenting and innovative activities. A statistical exploration. Re-search Policy, 11, 33-51.
Polanyi, M. (1985): Implizites Wissen. Frankfurt am Main: Suhrkamp.
Schasse, U.; Kladroba, A. and Stenke, G. (2012): Forschungs- und Entwicklungsaktivitäten der deutschen Wirtschaft. Berlin: EFI.
Schmoch, U. (1997): Indicators and the relations between science and technology. Scien-tometrics, 38, 103-116.
Schmoch, U. and Hinze, S. (2004): Opening the Black Box. In: Moed, H.F., Glänzel, W. and Schmoch, U. (Eds.): Handbook of Qualitative Science and Technology Re-search. The Use of Publication and Patent Statistics in Studies of S&T Systems. Dordrecht: Kluwer Academic Publishers, 215-235.
Schubert, T.; Rammer, C.; Frietsch, R. and Neuhäusler, P. (2013): Innovationsindikator 2013. Bonn: Deutsche Telekom Stiftung.
Statistisches Bundesamt (2013): Personal an Hochschulen 2012, Fachserie 11, Reihe 4.4, Wiesbaden: Statistisches Bundesamt.
Trajtenberg, M. (1990): A penny for your quotes: patent citations and the value of innova-tion. Rand Journal of Economics, 21, 172-187.
Weissenberger-Eibl, M.; Frietsch, R.; Hollanders, H.; Neuhäusler, P.; Rammer, C. and Schubert, T. (2011): Innovationsindikator. Bonn: Deutsche Telekom Stiftung.