Embed Size (px)
Citation preview
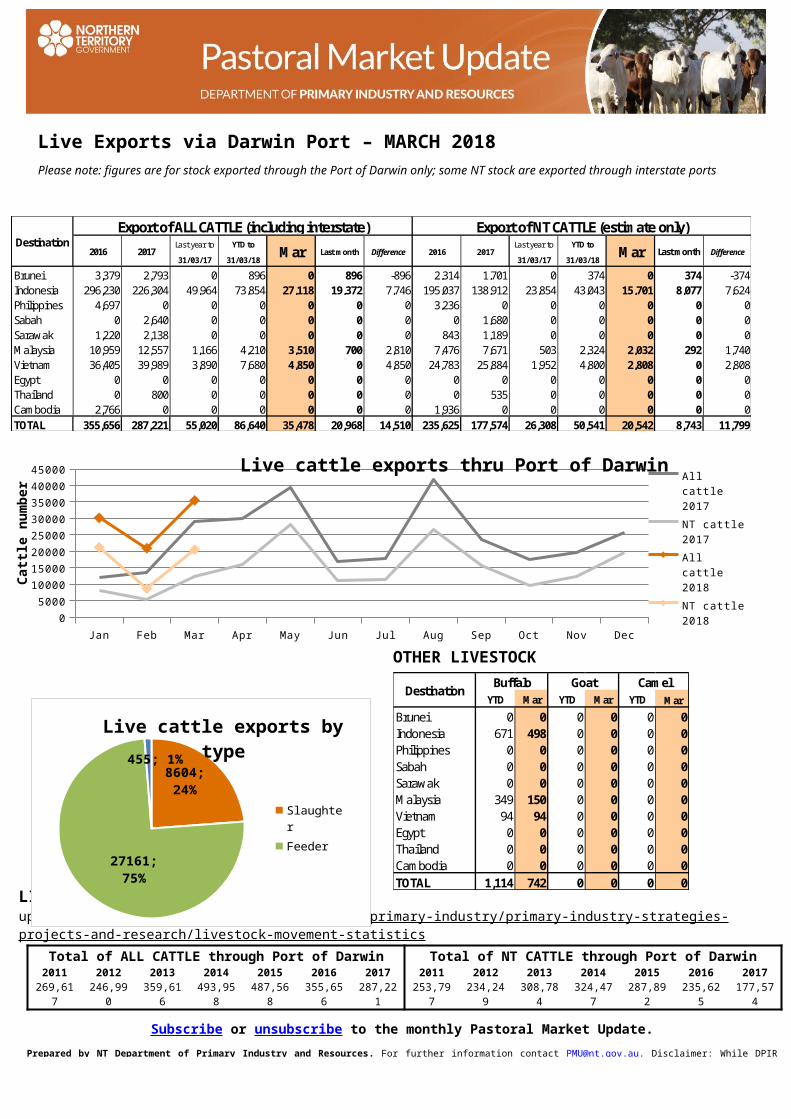
Total of ALL CATTLE through Port of Darwin Total of NT CATTLE through Port of Darwin2011 2012 2013 2014 2015 2016 2017 2011 2012 2013 2014 2015 2016 2017
269,617
246,990
359,616
493,958
487,568
355,656
287,221
253,797
234,249
308,784
324,477
287,892
235,625
177,574
Subscribe or unsubscribe to the monthly Pastoral Market Update.Prepared by NT Department of Primary Industry and Resources. For further information contact [email protected]. Disclaimer: While DPIR exercises care in the compilation and preparation of this information, no responsibility is taken for its accuracy or for the completeness of any information that is reproduced from other sources. DPIR denies any loss or damage to any person whether caused directly or indirectly by the use of any of the information provided.
OTHER LIVESTOCK
YTD Mar YTD Mar YTD MarBrunei 0 0 0 0 0 0Indonesia 671 498 0 0 0 0Philippines 0 0 0 0 0 0Sabah 0 0 0 0 0 0Sarawak 0 0 0 0 0 0Malaysia 349 150 0 0 0 0Vietnam 94 94 0 0 0 0Egypt 0 0 0 0 0 0Thailand 0 0 0 0 0 0Cambodia 0 0 0 0 0 0TOTAL 1,114 742 0 0 0 0
CamelDestination
Buffalo Goat
Live Exports via Darwin Port – MARCH 2018Please note: figures are for stock exported through the Port of Darwin only; some NT stock are exported through interstate ports
Last year to YTD to Last year to YTD to
31/03/17 31/03/18 31/03/17 31/03/18
Brunei 3,379 2,793 0 896 0 896 -896 2,314 1,701 0 374 0 374 -374Indonesia 296,230 226,304 49,964 73,854 27,118 19,372 7,746 195,037 138,912 23,854 43,043 15,701 8,077 7,624Philippines 4,697 0 0 0 0 0 0 3,236 0 0 0 0 0 0Sabah 0 2,640 0 0 0 0 0 0 1,680 0 0 0 0 0Sarawak 1,220 2,138 0 0 0 0 0 843 1,189 0 0 0 0 0Malaysia 10,959 12,557 1,166 4,210 3,510 700 2,810 7,476 7,671 503 2,324 2,032 292 1,740Vietnam 36,405 39,989 3,890 7,680 4,850 0 4,850 24,783 25,884 1,952 4,800 2,808 0 2,808Egypt 0 0 0 0 0 0 0 0 0 0 0 0 0 0Thailand 0 800 0 0 0 0 0 0 535 0 0 0 0 0Cambodia 2,766 0 0 0 0 0 0 1,936 0 0 0 0 0 0TOTAL 355,656 287,221 55,020 86,640 35,478 20,968 14,510 235,625 177,574 26,308 50,541 20,542 8,743 11,799
Last month DifferenceDestination
Export of ALL CATTLE (including interstate) Export of NT CATTLE (estimate only)
2016 Mar20172017 Mar Last month Difference 2016
LIVESTOCK MOVEMENT STATISTICSReports for livestock movements from NT to Interstate, within NT and Interstate to NT are updated biannually - see www.dpir.nt.gov.au/primary-industry/primary-industry-strategies-projects-and-research/livestock-movement-statistics
www.nt.gov.au
Jan Feb Mar Apr May Jun Jul Aug Sep Oct Nov Dec0
50001000015000200002500030000350004000045000 Live cattle exports thru Port of Darwin
All cattle 2017
NT cattle 2017
All cattle 2018
NT cattle 2018
Catt
le n
umbe
r
8604; 24%
27161; 75%
455; 1%
Live cattle exports by type
SlaughterFeederProductive