Embed Size (px)
Citation preview
Pastoral Lease Assessment Technical Manual for the Second round (2011)
i
PASTORAL LEASE ASSESSMENT TECHNICAL TRAINING MANUAL (2011)
Revised Technical Manual for the second round of assessments of pastoral leases in South Australia 2005 - 2015 Pastoral Program DENR
Pastoral Lease Assessment Technical Manual for the Second round (2011)
ii
PASTORAL LEASE ASSESSMENT TECHNICAL MANUAL
Technical detail for the methods to be used for the second round of pastoral assessments in SA
2005 - 2015
Version 3
This version prepared for use as part of the training of new Assessment staff
PASTORAL LAND MANAGEMENT GROUP
DENR
Latest update 26 August 2011
Pastoral Lease Assessment Technical Manual for the Second round (2011)
iii
ACKNOWLEDGMENTS
This document is based on manuals written for the first (baseline) assessment program by Rodger Tynan
when the Pastoral Land Management and Conservation Act came into operation in 1989 It was up-dated by
Jack White to reflect the procedures undertaken during the latter part of first round of Pastoral lease
assessment between 1995 and 2000
Refinements and changes to the detailed elements of the assessment methods resulted from input from all
members of the Pastoral Group particularly during ldquofield calibrationrdquo exercises in the early years of the
program Regular contact with interstate counterparts particularly in NT and WA has helped the group
formulate robust methods which have at least some common attributes with monitoring systems used in
these other jurisdictions
Those that contributed to and participated in the assessment process between 1990 and 2000 included ndash
Geoff Axford Dennis Barber Rick Barratt Andrew Bateman Craig Baulderstone Jenny Bourne Amanda
Brook Tonia Brown John Chappel Ben Della Torre Guy Edwards Mike Fleming Paul Gould Louisa
Halliday Justin Jay Frank Kutsche Brendan Lay Vicki Linton John McDonald John Maconochie Chris
Turner Merri Tothill Rodger Tynan and Jack White
The 2007 assessment team Adrian Friedel Simone Lawson Emma Kinnane David Oag and Jeff Stringer
have made comments and contributed to the 2007 version of this training manual
The current assessment and inspection team of Craig Baulderstone Gavin Baird Augie Facelli John
Maconochie David Oag Andrew Sheath Jeff Stringer Chris Turner and Carolyn Woods have continued to
review the methodology and clarify the information in this document Methods are still essentially consistent
with those originally used but with clarification in text
Pastoral Lease Assessment Technical Manual for the Second round (2011)
iv
CONTENTS
ACKNOWLEDGMENTS III INTRODUCTION 1 NATURAL RESOURCE MANAGEMENT (NRM) BOARDS 2 LEGISLATIVE REQUIREMENTS 2
Objectives of the Act 2 Tenure provisions 2 Assessment of land condition 2
FACTORS INFLUENCING THE METHODS USED FOR THE BASELINE ASSESSMENT IN THE FIRST
ROUND 3 Soil Conservation Districts 3 Baseline assessment timetable and resource restrictions 3 Lessee involvement in monitoring 4
PREPARATION FOR AN ASSESSMENT TRIP 6 MEETING WITH LESSEESMANAGERS 6
First Meeting 6 Final Meeting 7
DESCRIPTION OF METHODOLOGY USED IN THE BASELINE ASSESSMENTS 7 Land system mapping 7 Lease infrastructure 7 Monitoring 8 Paddock condition 8 Lease Assessment Reports 8 Capacity of the land to carry stock 9
LAND CONDITION INDEX 10 PHOTOPOINTS 10
Access and relocation of existing photopoints (finding the site) 11 NEW PHOTOPOINTS 11
Choosing the location for a new photopoint 11 Distance from water 11 Representation of a land unit11 Size and uniformity 12 Other influencing factors 12
PHOTOPOINT SETUP12 TAKING THE PHOTOGRAPH 13 RECORDING FIELD INFORMATION 14 SITE DESCRIPTION AND LOCATION 14 VEGETATION 17 VERTEBRATES19 JESSUP TRANSECT 20
Transect layout 20 Recording a Jessup transect 21
DATABASE AND GIS ndash NEEDS UPDATE FOR ALIS AND FDE 23 POST TRIP PROCEEDURE 23
LIST OF FIGURES
FIGURE 1 MAP OF PASTORAL LEASES WITHIN SOUTH AUSTRALIA 5 FIGURE 2 STATION PADDOCK PLAN 8 FIGURE 3 DIAGRAM OF A TYPICAL RANGELAND MONITORING SITE12 FIGURE 4 DIRECTIONS FOR TAKING THE PHOTOGRAPH 13 FIGURE 5 JESSUP TRANSECT LAYOUT 21
LIST OF TABLES
TABLE 1 VERTEBRATE PESTS 19
Pastoral Lease Assessment Technical Manual for the Second round (2011)
v
LIST OF PLATES
PLATE 1 PASTORALIST INVOLVEMENT IN THE ASSESSMENT PROCESS 8 PLATE 2 FENCELINE CONTRAST RESULTING FROM DIFFERENT MANAGEMENT PRACTICES 9 PLATE 3 TAKING A PHOTOGRAPH 13 PLATE 4 RECORDING A JESSUP TRANSECT 21
APPENDICES
APPENDIX 4 EROSION SEVERITYTYPE INTENSITY CRITERIA ndashFOR REFERENCE TO FIRST ROUND DATA SHEETS APPENDIX 5 CROWN SEPARATION RATIO
Pastoral Lease Assessment Technical Manual for the Second round (2011)
1
INTRODUCTION
South Australia‟s Pastoral Leasehold lands cover some 44 million hectares (443 384 kmsup2) and includes 321
Pastoral Leases which are amalgamated into 220 properties or bdquoruns‟ The 2225 km long dingo fence stretches
across the rangelands and separates the dingo free sheep leases to the south from the cattle leases in the north
The rangelands comprise spectacular ranges (Flinders and Gawlers) sand dunes gibber and alluvial plains and
tablelands Vegetation types range from mulga tall shrubland to chenopod shrubland (saltbush and bluebush)
and grasslands Rainfall is generally less than 250 mm per year that is highly variable and unpredictable with
evaporation generally exceeding 2250 mm per year
The Pastoral Land Management Group is a unit within Department of Environment and Natural Resources It is
responsible for the administration of the Pastoral Leases (by direction from the Pastoral Board) under statutory
provisions of the Pastoral Land Management and Conservation Act 1989 This group undertakes surveillance
(Pastoral Inspection) assessment and monitoring of the pastoral and other arid lands in this State
The assessment method developed in South Australia for determining land condition employs standardised
criteria and sampling routines consistent with State legislation and provides a scientific assessment of the land
condition of properties within a district The information provides the Pastoral Board with an objective basis upon
which to consider stocking levels and other factors that affect land condition on pastoral leases Photo standards
provide an accurate standardised record of the criteria used to determine the various condition classes and the
survey can therefore be repeated in the next 14-year assessment period using consistent standards The
process is objective relatively simple easily demonstrated to pastoralists and has wide potential application to
other rangeland areas
The methods were developed during the late 1980‟s in anticipation of the new Pastoral legislation Some
components are based on WARMS (Western Australian Rangeland Monitoring System) methods
At the time of initial assessment the photopoint manuals contained most of the photopoint sites including
old pastoral inspectors ldquoopportunerdquo photos which had been relocated However an objective indication of
trends in land condition which can be related to current management strategies on each lease is only
possible after subsequent re-monitoring from the original 1990‟s baseline It was assumed at the time that at
least one or more re-takes of photopoints and data would be carried out in the 14 year period between
assessments of any one property This has not occurred and trends will have to be determined from many
sequences based on two observations 14 years apart Any trends revealed can then be used to supplement
the Land Condition Index (LCI) survey findings as the LCI will also be repeated during this second round
exercise
Any repeat photos of these sites by Pastoralists or pastoral inspectors will indicate effects of seasonal
changes and will assist in directing their focus towards the land resources rather than on stock condition
The whole assessment process must be repeated every 14 years under the Act Consequently at the time
the first version of this manual was written it was noted that the original methodology should be followed so
that subsequent surveys can repeat these measurements to provide the objective basis on which to
determine trends in rangeland condition
Land Condition Index surveys were commenced in the Kingoonya Soil Board District in 1990 Separate LCI
manuals detail the methods and photo-standards to be used in each former Soil Board district now known
as NRM Group districts
Pastoralist involvement in the assessment process and ongoing monitoring is seen as an important
component in achieving long-term land care ideals and the methodology that has been developed seeks to
encourage land manager input
Pastoral Lease Assessment Technical Manual for the Second round (2011)
2
NATURAL RESOURCE MANAGEMENT (NRM) BOARDS
The District Soil Conservation Boards in the late 1980‟s were a relatively recent development in the pastoral
lands at the time of the first round of lease assessment
These Boards have been ldquotransformedrdquo into district NRM Groups of the SA Arid Lands or Murray Darling
NRM Board All areas are now covered by NRM Boards recently established under the Natural Resources
Management Act of 2004 Appendix 13 shows the Board boundaries across SA The Pastoral Land
Management Group provides information about the districts resources so that the NRM Group can provide
input to the NRM planning processes that seeks to encourage sustainable land management objectives
LEGISLATIVE REQUIREMENTS
The Pastoral Land Management and Conservation Act 1989 provides the mandate for the assessment process and the methodology has been developed to comply with the specific requirements of the Act
Objectives of the Act
The Objects (Section 4) and other sections of the PLMampC Act provide the legal charter and instructions
about what is required of an assessment of the land
The PLMampC Act (the Act) has the following land care objectives
to ensure that all pastoral land in the State is well managed and utilised prudently so that its
renewable resources are maintained and its yield sustained
to provide for the effective monitoring of the condition of pastoral land the prevention of degradation of
the land and its indigenous plant and animal life and the rehabilitation of the land in cases of damage
The Act defines degradation of the land as a decline in the quality of the natural resources of the land
resulting from human activities on the land Rehabilitation of degraded land means to bring the land back to
at least the condition it was in before its degradation having particular regard to its capacity to carry stock
and its level of soil stability
Pastoral leaseholders also have a duty (Section 7) to use good land management practices prevent
degradation of the land and to endeavour within the limits of financial resources to improve the condition of
the land They also have related and more explicit duties in connection with the Soil Conservation and Land
Care Act 1989 These duties have in general terms been included in the Natural Resources Management
(NRM) Act 2004 which will now replaces the Soil Conservation legislation
Tenure provisions
Tenure provisions under the Act include a rolling 42 year lease whereby the lease is assessed to determine
its land condition every 14 years Provided the lessee has not wilfully breached a condition of the lease
resulting in or likely to result in degradation of the land then the lease term is topped up from the remaining
28 years to a full 42 years Land management conditions of the lease may also be varied every 14 years
Section 43 of the Act provides for further protection of the land whereby the Board may direct the lessee to
take action to prevent degradation of the land eg to destock certain paddocks There is no right of appeal
under this section
Assessment of land condition
To be defensible in a legal sense (eg if contested under the jurisdiction of the Pastoral Land Tribunal) the
methodology used to assess land condition must strictly follow the directions of the Act
The Act specifies (Section 6) that the assessment of the condition of the land must
Pastoral Lease Assessment Technical Manual for the Second round (2011)
3
be thorough
include an assessment of the capacity of the land to carry stock
be conducted in accordance with recognised scientific principles
be carried out by persons who are qualified and experienced in land assessment techniques
The Objects refer to the indigenous plant and animal life consequently there is a requirement to assess at
the plant species level to determine to what degree the indigenous plant communities have been degraded
or removed It is important to note that replacement of indigenous species by introduced species is an
example of degradation under this Act Additionally the composition of indigenous communities may be
degraded under stock grazing by the replacement of palatable perennial plants with less palatable native
species
A draft assessment report on the condition of the land comprising each ldquorunrdquo (management unit) must be
completed Under the second round process the initial report preparation is carried out by the field assessor
teams The Pastoral Board will consider the report together with any comments from the lessee before
setting the lease conditions
Updating of the photopoint manual is required The capture of spatial data for any new lease infrastructure
(using vehicle-mounted downloadable GPS units) will occur at the same time as the fieldwork for the lease
assessment as the paddock plans produced during the first round process have proven most useful to the
lessees and managers of these properties
FACTORS INFLUENCING THE METHODS USED FOR THE BASELINE ASSESSMENT IN THE FIRST ROUND
Soil Conservation Districts
Soil Conservation Districts set up in the pastoral lands under the Soil Conservation and Land Care Act 1989
required Soil Boards to prepare a District Plan that seeks to provide land management guidelines for the
district The Pastoral Board agreed to provide support to these Boards by providing land system maps and
descriptions and general vegetation management guidelines for the district The baseline assessment
process therefore included a land inventory component that provided land system descriptions for each
district
Baseline assessment timetable and resource restrictions
The baseline assessment of all leases was completed in September 2000 This involved assessing
approximately 405000 kmsup2 of country that comprises the 330 pastoral leases (see Figure 1) The process
also involved
Gathering geographic information which would enable the creation or update of pastoral plans showing
lease infrastructure eg fence lines waters
provide hardcopy maps (paddock plans) of each lease
Setting up a paddock- based and long-term photopoint monitoring system
compile field data using site sheets for input to a database and GIS
Assess land condition using the Land Condition Index methodology on all sheep leases south of the Dog
Fence
Even at the time of the first baseline assessments the resource requirements imposed by the huge task of
visiting every paddock of every lease in the 10 year timeframe continually governed and influenced what
could actually be undertaken As a consequence in the latter years of the baseline assessments various
changes to the methods occurred to enable a revised legislative deadline of December 2000 to be met (the
original time specified in the Act for completion of assessments was March 1998 ndash this was extended in that
year by legislative amendment)
Pastoral Lease Assessment Technical Manual for the Second round (2011)
4
Lessee involvement in monitoring
The monitoring process is aimed at increasing the awareness of lessees in managing the land resource and
focuses on plant and soil resources to determine trends in condition under grazing practices A significant
though small number of pastoral managers have become involved in the monitoring process since the
baseline assessments and have retaken photos at photopoints to monitor seasonal or short-term changes
or effects of stock management practices
The first training lease Coondambo for the second round process in 2005 is one such property where the
manager has regularly revisited and photographed the photopoint sites
Pastoral Lease Assessment Technical Manual for the Second round (2011)
5
Figure 1 Map of pastoral leases within South Australia
Pastoral Lease Assessment Technical Manual for the Second round (2011)
6
PREPARATION FOR AN ASSESSMENT TRIP
The following check list should be completed prior to each trip Contact lesseemanager To arrange a time and location to meet at the beginning of the field trip (Act states 28 days notice) Discuss potential accommodation availability of fuel (if required) Collect property information Copy of first assessment report from Pastoral Land Management Group (PLMG) Adelaide Paddock write-ups site revisit and pastoral inspection sheets from ALIS Blank sheets for new photopoints and upload Getacs (ALIS) Blank Jessup sheets LCI transect measure of distance and list of stops generated Map updates Photopoint manual Recent stock return and past inspection reports Property docket (optional for extra information) Land system and paddock plan maps Photopoint Equipment
100 m surveyor tape with clearly visible and fixed 10 m markers and ties both ends
sledge hammer
2 m measuring rod
jarrah pegs poly posts rebar or other markers Photopointcamera box with
numbered photopoint discs
nails for securing disc to marker peg
site description and species list sheets
Jessup transect recording sheet
digital camera all batteries charged
sighting compass
hand counters (at least 2)
inclinometer Other equipment Clipboards and elastic bands Pencils and sharpener Reference books eg plant books Charged computerGetac for GPS data Hand held GPS cleared of data from previous trips Inverter checked Water tanks filled Ropes Plastic bags Cooking kit Food Fridge
MEETING WITH LESSEESMANAGERS
First Meeting
Explain the assessment process answer any questions and invite them to participate Discuss Infrastructure changes Seasonal conditions eg rainfall fire Problem areasissues Future plans General management including paddock use changes to management feral animal numbers and
kangaroo numbers
Pastoral Lease Assessment Technical Manual for the Second round (2011)
7
Availability of station facilities eg shearers quarters places to camp places to avoid Radio frequency to contact them Photopoints updated eg have they been taking photos do they have a Photopoint manual
Final Meeting
Cross reference map items and do final check that everything has been up dated Discuss
Problem areas get their perspective and plans they have to address problems
Make sure they are aware of negative comments likely to be in the report giving them the opportunity to discuss
Next stage of the process and give them contact details of who they can speak to
Get their preferred contact details eg email phone etc
DESCRIPTION OF METHODOLOGY USED IN THE BASELINE ASSESSMENTS
Land system mapping
This involved identifying landscape patterns on remotely sensed images and describing the units that make up
this pattern in the field Land System boundaries were digitised and transferred to ARCINFO to form a graphical
base for a GIS Land systems descriptions and boundaries are checked during the assessment process A
coloured land system map for each station accompanies the lease assessment report
Lease infrastructure
During the assessment process the layout of the lease is discussed with the Pastoralist and any changes
such as new water point fence line or track developments that are not included on existing maps are noted
These details are then checked in the field and accurately located using a Global Positioning Unit (GPS) and
use of Getac Amendments are then made to the digitised files to update the paddock plans (see figure 2)
and the GIS
Waypoints of features and tracking of line features for updating of mapping products will be made by the field assessors in the second round this includes both new and existing infrastructure not previously captured
Pastoral Lease Assessment Technical Manual for the Second round (2011)
8
Figure 2 Station paddock plan
Monitoring
A monitoring baseline has been established in each paddock This consists of a photopoint and a plant
species list with associated data Fixed belt transects have been used to collect ecological data This is
compiled into a ldquophotopoint manualrdquo and the lessee is given a copy and encouraged to photographically
monitor the sites These sites are usually located on water runs to enable the Pastoralist to inspect the sites
on a regular basis It was planned these sites would be re-measured by the Pastoral Management Branch
every 5-7 years (depending on resources) but in reality only sites in ldquopriority paddocksrdquo have been revisited
at this order of frequency
All previously-established photopoints which can be re-located will be revisited and re-measured Every attempt should be made to relocate photopoints but if not possible new sites will be installed
Plate 1 Pastoralist involvement in the assessment process
Paddock condition
The assessment process also describes the condition of each paddock within a lease and identifies any land
management issues that require attention This information is entered into the database so that a history for
each paddock within a district is developed
Paddocks that require immediate attention or action are detailed in the assessment report for the Board
These ldquopriority paddocksrdquo are inspected on a more regular basis and the lessee must make progress
towards rectifying the identified land management problems ldquoMonitor paddocksrdquo are identified where less
immediate attention is required or where issues should be monitored by lessees and the PLMG
Lease Assessment Reports
A lease Assessment Report is the formal document that provides details of the assessment of the land
condition over the ldquorunrdquo These reports are forwarded to the lessees who have 60 days to consider and
comment The Board then considers all comments and accepts the report
On completion of a district and all LCI scores analysed the Board will set the land management conditions of
the lease which includes a maximum stocking level The lessee may apply to the Pastoral Board at any time
for a temporary increase above this maximum Land management conditions may be adjusted and the term
of the lease extended if the lessee has complied with the lease conditions and fulfilled a duty to improve the
condition of the land
Pastoral Lease Assessment Technical Manual for the Second round (2011)
9
The report provides pastoralists or other land managers with information to ensure sound land management
practices are followed These reports provide details of a monitoring system that will supply the land user
with reliable interpretable and repeatable information to detect changes that result from land use practices
(rangeland condition and trend)
Capacity of the land to carry stock
The Pastoral Board is required to specify a maximum stocking level for the lease and the lessee is not
permitted to exceed this figure without the prior permission of the Board Stock maxima determined under
the previous Act (Pastoral Act 1936) did not include an assessment of the condition of the land and were
often set at inappropriate levels The previous maximum figure has long been represented by the pastoral
industry as the actual carrying capacity of the lease
The Objects of the Act specify that the Pastoral Board must ensure that degradation does not or is not likely
to occur Maximum stocking levels for a lease are far from ideal as an effective method for ensuring that
pastoral land is not degraded as they do not provide for stocking levels in individual paddocks under a range
of condition classes and pasture components
Plate 2 Fenceline contrast resulting from different management practices
The evidence for appropriate long term stocking levels must come primarily from-
what the land has carried in the past without severe degradation
what successful management practices have been implemented for various pasture types
how management practices generally are related to the present land condition
For the first round of assessments the Board determined that the most recent 10 year stocking average
(which includes a range of seasonal conditions) plus 20 allowance for good seasons would provide the
basis of the maximum lease offer This had the effect of bringing a number of leases with unrealistic previous
maximums to a more realistic figure The Board has reviewed its approach (and policy) on the setting of stocking limits for round two however it acknowledges that lease stocking maxima are at best a ldquoblunt instrumentrdquo for use in managing land resources Short-term adjustment of paddock stock numbers appropriate for conditions is the most effective tool but a maximum provides a statutory limit and guide to numbers likely to be able to be carried in the best seasons The current method uses a combination of LCI results paddock condition ratings area and watered area The Board considers that a better way of setting stock maximum would be to do so based on the capability of each land type within its watered area However the current inventory of these resources is not accurate to the level required and steps are being taken to work towards the future use of such a method
Pastoral Lease Assessment Technical Manual for the Second round (2011)
10
LAND CONDITION INDEX
The land condition assessment of the various pasture types involves defining what constitutes an intact or
un-degraded landscape and deciding on the criteria that indicates to what degree disturbance has occurred
The PLMC Acts emphasis on indigenous plant species largely determines an on-ground approach as it is
necessary to ascertain the mix of plant species It is also important to determine if seedlings are present as
this helps to indicate whether the land has a capacity to rehabilitate in cases of past damage It is for this
reason that remote sensing techniques may not be appropriate to determine land condition in most parts of
the sheep pastoral areas according to the Act
The following processes were used in training and calibration for these assessments during the first round of
assessments
The process of land condition assessment involves a preliminary reconnaissance survey by senior scientific
officers to determine pasture types and condition criteria This is followed by a training period for field staff to
become fully competent in using these criteria in assessing the various land condition states
The purpose of this reconnaissance survey by senior officers is to
identify the various pasture types and the sub-units called pasture components that make up these
pasture types within the district
determine the criteria that will be used to identify three condition classes within each pasture
component
Only three land condition classes (1 = poor 2 = fair and 3 = good) are described as this limits the number of
choices and therefore reduces possible observer errors To avoid the influence of seasonal changes and
drought the criteria are based primarily on perennial vegetation components with erosion levels included where
applicable The issue of so-called opportunity country involving only ephemeral growth is dealt with separately
Each condition class for each pasture component is described according to key indicator plants
Photographs and written criteria are compiled that depict each of the three condition classes for each of the
pasture components The criteria and photo-standards are compiled into manuals which are subsequently
used by the assessment officers in carrying out the lease assessments
Field staff are trained in the field to recognise the various condition classes for each of the pasture
components to achieve a uniform standard and tested thereby ensuring that all staff will assess the
condition of land uniformly and without bias
Analysis of changes from round 1 to 2 on any particular station occurs and also changes on a station
comparative to the average change of each pasture type in a district
PHOTOPOINTS
Monitoring the condition and trend of land under various grazing practices is an important on-going
management tool Photopoints are established in most paddocks to provide an indication of these trends
Revisiting these sites enables the development of a photographic sequence supplemented by vegetation
and soil information to provide an objective record of change at a site The photopoint is a sample of land
condtion in a particular paddock where located in a typical area This objective data is used to support
subjective judgements on condition in a paddock and a station overall A photopoint can also be set up in
atypical areas to monitor a specific issue
The Pastoral Land Management group will carry out regular long term monitoring of these sites However it
is important that short-term seasonal changes are also recorded if possible Pastoralists are encouraged to
regularly monitor the photopoints and have been involved in the initial establishment of the sites During this
Pastoral Lease Assessment Technical Manual for the Second round (2011)
11
process the assessment techniques can be demonstrated and the photopoint method explained to ensure
the pastoralist is able to carry on with subsequent monitoring if he or she desires
Through combining short term and long-term records our understanding of ecosystems may be improved
and future grazing practices can be adapted to suit these trends Stock records for each paddock together
with climatic information observations of grazing on desirable plants germination events and other factors
will provide a valuable record that will assist in future decision making regarding the objectives of sustainable
use
Changes in the soil and vegetation components may follow
a fire
extreme seasons wet or dry
a marked change in vegetation cover
defoliation of chenopod shrubs (saltbush or bluebush)
establishment of new shrub seedlings
death of shrubs or trees
invasion by unpalatable plants
Access and relocation of existing photopoints (finding the site)
Sites are generally placed alongside station tracks for ease of relocation If a site is located on a now-unused track then be sure to note how to find the turn-off and any other important features The photopoint peg or post should in open country be visible from the track although it is desirable to place it far enough off the track to reduce the chance of it being driven over or destroyed by road maintenance or minor realignment Experience has shown that sites placed 10-50 metres from the track provide the best chance of not being damaged or rendered useless from road effects while still being easily accessible for revisits Careful recording of the GPS and distances is essential and will assist future assessors Use of hills and other features in a photo may assist in relocation
New Photopoints
Choosing the location for a new photopoint
The photopoint location will depend on the major objective for setting it up
To encourage pastoralists to monitor the sites they need to be easily locatable Record the distance from a
permanent feature eg gate or trough and if possible record the distance from the opposite direction Use
the GPS to capture co-ordinates for the site
The following factors should be considered when choosing a site particularly when monitoring grazing
impact
Distance from water
Grazing intensity of domestic stock decreases with distance from the permanent water source Choosing sites at a consistent distance from water allows for more effective comparison between sites Assessment sites for sheep stations are generally placed about 15 km from permanent water but more importantly should monitor areas where indicator species are still present or be expected to occur In cattle areas the site may be between 2-4 km from water Where an acceptable site does not occur at the desired distance personal judgement must be used in choosing the best location taking the above factors into consideration This may involve locating the site further or a little closer to the watering point or simply abandoning the attempt to locate a site out from that particular water (especially if another track or water in the paddock is also monitored)
Representation of a land unit
If establishing a new site in a paddock which does not have any existing sites this site should be located within a recognisable land unit that is typical of the paddock For example do not choose an isolated
Pastoral Lease Assessment Technical Manual for the Second round (2011)
12
bluebush patch if it is not typical of the paddock Avoid vegetation patches that are obviously atypical or are small areas of transition between communities The unit chosen must also be one that gives a good indication of grazing impact For example do not place a site in a very stable resilient vegetation type if the majority of the paddock or areas preferred by stock are much less resilient
Size and uniformity
The site should be uniform with respect to vegetation soil slope and aspect The more extensive the area of the site the better While a site might take observations of a radius of 200m an area of 100m radius should be considered a minimum but all observations must be made within uniform land typeunit Disturbed areas such as roadsides must not be considered
Other influencing factors
Other factors likely to bias or influence the site vegetation should be recognised and avoided where possible Avoid placing sites in the following situations
on a southern fence since sheep tend to graze into the wind and in most sheep - pastoral areas of SA the prevailing wind is from the south
sheep camp areas or where animals walk parallel to the track resulting in heavily tracking
mechanically disturbed areas
water run-on areas from tracks or where old track marks or erosion is evident
Photopoint setup
Directions to each photopoint should comprise a distance and direction from a known point such as a water
point A metal numbered disc on a polydropper fibreglass or steel rebar post (or wooden peg) marks each photopoint established during or before the first round (refer figure 3) This is referred to as the marker peg
However where the marker has disappeared or deteriorated new markers will consist of some more
permanentvisible materials
Figure 3 Diagram of a typical ldquoQSrdquoPhotopoint Monitoring site
Position the marker peg 10-50 m off the track in a clearly visible location that is not likely to be disturbed
However ensure the area to be monitored is free of vehicle track effects such as water flow stock
movement etc If the marker peg is positioned further than 50 m from the track position another directional
peg near the track and give clear directions on the site sheet to the location of the marker peg or post (ie
Pastoral Lease Assessment Technical Manual for the Second round (2011)
13
bearing and distance from 1st peg) Remember it may be some time before the site is re-visited and the site
is wasted if it can‟t be re-located
A second peg usually a jarrah peg is located approximately 17 paces from the marker peg This is referred to as the sighter peg This peg is positioned such that the photograph area does not include more than 13 skyline
and the bearing will follow the line of the Jessup transect A third peg is placed 100 m from the sighter and used
to mark the end of the Jessup transect Not all sites will have a Jessup transect
Locations of all photopoint sites will be recorded with a GPS from the vehicle and marked on the updated station
paddock plan
The photograph should be taken from the marker peg Record a compass bearing between the marker peg
and sighter peg If other photos are taken from the marker peg the bearing should be marked with an
additional sighter peg
Taking the photograph
Photos are taken with a digital SLR camera and with the zoom set to replicate the original 50mm lens
cameras Photos are taken in RAW format and downloaded daily To take the photograph stand behind the
marker peg and centre on the base of the sighter peg as shown in plate 5 and figure 4 Adjust focus to
infinity to ensure all of the transect is in focus
Plate 3 Taking a photograph
Figure 4 Directions for taking the photograph
Pastoral Lease Assessment Technical Manual for the Second round (2011)
14
RECORDING FIELD INFORMATION
Site description and location
Site sheets and the information collected have changed and evolved over the period of assessment An
example of the current site sheet is shown in appendix 1
Detailed below are the fields of information together with the type of detail that should be recorded Note Completed entry example shown in brackets (italics)
QS OB RS TS Prefix to describe type of photopoint followed by photopoint number
as per the disc (eg QS 2345)
QS - Quantitative site A pegged site used for monitoring vegetation
changes with Jessup andor step-point data (formerly photopoint -
PP)
OB - Observation site A pegged site used as an observation site to
monitor changes that can be detected by a photographic sequence
eg rehabilitation spread of erosion gullies Site description includes
a list of plant species but with no measured plant data collected
RS - Reference site Sites are in areas remote from grazing influence
greater than 5 km from water in sheep country and 8 km in cattle
country Also includes exclosure sites Complete all site description
and plant and soil sheets
TS - Type Site Designated for site characteristic of mapped land
system in early part of baseline assessment process As per OB but
sites were not usually pegged
PC ndash Photo Comparison Should be used strictly where a photo is to
be compared and data collected would not be required eg A
panorama on a hill top where species in the foreground are not
relevant to the background being monitored in a photo
All photopoints should be prefixed with QS OB RS PC or TS
DATE Day Month and Year (eg 01062007)
OBSERVERS Initials of persons involved in data collection Initials of the person
filling out the sheet first followed by second observer (egMTCB)
STATION Pastoral station name Use the full name of the station (eg
Bulgunnia)
PADDOCK Full paddock name may include subscript eg formerly part Cyclone
(Monsoon)
ZONE Grid reference zone generally on the bottom of the map (eg 54)
MAP SHEET Map sheet number 150000 five digits eg 66341 1100000 four
digits eg 5434 (66341)
EASTING amp NORTHING Co-ordinates on GPS Unit
Pastoral Lease Assessment Technical Manual for the Second round (2011)
15
DATUM GDA 94
SERIES Refers to the filing system for photopoint photograph series for the
station indicates the station with the month amp year the photo was
taken First four spaces are for the station (or trip name) abbreviated
to the first four letters eg Bulg for Bulgunnia Next two are digits for the month followed by two digits for the year eg (Bulg 0691)
DIGITAL Image number
WATERPOINT Name of nearest permanent water source by direct route as a sheep
would walk Note type also eg dam trough tank (Moonbi Tank)
DISTANCE (km) Distance (to one decimal point) to water source named above ie by
direct route as a sheep would walk Record the straight-line distance from the GPS (eg 16 km)
CONDITION Condition rating for the site as per condition rating guidelines Refer to
appendix 2 for condition class attributes Notes on attributes in the site comments will help to support this judgement (eg Good)
MUD MAP Diagram of how to relocate the site clearly labelled with distances
Include paddock name and adjacent paddocks track location and
gate zero origin water location site number Orient the map with
north to the top of the page
MUD MAP COMMENTS Clear directions on how to relocate the site completed according to
the following format Keep in mind that this will be printed out for the
lessee
Distance from gate or trough direction on track to next bore or
paddock along fence Place where zero taken from eg tank trough
gate - be specific What type of peg or marker was used and how far it
is off the track and in what direction Distance to sighter peg and
bearing Jessup transect length (normally 100m) and bearing from sighter peg (Use tripmeter if no Halda rally meter or similar)
Example mud map comments (15 km south of Twin Well on track to Gladstone Bore or 35km north
of gate from Dusty paddock Zero at trough Jarrah peg and disc at 15 paces east of track Sighter peg (jarrah) at 17 paces bearing 90deg Jessup transect 100 m x 2 m x 2 at 90deg end marked by jarrah peg)
EROSION Record the severity and type of erosion according to the table in
appendix 4
COMMENTS Record notes that help to further explain observations or that will
assist interpretation of the data for present and future observations
This should include notes to indicate why the site was established and
what it is monitoring It should also include notes that help explain the
condition rating and current impacts or changes including erosion
Data entry Initials of person who entered data on the database and the date of
entry (egCB 5391)
Pastoral Lease Assessment Technical Manual for the Second round (2011)
16
Establishing new sites The site details below are only relevant for new sites set up as part of the second assessmentndash not used for revisits as part of the second round
LAND SYSTEM Land system name taken from land system map (egWeedna)
ROCK TYPE Name of rock type from geological map or rock type identified at site if
geology map incorrect (egred sandstone)
FORMATION Name of rock formation from geological map (egPound Quartzite)
LANDFORM SLOPE Slope of the site measured in degrees by use of clinometer
Do not confuse degrees with (eg2deg)
ELEMENT Landform element of site
1 crest curved in down slope profile and margins at limit of observed
curvature
2 slope considered as planar Note in comments if upper mid or
lower slope
3 flat planar
4 depression may be open or closed
PATTERN Term to describe the landform type eg alluvial plain = ALP See
appendix 3 for abbreviations and descriptions (egALP)
Pastoral Lease Assessment Technical Manual for the Second round (2011)
17
Vegetation
SIGNIFICANT RAIN Yes - data collection following rains that resulted in green ephemeral
response record dates if known of significant falls
No - dry ephemeral growth only
TYPE S (summer) - rain fell between November and March
W (winter) - rain fell between April and October
I (indistinguishable) - cannot tell if resultant green ephemeral growth is
from summer or winter rain events or is a combination of both
VEGETATION SPECIES Effort should be made to record all plant species throughout the site
Recording plant species should be carried out until most species are
recorded (ie until a period of minutes elapses before further species
are not found) Record full species name on the site sheet
If plant species is not known collect a specimen fill out details in the
herbarium collection booklet and include photopoint number and line
number of record on sheet eg 234512 so that this number can be
entered on subsequent site sheets Put the herbarium label with the
specimen in the plant press Keep a list of plants collected and PPline
number so that you can give this number to collected species at other
sites Update the site sheet with the correct species name when it
comes back from the herbarium or identity confirmed
DOM Dominant species This will be used to classify vegetation
associationsgroups
1 visually pre-dominant species forming the tallest stratum CSR
class should exceed 1 (CSR 2-6)
2 if another tallest stratum species is present (co-dominant) it is
selected OR if absent the most abundant understorey species is selected eg Mai sed
3 selected from any stratum usually a lower stratum as an indicator
species (that is a species of known environmental preferences or
of such abundance that it can‟t be ignored) or to distinguish between associations eg Atr ves
4 other conspicuous species to separate associations eg Scl obl
GRAZED If a plant is obviously grazed tick the box If grazing is mainly by
rabbits or goats this should be noted in the comments
RESPROUT If the plant has previously been grazed back and is now showing fresh
new growth tick the box Note extent in comments eg Atr ves adults
showing abundant new growth following recent rains
RECRUITMENT If seedlings are evident or new suckers (eg Bullock bush) tick the
box Note height of seedlings in comments eg Mai sed seedlings to
5 cm abundant in open areas
FRUIT If the plant is in fruit tick the box This will enable data collection on
best times for seed collection Record relevant notes in comments
Pastoral Lease Assessment Technical Manual for the Second round (2011)
18
Crown Separation Ratio (CSR) The average distance between crowns divided by the average size of
the crown grouped into various size classes (see appendix 5)
1 present lt 12 plants in 200 m radii
2 isolated clumps gt20 CSR clumps of two to five woody plants 200
m further apart
3 isolated plants gt20 CSR trees gt100 m apart
4 very sparse 6-20 CSR crowns well separated
5 sparse 1-5 CSR crowns clearly separated
6 mid dense 0-09 CSR crowns touching to slightly separated
7 closed or dense crowns touching to over lapping
JESSUP Refers to the results of the Jessup transect (see section 81
for more details)
See appendix 6 for Jessup transect recording sheet Record total
counts from the Jessup transect field sheet for each species adult
and juvenile
FIRE SCARS Yes - fire scars evident on stumps trees or fence posts Fire scars
should be recorded if fire occurred since the first assessment
No - no fire scars visible
Last burn - date of last known fire Check with the lessee and record
further details in the comments eg fierce summer fire burnt out NW
corner killing all mulga
Pastoral Lease Assessment Technical Manual for the Second round (2011)
19
Vertebrates
VERTEBRATES Presentabsent for dung tracks browsed vegetation burrows
throughout the site
It is only necessary to record current or fresh activity and record as
presence (P) Old or past activity should be noted in the comments
Table 1 Vertebrate pests
Animal Sighted Dung Tracks Browse BurrowsCamp
Rabbit visual sighting fresh buck
heaps
scratchings
present
graze line with chisel
marks on stems
warren heaps
marks
warren active
Sheep visual sighting fresh dung
active padding recent grazing camps
Cattle visual sighting fresh dung active padding recent grazing camps
Goats visual sighting fresh dung active padding browse shrubs
Note in comments
height of browse line
camps
Roos visual sighting fresh dung active padding recent grazing
(check for tail drag)
camphollows
other
Others include fox cat dingo camel horse wombat etc
Note any other useful information in the general comments for example mob of 200 goats sighted More
detailed comments can be included if needed in the paddock description
Pastoral Lease Assessment Technical Manual for the Second round (2011)
20
DENSITY MEASUREMENT OF PERENNIAL PLANT SPECIES
Perennial plants provide stability to grazing management systems due to their ability to persist during dry
periods consequently the measurement of plant attributes such as density and frequency of perennials
particularly those which are palatable are important in understanding plant dynamics and rangeland condition
Plant counts within fixed belt transects have been used to determine the density of shrubs and repeated
measurements allows density changes to be detected To ensure that observer error is minimised it is vital that
the same technique and standards are used in repeat measurements Modifications made in 1990 enabled
changes to be isolated to discreet quadrats and recruitment and deaths of cohorts can be followed
Jessup transect
This method incorporates a belt transect (a standard ecological technique) that is based on an original
survey technique used for chenopod shrublands by Jessup (1951) and further developed by Lay (1979)
Their technique involved driving a vehicle over a site for a set distance and shrubs occurring within the wheel
marks (representing the belt transect) were recorded This rather destructive technique is now simulated by
a fixed 4 m x 100 m transect and enables a density and frequency estimate of perennials for each site The
frequency estimates are not based on the optimum quadrat size for all species and the 10 m x 2 m quadrats
used should not be taken to represent true frequency readings It should also be noted that species
composition by frequency is not equivalent to composition by cover or density The length of some early
transects has varied from the current standard so ensure that any future comparisons use the same transect
configuration (see 821below)
The Jessup transect method measures the density (shrubsarea) and frequency of perennial plants at sites
where perennial cover occurs ie chenopods other shrubs and tussock (perennial) grasses Counting age
classes of shrubs (adultjuvenile) gives further information on population changes Monitoring over time
provides an indication of recruitment trends
Recording is based on all perennial shrubs within the transect being recorded by species and age class
(adultjuvenile) If the base of the plant is in the transect it is counted If the foliage only is in the transect it is
not counted
Transect layout
Jessup transects are permanently marked and comprise
transects 100 m x 2 m x 2 (see figure 5)
recordings separated into 10 m x 2 m blocks
identification of perennial plant species
less than 10 cm high andor non woody base = juvenile
more than 20 individual juvenile bushes or perennial grasses per 10 m x 2 m block = 20+ recording
1 Transects should include only one land unit and preferably be restricted to one element for data
analysis Transects are 100m long and generally at right angles to the track Walk the length of the
transect to ensure it is suitable before setting up the site and identify and discuss species present
with the other observers
2 Record a compass bearing for the transect
3 Secure a surveyors tape (marked into 10 m segments) to the sighter peg and lay out the tape to 100
m keeping the marker and sighter pegs in line
4 Check that the tape is in line with the sighter and marker peg Tension the tape and drive in the peg at the 100 m mark and secure tape to the peg It is important to have the tape extended to full
100m and tight and straight so that data is replicated at the quadrat level
Pastoral Lease Assessment Technical Manual for the Second round (2011)
21
5 If the transect layout is normal note this on the sheet if different note the transect layout on the site
description sheet and orient diagram with north to the top of the page Give clear legible directions
and bearings
Figure 5 Jessup transect layout
Recording a Jessup transect
1 Use a surveyors tape that is clearly marked into 10 m intervals If it is marked with tape check that
this has not slipped from the 10 m graduations Counts should be recorded on a Jessup transect
data sheet (see appendix 6)
2 Commence transect on left side of tape (UP) using 2 m rod (refer plate below) Check that the rod is
2 m A two metre curtain pole is ideal for this
Plate 4 Recording a Jessup transect
3 Identify each perennial species If in doubt collect a specimen
4 Easiest operation is with one person observing (counting) and another recording and acting as a
checking observer The recorder (scribe) stands at the 10 m marker intervals and the observer calls
out the adultjuvenile strikes along each 10 m transect interval The recorder can assist by spotting
hidden plants and small juvenile plants
5 For plants on quadrat margins include only in the quadrat where the rooted stem is located Count
plants only if they are more than 50 rooted within the quadrat
6 Chenopods occur in clumps and it is difficult to distinguish individuals for this reason clumps are
recorded and are recognised as individual clumps if there is more than a 30 cm gap between the
rooted stems Criteria for counting plants growing close together are as follows
End peg Sighter peg Site marker amp disc
11 12 13 14 15 16 17 18 19 20
10 9 8 7 6 5 4 3 2 1
100 m
4 m
Pastoral Lease Assessment Technical Manual for the Second round (2011)
22
distinguish between individual clumps if there is more than a 30 cm gap between rooted stems
if crowns are distinct and bases are less than 30 cm apart count each as an individual
if crowns are touching or overlapping and gap between rooted stems is less than 30 cm count
as one clump
Note In cases of perennial plants such as low bluebush being grazed the reduction of the crown
may lead to higher count of bush numbers Care is required when comparing existing Jessup counts
and noted should be recorded if this type of splitting has occurred
7 Record juveniles as plants less than 10 cm high or wide and not woody However if obviously old
woody plants are grazed back to less then this size record as adults but make comment
accordingly
If greater than 20 juvenile individuals of any species encountered in 10m interval (quadrat) record as
20+ This avoids attempting to count up to 200 seedlings but still provides sufficient data to interpret
that recruitment is occurring Large numbers of seedlings can occur following favourable conditions
and it becomes difficult to count all of these However where feasible a total count of juveniles
should be undertaken
8 For perennial grasses record clumps if greater than 10 cm high or 10 cm wide ie no juvenile
categories Record count as 20 + if greater than 20 individuals within one 10 m x 2 m block This is
to aid interpretation of step-point cover data eg low density but high cover implies large spreading
individuals high density but low cover may imply a grazing effect - site comments should indicate
this The quadrat sizes are not well suited to grasses but do provide an indication of the level of
grasses within a shrubland
9 Do not record dead or completely defoliated bushes but note occurrence in comments
10 Proceed to end of transect and commence quadrats 11-20 (ie 100-0m) on other side of tape
(down)
11 Record minor site variations in comments relating to quadrat intervals eg 20-30m large scaled area
Pastoral Lease Assessment Technical Manual for the Second round (2011)
23
DATABASE AND GIS ndash needs update for ALIS and FDE
Site information is currently entered into the Arid Lands Information System (ALIS) and print-outs and
photographs are supplied to the lessee for every photopoint on the station in the form of a Photopoint
Manual
In 1991 the Geographic Analysis and Research Unit (GAR) of the Department of Housing and Urban
Development has been assisting the Pastoral Management Branch in the establishment and maintenance of
a Pastoral Geographic Information System (Malcolm and Nicolson 1995) The GAR unit operates a
centralised ARCINFO (Environmental Systems Research Institute USA) GIS facility and is the
Environmental Node of South Australia‟s Land Information System
Extensive development was carried out on ALIS and while operational is still undergoing some further
development Management of this system is though Client Services in DENR in collaboration with the
Pastoral Program Development of a system for field data entry onto GETEC tablets has been completed
and is undergoing transition into the operational phase This will improve data collection with validation in the
field and also allow considerable time saving and possible transposition errors removing one stage in the
data entry process
Lease infrastructure information is derived from a number of sources that vary in age scale and accuracy
During the assessment process topographic maps are used as a base map and information is checked
corrected of altered using various techniques Prior to the introduction of Global Positioning Systems (GPS)
in 1992 the information was collected using bearing and distance measurement that were plotted onto base
maps The improved accuracy of GPS units over time has allowed increased accuracy and therefore an
improved mapping product
Lease maps and land system maps are available as hard copy products Watered areas for each paddock
can also be produced that indicate the extent that the lease is utilised by stock Undisturbed areas represent
quality wildlife habitats and further investigations are required to study the relationships between stocking
intensity land condition and wildlife habitat More detailed information can be found in Malcolm and
Nicolson (1995)
POST TRIP PROCEEDURE
The following checklist should be completed after each trip
Download photos and GPS co-ordinates
Data entry
Update photopoint manual and make 2 copies
Conduct LCI peer review
All spatial updates sent to GIS DWLBC
Write draft Assessment report
Submit for review
Pastoral Lease Assessment Technical Manual for the Second round (2011)
CONDITION CLASS
ATTRIBUTE EXCELLENT GOOD FAIR POOR VERY POOR
PLANT SPECIES
COMPOSITION
maximum diversity of
annual and perennial
species possible for the
land type
perennial species of
various ages
some reduction in density
of palatable and
susceptible perennials
increased proportion of
shorter lived species
perennial species of
various ages
significantly reduced
cover density andor
regeneration of
palatable species
establishment of less
preferred or
unpalatable species
dominance of annual and
ephemeral species and
perennials with relatively
low palatability
no regeneration of
desirable perennial
species existing stands
degenerate
seasonal cover of
only pioneer
ephemerals or
unpalatable weeds
large areas totally
unproductive
PLANT
PRODUCTIVITY
at full potential
sustained productivity
annual com unities
maintain litter cover but
not production in dry
seasons
some fluctuation lower in
drought and may be
higher than site potential
for some species eg
Mitchell grass
reduced overall high
productivity in good
season
low in drought
(fluctuates markedly
with season)
impaired productivity
very seasonally
dependant low or non
existent in dry seasons
areas incapable of
any plant growth
SOIL EROSION
STATUS
no erosion (other than
natural features or
processes)
plant and litter cover
protect soil from wind
and water in all
seasons
minor or slight erosion
evident
increased susceptibility of
soils to erosion in dry
seasons
moderate erosion
evident
reduced density and
cover of perennial and
litter increases
susceptibility of soils to
erosion in most
seasons
severe erosion overall
high susceptibility of soils
to erosion in all seasons
extent of past erosion
renders site susceptible
to further soil movement
if grazed at any level
unstable severely
or very eroded
Pastoral Lease Assessment Technical Manual for the Second round (2011)
Appendix 1 Erosion severitytype intensity criteria ndashfor reference to first round data sheets
EROSION SeverityType intensity criteria + RATING (max 200 m radius)
NO ACCELERATED EROSION 00
SLIGHT EROSION (10 of site affected)
slight accumulation of wind blown soil and plant bases and other obstacles 11
removal of finer soil particles evident but soil crust is largely intact 12
occasional rills (lt300 mm deep) evident 13
no gullies present 14
a few scalds present usually less than 2 m in diameter 15
MINOR EROSION (10-25 of site affected)
accumulation of soil around plant bases with plant mounds noticeably enlarged 21
evidence of pedestalling but soil loss minor and plant bases not greatly elevated 22
breaking of surface crust with small erosion faces and some redistribution of soil and
or some rilling evident 23
occasional shallow gullies only 24
scalding evident but scalds relatively small and discontinuous 25
MODERATE EROSION (25-50 of site affected)
wind piling around plant bases and other obstacles is common but no plants completely covered 31
pedestalling apparent with plant bases distinctly raised and with obvious
soil loss and deflation in parts 32
surface sheeting andor rilling common with erosion faces (andor micro-
terracing) and active redistribution of soil 33
gullying present on parts of the site 34
numerous small scalds common andor with a tendency to coalesce to form larger scalds in parts 35
SEVERE EROSION (50-75 of site affected)
extreme hummocking around plants and other obstacles some plants completely covered 41
severe pedestalling with plant bases greatly elevated and major soil loss
from deflation andor much of surface generally unstable with ripple marks 42
major rilling or surface sheeting with extensive exposure of subsoil or parent material
erosion faces (andor microterracing) and active redistribution of soil 43
widespread gullying 44
scalding extensive smaller scalds have coalesced to form large more or
less continuous scalded areas 45
EXTREME EROSION (75-100 of site affected)
general surface movement area more or less bare with formation of shifting dunes 51
most of original land surface altered any last remnants of original soil or
vegetation standing as sentinels in a barren landscape 52
water sheeting andor rilling coalesced to expose subsoil or parent material 53
extensive gullying 54
scalding more or less continuous over large areas 55
Note Record severity first and then type eg 53 = Extreme erosionScalding
Pastoral Lease Assessment Technical Manual for the Second round (2011)
Appendix 2 Crown Separation Ratio
This is a visual estimate of plant cover
It is the average distance between crowns (the area the plant takes up if viewed from above) divided by the
average size of the crown In the field this means visualising how many crowns of a given plant species can be fitted in between the distance to the nearest neighbour of that species on average over the site The
classes are as follows
CLASS TERM CSR FIELD CRITERIA
1 Present lt 12 plants lt12 plants within 200 m radius
2 Isolated clumps gt20 spaces Isolated clumps of two to five woody plants 200 m
further apart
3 Isolated Plants gt20 spaces Isolated plants
4 Very Sparse 6-20 spaces well spaced crowns well separated
5 Sparse 1-5 spaces clearly spaced crowns clearly separated
6 Mid dense 0-09 spaces crowns touching to slight separation
7 Closed or dense 0 crowns touching to overlapping
Modified from Table 14 McDonald (1990)

Pastoral Lease Assessment Technical Manual for the Second round (2011)
ii
PASTORAL LEASE ASSESSMENT TECHNICAL MANUAL
Technical detail for the methods to be used for the second round of pastoral assessments in SA
2005 - 2015
Version 3
This version prepared for use as part of the training of new Assessment staff
PASTORAL LAND MANAGEMENT GROUP
DENR
Latest update 26 August 2011
Pastoral Lease Assessment Technical Manual for the Second round (2011)
iii
ACKNOWLEDGMENTS
This document is based on manuals written for the first (baseline) assessment program by Rodger Tynan
when the Pastoral Land Management and Conservation Act came into operation in 1989 It was up-dated by
Jack White to reflect the procedures undertaken during the latter part of first round of Pastoral lease
assessment between 1995 and 2000
Refinements and changes to the detailed elements of the assessment methods resulted from input from all
members of the Pastoral Group particularly during ldquofield calibrationrdquo exercises in the early years of the
program Regular contact with interstate counterparts particularly in NT and WA has helped the group
formulate robust methods which have at least some common attributes with monitoring systems used in
these other jurisdictions
Those that contributed to and participated in the assessment process between 1990 and 2000 included ndash
Geoff Axford Dennis Barber Rick Barratt Andrew Bateman Craig Baulderstone Jenny Bourne Amanda
Brook Tonia Brown John Chappel Ben Della Torre Guy Edwards Mike Fleming Paul Gould Louisa
Halliday Justin Jay Frank Kutsche Brendan Lay Vicki Linton John McDonald John Maconochie Chris
Turner Merri Tothill Rodger Tynan and Jack White
The 2007 assessment team Adrian Friedel Simone Lawson Emma Kinnane David Oag and Jeff Stringer
have made comments and contributed to the 2007 version of this training manual
The current assessment and inspection team of Craig Baulderstone Gavin Baird Augie Facelli John
Maconochie David Oag Andrew Sheath Jeff Stringer Chris Turner and Carolyn Woods have continued to
review the methodology and clarify the information in this document Methods are still essentially consistent
with those originally used but with clarification in text
Pastoral Lease Assessment Technical Manual for the Second round (2011)
iv
CONTENTS
ACKNOWLEDGMENTS III INTRODUCTION 1 NATURAL RESOURCE MANAGEMENT (NRM) BOARDS 2 LEGISLATIVE REQUIREMENTS 2
Objectives of the Act 2 Tenure provisions 2 Assessment of land condition 2
FACTORS INFLUENCING THE METHODS USED FOR THE BASELINE ASSESSMENT IN THE FIRST
ROUND 3 Soil Conservation Districts 3 Baseline assessment timetable and resource restrictions 3 Lessee involvement in monitoring 4
PREPARATION FOR AN ASSESSMENT TRIP 6 MEETING WITH LESSEESMANAGERS 6
First Meeting 6 Final Meeting 7
DESCRIPTION OF METHODOLOGY USED IN THE BASELINE ASSESSMENTS 7 Land system mapping 7 Lease infrastructure 7 Monitoring 8 Paddock condition 8 Lease Assessment Reports 8 Capacity of the land to carry stock 9
LAND CONDITION INDEX 10 PHOTOPOINTS 10
Access and relocation of existing photopoints (finding the site) 11 NEW PHOTOPOINTS 11
Choosing the location for a new photopoint 11 Distance from water 11 Representation of a land unit11 Size and uniformity 12 Other influencing factors 12
PHOTOPOINT SETUP12 TAKING THE PHOTOGRAPH 13 RECORDING FIELD INFORMATION 14 SITE DESCRIPTION AND LOCATION 14 VEGETATION 17 VERTEBRATES19 JESSUP TRANSECT 20
Transect layout 20 Recording a Jessup transect 21
DATABASE AND GIS ndash NEEDS UPDATE FOR ALIS AND FDE 23 POST TRIP PROCEEDURE 23
LIST OF FIGURES
FIGURE 1 MAP OF PASTORAL LEASES WITHIN SOUTH AUSTRALIA 5 FIGURE 2 STATION PADDOCK PLAN 8 FIGURE 3 DIAGRAM OF A TYPICAL RANGELAND MONITORING SITE12 FIGURE 4 DIRECTIONS FOR TAKING THE PHOTOGRAPH 13 FIGURE 5 JESSUP TRANSECT LAYOUT 21
LIST OF TABLES
TABLE 1 VERTEBRATE PESTS 19
Pastoral Lease Assessment Technical Manual for the Second round (2011)
v
LIST OF PLATES
PLATE 1 PASTORALIST INVOLVEMENT IN THE ASSESSMENT PROCESS 8 PLATE 2 FENCELINE CONTRAST RESULTING FROM DIFFERENT MANAGEMENT PRACTICES 9 PLATE 3 TAKING A PHOTOGRAPH 13 PLATE 4 RECORDING A JESSUP TRANSECT 21
APPENDICES
APPENDIX 4 EROSION SEVERITYTYPE INTENSITY CRITERIA ndashFOR REFERENCE TO FIRST ROUND DATA SHEETS APPENDIX 5 CROWN SEPARATION RATIO
Pastoral Lease Assessment Technical Manual for the Second round (2011)
1
INTRODUCTION
South Australia‟s Pastoral Leasehold lands cover some 44 million hectares (443 384 kmsup2) and includes 321
Pastoral Leases which are amalgamated into 220 properties or bdquoruns‟ The 2225 km long dingo fence stretches
across the rangelands and separates the dingo free sheep leases to the south from the cattle leases in the north
The rangelands comprise spectacular ranges (Flinders and Gawlers) sand dunes gibber and alluvial plains and
tablelands Vegetation types range from mulga tall shrubland to chenopod shrubland (saltbush and bluebush)
and grasslands Rainfall is generally less than 250 mm per year that is highly variable and unpredictable with
evaporation generally exceeding 2250 mm per year
The Pastoral Land Management Group is a unit within Department of Environment and Natural Resources It is
responsible for the administration of the Pastoral Leases (by direction from the Pastoral Board) under statutory
provisions of the Pastoral Land Management and Conservation Act 1989 This group undertakes surveillance
(Pastoral Inspection) assessment and monitoring of the pastoral and other arid lands in this State
The assessment method developed in South Australia for determining land condition employs standardised
criteria and sampling routines consistent with State legislation and provides a scientific assessment of the land
condition of properties within a district The information provides the Pastoral Board with an objective basis upon
which to consider stocking levels and other factors that affect land condition on pastoral leases Photo standards
provide an accurate standardised record of the criteria used to determine the various condition classes and the
survey can therefore be repeated in the next 14-year assessment period using consistent standards The
process is objective relatively simple easily demonstrated to pastoralists and has wide potential application to
other rangeland areas
The methods were developed during the late 1980‟s in anticipation of the new Pastoral legislation Some
components are based on WARMS (Western Australian Rangeland Monitoring System) methods
At the time of initial assessment the photopoint manuals contained most of the photopoint sites including
old pastoral inspectors ldquoopportunerdquo photos which had been relocated However an objective indication of
trends in land condition which can be related to current management strategies on each lease is only
possible after subsequent re-monitoring from the original 1990‟s baseline It was assumed at the time that at
least one or more re-takes of photopoints and data would be carried out in the 14 year period between
assessments of any one property This has not occurred and trends will have to be determined from many
sequences based on two observations 14 years apart Any trends revealed can then be used to supplement
the Land Condition Index (LCI) survey findings as the LCI will also be repeated during this second round
exercise
Any repeat photos of these sites by Pastoralists or pastoral inspectors will indicate effects of seasonal
changes and will assist in directing their focus towards the land resources rather than on stock condition
The whole assessment process must be repeated every 14 years under the Act Consequently at the time
the first version of this manual was written it was noted that the original methodology should be followed so
that subsequent surveys can repeat these measurements to provide the objective basis on which to
determine trends in rangeland condition
Land Condition Index surveys were commenced in the Kingoonya Soil Board District in 1990 Separate LCI
manuals detail the methods and photo-standards to be used in each former Soil Board district now known
as NRM Group districts
Pastoralist involvement in the assessment process and ongoing monitoring is seen as an important
component in achieving long-term land care ideals and the methodology that has been developed seeks to
encourage land manager input
Pastoral Lease Assessment Technical Manual for the Second round (2011)
2
NATURAL RESOURCE MANAGEMENT (NRM) BOARDS
The District Soil Conservation Boards in the late 1980‟s were a relatively recent development in the pastoral
lands at the time of the first round of lease assessment
These Boards have been ldquotransformedrdquo into district NRM Groups of the SA Arid Lands or Murray Darling
NRM Board All areas are now covered by NRM Boards recently established under the Natural Resources
Management Act of 2004 Appendix 13 shows the Board boundaries across SA The Pastoral Land
Management Group provides information about the districts resources so that the NRM Group can provide
input to the NRM planning processes that seeks to encourage sustainable land management objectives
LEGISLATIVE REQUIREMENTS
The Pastoral Land Management and Conservation Act 1989 provides the mandate for the assessment process and the methodology has been developed to comply with the specific requirements of the Act
Objectives of the Act
The Objects (Section 4) and other sections of the PLMampC Act provide the legal charter and instructions
about what is required of an assessment of the land
The PLMampC Act (the Act) has the following land care objectives
to ensure that all pastoral land in the State is well managed and utilised prudently so that its
renewable resources are maintained and its yield sustained
to provide for the effective monitoring of the condition of pastoral land the prevention of degradation of
the land and its indigenous plant and animal life and the rehabilitation of the land in cases of damage
The Act defines degradation of the land as a decline in the quality of the natural resources of the land
resulting from human activities on the land Rehabilitation of degraded land means to bring the land back to
at least the condition it was in before its degradation having particular regard to its capacity to carry stock
and its level of soil stability
Pastoral leaseholders also have a duty (Section 7) to use good land management practices prevent
degradation of the land and to endeavour within the limits of financial resources to improve the condition of
the land They also have related and more explicit duties in connection with the Soil Conservation and Land
Care Act 1989 These duties have in general terms been included in the Natural Resources Management
(NRM) Act 2004 which will now replaces the Soil Conservation legislation
Tenure provisions
Tenure provisions under the Act include a rolling 42 year lease whereby the lease is assessed to determine
its land condition every 14 years Provided the lessee has not wilfully breached a condition of the lease
resulting in or likely to result in degradation of the land then the lease term is topped up from the remaining
28 years to a full 42 years Land management conditions of the lease may also be varied every 14 years
Section 43 of the Act provides for further protection of the land whereby the Board may direct the lessee to
take action to prevent degradation of the land eg to destock certain paddocks There is no right of appeal
under this section
Assessment of land condition
To be defensible in a legal sense (eg if contested under the jurisdiction of the Pastoral Land Tribunal) the
methodology used to assess land condition must strictly follow the directions of the Act
The Act specifies (Section 6) that the assessment of the condition of the land must
Pastoral Lease Assessment Technical Manual for the Second round (2011)
3
be thorough
include an assessment of the capacity of the land to carry stock
be conducted in accordance with recognised scientific principles
be carried out by persons who are qualified and experienced in land assessment techniques
The Objects refer to the indigenous plant and animal life consequently there is a requirement to assess at
the plant species level to determine to what degree the indigenous plant communities have been degraded
or removed It is important to note that replacement of indigenous species by introduced species is an
example of degradation under this Act Additionally the composition of indigenous communities may be
degraded under stock grazing by the replacement of palatable perennial plants with less palatable native
species
A draft assessment report on the condition of the land comprising each ldquorunrdquo (management unit) must be
completed Under the second round process the initial report preparation is carried out by the field assessor
teams The Pastoral Board will consider the report together with any comments from the lessee before
setting the lease conditions
Updating of the photopoint manual is required The capture of spatial data for any new lease infrastructure
(using vehicle-mounted downloadable GPS units) will occur at the same time as the fieldwork for the lease
assessment as the paddock plans produced during the first round process have proven most useful to the
lessees and managers of these properties
FACTORS INFLUENCING THE METHODS USED FOR THE BASELINE ASSESSMENT IN THE FIRST ROUND
Soil Conservation Districts
Soil Conservation Districts set up in the pastoral lands under the Soil Conservation and Land Care Act 1989
required Soil Boards to prepare a District Plan that seeks to provide land management guidelines for the
district The Pastoral Board agreed to provide support to these Boards by providing land system maps and
descriptions and general vegetation management guidelines for the district The baseline assessment
process therefore included a land inventory component that provided land system descriptions for each
district
Baseline assessment timetable and resource restrictions
The baseline assessment of all leases was completed in September 2000 This involved assessing
approximately 405000 kmsup2 of country that comprises the 330 pastoral leases (see Figure 1) The process
also involved
Gathering geographic information which would enable the creation or update of pastoral plans showing
lease infrastructure eg fence lines waters
provide hardcopy maps (paddock plans) of each lease
Setting up a paddock- based and long-term photopoint monitoring system
compile field data using site sheets for input to a database and GIS
Assess land condition using the Land Condition Index methodology on all sheep leases south of the Dog
Fence
Even at the time of the first baseline assessments the resource requirements imposed by the huge task of
visiting every paddock of every lease in the 10 year timeframe continually governed and influenced what
could actually be undertaken As a consequence in the latter years of the baseline assessments various
changes to the methods occurred to enable a revised legislative deadline of December 2000 to be met (the
original time specified in the Act for completion of assessments was March 1998 ndash this was extended in that
year by legislative amendment)
Pastoral Lease Assessment Technical Manual for the Second round (2011)
4
Lessee involvement in monitoring
The monitoring process is aimed at increasing the awareness of lessees in managing the land resource and
focuses on plant and soil resources to determine trends in condition under grazing practices A significant
though small number of pastoral managers have become involved in the monitoring process since the
baseline assessments and have retaken photos at photopoints to monitor seasonal or short-term changes
or effects of stock management practices
The first training lease Coondambo for the second round process in 2005 is one such property where the
manager has regularly revisited and photographed the photopoint sites
Pastoral Lease Assessment Technical Manual for the Second round (2011)
5
Figure 1 Map of pastoral leases within South Australia
Pastoral Lease Assessment Technical Manual for the Second round (2011)
6
PREPARATION FOR AN ASSESSMENT TRIP
The following check list should be completed prior to each trip Contact lesseemanager To arrange a time and location to meet at the beginning of the field trip (Act states 28 days notice) Discuss potential accommodation availability of fuel (if required) Collect property information Copy of first assessment report from Pastoral Land Management Group (PLMG) Adelaide Paddock write-ups site revisit and pastoral inspection sheets from ALIS Blank sheets for new photopoints and upload Getacs (ALIS) Blank Jessup sheets LCI transect measure of distance and list of stops generated Map updates Photopoint manual Recent stock return and past inspection reports Property docket (optional for extra information) Land system and paddock plan maps Photopoint Equipment
100 m surveyor tape with clearly visible and fixed 10 m markers and ties both ends
sledge hammer
2 m measuring rod
jarrah pegs poly posts rebar or other markers Photopointcamera box with
numbered photopoint discs
nails for securing disc to marker peg
site description and species list sheets
Jessup transect recording sheet
digital camera all batteries charged
sighting compass
hand counters (at least 2)
inclinometer Other equipment Clipboards and elastic bands Pencils and sharpener Reference books eg plant books Charged computerGetac for GPS data Hand held GPS cleared of data from previous trips Inverter checked Water tanks filled Ropes Plastic bags Cooking kit Food Fridge
MEETING WITH LESSEESMANAGERS
First Meeting
Explain the assessment process answer any questions and invite them to participate Discuss Infrastructure changes Seasonal conditions eg rainfall fire Problem areasissues Future plans General management including paddock use changes to management feral animal numbers and
kangaroo numbers
Pastoral Lease Assessment Technical Manual for the Second round (2011)
7
Availability of station facilities eg shearers quarters places to camp places to avoid Radio frequency to contact them Photopoints updated eg have they been taking photos do they have a Photopoint manual
Final Meeting
Cross reference map items and do final check that everything has been up dated Discuss
Problem areas get their perspective and plans they have to address problems
Make sure they are aware of negative comments likely to be in the report giving them the opportunity to discuss
Next stage of the process and give them contact details of who they can speak to
Get their preferred contact details eg email phone etc
DESCRIPTION OF METHODOLOGY USED IN THE BASELINE ASSESSMENTS
Land system mapping
This involved identifying landscape patterns on remotely sensed images and describing the units that make up
this pattern in the field Land System boundaries were digitised and transferred to ARCINFO to form a graphical
base for a GIS Land systems descriptions and boundaries are checked during the assessment process A
coloured land system map for each station accompanies the lease assessment report
Lease infrastructure
During the assessment process the layout of the lease is discussed with the Pastoralist and any changes
such as new water point fence line or track developments that are not included on existing maps are noted
These details are then checked in the field and accurately located using a Global Positioning Unit (GPS) and
use of Getac Amendments are then made to the digitised files to update the paddock plans (see figure 2)
and the GIS
Waypoints of features and tracking of line features for updating of mapping products will be made by the field assessors in the second round this includes both new and existing infrastructure not previously captured
Pastoral Lease Assessment Technical Manual for the Second round (2011)
8
Figure 2 Station paddock plan
Monitoring
A monitoring baseline has been established in each paddock This consists of a photopoint and a plant
species list with associated data Fixed belt transects have been used to collect ecological data This is
compiled into a ldquophotopoint manualrdquo and the lessee is given a copy and encouraged to photographically
monitor the sites These sites are usually located on water runs to enable the Pastoralist to inspect the sites
on a regular basis It was planned these sites would be re-measured by the Pastoral Management Branch
every 5-7 years (depending on resources) but in reality only sites in ldquopriority paddocksrdquo have been revisited
at this order of frequency
All previously-established photopoints which can be re-located will be revisited and re-measured Every attempt should be made to relocate photopoints but if not possible new sites will be installed
Plate 1 Pastoralist involvement in the assessment process
Paddock condition
The assessment process also describes the condition of each paddock within a lease and identifies any land
management issues that require attention This information is entered into the database so that a history for
each paddock within a district is developed
Paddocks that require immediate attention or action are detailed in the assessment report for the Board
These ldquopriority paddocksrdquo are inspected on a more regular basis and the lessee must make progress
towards rectifying the identified land management problems ldquoMonitor paddocksrdquo are identified where less
immediate attention is required or where issues should be monitored by lessees and the PLMG
Lease Assessment Reports
A lease Assessment Report is the formal document that provides details of the assessment of the land
condition over the ldquorunrdquo These reports are forwarded to the lessees who have 60 days to consider and
comment The Board then considers all comments and accepts the report
On completion of a district and all LCI scores analysed the Board will set the land management conditions of
the lease which includes a maximum stocking level The lessee may apply to the Pastoral Board at any time
for a temporary increase above this maximum Land management conditions may be adjusted and the term
of the lease extended if the lessee has complied with the lease conditions and fulfilled a duty to improve the
condition of the land
Pastoral Lease Assessment Technical Manual for the Second round (2011)
9
The report provides pastoralists or other land managers with information to ensure sound land management
practices are followed These reports provide details of a monitoring system that will supply the land user
with reliable interpretable and repeatable information to detect changes that result from land use practices
(rangeland condition and trend)
Capacity of the land to carry stock
The Pastoral Board is required to specify a maximum stocking level for the lease and the lessee is not
permitted to exceed this figure without the prior permission of the Board Stock maxima determined under
the previous Act (Pastoral Act 1936) did not include an assessment of the condition of the land and were
often set at inappropriate levels The previous maximum figure has long been represented by the pastoral
industry as the actual carrying capacity of the lease
The Objects of the Act specify that the Pastoral Board must ensure that degradation does not or is not likely
to occur Maximum stocking levels for a lease are far from ideal as an effective method for ensuring that
pastoral land is not degraded as they do not provide for stocking levels in individual paddocks under a range
of condition classes and pasture components
Plate 2 Fenceline contrast resulting from different management practices
The evidence for appropriate long term stocking levels must come primarily from-
what the land has carried in the past without severe degradation
what successful management practices have been implemented for various pasture types
how management practices generally are related to the present land condition
For the first round of assessments the Board determined that the most recent 10 year stocking average
(which includes a range of seasonal conditions) plus 20 allowance for good seasons would provide the
basis of the maximum lease offer This had the effect of bringing a number of leases with unrealistic previous
maximums to a more realistic figure The Board has reviewed its approach (and policy) on the setting of stocking limits for round two however it acknowledges that lease stocking maxima are at best a ldquoblunt instrumentrdquo for use in managing land resources Short-term adjustment of paddock stock numbers appropriate for conditions is the most effective tool but a maximum provides a statutory limit and guide to numbers likely to be able to be carried in the best seasons The current method uses a combination of LCI results paddock condition ratings area and watered area The Board considers that a better way of setting stock maximum would be to do so based on the capability of each land type within its watered area However the current inventory of these resources is not accurate to the level required and steps are being taken to work towards the future use of such a method
Pastoral Lease Assessment Technical Manual for the Second round (2011)
10
LAND CONDITION INDEX
The land condition assessment of the various pasture types involves defining what constitutes an intact or
un-degraded landscape and deciding on the criteria that indicates to what degree disturbance has occurred
The PLMC Acts emphasis on indigenous plant species largely determines an on-ground approach as it is
necessary to ascertain the mix of plant species It is also important to determine if seedlings are present as
this helps to indicate whether the land has a capacity to rehabilitate in cases of past damage It is for this
reason that remote sensing techniques may not be appropriate to determine land condition in most parts of
the sheep pastoral areas according to the Act
The following processes were used in training and calibration for these assessments during the first round of
assessments
The process of land condition assessment involves a preliminary reconnaissance survey by senior scientific
officers to determine pasture types and condition criteria This is followed by a training period for field staff to
become fully competent in using these criteria in assessing the various land condition states
The purpose of this reconnaissance survey by senior officers is to
identify the various pasture types and the sub-units called pasture components that make up these
pasture types within the district
determine the criteria that will be used to identify three condition classes within each pasture
component
Only three land condition classes (1 = poor 2 = fair and 3 = good) are described as this limits the number of
choices and therefore reduces possible observer errors To avoid the influence of seasonal changes and
drought the criteria are based primarily on perennial vegetation components with erosion levels included where
applicable The issue of so-called opportunity country involving only ephemeral growth is dealt with separately
Each condition class for each pasture component is described according to key indicator plants
Photographs and written criteria are compiled that depict each of the three condition classes for each of the
pasture components The criteria and photo-standards are compiled into manuals which are subsequently
used by the assessment officers in carrying out the lease assessments
Field staff are trained in the field to recognise the various condition classes for each of the pasture
components to achieve a uniform standard and tested thereby ensuring that all staff will assess the
condition of land uniformly and without bias
Analysis of changes from round 1 to 2 on any particular station occurs and also changes on a station
comparative to the average change of each pasture type in a district
PHOTOPOINTS
Monitoring the condition and trend of land under various grazing practices is an important on-going
management tool Photopoints are established in most paddocks to provide an indication of these trends
Revisiting these sites enables the development of a photographic sequence supplemented by vegetation
and soil information to provide an objective record of change at a site The photopoint is a sample of land
condtion in a particular paddock where located in a typical area This objective data is used to support
subjective judgements on condition in a paddock and a station overall A photopoint can also be set up in
atypical areas to monitor a specific issue
The Pastoral Land Management group will carry out regular long term monitoring of these sites However it
is important that short-term seasonal changes are also recorded if possible Pastoralists are encouraged to
regularly monitor the photopoints and have been involved in the initial establishment of the sites During this
Pastoral Lease Assessment Technical Manual for the Second round (2011)
11
process the assessment techniques can be demonstrated and the photopoint method explained to ensure
the pastoralist is able to carry on with subsequent monitoring if he or she desires
Through combining short term and long-term records our understanding of ecosystems may be improved
and future grazing practices can be adapted to suit these trends Stock records for each paddock together
with climatic information observations of grazing on desirable plants germination events and other factors
will provide a valuable record that will assist in future decision making regarding the objectives of sustainable
use
Changes in the soil and vegetation components may follow
a fire
extreme seasons wet or dry
a marked change in vegetation cover
defoliation of chenopod shrubs (saltbush or bluebush)
establishment of new shrub seedlings
death of shrubs or trees
invasion by unpalatable plants
Access and relocation of existing photopoints (finding the site)
Sites are generally placed alongside station tracks for ease of relocation If a site is located on a now-unused track then be sure to note how to find the turn-off and any other important features The photopoint peg or post should in open country be visible from the track although it is desirable to place it far enough off the track to reduce the chance of it being driven over or destroyed by road maintenance or minor realignment Experience has shown that sites placed 10-50 metres from the track provide the best chance of not being damaged or rendered useless from road effects while still being easily accessible for revisits Careful recording of the GPS and distances is essential and will assist future assessors Use of hills and other features in a photo may assist in relocation
New Photopoints
Choosing the location for a new photopoint
The photopoint location will depend on the major objective for setting it up
To encourage pastoralists to monitor the sites they need to be easily locatable Record the distance from a
permanent feature eg gate or trough and if possible record the distance from the opposite direction Use
the GPS to capture co-ordinates for the site
The following factors should be considered when choosing a site particularly when monitoring grazing
impact
Distance from water
Grazing intensity of domestic stock decreases with distance from the permanent water source Choosing sites at a consistent distance from water allows for more effective comparison between sites Assessment sites for sheep stations are generally placed about 15 km from permanent water but more importantly should monitor areas where indicator species are still present or be expected to occur In cattle areas the site may be between 2-4 km from water Where an acceptable site does not occur at the desired distance personal judgement must be used in choosing the best location taking the above factors into consideration This may involve locating the site further or a little closer to the watering point or simply abandoning the attempt to locate a site out from that particular water (especially if another track or water in the paddock is also monitored)
Representation of a land unit
If establishing a new site in a paddock which does not have any existing sites this site should be located within a recognisable land unit that is typical of the paddock For example do not choose an isolated
Pastoral Lease Assessment Technical Manual for the Second round (2011)
12
bluebush patch if it is not typical of the paddock Avoid vegetation patches that are obviously atypical or are small areas of transition between communities The unit chosen must also be one that gives a good indication of grazing impact For example do not place a site in a very stable resilient vegetation type if the majority of the paddock or areas preferred by stock are much less resilient
Size and uniformity
The site should be uniform with respect to vegetation soil slope and aspect The more extensive the area of the site the better While a site might take observations of a radius of 200m an area of 100m radius should be considered a minimum but all observations must be made within uniform land typeunit Disturbed areas such as roadsides must not be considered
Other influencing factors
Other factors likely to bias or influence the site vegetation should be recognised and avoided where possible Avoid placing sites in the following situations
on a southern fence since sheep tend to graze into the wind and in most sheep - pastoral areas of SA the prevailing wind is from the south
sheep camp areas or where animals walk parallel to the track resulting in heavily tracking
mechanically disturbed areas
water run-on areas from tracks or where old track marks or erosion is evident
Photopoint setup
Directions to each photopoint should comprise a distance and direction from a known point such as a water
point A metal numbered disc on a polydropper fibreglass or steel rebar post (or wooden peg) marks each photopoint established during or before the first round (refer figure 3) This is referred to as the marker peg
However where the marker has disappeared or deteriorated new markers will consist of some more
permanentvisible materials
Figure 3 Diagram of a typical ldquoQSrdquoPhotopoint Monitoring site
Position the marker peg 10-50 m off the track in a clearly visible location that is not likely to be disturbed
However ensure the area to be monitored is free of vehicle track effects such as water flow stock
movement etc If the marker peg is positioned further than 50 m from the track position another directional
peg near the track and give clear directions on the site sheet to the location of the marker peg or post (ie
Pastoral Lease Assessment Technical Manual for the Second round (2011)
13
bearing and distance from 1st peg) Remember it may be some time before the site is re-visited and the site
is wasted if it can‟t be re-located
A second peg usually a jarrah peg is located approximately 17 paces from the marker peg This is referred to as the sighter peg This peg is positioned such that the photograph area does not include more than 13 skyline
and the bearing will follow the line of the Jessup transect A third peg is placed 100 m from the sighter and used
to mark the end of the Jessup transect Not all sites will have a Jessup transect
Locations of all photopoint sites will be recorded with a GPS from the vehicle and marked on the updated station
paddock plan
The photograph should be taken from the marker peg Record a compass bearing between the marker peg
and sighter peg If other photos are taken from the marker peg the bearing should be marked with an
additional sighter peg
Taking the photograph
Photos are taken with a digital SLR camera and with the zoom set to replicate the original 50mm lens
cameras Photos are taken in RAW format and downloaded daily To take the photograph stand behind the
marker peg and centre on the base of the sighter peg as shown in plate 5 and figure 4 Adjust focus to
infinity to ensure all of the transect is in focus
Plate 3 Taking a photograph
Figure 4 Directions for taking the photograph
Pastoral Lease Assessment Technical Manual for the Second round (2011)
14
RECORDING FIELD INFORMATION
Site description and location
Site sheets and the information collected have changed and evolved over the period of assessment An
example of the current site sheet is shown in appendix 1
Detailed below are the fields of information together with the type of detail that should be recorded Note Completed entry example shown in brackets (italics)
QS OB RS TS Prefix to describe type of photopoint followed by photopoint number
as per the disc (eg QS 2345)
QS - Quantitative site A pegged site used for monitoring vegetation
changes with Jessup andor step-point data (formerly photopoint -
PP)
OB - Observation site A pegged site used as an observation site to
monitor changes that can be detected by a photographic sequence
eg rehabilitation spread of erosion gullies Site description includes
a list of plant species but with no measured plant data collected
RS - Reference site Sites are in areas remote from grazing influence
greater than 5 km from water in sheep country and 8 km in cattle
country Also includes exclosure sites Complete all site description
and plant and soil sheets
TS - Type Site Designated for site characteristic of mapped land
system in early part of baseline assessment process As per OB but
sites were not usually pegged
PC ndash Photo Comparison Should be used strictly where a photo is to
be compared and data collected would not be required eg A
panorama on a hill top where species in the foreground are not
relevant to the background being monitored in a photo
All photopoints should be prefixed with QS OB RS PC or TS
DATE Day Month and Year (eg 01062007)
OBSERVERS Initials of persons involved in data collection Initials of the person
filling out the sheet first followed by second observer (egMTCB)
STATION Pastoral station name Use the full name of the station (eg
Bulgunnia)
PADDOCK Full paddock name may include subscript eg formerly part Cyclone
(Monsoon)
ZONE Grid reference zone generally on the bottom of the map (eg 54)
MAP SHEET Map sheet number 150000 five digits eg 66341 1100000 four
digits eg 5434 (66341)
EASTING amp NORTHING Co-ordinates on GPS Unit
Pastoral Lease Assessment Technical Manual for the Second round (2011)
15
DATUM GDA 94
SERIES Refers to the filing system for photopoint photograph series for the
station indicates the station with the month amp year the photo was
taken First four spaces are for the station (or trip name) abbreviated
to the first four letters eg Bulg for Bulgunnia Next two are digits for the month followed by two digits for the year eg (Bulg 0691)
DIGITAL Image number
WATERPOINT Name of nearest permanent water source by direct route as a sheep
would walk Note type also eg dam trough tank (Moonbi Tank)
DISTANCE (km) Distance (to one decimal point) to water source named above ie by
direct route as a sheep would walk Record the straight-line distance from the GPS (eg 16 km)
CONDITION Condition rating for the site as per condition rating guidelines Refer to
appendix 2 for condition class attributes Notes on attributes in the site comments will help to support this judgement (eg Good)
MUD MAP Diagram of how to relocate the site clearly labelled with distances
Include paddock name and adjacent paddocks track location and
gate zero origin water location site number Orient the map with
north to the top of the page
MUD MAP COMMENTS Clear directions on how to relocate the site completed according to
the following format Keep in mind that this will be printed out for the
lessee
Distance from gate or trough direction on track to next bore or
paddock along fence Place where zero taken from eg tank trough
gate - be specific What type of peg or marker was used and how far it
is off the track and in what direction Distance to sighter peg and
bearing Jessup transect length (normally 100m) and bearing from sighter peg (Use tripmeter if no Halda rally meter or similar)
Example mud map comments (15 km south of Twin Well on track to Gladstone Bore or 35km north
of gate from Dusty paddock Zero at trough Jarrah peg and disc at 15 paces east of track Sighter peg (jarrah) at 17 paces bearing 90deg Jessup transect 100 m x 2 m x 2 at 90deg end marked by jarrah peg)
EROSION Record the severity and type of erosion according to the table in
appendix 4
COMMENTS Record notes that help to further explain observations or that will
assist interpretation of the data for present and future observations
This should include notes to indicate why the site was established and
what it is monitoring It should also include notes that help explain the
condition rating and current impacts or changes including erosion
Data entry Initials of person who entered data on the database and the date of
entry (egCB 5391)
Pastoral Lease Assessment Technical Manual for the Second round (2011)
16
Establishing new sites The site details below are only relevant for new sites set up as part of the second assessmentndash not used for revisits as part of the second round
LAND SYSTEM Land system name taken from land system map (egWeedna)
ROCK TYPE Name of rock type from geological map or rock type identified at site if
geology map incorrect (egred sandstone)
FORMATION Name of rock formation from geological map (egPound Quartzite)
LANDFORM SLOPE Slope of the site measured in degrees by use of clinometer
Do not confuse degrees with (eg2deg)
ELEMENT Landform element of site
1 crest curved in down slope profile and margins at limit of observed
curvature
2 slope considered as planar Note in comments if upper mid or
lower slope
3 flat planar
4 depression may be open or closed
PATTERN Term to describe the landform type eg alluvial plain = ALP See
appendix 3 for abbreviations and descriptions (egALP)
Pastoral Lease Assessment Technical Manual for the Second round (2011)
17
Vegetation
SIGNIFICANT RAIN Yes - data collection following rains that resulted in green ephemeral
response record dates if known of significant falls
No - dry ephemeral growth only
TYPE S (summer) - rain fell between November and March
W (winter) - rain fell between April and October
I (indistinguishable) - cannot tell if resultant green ephemeral growth is
from summer or winter rain events or is a combination of both
VEGETATION SPECIES Effort should be made to record all plant species throughout the site
Recording plant species should be carried out until most species are
recorded (ie until a period of minutes elapses before further species
are not found) Record full species name on the site sheet
If plant species is not known collect a specimen fill out details in the
herbarium collection booklet and include photopoint number and line
number of record on sheet eg 234512 so that this number can be
entered on subsequent site sheets Put the herbarium label with the
specimen in the plant press Keep a list of plants collected and PPline
number so that you can give this number to collected species at other
sites Update the site sheet with the correct species name when it
comes back from the herbarium or identity confirmed
DOM Dominant species This will be used to classify vegetation
associationsgroups
1 visually pre-dominant species forming the tallest stratum CSR
class should exceed 1 (CSR 2-6)
2 if another tallest stratum species is present (co-dominant) it is
selected OR if absent the most abundant understorey species is selected eg Mai sed
3 selected from any stratum usually a lower stratum as an indicator
species (that is a species of known environmental preferences or
of such abundance that it can‟t be ignored) or to distinguish between associations eg Atr ves
4 other conspicuous species to separate associations eg Scl obl
GRAZED If a plant is obviously grazed tick the box If grazing is mainly by
rabbits or goats this should be noted in the comments
RESPROUT If the plant has previously been grazed back and is now showing fresh
new growth tick the box Note extent in comments eg Atr ves adults
showing abundant new growth following recent rains
RECRUITMENT If seedlings are evident or new suckers (eg Bullock bush) tick the
box Note height of seedlings in comments eg Mai sed seedlings to
5 cm abundant in open areas
FRUIT If the plant is in fruit tick the box This will enable data collection on
best times for seed collection Record relevant notes in comments
Pastoral Lease Assessment Technical Manual for the Second round (2011)
18
Crown Separation Ratio (CSR) The average distance between crowns divided by the average size of
the crown grouped into various size classes (see appendix 5)
1 present lt 12 plants in 200 m radii
2 isolated clumps gt20 CSR clumps of two to five woody plants 200
m further apart
3 isolated plants gt20 CSR trees gt100 m apart
4 very sparse 6-20 CSR crowns well separated
5 sparse 1-5 CSR crowns clearly separated
6 mid dense 0-09 CSR crowns touching to slightly separated
7 closed or dense crowns touching to over lapping
JESSUP Refers to the results of the Jessup transect (see section 81
for more details)
See appendix 6 for Jessup transect recording sheet Record total
counts from the Jessup transect field sheet for each species adult
and juvenile
FIRE SCARS Yes - fire scars evident on stumps trees or fence posts Fire scars
should be recorded if fire occurred since the first assessment
No - no fire scars visible
Last burn - date of last known fire Check with the lessee and record
further details in the comments eg fierce summer fire burnt out NW
corner killing all mulga
Pastoral Lease Assessment Technical Manual for the Second round (2011)
19
Vertebrates
VERTEBRATES Presentabsent for dung tracks browsed vegetation burrows
throughout the site
It is only necessary to record current or fresh activity and record as
presence (P) Old or past activity should be noted in the comments
Table 1 Vertebrate pests
Animal Sighted Dung Tracks Browse BurrowsCamp
Rabbit visual sighting fresh buck
heaps
scratchings
present
graze line with chisel
marks on stems
warren heaps
marks
warren active
Sheep visual sighting fresh dung
active padding recent grazing camps
Cattle visual sighting fresh dung active padding recent grazing camps
Goats visual sighting fresh dung active padding browse shrubs
Note in comments
height of browse line
camps
Roos visual sighting fresh dung active padding recent grazing
(check for tail drag)
camphollows
other
Others include fox cat dingo camel horse wombat etc
Note any other useful information in the general comments for example mob of 200 goats sighted More
detailed comments can be included if needed in the paddock description
Pastoral Lease Assessment Technical Manual for the Second round (2011)
20
DENSITY MEASUREMENT OF PERENNIAL PLANT SPECIES
Perennial plants provide stability to grazing management systems due to their ability to persist during dry
periods consequently the measurement of plant attributes such as density and frequency of perennials
particularly those which are palatable are important in understanding plant dynamics and rangeland condition
Plant counts within fixed belt transects have been used to determine the density of shrubs and repeated
measurements allows density changes to be detected To ensure that observer error is minimised it is vital that
the same technique and standards are used in repeat measurements Modifications made in 1990 enabled
changes to be isolated to discreet quadrats and recruitment and deaths of cohorts can be followed
Jessup transect
This method incorporates a belt transect (a standard ecological technique) that is based on an original
survey technique used for chenopod shrublands by Jessup (1951) and further developed by Lay (1979)
Their technique involved driving a vehicle over a site for a set distance and shrubs occurring within the wheel
marks (representing the belt transect) were recorded This rather destructive technique is now simulated by
a fixed 4 m x 100 m transect and enables a density and frequency estimate of perennials for each site The
frequency estimates are not based on the optimum quadrat size for all species and the 10 m x 2 m quadrats
used should not be taken to represent true frequency readings It should also be noted that species
composition by frequency is not equivalent to composition by cover or density The length of some early
transects has varied from the current standard so ensure that any future comparisons use the same transect
configuration (see 821below)
The Jessup transect method measures the density (shrubsarea) and frequency of perennial plants at sites
where perennial cover occurs ie chenopods other shrubs and tussock (perennial) grasses Counting age
classes of shrubs (adultjuvenile) gives further information on population changes Monitoring over time
provides an indication of recruitment trends
Recording is based on all perennial shrubs within the transect being recorded by species and age class
(adultjuvenile) If the base of the plant is in the transect it is counted If the foliage only is in the transect it is
not counted
Transect layout
Jessup transects are permanently marked and comprise
transects 100 m x 2 m x 2 (see figure 5)
recordings separated into 10 m x 2 m blocks
identification of perennial plant species
less than 10 cm high andor non woody base = juvenile
more than 20 individual juvenile bushes or perennial grasses per 10 m x 2 m block = 20+ recording
1 Transects should include only one land unit and preferably be restricted to one element for data
analysis Transects are 100m long and generally at right angles to the track Walk the length of the
transect to ensure it is suitable before setting up the site and identify and discuss species present
with the other observers
2 Record a compass bearing for the transect
3 Secure a surveyors tape (marked into 10 m segments) to the sighter peg and lay out the tape to 100
m keeping the marker and sighter pegs in line
4 Check that the tape is in line with the sighter and marker peg Tension the tape and drive in the peg at the 100 m mark and secure tape to the peg It is important to have the tape extended to full
100m and tight and straight so that data is replicated at the quadrat level
Pastoral Lease Assessment Technical Manual for the Second round (2011)
21
5 If the transect layout is normal note this on the sheet if different note the transect layout on the site
description sheet and orient diagram with north to the top of the page Give clear legible directions
and bearings
Figure 5 Jessup transect layout
Recording a Jessup transect
1 Use a surveyors tape that is clearly marked into 10 m intervals If it is marked with tape check that
this has not slipped from the 10 m graduations Counts should be recorded on a Jessup transect
data sheet (see appendix 6)
2 Commence transect on left side of tape (UP) using 2 m rod (refer plate below) Check that the rod is
2 m A two metre curtain pole is ideal for this
Plate 4 Recording a Jessup transect
3 Identify each perennial species If in doubt collect a specimen
4 Easiest operation is with one person observing (counting) and another recording and acting as a
checking observer The recorder (scribe) stands at the 10 m marker intervals and the observer calls
out the adultjuvenile strikes along each 10 m transect interval The recorder can assist by spotting
hidden plants and small juvenile plants
5 For plants on quadrat margins include only in the quadrat where the rooted stem is located Count
plants only if they are more than 50 rooted within the quadrat
6 Chenopods occur in clumps and it is difficult to distinguish individuals for this reason clumps are
recorded and are recognised as individual clumps if there is more than a 30 cm gap between the
rooted stems Criteria for counting plants growing close together are as follows
End peg Sighter peg Site marker amp disc
11 12 13 14 15 16 17 18 19 20
10 9 8 7 6 5 4 3 2 1
100 m
4 m
Pastoral Lease Assessment Technical Manual for the Second round (2011)
22
distinguish between individual clumps if there is more than a 30 cm gap between rooted stems
if crowns are distinct and bases are less than 30 cm apart count each as an individual
if crowns are touching or overlapping and gap between rooted stems is less than 30 cm count
as one clump
Note In cases of perennial plants such as low bluebush being grazed the reduction of the crown
may lead to higher count of bush numbers Care is required when comparing existing Jessup counts
and noted should be recorded if this type of splitting has occurred
7 Record juveniles as plants less than 10 cm high or wide and not woody However if obviously old
woody plants are grazed back to less then this size record as adults but make comment
accordingly
If greater than 20 juvenile individuals of any species encountered in 10m interval (quadrat) record as
20+ This avoids attempting to count up to 200 seedlings but still provides sufficient data to interpret
that recruitment is occurring Large numbers of seedlings can occur following favourable conditions
and it becomes difficult to count all of these However where feasible a total count of juveniles
should be undertaken
8 For perennial grasses record clumps if greater than 10 cm high or 10 cm wide ie no juvenile
categories Record count as 20 + if greater than 20 individuals within one 10 m x 2 m block This is
to aid interpretation of step-point cover data eg low density but high cover implies large spreading
individuals high density but low cover may imply a grazing effect - site comments should indicate
this The quadrat sizes are not well suited to grasses but do provide an indication of the level of
grasses within a shrubland
9 Do not record dead or completely defoliated bushes but note occurrence in comments
10 Proceed to end of transect and commence quadrats 11-20 (ie 100-0m) on other side of tape
(down)
11 Record minor site variations in comments relating to quadrat intervals eg 20-30m large scaled area
Pastoral Lease Assessment Technical Manual for the Second round (2011)
23
DATABASE AND GIS ndash needs update for ALIS and FDE
Site information is currently entered into the Arid Lands Information System (ALIS) and print-outs and
photographs are supplied to the lessee for every photopoint on the station in the form of a Photopoint
Manual
In 1991 the Geographic Analysis and Research Unit (GAR) of the Department of Housing and Urban
Development has been assisting the Pastoral Management Branch in the establishment and maintenance of
a Pastoral Geographic Information System (Malcolm and Nicolson 1995) The GAR unit operates a
centralised ARCINFO (Environmental Systems Research Institute USA) GIS facility and is the
Environmental Node of South Australia‟s Land Information System
Extensive development was carried out on ALIS and while operational is still undergoing some further
development Management of this system is though Client Services in DENR in collaboration with the
Pastoral Program Development of a system for field data entry onto GETEC tablets has been completed
and is undergoing transition into the operational phase This will improve data collection with validation in the
field and also allow considerable time saving and possible transposition errors removing one stage in the
data entry process
Lease infrastructure information is derived from a number of sources that vary in age scale and accuracy
During the assessment process topographic maps are used as a base map and information is checked
corrected of altered using various techniques Prior to the introduction of Global Positioning Systems (GPS)
in 1992 the information was collected using bearing and distance measurement that were plotted onto base
maps The improved accuracy of GPS units over time has allowed increased accuracy and therefore an
improved mapping product
Lease maps and land system maps are available as hard copy products Watered areas for each paddock
can also be produced that indicate the extent that the lease is utilised by stock Undisturbed areas represent
quality wildlife habitats and further investigations are required to study the relationships between stocking
intensity land condition and wildlife habitat More detailed information can be found in Malcolm and
Nicolson (1995)
POST TRIP PROCEEDURE
The following checklist should be completed after each trip
Download photos and GPS co-ordinates
Data entry
Update photopoint manual and make 2 copies
Conduct LCI peer review
All spatial updates sent to GIS DWLBC
Write draft Assessment report
Submit for review
Pastoral Lease Assessment Technical Manual for the Second round (2011)
CONDITION CLASS
ATTRIBUTE EXCELLENT GOOD FAIR POOR VERY POOR
PLANT SPECIES
COMPOSITION
maximum diversity of
annual and perennial
species possible for the
land type
perennial species of
various ages
some reduction in density
of palatable and
susceptible perennials
increased proportion of
shorter lived species
perennial species of
various ages
significantly reduced
cover density andor
regeneration of
palatable species
establishment of less
preferred or
unpalatable species
dominance of annual and
ephemeral species and
perennials with relatively
low palatability
no regeneration of
desirable perennial
species existing stands
degenerate
seasonal cover of
only pioneer
ephemerals or
unpalatable weeds
large areas totally
unproductive
PLANT
PRODUCTIVITY
at full potential
sustained productivity
annual com unities
maintain litter cover but
not production in dry
seasons
some fluctuation lower in
drought and may be
higher than site potential
for some species eg
Mitchell grass
reduced overall high
productivity in good
season
low in drought
(fluctuates markedly
with season)
impaired productivity
very seasonally
dependant low or non
existent in dry seasons
areas incapable of
any plant growth
SOIL EROSION
STATUS
no erosion (other than
natural features or
processes)
plant and litter cover
protect soil from wind
and water in all
seasons
minor or slight erosion
evident
increased susceptibility of
soils to erosion in dry
seasons
moderate erosion
evident
reduced density and
cover of perennial and
litter increases
susceptibility of soils to
erosion in most
seasons
severe erosion overall
high susceptibility of soils
to erosion in all seasons
extent of past erosion
renders site susceptible
to further soil movement
if grazed at any level
unstable severely
or very eroded
Pastoral Lease Assessment Technical Manual for the Second round (2011)
Appendix 1 Erosion severitytype intensity criteria ndashfor reference to first round data sheets
EROSION SeverityType intensity criteria + RATING (max 200 m radius)
NO ACCELERATED EROSION 00
SLIGHT EROSION (10 of site affected)
slight accumulation of wind blown soil and plant bases and other obstacles 11
removal of finer soil particles evident but soil crust is largely intact 12
occasional rills (lt300 mm deep) evident 13
no gullies present 14
a few scalds present usually less than 2 m in diameter 15
MINOR EROSION (10-25 of site affected)
accumulation of soil around plant bases with plant mounds noticeably enlarged 21
evidence of pedestalling but soil loss minor and plant bases not greatly elevated 22
breaking of surface crust with small erosion faces and some redistribution of soil and
or some rilling evident 23
occasional shallow gullies only 24
scalding evident but scalds relatively small and discontinuous 25
MODERATE EROSION (25-50 of site affected)
wind piling around plant bases and other obstacles is common but no plants completely covered 31
pedestalling apparent with plant bases distinctly raised and with obvious
soil loss and deflation in parts 32
surface sheeting andor rilling common with erosion faces (andor micro-
terracing) and active redistribution of soil 33
gullying present on parts of the site 34
numerous small scalds common andor with a tendency to coalesce to form larger scalds in parts 35
SEVERE EROSION (50-75 of site affected)
extreme hummocking around plants and other obstacles some plants completely covered 41
severe pedestalling with plant bases greatly elevated and major soil loss
from deflation andor much of surface generally unstable with ripple marks 42
major rilling or surface sheeting with extensive exposure of subsoil or parent material
erosion faces (andor microterracing) and active redistribution of soil 43
widespread gullying 44
scalding extensive smaller scalds have coalesced to form large more or
less continuous scalded areas 45
EXTREME EROSION (75-100 of site affected)
general surface movement area more or less bare with formation of shifting dunes 51
most of original land surface altered any last remnants of original soil or
vegetation standing as sentinels in a barren landscape 52
water sheeting andor rilling coalesced to expose subsoil or parent material 53
extensive gullying 54
scalding more or less continuous over large areas 55
Note Record severity first and then type eg 53 = Extreme erosionScalding
Pastoral Lease Assessment Technical Manual for the Second round (2011)
Appendix 2 Crown Separation Ratio
This is a visual estimate of plant cover
It is the average distance between crowns (the area the plant takes up if viewed from above) divided by the
average size of the crown In the field this means visualising how many crowns of a given plant species can be fitted in between the distance to the nearest neighbour of that species on average over the site The
classes are as follows
CLASS TERM CSR FIELD CRITERIA
1 Present lt 12 plants lt12 plants within 200 m radius
2 Isolated clumps gt20 spaces Isolated clumps of two to five woody plants 200 m
further apart
3 Isolated Plants gt20 spaces Isolated plants
4 Very Sparse 6-20 spaces well spaced crowns well separated
5 Sparse 1-5 spaces clearly spaced crowns clearly separated
6 Mid dense 0-09 spaces crowns touching to slight separation
7 Closed or dense 0 crowns touching to overlapping
Modified from Table 14 McDonald (1990)
Pastoral Lease Assessment Technical Manual for the Second round (2011)
iii
ACKNOWLEDGMENTS
This document is based on manuals written for the first (baseline) assessment program by Rodger Tynan
when the Pastoral Land Management and Conservation Act came into operation in 1989 It was up-dated by
Jack White to reflect the procedures undertaken during the latter part of first round of Pastoral lease
assessment between 1995 and 2000
Refinements and changes to the detailed elements of the assessment methods resulted from input from all
members of the Pastoral Group particularly during ldquofield calibrationrdquo exercises in the early years of the
program Regular contact with interstate counterparts particularly in NT and WA has helped the group
formulate robust methods which have at least some common attributes with monitoring systems used in
these other jurisdictions
Those that contributed to and participated in the assessment process between 1990 and 2000 included ndash
Geoff Axford Dennis Barber Rick Barratt Andrew Bateman Craig Baulderstone Jenny Bourne Amanda
Brook Tonia Brown John Chappel Ben Della Torre Guy Edwards Mike Fleming Paul Gould Louisa
Halliday Justin Jay Frank Kutsche Brendan Lay Vicki Linton John McDonald John Maconochie Chris
Turner Merri Tothill Rodger Tynan and Jack White
The 2007 assessment team Adrian Friedel Simone Lawson Emma Kinnane David Oag and Jeff Stringer
have made comments and contributed to the 2007 version of this training manual
The current assessment and inspection team of Craig Baulderstone Gavin Baird Augie Facelli John
Maconochie David Oag Andrew Sheath Jeff Stringer Chris Turner and Carolyn Woods have continued to
review the methodology and clarify the information in this document Methods are still essentially consistent
with those originally used but with clarification in text
Pastoral Lease Assessment Technical Manual for the Second round (2011)
iv
CONTENTS
ACKNOWLEDGMENTS III INTRODUCTION 1 NATURAL RESOURCE MANAGEMENT (NRM) BOARDS 2 LEGISLATIVE REQUIREMENTS 2
Objectives of the Act 2 Tenure provisions 2 Assessment of land condition 2
FACTORS INFLUENCING THE METHODS USED FOR THE BASELINE ASSESSMENT IN THE FIRST
ROUND 3 Soil Conservation Districts 3 Baseline assessment timetable and resource restrictions 3 Lessee involvement in monitoring 4
PREPARATION FOR AN ASSESSMENT TRIP 6 MEETING WITH LESSEESMANAGERS 6
First Meeting 6 Final Meeting 7
DESCRIPTION OF METHODOLOGY USED IN THE BASELINE ASSESSMENTS 7 Land system mapping 7 Lease infrastructure 7 Monitoring 8 Paddock condition 8 Lease Assessment Reports 8 Capacity of the land to carry stock 9
LAND CONDITION INDEX 10 PHOTOPOINTS 10
Access and relocation of existing photopoints (finding the site) 11 NEW PHOTOPOINTS 11
Choosing the location for a new photopoint 11 Distance from water 11 Representation of a land unit11 Size and uniformity 12 Other influencing factors 12
PHOTOPOINT SETUP12 TAKING THE PHOTOGRAPH 13 RECORDING FIELD INFORMATION 14 SITE DESCRIPTION AND LOCATION 14 VEGETATION 17 VERTEBRATES19 JESSUP TRANSECT 20
Transect layout 20 Recording a Jessup transect 21
DATABASE AND GIS ndash NEEDS UPDATE FOR ALIS AND FDE 23 POST TRIP PROCEEDURE 23
LIST OF FIGURES
FIGURE 1 MAP OF PASTORAL LEASES WITHIN SOUTH AUSTRALIA 5 FIGURE 2 STATION PADDOCK PLAN 8 FIGURE 3 DIAGRAM OF A TYPICAL RANGELAND MONITORING SITE12 FIGURE 4 DIRECTIONS FOR TAKING THE PHOTOGRAPH 13 FIGURE 5 JESSUP TRANSECT LAYOUT 21
LIST OF TABLES
TABLE 1 VERTEBRATE PESTS 19
Pastoral Lease Assessment Technical Manual for the Second round (2011)
v
LIST OF PLATES
PLATE 1 PASTORALIST INVOLVEMENT IN THE ASSESSMENT PROCESS 8 PLATE 2 FENCELINE CONTRAST RESULTING FROM DIFFERENT MANAGEMENT PRACTICES 9 PLATE 3 TAKING A PHOTOGRAPH 13 PLATE 4 RECORDING A JESSUP TRANSECT 21
APPENDICES
APPENDIX 4 EROSION SEVERITYTYPE INTENSITY CRITERIA ndashFOR REFERENCE TO FIRST ROUND DATA SHEETS APPENDIX 5 CROWN SEPARATION RATIO
Pastoral Lease Assessment Technical Manual for the Second round (2011)
1
INTRODUCTION
South Australia‟s Pastoral Leasehold lands cover some 44 million hectares (443 384 kmsup2) and includes 321
Pastoral Leases which are amalgamated into 220 properties or bdquoruns‟ The 2225 km long dingo fence stretches
across the rangelands and separates the dingo free sheep leases to the south from the cattle leases in the north
The rangelands comprise spectacular ranges (Flinders and Gawlers) sand dunes gibber and alluvial plains and
tablelands Vegetation types range from mulga tall shrubland to chenopod shrubland (saltbush and bluebush)
and grasslands Rainfall is generally less than 250 mm per year that is highly variable and unpredictable with
evaporation generally exceeding 2250 mm per year
The Pastoral Land Management Group is a unit within Department of Environment and Natural Resources It is
responsible for the administration of the Pastoral Leases (by direction from the Pastoral Board) under statutory
provisions of the Pastoral Land Management and Conservation Act 1989 This group undertakes surveillance
(Pastoral Inspection) assessment and monitoring of the pastoral and other arid lands in this State
The assessment method developed in South Australia for determining land condition employs standardised
criteria and sampling routines consistent with State legislation and provides a scientific assessment of the land
condition of properties within a district The information provides the Pastoral Board with an objective basis upon
which to consider stocking levels and other factors that affect land condition on pastoral leases Photo standards
provide an accurate standardised record of the criteria used to determine the various condition classes and the
survey can therefore be repeated in the next 14-year assessment period using consistent standards The
process is objective relatively simple easily demonstrated to pastoralists and has wide potential application to
other rangeland areas
The methods were developed during the late 1980‟s in anticipation of the new Pastoral legislation Some
components are based on WARMS (Western Australian Rangeland Monitoring System) methods
At the time of initial assessment the photopoint manuals contained most of the photopoint sites including
old pastoral inspectors ldquoopportunerdquo photos which had been relocated However an objective indication of
trends in land condition which can be related to current management strategies on each lease is only
possible after subsequent re-monitoring from the original 1990‟s baseline It was assumed at the time that at
least one or more re-takes of photopoints and data would be carried out in the 14 year period between
assessments of any one property This has not occurred and trends will have to be determined from many
sequences based on two observations 14 years apart Any trends revealed can then be used to supplement
the Land Condition Index (LCI) survey findings as the LCI will also be repeated during this second round
exercise
Any repeat photos of these sites by Pastoralists or pastoral inspectors will indicate effects of seasonal
changes and will assist in directing their focus towards the land resources rather than on stock condition
The whole assessment process must be repeated every 14 years under the Act Consequently at the time
the first version of this manual was written it was noted that the original methodology should be followed so
that subsequent surveys can repeat these measurements to provide the objective basis on which to
determine trends in rangeland condition
Land Condition Index surveys were commenced in the Kingoonya Soil Board District in 1990 Separate LCI
manuals detail the methods and photo-standards to be used in each former Soil Board district now known
as NRM Group districts
Pastoralist involvement in the assessment process and ongoing monitoring is seen as an important
component in achieving long-term land care ideals and the methodology that has been developed seeks to
encourage land manager input
Pastoral Lease Assessment Technical Manual for the Second round (2011)
2
NATURAL RESOURCE MANAGEMENT (NRM) BOARDS
The District Soil Conservation Boards in the late 1980‟s were a relatively recent development in the pastoral
lands at the time of the first round of lease assessment
These Boards have been ldquotransformedrdquo into district NRM Groups of the SA Arid Lands or Murray Darling
NRM Board All areas are now covered by NRM Boards recently established under the Natural Resources
Management Act of 2004 Appendix 13 shows the Board boundaries across SA The Pastoral Land
Management Group provides information about the districts resources so that the NRM Group can provide
input to the NRM planning processes that seeks to encourage sustainable land management objectives
LEGISLATIVE REQUIREMENTS
The Pastoral Land Management and Conservation Act 1989 provides the mandate for the assessment process and the methodology has been developed to comply with the specific requirements of the Act
Objectives of the Act
The Objects (Section 4) and other sections of the PLMampC Act provide the legal charter and instructions
about what is required of an assessment of the land
The PLMampC Act (the Act) has the following land care objectives
to ensure that all pastoral land in the State is well managed and utilised prudently so that its
renewable resources are maintained and its yield sustained
to provide for the effective monitoring of the condition of pastoral land the prevention of degradation of
the land and its indigenous plant and animal life and the rehabilitation of the land in cases of damage
The Act defines degradation of the land as a decline in the quality of the natural resources of the land
resulting from human activities on the land Rehabilitation of degraded land means to bring the land back to
at least the condition it was in before its degradation having particular regard to its capacity to carry stock
and its level of soil stability
Pastoral leaseholders also have a duty (Section 7) to use good land management practices prevent
degradation of the land and to endeavour within the limits of financial resources to improve the condition of
the land They also have related and more explicit duties in connection with the Soil Conservation and Land
Care Act 1989 These duties have in general terms been included in the Natural Resources Management
(NRM) Act 2004 which will now replaces the Soil Conservation legislation
Tenure provisions
Tenure provisions under the Act include a rolling 42 year lease whereby the lease is assessed to determine
its land condition every 14 years Provided the lessee has not wilfully breached a condition of the lease
resulting in or likely to result in degradation of the land then the lease term is topped up from the remaining
28 years to a full 42 years Land management conditions of the lease may also be varied every 14 years
Section 43 of the Act provides for further protection of the land whereby the Board may direct the lessee to
take action to prevent degradation of the land eg to destock certain paddocks There is no right of appeal
under this section
Assessment of land condition
To be defensible in a legal sense (eg if contested under the jurisdiction of the Pastoral Land Tribunal) the
methodology used to assess land condition must strictly follow the directions of the Act
The Act specifies (Section 6) that the assessment of the condition of the land must
Pastoral Lease Assessment Technical Manual for the Second round (2011)
3
be thorough
include an assessment of the capacity of the land to carry stock
be conducted in accordance with recognised scientific principles
be carried out by persons who are qualified and experienced in land assessment techniques
The Objects refer to the indigenous plant and animal life consequently there is a requirement to assess at
the plant species level to determine to what degree the indigenous plant communities have been degraded
or removed It is important to note that replacement of indigenous species by introduced species is an
example of degradation under this Act Additionally the composition of indigenous communities may be
degraded under stock grazing by the replacement of palatable perennial plants with less palatable native
species
A draft assessment report on the condition of the land comprising each ldquorunrdquo (management unit) must be
completed Under the second round process the initial report preparation is carried out by the field assessor
teams The Pastoral Board will consider the report together with any comments from the lessee before
setting the lease conditions
Updating of the photopoint manual is required The capture of spatial data for any new lease infrastructure
(using vehicle-mounted downloadable GPS units) will occur at the same time as the fieldwork for the lease
assessment as the paddock plans produced during the first round process have proven most useful to the
lessees and managers of these properties
FACTORS INFLUENCING THE METHODS USED FOR THE BASELINE ASSESSMENT IN THE FIRST ROUND
Soil Conservation Districts
Soil Conservation Districts set up in the pastoral lands under the Soil Conservation and Land Care Act 1989
required Soil Boards to prepare a District Plan that seeks to provide land management guidelines for the
district The Pastoral Board agreed to provide support to these Boards by providing land system maps and
descriptions and general vegetation management guidelines for the district The baseline assessment
process therefore included a land inventory component that provided land system descriptions for each
district
Baseline assessment timetable and resource restrictions
The baseline assessment of all leases was completed in September 2000 This involved assessing
approximately 405000 kmsup2 of country that comprises the 330 pastoral leases (see Figure 1) The process
also involved
Gathering geographic information which would enable the creation or update of pastoral plans showing
lease infrastructure eg fence lines waters
provide hardcopy maps (paddock plans) of each lease
Setting up a paddock- based and long-term photopoint monitoring system
compile field data using site sheets for input to a database and GIS
Assess land condition using the Land Condition Index methodology on all sheep leases south of the Dog
Fence
Even at the time of the first baseline assessments the resource requirements imposed by the huge task of
visiting every paddock of every lease in the 10 year timeframe continually governed and influenced what
could actually be undertaken As a consequence in the latter years of the baseline assessments various
changes to the methods occurred to enable a revised legislative deadline of December 2000 to be met (the
original time specified in the Act for completion of assessments was March 1998 ndash this was extended in that
year by legislative amendment)
Pastoral Lease Assessment Technical Manual for the Second round (2011)
4
Lessee involvement in monitoring
The monitoring process is aimed at increasing the awareness of lessees in managing the land resource and
focuses on plant and soil resources to determine trends in condition under grazing practices A significant
though small number of pastoral managers have become involved in the monitoring process since the
baseline assessments and have retaken photos at photopoints to monitor seasonal or short-term changes
or effects of stock management practices
The first training lease Coondambo for the second round process in 2005 is one such property where the
manager has regularly revisited and photographed the photopoint sites
Pastoral Lease Assessment Technical Manual for the Second round (2011)
5
Figure 1 Map of pastoral leases within South Australia
Pastoral Lease Assessment Technical Manual for the Second round (2011)
6
PREPARATION FOR AN ASSESSMENT TRIP
The following check list should be completed prior to each trip Contact lesseemanager To arrange a time and location to meet at the beginning of the field trip (Act states 28 days notice) Discuss potential accommodation availability of fuel (if required) Collect property information Copy of first assessment report from Pastoral Land Management Group (PLMG) Adelaide Paddock write-ups site revisit and pastoral inspection sheets from ALIS Blank sheets for new photopoints and upload Getacs (ALIS) Blank Jessup sheets LCI transect measure of distance and list of stops generated Map updates Photopoint manual Recent stock return and past inspection reports Property docket (optional for extra information) Land system and paddock plan maps Photopoint Equipment
100 m surveyor tape with clearly visible and fixed 10 m markers and ties both ends
sledge hammer
2 m measuring rod
jarrah pegs poly posts rebar or other markers Photopointcamera box with
numbered photopoint discs
nails for securing disc to marker peg
site description and species list sheets
Jessup transect recording sheet
digital camera all batteries charged
sighting compass
hand counters (at least 2)
inclinometer Other equipment Clipboards and elastic bands Pencils and sharpener Reference books eg plant books Charged computerGetac for GPS data Hand held GPS cleared of data from previous trips Inverter checked Water tanks filled Ropes Plastic bags Cooking kit Food Fridge
MEETING WITH LESSEESMANAGERS
First Meeting
Explain the assessment process answer any questions and invite them to participate Discuss Infrastructure changes Seasonal conditions eg rainfall fire Problem areasissues Future plans General management including paddock use changes to management feral animal numbers and
kangaroo numbers
Pastoral Lease Assessment Technical Manual for the Second round (2011)
7
Availability of station facilities eg shearers quarters places to camp places to avoid Radio frequency to contact them Photopoints updated eg have they been taking photos do they have a Photopoint manual
Final Meeting
Cross reference map items and do final check that everything has been up dated Discuss
Problem areas get their perspective and plans they have to address problems
Make sure they are aware of negative comments likely to be in the report giving them the opportunity to discuss
Next stage of the process and give them contact details of who they can speak to
Get their preferred contact details eg email phone etc
DESCRIPTION OF METHODOLOGY USED IN THE BASELINE ASSESSMENTS
Land system mapping
This involved identifying landscape patterns on remotely sensed images and describing the units that make up
this pattern in the field Land System boundaries were digitised and transferred to ARCINFO to form a graphical
base for a GIS Land systems descriptions and boundaries are checked during the assessment process A
coloured land system map for each station accompanies the lease assessment report
Lease infrastructure
During the assessment process the layout of the lease is discussed with the Pastoralist and any changes
such as new water point fence line or track developments that are not included on existing maps are noted
These details are then checked in the field and accurately located using a Global Positioning Unit (GPS) and
use of Getac Amendments are then made to the digitised files to update the paddock plans (see figure 2)
and the GIS
Waypoints of features and tracking of line features for updating of mapping products will be made by the field assessors in the second round this includes both new and existing infrastructure not previously captured
Pastoral Lease Assessment Technical Manual for the Second round (2011)
8
Figure 2 Station paddock plan
Monitoring
A monitoring baseline has been established in each paddock This consists of a photopoint and a plant
species list with associated data Fixed belt transects have been used to collect ecological data This is
compiled into a ldquophotopoint manualrdquo and the lessee is given a copy and encouraged to photographically
monitor the sites These sites are usually located on water runs to enable the Pastoralist to inspect the sites
on a regular basis It was planned these sites would be re-measured by the Pastoral Management Branch
every 5-7 years (depending on resources) but in reality only sites in ldquopriority paddocksrdquo have been revisited
at this order of frequency
All previously-established photopoints which can be re-located will be revisited and re-measured Every attempt should be made to relocate photopoints but if not possible new sites will be installed
Plate 1 Pastoralist involvement in the assessment process
Paddock condition
The assessment process also describes the condition of each paddock within a lease and identifies any land
management issues that require attention This information is entered into the database so that a history for
each paddock within a district is developed
Paddocks that require immediate attention or action are detailed in the assessment report for the Board
These ldquopriority paddocksrdquo are inspected on a more regular basis and the lessee must make progress
towards rectifying the identified land management problems ldquoMonitor paddocksrdquo are identified where less
immediate attention is required or where issues should be monitored by lessees and the PLMG
Lease Assessment Reports
A lease Assessment Report is the formal document that provides details of the assessment of the land
condition over the ldquorunrdquo These reports are forwarded to the lessees who have 60 days to consider and
comment The Board then considers all comments and accepts the report
On completion of a district and all LCI scores analysed the Board will set the land management conditions of
the lease which includes a maximum stocking level The lessee may apply to the Pastoral Board at any time
for a temporary increase above this maximum Land management conditions may be adjusted and the term
of the lease extended if the lessee has complied with the lease conditions and fulfilled a duty to improve the
condition of the land
Pastoral Lease Assessment Technical Manual for the Second round (2011)
9
The report provides pastoralists or other land managers with information to ensure sound land management
practices are followed These reports provide details of a monitoring system that will supply the land user
with reliable interpretable and repeatable information to detect changes that result from land use practices
(rangeland condition and trend)
Capacity of the land to carry stock
The Pastoral Board is required to specify a maximum stocking level for the lease and the lessee is not
permitted to exceed this figure without the prior permission of the Board Stock maxima determined under
the previous Act (Pastoral Act 1936) did not include an assessment of the condition of the land and were
often set at inappropriate levels The previous maximum figure has long been represented by the pastoral
industry as the actual carrying capacity of the lease
The Objects of the Act specify that the Pastoral Board must ensure that degradation does not or is not likely
to occur Maximum stocking levels for a lease are far from ideal as an effective method for ensuring that
pastoral land is not degraded as they do not provide for stocking levels in individual paddocks under a range
of condition classes and pasture components
Plate 2 Fenceline contrast resulting from different management practices
The evidence for appropriate long term stocking levels must come primarily from-
what the land has carried in the past without severe degradation
what successful management practices have been implemented for various pasture types
how management practices generally are related to the present land condition
For the first round of assessments the Board determined that the most recent 10 year stocking average
(which includes a range of seasonal conditions) plus 20 allowance for good seasons would provide the
basis of the maximum lease offer This had the effect of bringing a number of leases with unrealistic previous
maximums to a more realistic figure The Board has reviewed its approach (and policy) on the setting of stocking limits for round two however it acknowledges that lease stocking maxima are at best a ldquoblunt instrumentrdquo for use in managing land resources Short-term adjustment of paddock stock numbers appropriate for conditions is the most effective tool but a maximum provides a statutory limit and guide to numbers likely to be able to be carried in the best seasons The current method uses a combination of LCI results paddock condition ratings area and watered area The Board considers that a better way of setting stock maximum would be to do so based on the capability of each land type within its watered area However the current inventory of these resources is not accurate to the level required and steps are being taken to work towards the future use of such a method
Pastoral Lease Assessment Technical Manual for the Second round (2011)
10
LAND CONDITION INDEX
The land condition assessment of the various pasture types involves defining what constitutes an intact or
un-degraded landscape and deciding on the criteria that indicates to what degree disturbance has occurred
The PLMC Acts emphasis on indigenous plant species largely determines an on-ground approach as it is
necessary to ascertain the mix of plant species It is also important to determine if seedlings are present as
this helps to indicate whether the land has a capacity to rehabilitate in cases of past damage It is for this
reason that remote sensing techniques may not be appropriate to determine land condition in most parts of
the sheep pastoral areas according to the Act
The following processes were used in training and calibration for these assessments during the first round of
assessments
The process of land condition assessment involves a preliminary reconnaissance survey by senior scientific
officers to determine pasture types and condition criteria This is followed by a training period for field staff to
become fully competent in using these criteria in assessing the various land condition states
The purpose of this reconnaissance survey by senior officers is to
identify the various pasture types and the sub-units called pasture components that make up these
pasture types within the district
determine the criteria that will be used to identify three condition classes within each pasture
component
Only three land condition classes (1 = poor 2 = fair and 3 = good) are described as this limits the number of
choices and therefore reduces possible observer errors To avoid the influence of seasonal changes and
drought the criteria are based primarily on perennial vegetation components with erosion levels included where
applicable The issue of so-called opportunity country involving only ephemeral growth is dealt with separately
Each condition class for each pasture component is described according to key indicator plants
Photographs and written criteria are compiled that depict each of the three condition classes for each of the
pasture components The criteria and photo-standards are compiled into manuals which are subsequently
used by the assessment officers in carrying out the lease assessments
Field staff are trained in the field to recognise the various condition classes for each of the pasture
components to achieve a uniform standard and tested thereby ensuring that all staff will assess the
condition of land uniformly and without bias
Analysis of changes from round 1 to 2 on any particular station occurs and also changes on a station
comparative to the average change of each pasture type in a district
PHOTOPOINTS
Monitoring the condition and trend of land under various grazing practices is an important on-going
management tool Photopoints are established in most paddocks to provide an indication of these trends
Revisiting these sites enables the development of a photographic sequence supplemented by vegetation
and soil information to provide an objective record of change at a site The photopoint is a sample of land
condtion in a particular paddock where located in a typical area This objective data is used to support
subjective judgements on condition in a paddock and a station overall A photopoint can also be set up in
atypical areas to monitor a specific issue
The Pastoral Land Management group will carry out regular long term monitoring of these sites However it
is important that short-term seasonal changes are also recorded if possible Pastoralists are encouraged to
regularly monitor the photopoints and have been involved in the initial establishment of the sites During this
Pastoral Lease Assessment Technical Manual for the Second round (2011)
11
process the assessment techniques can be demonstrated and the photopoint method explained to ensure
the pastoralist is able to carry on with subsequent monitoring if he or she desires
Through combining short term and long-term records our understanding of ecosystems may be improved
and future grazing practices can be adapted to suit these trends Stock records for each paddock together
with climatic information observations of grazing on desirable plants germination events and other factors
will provide a valuable record that will assist in future decision making regarding the objectives of sustainable
use
Changes in the soil and vegetation components may follow
a fire
extreme seasons wet or dry
a marked change in vegetation cover
defoliation of chenopod shrubs (saltbush or bluebush)
establishment of new shrub seedlings
death of shrubs or trees
invasion by unpalatable plants
Access and relocation of existing photopoints (finding the site)
Sites are generally placed alongside station tracks for ease of relocation If a site is located on a now-unused track then be sure to note how to find the turn-off and any other important features The photopoint peg or post should in open country be visible from the track although it is desirable to place it far enough off the track to reduce the chance of it being driven over or destroyed by road maintenance or minor realignment Experience has shown that sites placed 10-50 metres from the track provide the best chance of not being damaged or rendered useless from road effects while still being easily accessible for revisits Careful recording of the GPS and distances is essential and will assist future assessors Use of hills and other features in a photo may assist in relocation
New Photopoints
Choosing the location for a new photopoint
The photopoint location will depend on the major objective for setting it up
To encourage pastoralists to monitor the sites they need to be easily locatable Record the distance from a
permanent feature eg gate or trough and if possible record the distance from the opposite direction Use
the GPS to capture co-ordinates for the site
The following factors should be considered when choosing a site particularly when monitoring grazing
impact
Distance from water
Grazing intensity of domestic stock decreases with distance from the permanent water source Choosing sites at a consistent distance from water allows for more effective comparison between sites Assessment sites for sheep stations are generally placed about 15 km from permanent water but more importantly should monitor areas where indicator species are still present or be expected to occur In cattle areas the site may be between 2-4 km from water Where an acceptable site does not occur at the desired distance personal judgement must be used in choosing the best location taking the above factors into consideration This may involve locating the site further or a little closer to the watering point or simply abandoning the attempt to locate a site out from that particular water (especially if another track or water in the paddock is also monitored)
Representation of a land unit
If establishing a new site in a paddock which does not have any existing sites this site should be located within a recognisable land unit that is typical of the paddock For example do not choose an isolated
Pastoral Lease Assessment Technical Manual for the Second round (2011)
12
bluebush patch if it is not typical of the paddock Avoid vegetation patches that are obviously atypical or are small areas of transition between communities The unit chosen must also be one that gives a good indication of grazing impact For example do not place a site in a very stable resilient vegetation type if the majority of the paddock or areas preferred by stock are much less resilient
Size and uniformity
The site should be uniform with respect to vegetation soil slope and aspect The more extensive the area of the site the better While a site might take observations of a radius of 200m an area of 100m radius should be considered a minimum but all observations must be made within uniform land typeunit Disturbed areas such as roadsides must not be considered
Other influencing factors
Other factors likely to bias or influence the site vegetation should be recognised and avoided where possible Avoid placing sites in the following situations
on a southern fence since sheep tend to graze into the wind and in most sheep - pastoral areas of SA the prevailing wind is from the south
sheep camp areas or where animals walk parallel to the track resulting in heavily tracking
mechanically disturbed areas
water run-on areas from tracks or where old track marks or erosion is evident
Photopoint setup
Directions to each photopoint should comprise a distance and direction from a known point such as a water
point A metal numbered disc on a polydropper fibreglass or steel rebar post (or wooden peg) marks each photopoint established during or before the first round (refer figure 3) This is referred to as the marker peg
However where the marker has disappeared or deteriorated new markers will consist of some more
permanentvisible materials
Figure 3 Diagram of a typical ldquoQSrdquoPhotopoint Monitoring site
Position the marker peg 10-50 m off the track in a clearly visible location that is not likely to be disturbed
However ensure the area to be monitored is free of vehicle track effects such as water flow stock
movement etc If the marker peg is positioned further than 50 m from the track position another directional
peg near the track and give clear directions on the site sheet to the location of the marker peg or post (ie
Pastoral Lease Assessment Technical Manual for the Second round (2011)
13
bearing and distance from 1st peg) Remember it may be some time before the site is re-visited and the site
is wasted if it can‟t be re-located
A second peg usually a jarrah peg is located approximately 17 paces from the marker peg This is referred to as the sighter peg This peg is positioned such that the photograph area does not include more than 13 skyline
and the bearing will follow the line of the Jessup transect A third peg is placed 100 m from the sighter and used
to mark the end of the Jessup transect Not all sites will have a Jessup transect
Locations of all photopoint sites will be recorded with a GPS from the vehicle and marked on the updated station
paddock plan
The photograph should be taken from the marker peg Record a compass bearing between the marker peg
and sighter peg If other photos are taken from the marker peg the bearing should be marked with an
additional sighter peg
Taking the photograph
Photos are taken with a digital SLR camera and with the zoom set to replicate the original 50mm lens
cameras Photos are taken in RAW format and downloaded daily To take the photograph stand behind the
marker peg and centre on the base of the sighter peg as shown in plate 5 and figure 4 Adjust focus to
infinity to ensure all of the transect is in focus
Plate 3 Taking a photograph
Figure 4 Directions for taking the photograph
Pastoral Lease Assessment Technical Manual for the Second round (2011)
14
RECORDING FIELD INFORMATION
Site description and location
Site sheets and the information collected have changed and evolved over the period of assessment An
example of the current site sheet is shown in appendix 1
Detailed below are the fields of information together with the type of detail that should be recorded Note Completed entry example shown in brackets (italics)
QS OB RS TS Prefix to describe type of photopoint followed by photopoint number
as per the disc (eg QS 2345)
QS - Quantitative site A pegged site used for monitoring vegetation
changes with Jessup andor step-point data (formerly photopoint -
PP)
OB - Observation site A pegged site used as an observation site to
monitor changes that can be detected by a photographic sequence
eg rehabilitation spread of erosion gullies Site description includes
a list of plant species but with no measured plant data collected
RS - Reference site Sites are in areas remote from grazing influence
greater than 5 km from water in sheep country and 8 km in cattle
country Also includes exclosure sites Complete all site description
and plant and soil sheets
TS - Type Site Designated for site characteristic of mapped land
system in early part of baseline assessment process As per OB but
sites were not usually pegged
PC ndash Photo Comparison Should be used strictly where a photo is to
be compared and data collected would not be required eg A
panorama on a hill top where species in the foreground are not
relevant to the background being monitored in a photo
All photopoints should be prefixed with QS OB RS PC or TS
DATE Day Month and Year (eg 01062007)
OBSERVERS Initials of persons involved in data collection Initials of the person
filling out the sheet first followed by second observer (egMTCB)
STATION Pastoral station name Use the full name of the station (eg
Bulgunnia)
PADDOCK Full paddock name may include subscript eg formerly part Cyclone
(Monsoon)
ZONE Grid reference zone generally on the bottom of the map (eg 54)
MAP SHEET Map sheet number 150000 five digits eg 66341 1100000 four
digits eg 5434 (66341)
EASTING amp NORTHING Co-ordinates on GPS Unit
Pastoral Lease Assessment Technical Manual for the Second round (2011)
15
DATUM GDA 94
SERIES Refers to the filing system for photopoint photograph series for the
station indicates the station with the month amp year the photo was
taken First four spaces are for the station (or trip name) abbreviated
to the first four letters eg Bulg for Bulgunnia Next two are digits for the month followed by two digits for the year eg (Bulg 0691)
DIGITAL Image number
WATERPOINT Name of nearest permanent water source by direct route as a sheep
would walk Note type also eg dam trough tank (Moonbi Tank)
DISTANCE (km) Distance (to one decimal point) to water source named above ie by
direct route as a sheep would walk Record the straight-line distance from the GPS (eg 16 km)
CONDITION Condition rating for the site as per condition rating guidelines Refer to
appendix 2 for condition class attributes Notes on attributes in the site comments will help to support this judgement (eg Good)
MUD MAP Diagram of how to relocate the site clearly labelled with distances
Include paddock name and adjacent paddocks track location and
gate zero origin water location site number Orient the map with
north to the top of the page
MUD MAP COMMENTS Clear directions on how to relocate the site completed according to
the following format Keep in mind that this will be printed out for the
lessee
Distance from gate or trough direction on track to next bore or
paddock along fence Place where zero taken from eg tank trough
gate - be specific What type of peg or marker was used and how far it
is off the track and in what direction Distance to sighter peg and
bearing Jessup transect length (normally 100m) and bearing from sighter peg (Use tripmeter if no Halda rally meter or similar)
Example mud map comments (15 km south of Twin Well on track to Gladstone Bore or 35km north
of gate from Dusty paddock Zero at trough Jarrah peg and disc at 15 paces east of track Sighter peg (jarrah) at 17 paces bearing 90deg Jessup transect 100 m x 2 m x 2 at 90deg end marked by jarrah peg)
EROSION Record the severity and type of erosion according to the table in
appendix 4
COMMENTS Record notes that help to further explain observations or that will
assist interpretation of the data for present and future observations
This should include notes to indicate why the site was established and
what it is monitoring It should also include notes that help explain the
condition rating and current impacts or changes including erosion
Data entry Initials of person who entered data on the database and the date of
entry (egCB 5391)
Pastoral Lease Assessment Technical Manual for the Second round (2011)
16
Establishing new sites The site details below are only relevant for new sites set up as part of the second assessmentndash not used for revisits as part of the second round
LAND SYSTEM Land system name taken from land system map (egWeedna)
ROCK TYPE Name of rock type from geological map or rock type identified at site if
geology map incorrect (egred sandstone)
FORMATION Name of rock formation from geological map (egPound Quartzite)
LANDFORM SLOPE Slope of the site measured in degrees by use of clinometer
Do not confuse degrees with (eg2deg)
ELEMENT Landform element of site
1 crest curved in down slope profile and margins at limit of observed
curvature
2 slope considered as planar Note in comments if upper mid or
lower slope
3 flat planar
4 depression may be open or closed
PATTERN Term to describe the landform type eg alluvial plain = ALP See
appendix 3 for abbreviations and descriptions (egALP)
Pastoral Lease Assessment Technical Manual for the Second round (2011)
17
Vegetation
SIGNIFICANT RAIN Yes - data collection following rains that resulted in green ephemeral
response record dates if known of significant falls
No - dry ephemeral growth only
TYPE S (summer) - rain fell between November and March
W (winter) - rain fell between April and October
I (indistinguishable) - cannot tell if resultant green ephemeral growth is
from summer or winter rain events or is a combination of both
VEGETATION SPECIES Effort should be made to record all plant species throughout the site
Recording plant species should be carried out until most species are
recorded (ie until a period of minutes elapses before further species
are not found) Record full species name on the site sheet
If plant species is not known collect a specimen fill out details in the
herbarium collection booklet and include photopoint number and line
number of record on sheet eg 234512 so that this number can be
entered on subsequent site sheets Put the herbarium label with the
specimen in the plant press Keep a list of plants collected and PPline
number so that you can give this number to collected species at other
sites Update the site sheet with the correct species name when it
comes back from the herbarium or identity confirmed
DOM Dominant species This will be used to classify vegetation
associationsgroups
1 visually pre-dominant species forming the tallest stratum CSR
class should exceed 1 (CSR 2-6)
2 if another tallest stratum species is present (co-dominant) it is
selected OR if absent the most abundant understorey species is selected eg Mai sed
3 selected from any stratum usually a lower stratum as an indicator
species (that is a species of known environmental preferences or
of such abundance that it can‟t be ignored) or to distinguish between associations eg Atr ves
4 other conspicuous species to separate associations eg Scl obl
GRAZED If a plant is obviously grazed tick the box If grazing is mainly by
rabbits or goats this should be noted in the comments
RESPROUT If the plant has previously been grazed back and is now showing fresh
new growth tick the box Note extent in comments eg Atr ves adults
showing abundant new growth following recent rains
RECRUITMENT If seedlings are evident or new suckers (eg Bullock bush) tick the
box Note height of seedlings in comments eg Mai sed seedlings to
5 cm abundant in open areas
FRUIT If the plant is in fruit tick the box This will enable data collection on
best times for seed collection Record relevant notes in comments
Pastoral Lease Assessment Technical Manual for the Second round (2011)
18
Crown Separation Ratio (CSR) The average distance between crowns divided by the average size of
the crown grouped into various size classes (see appendix 5)
1 present lt 12 plants in 200 m radii
2 isolated clumps gt20 CSR clumps of two to five woody plants 200
m further apart
3 isolated plants gt20 CSR trees gt100 m apart
4 very sparse 6-20 CSR crowns well separated
5 sparse 1-5 CSR crowns clearly separated
6 mid dense 0-09 CSR crowns touching to slightly separated
7 closed or dense crowns touching to over lapping
JESSUP Refers to the results of the Jessup transect (see section 81
for more details)
See appendix 6 for Jessup transect recording sheet Record total
counts from the Jessup transect field sheet for each species adult
and juvenile
FIRE SCARS Yes - fire scars evident on stumps trees or fence posts Fire scars
should be recorded if fire occurred since the first assessment
No - no fire scars visible
Last burn - date of last known fire Check with the lessee and record
further details in the comments eg fierce summer fire burnt out NW
corner killing all mulga
Pastoral Lease Assessment Technical Manual for the Second round (2011)
19
Vertebrates
VERTEBRATES Presentabsent for dung tracks browsed vegetation burrows
throughout the site
It is only necessary to record current or fresh activity and record as
presence (P) Old or past activity should be noted in the comments
Table 1 Vertebrate pests
Animal Sighted Dung Tracks Browse BurrowsCamp
Rabbit visual sighting fresh buck
heaps
scratchings
present
graze line with chisel
marks on stems
warren heaps
marks
warren active
Sheep visual sighting fresh dung
active padding recent grazing camps
Cattle visual sighting fresh dung active padding recent grazing camps
Goats visual sighting fresh dung active padding browse shrubs
Note in comments
height of browse line
camps
Roos visual sighting fresh dung active padding recent grazing
(check for tail drag)
camphollows
other
Others include fox cat dingo camel horse wombat etc
Note any other useful information in the general comments for example mob of 200 goats sighted More
detailed comments can be included if needed in the paddock description
Pastoral Lease Assessment Technical Manual for the Second round (2011)
20
DENSITY MEASUREMENT OF PERENNIAL PLANT SPECIES
Perennial plants provide stability to grazing management systems due to their ability to persist during dry
periods consequently the measurement of plant attributes such as density and frequency of perennials
particularly those which are palatable are important in understanding plant dynamics and rangeland condition
Plant counts within fixed belt transects have been used to determine the density of shrubs and repeated
measurements allows density changes to be detected To ensure that observer error is minimised it is vital that
the same technique and standards are used in repeat measurements Modifications made in 1990 enabled
changes to be isolated to discreet quadrats and recruitment and deaths of cohorts can be followed
Jessup transect
This method incorporates a belt transect (a standard ecological technique) that is based on an original
survey technique used for chenopod shrublands by Jessup (1951) and further developed by Lay (1979)
Their technique involved driving a vehicle over a site for a set distance and shrubs occurring within the wheel
marks (representing the belt transect) were recorded This rather destructive technique is now simulated by
a fixed 4 m x 100 m transect and enables a density and frequency estimate of perennials for each site The
frequency estimates are not based on the optimum quadrat size for all species and the 10 m x 2 m quadrats
used should not be taken to represent true frequency readings It should also be noted that species
composition by frequency is not equivalent to composition by cover or density The length of some early
transects has varied from the current standard so ensure that any future comparisons use the same transect
configuration (see 821below)
The Jessup transect method measures the density (shrubsarea) and frequency of perennial plants at sites
where perennial cover occurs ie chenopods other shrubs and tussock (perennial) grasses Counting age
classes of shrubs (adultjuvenile) gives further information on population changes Monitoring over time
provides an indication of recruitment trends
Recording is based on all perennial shrubs within the transect being recorded by species and age class
(adultjuvenile) If the base of the plant is in the transect it is counted If the foliage only is in the transect it is
not counted
Transect layout
Jessup transects are permanently marked and comprise
transects 100 m x 2 m x 2 (see figure 5)
recordings separated into 10 m x 2 m blocks
identification of perennial plant species
less than 10 cm high andor non woody base = juvenile
more than 20 individual juvenile bushes or perennial grasses per 10 m x 2 m block = 20+ recording
1 Transects should include only one land unit and preferably be restricted to one element for data
analysis Transects are 100m long and generally at right angles to the track Walk the length of the
transect to ensure it is suitable before setting up the site and identify and discuss species present
with the other observers
2 Record a compass bearing for the transect
3 Secure a surveyors tape (marked into 10 m segments) to the sighter peg and lay out the tape to 100
m keeping the marker and sighter pegs in line
4 Check that the tape is in line with the sighter and marker peg Tension the tape and drive in the peg at the 100 m mark and secure tape to the peg It is important to have the tape extended to full
100m and tight and straight so that data is replicated at the quadrat level
Pastoral Lease Assessment Technical Manual for the Second round (2011)
21
5 If the transect layout is normal note this on the sheet if different note the transect layout on the site
description sheet and orient diagram with north to the top of the page Give clear legible directions
and bearings
Figure 5 Jessup transect layout
Recording a Jessup transect
1 Use a surveyors tape that is clearly marked into 10 m intervals If it is marked with tape check that
this has not slipped from the 10 m graduations Counts should be recorded on a Jessup transect
data sheet (see appendix 6)
2 Commence transect on left side of tape (UP) using 2 m rod (refer plate below) Check that the rod is
2 m A two metre curtain pole is ideal for this
Plate 4 Recording a Jessup transect
3 Identify each perennial species If in doubt collect a specimen
4 Easiest operation is with one person observing (counting) and another recording and acting as a
checking observer The recorder (scribe) stands at the 10 m marker intervals and the observer calls
out the adultjuvenile strikes along each 10 m transect interval The recorder can assist by spotting
hidden plants and small juvenile plants
5 For plants on quadrat margins include only in the quadrat where the rooted stem is located Count
plants only if they are more than 50 rooted within the quadrat
6 Chenopods occur in clumps and it is difficult to distinguish individuals for this reason clumps are
recorded and are recognised as individual clumps if there is more than a 30 cm gap between the
rooted stems Criteria for counting plants growing close together are as follows
End peg Sighter peg Site marker amp disc
11 12 13 14 15 16 17 18 19 20
10 9 8 7 6 5 4 3 2 1
100 m
4 m
Pastoral Lease Assessment Technical Manual for the Second round (2011)
22
distinguish between individual clumps if there is more than a 30 cm gap between rooted stems
if crowns are distinct and bases are less than 30 cm apart count each as an individual
if crowns are touching or overlapping and gap between rooted stems is less than 30 cm count
as one clump
Note In cases of perennial plants such as low bluebush being grazed the reduction of the crown
may lead to higher count of bush numbers Care is required when comparing existing Jessup counts
and noted should be recorded if this type of splitting has occurred
7 Record juveniles as plants less than 10 cm high or wide and not woody However if obviously old
woody plants are grazed back to less then this size record as adults but make comment
accordingly
If greater than 20 juvenile individuals of any species encountered in 10m interval (quadrat) record as
20+ This avoids attempting to count up to 200 seedlings but still provides sufficient data to interpret
that recruitment is occurring Large numbers of seedlings can occur following favourable conditions
and it becomes difficult to count all of these However where feasible a total count of juveniles
should be undertaken
8 For perennial grasses record clumps if greater than 10 cm high or 10 cm wide ie no juvenile
categories Record count as 20 + if greater than 20 individuals within one 10 m x 2 m block This is
to aid interpretation of step-point cover data eg low density but high cover implies large spreading
individuals high density but low cover may imply a grazing effect - site comments should indicate
this The quadrat sizes are not well suited to grasses but do provide an indication of the level of
grasses within a shrubland
9 Do not record dead or completely defoliated bushes but note occurrence in comments
10 Proceed to end of transect and commence quadrats 11-20 (ie 100-0m) on other side of tape
(down)
11 Record minor site variations in comments relating to quadrat intervals eg 20-30m large scaled area
Pastoral Lease Assessment Technical Manual for the Second round (2011)
23
DATABASE AND GIS ndash needs update for ALIS and FDE
Site information is currently entered into the Arid Lands Information System (ALIS) and print-outs and
photographs are supplied to the lessee for every photopoint on the station in the form of a Photopoint
Manual
In 1991 the Geographic Analysis and Research Unit (GAR) of the Department of Housing and Urban
Development has been assisting the Pastoral Management Branch in the establishment and maintenance of
a Pastoral Geographic Information System (Malcolm and Nicolson 1995) The GAR unit operates a
centralised ARCINFO (Environmental Systems Research Institute USA) GIS facility and is the
Environmental Node of South Australia‟s Land Information System
Extensive development was carried out on ALIS and while operational is still undergoing some further
development Management of this system is though Client Services in DENR in collaboration with the
Pastoral Program Development of a system for field data entry onto GETEC tablets has been completed
and is undergoing transition into the operational phase This will improve data collection with validation in the
field and also allow considerable time saving and possible transposition errors removing one stage in the
data entry process
Lease infrastructure information is derived from a number of sources that vary in age scale and accuracy
During the assessment process topographic maps are used as a base map and information is checked
corrected of altered using various techniques Prior to the introduction of Global Positioning Systems (GPS)
in 1992 the information was collected using bearing and distance measurement that were plotted onto base
maps The improved accuracy of GPS units over time has allowed increased accuracy and therefore an
improved mapping product
Lease maps and land system maps are available as hard copy products Watered areas for each paddock
can also be produced that indicate the extent that the lease is utilised by stock Undisturbed areas represent
quality wildlife habitats and further investigations are required to study the relationships between stocking
intensity land condition and wildlife habitat More detailed information can be found in Malcolm and
Nicolson (1995)
POST TRIP PROCEEDURE
The following checklist should be completed after each trip
Download photos and GPS co-ordinates
Data entry
Update photopoint manual and make 2 copies
Conduct LCI peer review
All spatial updates sent to GIS DWLBC
Write draft Assessment report
Submit for review
Pastoral Lease Assessment Technical Manual for the Second round (2011)
CONDITION CLASS
ATTRIBUTE EXCELLENT GOOD FAIR POOR VERY POOR
PLANT SPECIES
COMPOSITION
maximum diversity of
annual and perennial
species possible for the
land type
perennial species of
various ages
some reduction in density
of palatable and
susceptible perennials
increased proportion of
shorter lived species
perennial species of
various ages
significantly reduced
cover density andor
regeneration of
palatable species
establishment of less
preferred or
unpalatable species
dominance of annual and
ephemeral species and
perennials with relatively
low palatability
no regeneration of
desirable perennial
species existing stands
degenerate
seasonal cover of
only pioneer
ephemerals or
unpalatable weeds
large areas totally
unproductive
PLANT
PRODUCTIVITY
at full potential
sustained productivity
annual com unities
maintain litter cover but
not production in dry
seasons
some fluctuation lower in
drought and may be
higher than site potential
for some species eg
Mitchell grass
reduced overall high
productivity in good
season
low in drought
(fluctuates markedly
with season)
impaired productivity
very seasonally
dependant low or non
existent in dry seasons
areas incapable of
any plant growth
SOIL EROSION
STATUS
no erosion (other than
natural features or
processes)
plant and litter cover
protect soil from wind
and water in all
seasons
minor or slight erosion
evident
increased susceptibility of
soils to erosion in dry
seasons
moderate erosion
evident
reduced density and
cover of perennial and
litter increases
susceptibility of soils to
erosion in most
seasons
severe erosion overall
high susceptibility of soils
to erosion in all seasons
extent of past erosion
renders site susceptible
to further soil movement
if grazed at any level
unstable severely
or very eroded
Pastoral Lease Assessment Technical Manual for the Second round (2011)
Appendix 1 Erosion severitytype intensity criteria ndashfor reference to first round data sheets
EROSION SeverityType intensity criteria + RATING (max 200 m radius)
NO ACCELERATED EROSION 00
SLIGHT EROSION (10 of site affected)
slight accumulation of wind blown soil and plant bases and other obstacles 11
removal of finer soil particles evident but soil crust is largely intact 12
occasional rills (lt300 mm deep) evident 13
no gullies present 14
a few scalds present usually less than 2 m in diameter 15
MINOR EROSION (10-25 of site affected)
accumulation of soil around plant bases with plant mounds noticeably enlarged 21
evidence of pedestalling but soil loss minor and plant bases not greatly elevated 22
breaking of surface crust with small erosion faces and some redistribution of soil and
or some rilling evident 23
occasional shallow gullies only 24
scalding evident but scalds relatively small and discontinuous 25
MODERATE EROSION (25-50 of site affected)
wind piling around plant bases and other obstacles is common but no plants completely covered 31
pedestalling apparent with plant bases distinctly raised and with obvious
soil loss and deflation in parts 32
surface sheeting andor rilling common with erosion faces (andor micro-
terracing) and active redistribution of soil 33
gullying present on parts of the site 34
numerous small scalds common andor with a tendency to coalesce to form larger scalds in parts 35
SEVERE EROSION (50-75 of site affected)
extreme hummocking around plants and other obstacles some plants completely covered 41
severe pedestalling with plant bases greatly elevated and major soil loss
from deflation andor much of surface generally unstable with ripple marks 42
major rilling or surface sheeting with extensive exposure of subsoil or parent material
erosion faces (andor microterracing) and active redistribution of soil 43
widespread gullying 44
scalding extensive smaller scalds have coalesced to form large more or
less continuous scalded areas 45
EXTREME EROSION (75-100 of site affected)
general surface movement area more or less bare with formation of shifting dunes 51
most of original land surface altered any last remnants of original soil or
vegetation standing as sentinels in a barren landscape 52
water sheeting andor rilling coalesced to expose subsoil or parent material 53
extensive gullying 54
scalding more or less continuous over large areas 55
Note Record severity first and then type eg 53 = Extreme erosionScalding
Pastoral Lease Assessment Technical Manual for the Second round (2011)
Appendix 2 Crown Separation Ratio
This is a visual estimate of plant cover
It is the average distance between crowns (the area the plant takes up if viewed from above) divided by the
average size of the crown In the field this means visualising how many crowns of a given plant species can be fitted in between the distance to the nearest neighbour of that species on average over the site The
classes are as follows
CLASS TERM CSR FIELD CRITERIA
1 Present lt 12 plants lt12 plants within 200 m radius
2 Isolated clumps gt20 spaces Isolated clumps of two to five woody plants 200 m
further apart
3 Isolated Plants gt20 spaces Isolated plants
4 Very Sparse 6-20 spaces well spaced crowns well separated
5 Sparse 1-5 spaces clearly spaced crowns clearly separated
6 Mid dense 0-09 spaces crowns touching to slight separation
7 Closed or dense 0 crowns touching to overlapping
Modified from Table 14 McDonald (1990)

Pastoral Lease Assessment Technical Manual for the Second round (2011)
2
NATURAL RESOURCE MANAGEMENT (NRM) BOARDS
The District Soil Conservation Boards in the late 1980‟s were a relatively recent development in the pastoral
lands at the time of the first round of lease assessment
These Boards have been ldquotransformedrdquo into district NRM Groups of the SA Arid Lands or Murray Darling
NRM Board All areas are now covered by NRM Boards recently established under the Natural Resources
Management Act of 2004 Appendix 13 shows the Board boundaries across SA The Pastoral Land
Management Group provides information about the districts resources so that the NRM Group can provide
input to the NRM planning processes that seeks to encourage sustainable land management objectives
LEGISLATIVE REQUIREMENTS
The Pastoral Land Management and Conservation Act 1989 provides the mandate for the assessment process and the methodology has been developed to comply with the specific requirements of the Act
Objectives of the Act
The Objects (Section 4) and other sections of the PLMampC Act provide the legal charter and instructions
about what is required of an assessment of the land
The PLMampC Act (the Act) has the following land care objectives
to ensure that all pastoral land in the State is well managed and utilised prudently so that its
renewable resources are maintained and its yield sustained
to provide for the effective monitoring of the condition of pastoral land the prevention of degradation of
the land and its indigenous plant and animal life and the rehabilitation of the land in cases of damage
The Act defines degradation of the land as a decline in the quality of the natural resources of the land
resulting from human activities on the land Rehabilitation of degraded land means to bring the land back to
at least the condition it was in before its degradation having particular regard to its capacity to carry stock
and its level of soil stability
Pastoral leaseholders also have a duty (Section 7) to use good land management practices prevent
degradation of the land and to endeavour within the limits of financial resources to improve the condition of
the land They also have related and more explicit duties in connection with the Soil Conservation and Land
Care Act 1989 These duties have in general terms been included in the Natural Resources Management
(NRM) Act 2004 which will now replaces the Soil Conservation legislation
Tenure provisions
Tenure provisions under the Act include a rolling 42 year lease whereby the lease is assessed to determine
its land condition every 14 years Provided the lessee has not wilfully breached a condition of the lease
resulting in or likely to result in degradation of the land then the lease term is topped up from the remaining
28 years to a full 42 years Land management conditions of the lease may also be varied every 14 years
Section 43 of the Act provides for further protection of the land whereby the Board may direct the lessee to
take action to prevent degradation of the land eg to destock certain paddocks There is no right of appeal
under this section
Assessment of land condition
To be defensible in a legal sense (eg if contested under the jurisdiction of the Pastoral Land Tribunal) the
methodology used to assess land condition must strictly follow the directions of the Act
The Act specifies (Section 6) that the assessment of the condition of the land must
Pastoral Lease Assessment Technical Manual for the Second round (2011)
3
be thorough
include an assessment of the capacity of the land to carry stock
be conducted in accordance with recognised scientific principles
be carried out by persons who are qualified and experienced in land assessment techniques
The Objects refer to the indigenous plant and animal life consequently there is a requirement to assess at
the plant species level to determine to what degree the indigenous plant communities have been degraded
or removed It is important to note that replacement of indigenous species by introduced species is an
example of degradation under this Act Additionally the composition of indigenous communities may be
degraded under stock grazing by the replacement of palatable perennial plants with less palatable native
species
A draft assessment report on the condition of the land comprising each ldquorunrdquo (management unit) must be
completed Under the second round process the initial report preparation is carried out by the field assessor
teams The Pastoral Board will consider the report together with any comments from the lessee before
setting the lease conditions
Updating of the photopoint manual is required The capture of spatial data for any new lease infrastructure
(using vehicle-mounted downloadable GPS units) will occur at the same time as the fieldwork for the lease
assessment as the paddock plans produced during the first round process have proven most useful to the
lessees and managers of these properties
FACTORS INFLUENCING THE METHODS USED FOR THE BASELINE ASSESSMENT IN THE FIRST ROUND
Soil Conservation Districts
Soil Conservation Districts set up in the pastoral lands under the Soil Conservation and Land Care Act 1989
required Soil Boards to prepare a District Plan that seeks to provide land management guidelines for the
district The Pastoral Board agreed to provide support to these Boards by providing land system maps and
descriptions and general vegetation management guidelines for the district The baseline assessment
process therefore included a land inventory component that provided land system descriptions for each
district
Baseline assessment timetable and resource restrictions
The baseline assessment of all leases was completed in September 2000 This involved assessing
approximately 405000 kmsup2 of country that comprises the 330 pastoral leases (see Figure 1) The process
also involved
Gathering geographic information which would enable the creation or update of pastoral plans showing
lease infrastructure eg fence lines waters
provide hardcopy maps (paddock plans) of each lease
Setting up a paddock- based and long-term photopoint monitoring system
compile field data using site sheets for input to a database and GIS
Assess land condition using the Land Condition Index methodology on all sheep leases south of the Dog
Fence
Even at the time of the first baseline assessments the resource requirements imposed by the huge task of
visiting every paddock of every lease in the 10 year timeframe continually governed and influenced what
could actually be undertaken As a consequence in the latter years of the baseline assessments various
changes to the methods occurred to enable a revised legislative deadline of December 2000 to be met (the
original time specified in the Act for completion of assessments was March 1998 ndash this was extended in that
year by legislative amendment)
Pastoral Lease Assessment Technical Manual for the Second round (2011)
4
Lessee involvement in monitoring
The monitoring process is aimed at increasing the awareness of lessees in managing the land resource and
focuses on plant and soil resources to determine trends in condition under grazing practices A significant
though small number of pastoral managers have become involved in the monitoring process since the
baseline assessments and have retaken photos at photopoints to monitor seasonal or short-term changes
or effects of stock management practices
The first training lease Coondambo for the second round process in 2005 is one such property where the
manager has regularly revisited and photographed the photopoint sites
Pastoral Lease Assessment Technical Manual for the Second round (2011)
5
Figure 1 Map of pastoral leases within South Australia
Pastoral Lease Assessment Technical Manual for the Second round (2011)
6
PREPARATION FOR AN ASSESSMENT TRIP
The following check list should be completed prior to each trip Contact lesseemanager To arrange a time and location to meet at the beginning of the field trip (Act states 28 days notice) Discuss potential accommodation availability of fuel (if required) Collect property information Copy of first assessment report from Pastoral Land Management Group (PLMG) Adelaide Paddock write-ups site revisit and pastoral inspection sheets from ALIS Blank sheets for new photopoints and upload Getacs (ALIS) Blank Jessup sheets LCI transect measure of distance and list of stops generated Map updates Photopoint manual Recent stock return and past inspection reports Property docket (optional for extra information) Land system and paddock plan maps Photopoint Equipment
100 m surveyor tape with clearly visible and fixed 10 m markers and ties both ends
sledge hammer
2 m measuring rod
jarrah pegs poly posts rebar or other markers Photopointcamera box with
numbered photopoint discs
nails for securing disc to marker peg
site description and species list sheets
Jessup transect recording sheet
digital camera all batteries charged
sighting compass
hand counters (at least 2)
inclinometer Other equipment Clipboards and elastic bands Pencils and sharpener Reference books eg plant books Charged computerGetac for GPS data Hand held GPS cleared of data from previous trips Inverter checked Water tanks filled Ropes Plastic bags Cooking kit Food Fridge
MEETING WITH LESSEESMANAGERS
First Meeting
Explain the assessment process answer any questions and invite them to participate Discuss Infrastructure changes Seasonal conditions eg rainfall fire Problem areasissues Future plans General management including paddock use changes to management feral animal numbers and
kangaroo numbers
Pastoral Lease Assessment Technical Manual for the Second round (2011)
7
Availability of station facilities eg shearers quarters places to camp places to avoid Radio frequency to contact them Photopoints updated eg have they been taking photos do they have a Photopoint manual
Final Meeting
Cross reference map items and do final check that everything has been up dated Discuss
Problem areas get their perspective and plans they have to address problems
Make sure they are aware of negative comments likely to be in the report giving them the opportunity to discuss
Next stage of the process and give them contact details of who they can speak to
Get their preferred contact details eg email phone etc
DESCRIPTION OF METHODOLOGY USED IN THE BASELINE ASSESSMENTS
Land system mapping
This involved identifying landscape patterns on remotely sensed images and describing the units that make up
this pattern in the field Land System boundaries were digitised and transferred to ARCINFO to form a graphical
base for a GIS Land systems descriptions and boundaries are checked during the assessment process A
coloured land system map for each station accompanies the lease assessment report
Lease infrastructure
During the assessment process the layout of the lease is discussed with the Pastoralist and any changes
such as new water point fence line or track developments that are not included on existing maps are noted
These details are then checked in the field and accurately located using a Global Positioning Unit (GPS) and
use of Getac Amendments are then made to the digitised files to update the paddock plans (see figure 2)
and the GIS
Waypoints of features and tracking of line features for updating of mapping products will be made by the field assessors in the second round this includes both new and existing infrastructure not previously captured
Pastoral Lease Assessment Technical Manual for the Second round (2011)
8
Figure 2 Station paddock plan
Monitoring
A monitoring baseline has been established in each paddock This consists of a photopoint and a plant
species list with associated data Fixed belt transects have been used to collect ecological data This is
compiled into a ldquophotopoint manualrdquo and the lessee is given a copy and encouraged to photographically
monitor the sites These sites are usually located on water runs to enable the Pastoralist to inspect the sites
on a regular basis It was planned these sites would be re-measured by the Pastoral Management Branch
every 5-7 years (depending on resources) but in reality only sites in ldquopriority paddocksrdquo have been revisited
at this order of frequency
All previously-established photopoints which can be re-located will be revisited and re-measured Every attempt should be made to relocate photopoints but if not possible new sites will be installed
Plate 1 Pastoralist involvement in the assessment process
Paddock condition
The assessment process also describes the condition of each paddock within a lease and identifies any land
management issues that require attention This information is entered into the database so that a history for
each paddock within a district is developed
Paddocks that require immediate attention or action are detailed in the assessment report for the Board
These ldquopriority paddocksrdquo are inspected on a more regular basis and the lessee must make progress
towards rectifying the identified land management problems ldquoMonitor paddocksrdquo are identified where less
immediate attention is required or where issues should be monitored by lessees and the PLMG
Lease Assessment Reports
A lease Assessment Report is the formal document that provides details of the assessment of the land
condition over the ldquorunrdquo These reports are forwarded to the lessees who have 60 days to consider and
comment The Board then considers all comments and accepts the report
On completion of a district and all LCI scores analysed the Board will set the land management conditions of
the lease which includes a maximum stocking level The lessee may apply to the Pastoral Board at any time
for a temporary increase above this maximum Land management conditions may be adjusted and the term
of the lease extended if the lessee has complied with the lease conditions and fulfilled a duty to improve the
condition of the land
Pastoral Lease Assessment Technical Manual for the Second round (2011)
9
The report provides pastoralists or other land managers with information to ensure sound land management
practices are followed These reports provide details of a monitoring system that will supply the land user
with reliable interpretable and repeatable information to detect changes that result from land use practices
(rangeland condition and trend)
Capacity of the land to carry stock
The Pastoral Board is required to specify a maximum stocking level for the lease and the lessee is not
permitted to exceed this figure without the prior permission of the Board Stock maxima determined under
the previous Act (Pastoral Act 1936) did not include an assessment of the condition of the land and were
often set at inappropriate levels The previous maximum figure has long been represented by the pastoral
industry as the actual carrying capacity of the lease
The Objects of the Act specify that the Pastoral Board must ensure that degradation does not or is not likely
to occur Maximum stocking levels for a lease are far from ideal as an effective method for ensuring that
pastoral land is not degraded as they do not provide for stocking levels in individual paddocks under a range
of condition classes and pasture components
Plate 2 Fenceline contrast resulting from different management practices
The evidence for appropriate long term stocking levels must come primarily from-
what the land has carried in the past without severe degradation
what successful management practices have been implemented for various pasture types
how management practices generally are related to the present land condition
For the first round of assessments the Board determined that the most recent 10 year stocking average
(which includes a range of seasonal conditions) plus 20 allowance for good seasons would provide the
basis of the maximum lease offer This had the effect of bringing a number of leases with unrealistic previous
maximums to a more realistic figure The Board has reviewed its approach (and policy) on the setting of stocking limits for round two however it acknowledges that lease stocking maxima are at best a ldquoblunt instrumentrdquo for use in managing land resources Short-term adjustment of paddock stock numbers appropriate for conditions is the most effective tool but a maximum provides a statutory limit and guide to numbers likely to be able to be carried in the best seasons The current method uses a combination of LCI results paddock condition ratings area and watered area The Board considers that a better way of setting stock maximum would be to do so based on the capability of each land type within its watered area However the current inventory of these resources is not accurate to the level required and steps are being taken to work towards the future use of such a method
Pastoral Lease Assessment Technical Manual for the Second round (2011)
10
LAND CONDITION INDEX
The land condition assessment of the various pasture types involves defining what constitutes an intact or
un-degraded landscape and deciding on the criteria that indicates to what degree disturbance has occurred
The PLMC Acts emphasis on indigenous plant species largely determines an on-ground approach as it is
necessary to ascertain the mix of plant species It is also important to determine if seedlings are present as
this helps to indicate whether the land has a capacity to rehabilitate in cases of past damage It is for this
reason that remote sensing techniques may not be appropriate to determine land condition in most parts of
the sheep pastoral areas according to the Act
The following processes were used in training and calibration for these assessments during the first round of
assessments
The process of land condition assessment involves a preliminary reconnaissance survey by senior scientific
officers to determine pasture types and condition criteria This is followed by a training period for field staff to
become fully competent in using these criteria in assessing the various land condition states
The purpose of this reconnaissance survey by senior officers is to
identify the various pasture types and the sub-units called pasture components that make up these
pasture types within the district
determine the criteria that will be used to identify three condition classes within each pasture
component
Only three land condition classes (1 = poor 2 = fair and 3 = good) are described as this limits the number of
choices and therefore reduces possible observer errors To avoid the influence of seasonal changes and
drought the criteria are based primarily on perennial vegetation components with erosion levels included where
applicable The issue of so-called opportunity country involving only ephemeral growth is dealt with separately
Each condition class for each pasture component is described according to key indicator plants
Photographs and written criteria are compiled that depict each of the three condition classes for each of the
pasture components The criteria and photo-standards are compiled into manuals which are subsequently
used by the assessment officers in carrying out the lease assessments
Field staff are trained in the field to recognise the various condition classes for each of the pasture
components to achieve a uniform standard and tested thereby ensuring that all staff will assess the
condition of land uniformly and without bias
Analysis of changes from round 1 to 2 on any particular station occurs and also changes on a station
comparative to the average change of each pasture type in a district
PHOTOPOINTS
Monitoring the condition and trend of land under various grazing practices is an important on-going
management tool Photopoints are established in most paddocks to provide an indication of these trends
Revisiting these sites enables the development of a photographic sequence supplemented by vegetation
and soil information to provide an objective record of change at a site The photopoint is a sample of land
condtion in a particular paddock where located in a typical area This objective data is used to support
subjective judgements on condition in a paddock and a station overall A photopoint can also be set up in
atypical areas to monitor a specific issue
The Pastoral Land Management group will carry out regular long term monitoring of these sites However it
is important that short-term seasonal changes are also recorded if possible Pastoralists are encouraged to
regularly monitor the photopoints and have been involved in the initial establishment of the sites During this
Pastoral Lease Assessment Technical Manual for the Second round (2011)
11
process the assessment techniques can be demonstrated and the photopoint method explained to ensure
the pastoralist is able to carry on with subsequent monitoring if he or she desires
Through combining short term and long-term records our understanding of ecosystems may be improved
and future grazing practices can be adapted to suit these trends Stock records for each paddock together
with climatic information observations of grazing on desirable plants germination events and other factors
will provide a valuable record that will assist in future decision making regarding the objectives of sustainable
use
Changes in the soil and vegetation components may follow
a fire
extreme seasons wet or dry
a marked change in vegetation cover
defoliation of chenopod shrubs (saltbush or bluebush)
establishment of new shrub seedlings
death of shrubs or trees
invasion by unpalatable plants
Access and relocation of existing photopoints (finding the site)
Sites are generally placed alongside station tracks for ease of relocation If a site is located on a now-unused track then be sure to note how to find the turn-off and any other important features The photopoint peg or post should in open country be visible from the track although it is desirable to place it far enough off the track to reduce the chance of it being driven over or destroyed by road maintenance or minor realignment Experience has shown that sites placed 10-50 metres from the track provide the best chance of not being damaged or rendered useless from road effects while still being easily accessible for revisits Careful recording of the GPS and distances is essential and will assist future assessors Use of hills and other features in a photo may assist in relocation
New Photopoints
Choosing the location for a new photopoint
The photopoint location will depend on the major objective for setting it up
To encourage pastoralists to monitor the sites they need to be easily locatable Record the distance from a
permanent feature eg gate or trough and if possible record the distance from the opposite direction Use
the GPS to capture co-ordinates for the site
The following factors should be considered when choosing a site particularly when monitoring grazing
impact
Distance from water
Grazing intensity of domestic stock decreases with distance from the permanent water source Choosing sites at a consistent distance from water allows for more effective comparison between sites Assessment sites for sheep stations are generally placed about 15 km from permanent water but more importantly should monitor areas where indicator species are still present or be expected to occur In cattle areas the site may be between 2-4 km from water Where an acceptable site does not occur at the desired distance personal judgement must be used in choosing the best location taking the above factors into consideration This may involve locating the site further or a little closer to the watering point or simply abandoning the attempt to locate a site out from that particular water (especially if another track or water in the paddock is also monitored)
Representation of a land unit
If establishing a new site in a paddock which does not have any existing sites this site should be located within a recognisable land unit that is typical of the paddock For example do not choose an isolated
Pastoral Lease Assessment Technical Manual for the Second round (2011)
12
bluebush patch if it is not typical of the paddock Avoid vegetation patches that are obviously atypical or are small areas of transition between communities The unit chosen must also be one that gives a good indication of grazing impact For example do not place a site in a very stable resilient vegetation type if the majority of the paddock or areas preferred by stock are much less resilient
Size and uniformity
The site should be uniform with respect to vegetation soil slope and aspect The more extensive the area of the site the better While a site might take observations of a radius of 200m an area of 100m radius should be considered a minimum but all observations must be made within uniform land typeunit Disturbed areas such as roadsides must not be considered
Other influencing factors
Other factors likely to bias or influence the site vegetation should be recognised and avoided where possible Avoid placing sites in the following situations
on a southern fence since sheep tend to graze into the wind and in most sheep - pastoral areas of SA the prevailing wind is from the south
sheep camp areas or where animals walk parallel to the track resulting in heavily tracking
mechanically disturbed areas
water run-on areas from tracks or where old track marks or erosion is evident
Photopoint setup
Directions to each photopoint should comprise a distance and direction from a known point such as a water
point A metal numbered disc on a polydropper fibreglass or steel rebar post (or wooden peg) marks each photopoint established during or before the first round (refer figure 3) This is referred to as the marker peg
However where the marker has disappeared or deteriorated new markers will consist of some more
permanentvisible materials
Figure 3 Diagram of a typical ldquoQSrdquoPhotopoint Monitoring site
Position the marker peg 10-50 m off the track in a clearly visible location that is not likely to be disturbed
However ensure the area to be monitored is free of vehicle track effects such as water flow stock
movement etc If the marker peg is positioned further than 50 m from the track position another directional
peg near the track and give clear directions on the site sheet to the location of the marker peg or post (ie
Pastoral Lease Assessment Technical Manual for the Second round (2011)
13
bearing and distance from 1st peg) Remember it may be some time before the site is re-visited and the site
is wasted if it can‟t be re-located
A second peg usually a jarrah peg is located approximately 17 paces from the marker peg This is referred to as the sighter peg This peg is positioned such that the photograph area does not include more than 13 skyline
and the bearing will follow the line of the Jessup transect A third peg is placed 100 m from the sighter and used
to mark the end of the Jessup transect Not all sites will have a Jessup transect
Locations of all photopoint sites will be recorded with a GPS from the vehicle and marked on the updated station
paddock plan
The photograph should be taken from the marker peg Record a compass bearing between the marker peg
and sighter peg If other photos are taken from the marker peg the bearing should be marked with an
additional sighter peg
Taking the photograph
Photos are taken with a digital SLR camera and with the zoom set to replicate the original 50mm lens
cameras Photos are taken in RAW format and downloaded daily To take the photograph stand behind the
marker peg and centre on the base of the sighter peg as shown in plate 5 and figure 4 Adjust focus to
infinity to ensure all of the transect is in focus
Plate 3 Taking a photograph
Figure 4 Directions for taking the photograph
Pastoral Lease Assessment Technical Manual for the Second round (2011)
14
RECORDING FIELD INFORMATION
Site description and location
Site sheets and the information collected have changed and evolved over the period of assessment An
example of the current site sheet is shown in appendix 1
Detailed below are the fields of information together with the type of detail that should be recorded Note Completed entry example shown in brackets (italics)
QS OB RS TS Prefix to describe type of photopoint followed by photopoint number
as per the disc (eg QS 2345)
QS - Quantitative site A pegged site used for monitoring vegetation
changes with Jessup andor step-point data (formerly photopoint -
PP)
OB - Observation site A pegged site used as an observation site to
monitor changes that can be detected by a photographic sequence
eg rehabilitation spread of erosion gullies Site description includes
a list of plant species but with no measured plant data collected
RS - Reference site Sites are in areas remote from grazing influence
greater than 5 km from water in sheep country and 8 km in cattle
country Also includes exclosure sites Complete all site description
and plant and soil sheets
TS - Type Site Designated for site characteristic of mapped land
system in early part of baseline assessment process As per OB but
sites were not usually pegged
PC ndash Photo Comparison Should be used strictly where a photo is to
be compared and data collected would not be required eg A
panorama on a hill top where species in the foreground are not
relevant to the background being monitored in a photo
All photopoints should be prefixed with QS OB RS PC or TS
DATE Day Month and Year (eg 01062007)
OBSERVERS Initials of persons involved in data collection Initials of the person
filling out the sheet first followed by second observer (egMTCB)
STATION Pastoral station name Use the full name of the station (eg
Bulgunnia)
PADDOCK Full paddock name may include subscript eg formerly part Cyclone
(Monsoon)
ZONE Grid reference zone generally on the bottom of the map (eg 54)
MAP SHEET Map sheet number 150000 five digits eg 66341 1100000 four
digits eg 5434 (66341)
EASTING amp NORTHING Co-ordinates on GPS Unit
Pastoral Lease Assessment Technical Manual for the Second round (2011)
15
DATUM GDA 94
SERIES Refers to the filing system for photopoint photograph series for the
station indicates the station with the month amp year the photo was
taken First four spaces are for the station (or trip name) abbreviated
to the first four letters eg Bulg for Bulgunnia Next two are digits for the month followed by two digits for the year eg (Bulg 0691)
DIGITAL Image number
WATERPOINT Name of nearest permanent water source by direct route as a sheep
would walk Note type also eg dam trough tank (Moonbi Tank)
DISTANCE (km) Distance (to one decimal point) to water source named above ie by
direct route as a sheep would walk Record the straight-line distance from the GPS (eg 16 km)
CONDITION Condition rating for the site as per condition rating guidelines Refer to
appendix 2 for condition class attributes Notes on attributes in the site comments will help to support this judgement (eg Good)
MUD MAP Diagram of how to relocate the site clearly labelled with distances
Include paddock name and adjacent paddocks track location and
gate zero origin water location site number Orient the map with
north to the top of the page
MUD MAP COMMENTS Clear directions on how to relocate the site completed according to
the following format Keep in mind that this will be printed out for the
lessee
Distance from gate or trough direction on track to next bore or
paddock along fence Place where zero taken from eg tank trough
gate - be specific What type of peg or marker was used and how far it
is off the track and in what direction Distance to sighter peg and
bearing Jessup transect length (normally 100m) and bearing from sighter peg (Use tripmeter if no Halda rally meter or similar)
Example mud map comments (15 km south of Twin Well on track to Gladstone Bore or 35km north
of gate from Dusty paddock Zero at trough Jarrah peg and disc at 15 paces east of track Sighter peg (jarrah) at 17 paces bearing 90deg Jessup transect 100 m x 2 m x 2 at 90deg end marked by jarrah peg)
EROSION Record the severity and type of erosion according to the table in
appendix 4
COMMENTS Record notes that help to further explain observations or that will
assist interpretation of the data for present and future observations
This should include notes to indicate why the site was established and
what it is monitoring It should also include notes that help explain the
condition rating and current impacts or changes including erosion
Data entry Initials of person who entered data on the database and the date of
entry (egCB 5391)
Pastoral Lease Assessment Technical Manual for the Second round (2011)
16
Establishing new sites The site details below are only relevant for new sites set up as part of the second assessmentndash not used for revisits as part of the second round
LAND SYSTEM Land system name taken from land system map (egWeedna)
ROCK TYPE Name of rock type from geological map or rock type identified at site if
geology map incorrect (egred sandstone)
FORMATION Name of rock formation from geological map (egPound Quartzite)
LANDFORM SLOPE Slope of the site measured in degrees by use of clinometer
Do not confuse degrees with (eg2deg)
ELEMENT Landform element of site
1 crest curved in down slope profile and margins at limit of observed
curvature
2 slope considered as planar Note in comments if upper mid or
lower slope
3 flat planar
4 depression may be open or closed
PATTERN Term to describe the landform type eg alluvial plain = ALP See
appendix 3 for abbreviations and descriptions (egALP)
Pastoral Lease Assessment Technical Manual for the Second round (2011)
17
Vegetation
SIGNIFICANT RAIN Yes - data collection following rains that resulted in green ephemeral
response record dates if known of significant falls
No - dry ephemeral growth only
TYPE S (summer) - rain fell between November and March
W (winter) - rain fell between April and October
I (indistinguishable) - cannot tell if resultant green ephemeral growth is
from summer or winter rain events or is a combination of both
VEGETATION SPECIES Effort should be made to record all plant species throughout the site
Recording plant species should be carried out until most species are
recorded (ie until a period of minutes elapses before further species
are not found) Record full species name on the site sheet
If plant species is not known collect a specimen fill out details in the
herbarium collection booklet and include photopoint number and line
number of record on sheet eg 234512 so that this number can be
entered on subsequent site sheets Put the herbarium label with the
specimen in the plant press Keep a list of plants collected and PPline
number so that you can give this number to collected species at other
sites Update the site sheet with the correct species name when it
comes back from the herbarium or identity confirmed
DOM Dominant species This will be used to classify vegetation
associationsgroups
1 visually pre-dominant species forming the tallest stratum CSR
class should exceed 1 (CSR 2-6)
2 if another tallest stratum species is present (co-dominant) it is
selected OR if absent the most abundant understorey species is selected eg Mai sed
3 selected from any stratum usually a lower stratum as an indicator
species (that is a species of known environmental preferences or
of such abundance that it can‟t be ignored) or to distinguish between associations eg Atr ves
4 other conspicuous species to separate associations eg Scl obl
GRAZED If a plant is obviously grazed tick the box If grazing is mainly by
rabbits or goats this should be noted in the comments
RESPROUT If the plant has previously been grazed back and is now showing fresh
new growth tick the box Note extent in comments eg Atr ves adults
showing abundant new growth following recent rains
RECRUITMENT If seedlings are evident or new suckers (eg Bullock bush) tick the
box Note height of seedlings in comments eg Mai sed seedlings to
5 cm abundant in open areas
FRUIT If the plant is in fruit tick the box This will enable data collection on
best times for seed collection Record relevant notes in comments
Pastoral Lease Assessment Technical Manual for the Second round (2011)
18
Crown Separation Ratio (CSR) The average distance between crowns divided by the average size of
the crown grouped into various size classes (see appendix 5)
1 present lt 12 plants in 200 m radii
2 isolated clumps gt20 CSR clumps of two to five woody plants 200
m further apart
3 isolated plants gt20 CSR trees gt100 m apart
4 very sparse 6-20 CSR crowns well separated
5 sparse 1-5 CSR crowns clearly separated
6 mid dense 0-09 CSR crowns touching to slightly separated
7 closed or dense crowns touching to over lapping
JESSUP Refers to the results of the Jessup transect (see section 81
for more details)
See appendix 6 for Jessup transect recording sheet Record total
counts from the Jessup transect field sheet for each species adult
and juvenile
FIRE SCARS Yes - fire scars evident on stumps trees or fence posts Fire scars
should be recorded if fire occurred since the first assessment
No - no fire scars visible
Last burn - date of last known fire Check with the lessee and record
further details in the comments eg fierce summer fire burnt out NW
corner killing all mulga
Pastoral Lease Assessment Technical Manual for the Second round (2011)
19
Vertebrates
VERTEBRATES Presentabsent for dung tracks browsed vegetation burrows
throughout the site
It is only necessary to record current or fresh activity and record as
presence (P) Old or past activity should be noted in the comments
Table 1 Vertebrate pests
Animal Sighted Dung Tracks Browse BurrowsCamp
Rabbit visual sighting fresh buck
heaps
scratchings
present
graze line with chisel
marks on stems
warren heaps
marks
warren active
Sheep visual sighting fresh dung
active padding recent grazing camps
Cattle visual sighting fresh dung active padding recent grazing camps
Goats visual sighting fresh dung active padding browse shrubs
Note in comments
height of browse line
camps
Roos visual sighting fresh dung active padding recent grazing
(check for tail drag)
camphollows
other
Others include fox cat dingo camel horse wombat etc
Note any other useful information in the general comments for example mob of 200 goats sighted More
detailed comments can be included if needed in the paddock description
Pastoral Lease Assessment Technical Manual for the Second round (2011)
20
DENSITY MEASUREMENT OF PERENNIAL PLANT SPECIES
Perennial plants provide stability to grazing management systems due to their ability to persist during dry
periods consequently the measurement of plant attributes such as density and frequency of perennials
particularly those which are palatable are important in understanding plant dynamics and rangeland condition
Plant counts within fixed belt transects have been used to determine the density of shrubs and repeated
measurements allows density changes to be detected To ensure that observer error is minimised it is vital that
the same technique and standards are used in repeat measurements Modifications made in 1990 enabled
changes to be isolated to discreet quadrats and recruitment and deaths of cohorts can be followed
Jessup transect
This method incorporates a belt transect (a standard ecological technique) that is based on an original
survey technique used for chenopod shrublands by Jessup (1951) and further developed by Lay (1979)
Their technique involved driving a vehicle over a site for a set distance and shrubs occurring within the wheel
marks (representing the belt transect) were recorded This rather destructive technique is now simulated by
a fixed 4 m x 100 m transect and enables a density and frequency estimate of perennials for each site The
frequency estimates are not based on the optimum quadrat size for all species and the 10 m x 2 m quadrats
used should not be taken to represent true frequency readings It should also be noted that species
composition by frequency is not equivalent to composition by cover or density The length of some early
transects has varied from the current standard so ensure that any future comparisons use the same transect
configuration (see 821below)
The Jessup transect method measures the density (shrubsarea) and frequency of perennial plants at sites
where perennial cover occurs ie chenopods other shrubs and tussock (perennial) grasses Counting age
classes of shrubs (adultjuvenile) gives further information on population changes Monitoring over time
provides an indication of recruitment trends
Recording is based on all perennial shrubs within the transect being recorded by species and age class
(adultjuvenile) If the base of the plant is in the transect it is counted If the foliage only is in the transect it is
not counted
Transect layout
Jessup transects are permanently marked and comprise
transects 100 m x 2 m x 2 (see figure 5)
recordings separated into 10 m x 2 m blocks
identification of perennial plant species
less than 10 cm high andor non woody base = juvenile
more than 20 individual juvenile bushes or perennial grasses per 10 m x 2 m block = 20+ recording
1 Transects should include only one land unit and preferably be restricted to one element for data
analysis Transects are 100m long and generally at right angles to the track Walk the length of the
transect to ensure it is suitable before setting up the site and identify and discuss species present
with the other observers
2 Record a compass bearing for the transect
3 Secure a surveyors tape (marked into 10 m segments) to the sighter peg and lay out the tape to 100
m keeping the marker and sighter pegs in line
4 Check that the tape is in line with the sighter and marker peg Tension the tape and drive in the peg at the 100 m mark and secure tape to the peg It is important to have the tape extended to full
100m and tight and straight so that data is replicated at the quadrat level
Pastoral Lease Assessment Technical Manual for the Second round (2011)
21
5 If the transect layout is normal note this on the sheet if different note the transect layout on the site
description sheet and orient diagram with north to the top of the page Give clear legible directions
and bearings
Figure 5 Jessup transect layout
Recording a Jessup transect
1 Use a surveyors tape that is clearly marked into 10 m intervals If it is marked with tape check that
this has not slipped from the 10 m graduations Counts should be recorded on a Jessup transect
data sheet (see appendix 6)
2 Commence transect on left side of tape (UP) using 2 m rod (refer plate below) Check that the rod is
2 m A two metre curtain pole is ideal for this
Plate 4 Recording a Jessup transect
3 Identify each perennial species If in doubt collect a specimen
4 Easiest operation is with one person observing (counting) and another recording and acting as a
checking observer The recorder (scribe) stands at the 10 m marker intervals and the observer calls
out the adultjuvenile strikes along each 10 m transect interval The recorder can assist by spotting
hidden plants and small juvenile plants
5 For plants on quadrat margins include only in the quadrat where the rooted stem is located Count
plants only if they are more than 50 rooted within the quadrat
6 Chenopods occur in clumps and it is difficult to distinguish individuals for this reason clumps are
recorded and are recognised as individual clumps if there is more than a 30 cm gap between the
rooted stems Criteria for counting plants growing close together are as follows
End peg Sighter peg Site marker amp disc
11 12 13 14 15 16 17 18 19 20
10 9 8 7 6 5 4 3 2 1
100 m
4 m
Pastoral Lease Assessment Technical Manual for the Second round (2011)
22
distinguish between individual clumps if there is more than a 30 cm gap between rooted stems
if crowns are distinct and bases are less than 30 cm apart count each as an individual
if crowns are touching or overlapping and gap between rooted stems is less than 30 cm count
as one clump
Note In cases of perennial plants such as low bluebush being grazed the reduction of the crown
may lead to higher count of bush numbers Care is required when comparing existing Jessup counts
and noted should be recorded if this type of splitting has occurred
7 Record juveniles as plants less than 10 cm high or wide and not woody However if obviously old
woody plants are grazed back to less then this size record as adults but make comment
accordingly
If greater than 20 juvenile individuals of any species encountered in 10m interval (quadrat) record as
20+ This avoids attempting to count up to 200 seedlings but still provides sufficient data to interpret
that recruitment is occurring Large numbers of seedlings can occur following favourable conditions
and it becomes difficult to count all of these However where feasible a total count of juveniles
should be undertaken
8 For perennial grasses record clumps if greater than 10 cm high or 10 cm wide ie no juvenile
categories Record count as 20 + if greater than 20 individuals within one 10 m x 2 m block This is
to aid interpretation of step-point cover data eg low density but high cover implies large spreading
individuals high density but low cover may imply a grazing effect - site comments should indicate
this The quadrat sizes are not well suited to grasses but do provide an indication of the level of
grasses within a shrubland
9 Do not record dead or completely defoliated bushes but note occurrence in comments
10 Proceed to end of transect and commence quadrats 11-20 (ie 100-0m) on other side of tape
(down)
11 Record minor site variations in comments relating to quadrat intervals eg 20-30m large scaled area
Pastoral Lease Assessment Technical Manual for the Second round (2011)
23
DATABASE AND GIS ndash needs update for ALIS and FDE
Site information is currently entered into the Arid Lands Information System (ALIS) and print-outs and
photographs are supplied to the lessee for every photopoint on the station in the form of a Photopoint
Manual
In 1991 the Geographic Analysis and Research Unit (GAR) of the Department of Housing and Urban
Development has been assisting the Pastoral Management Branch in the establishment and maintenance of
a Pastoral Geographic Information System (Malcolm and Nicolson 1995) The GAR unit operates a
centralised ARCINFO (Environmental Systems Research Institute USA) GIS facility and is the
Environmental Node of South Australia‟s Land Information System
Extensive development was carried out on ALIS and while operational is still undergoing some further
development Management of this system is though Client Services in DENR in collaboration with the
Pastoral Program Development of a system for field data entry onto GETEC tablets has been completed
and is undergoing transition into the operational phase This will improve data collection with validation in the
field and also allow considerable time saving and possible transposition errors removing one stage in the
data entry process
Lease infrastructure information is derived from a number of sources that vary in age scale and accuracy
During the assessment process topographic maps are used as a base map and information is checked
corrected of altered using various techniques Prior to the introduction of Global Positioning Systems (GPS)
in 1992 the information was collected using bearing and distance measurement that were plotted onto base
maps The improved accuracy of GPS units over time has allowed increased accuracy and therefore an
improved mapping product
Lease maps and land system maps are available as hard copy products Watered areas for each paddock
can also be produced that indicate the extent that the lease is utilised by stock Undisturbed areas represent
quality wildlife habitats and further investigations are required to study the relationships between stocking
intensity land condition and wildlife habitat More detailed information can be found in Malcolm and
Nicolson (1995)
POST TRIP PROCEEDURE
The following checklist should be completed after each trip
Download photos and GPS co-ordinates
Data entry
Update photopoint manual and make 2 copies
Conduct LCI peer review
All spatial updates sent to GIS DWLBC
Write draft Assessment report
Submit for review
Pastoral Lease Assessment Technical Manual for the Second round (2011)
CONDITION CLASS
ATTRIBUTE EXCELLENT GOOD FAIR POOR VERY POOR
PLANT SPECIES
COMPOSITION
maximum diversity of
annual and perennial
species possible for the
land type
perennial species of
various ages
some reduction in density
of palatable and
susceptible perennials
increased proportion of
shorter lived species
perennial species of
various ages
significantly reduced
cover density andor
regeneration of
palatable species
establishment of less
preferred or
unpalatable species
dominance of annual and
ephemeral species and
perennials with relatively
low palatability
no regeneration of
desirable perennial
species existing stands
degenerate
seasonal cover of
only pioneer
ephemerals or
unpalatable weeds
large areas totally
unproductive
PLANT
PRODUCTIVITY
at full potential
sustained productivity
annual com unities
maintain litter cover but
not production in dry
seasons
some fluctuation lower in
drought and may be
higher than site potential
for some species eg
Mitchell grass
reduced overall high
productivity in good
season
low in drought
(fluctuates markedly
with season)
impaired productivity
very seasonally
dependant low or non
existent in dry seasons
areas incapable of
any plant growth
SOIL EROSION
STATUS
no erosion (other than
natural features or
processes)
plant and litter cover
protect soil from wind
and water in all
seasons
minor or slight erosion
evident
increased susceptibility of
soils to erosion in dry
seasons
moderate erosion
evident
reduced density and
cover of perennial and
litter increases
susceptibility of soils to
erosion in most
seasons
severe erosion overall
high susceptibility of soils
to erosion in all seasons
extent of past erosion
renders site susceptible
to further soil movement
if grazed at any level
unstable severely
or very eroded
Pastoral Lease Assessment Technical Manual for the Second round (2011)
Appendix 1 Erosion severitytype intensity criteria ndashfor reference to first round data sheets
EROSION SeverityType intensity criteria + RATING (max 200 m radius)
NO ACCELERATED EROSION 00
SLIGHT EROSION (10 of site affected)
slight accumulation of wind blown soil and plant bases and other obstacles 11
removal of finer soil particles evident but soil crust is largely intact 12
occasional rills (lt300 mm deep) evident 13
no gullies present 14
a few scalds present usually less than 2 m in diameter 15
MINOR EROSION (10-25 of site affected)
accumulation of soil around plant bases with plant mounds noticeably enlarged 21
evidence of pedestalling but soil loss minor and plant bases not greatly elevated 22
breaking of surface crust with small erosion faces and some redistribution of soil and
or some rilling evident 23
occasional shallow gullies only 24
scalding evident but scalds relatively small and discontinuous 25
MODERATE EROSION (25-50 of site affected)
wind piling around plant bases and other obstacles is common but no plants completely covered 31
pedestalling apparent with plant bases distinctly raised and with obvious
soil loss and deflation in parts 32
surface sheeting andor rilling common with erosion faces (andor micro-
terracing) and active redistribution of soil 33
gullying present on parts of the site 34
numerous small scalds common andor with a tendency to coalesce to form larger scalds in parts 35
SEVERE EROSION (50-75 of site affected)
extreme hummocking around plants and other obstacles some plants completely covered 41
severe pedestalling with plant bases greatly elevated and major soil loss
from deflation andor much of surface generally unstable with ripple marks 42
major rilling or surface sheeting with extensive exposure of subsoil or parent material
erosion faces (andor microterracing) and active redistribution of soil 43
widespread gullying 44
scalding extensive smaller scalds have coalesced to form large more or
less continuous scalded areas 45
EXTREME EROSION (75-100 of site affected)
general surface movement area more or less bare with formation of shifting dunes 51
most of original land surface altered any last remnants of original soil or
vegetation standing as sentinels in a barren landscape 52
water sheeting andor rilling coalesced to expose subsoil or parent material 53
extensive gullying 54
scalding more or less continuous over large areas 55
Note Record severity first and then type eg 53 = Extreme erosionScalding
Pastoral Lease Assessment Technical Manual for the Second round (2011)
Appendix 2 Crown Separation Ratio
This is a visual estimate of plant cover
It is the average distance between crowns (the area the plant takes up if viewed from above) divided by the
average size of the crown In the field this means visualising how many crowns of a given plant species can be fitted in between the distance to the nearest neighbour of that species on average over the site The
classes are as follows
CLASS TERM CSR FIELD CRITERIA
1 Present lt 12 plants lt12 plants within 200 m radius
2 Isolated clumps gt20 spaces Isolated clumps of two to five woody plants 200 m
further apart
3 Isolated Plants gt20 spaces Isolated plants
4 Very Sparse 6-20 spaces well spaced crowns well separated
5 Sparse 1-5 spaces clearly spaced crowns clearly separated
6 Mid dense 0-09 spaces crowns touching to slight separation
7 Closed or dense 0 crowns touching to overlapping
Modified from Table 14 McDonald (1990)
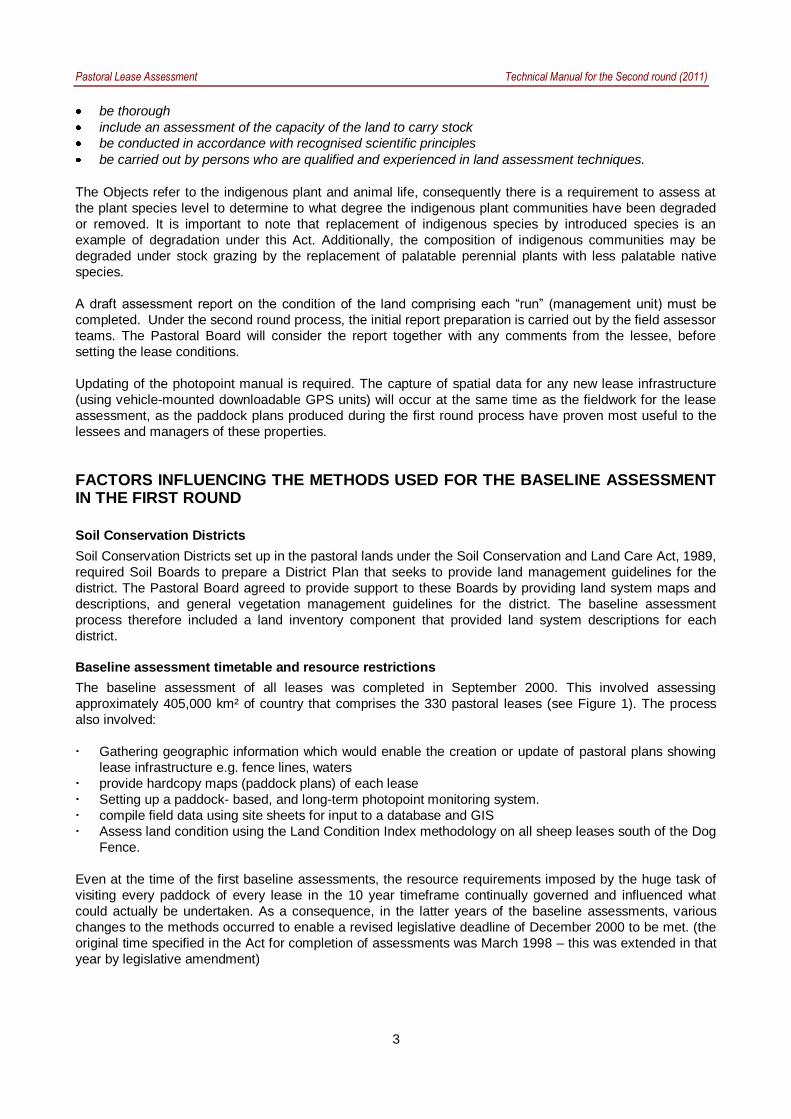
Pastoral Lease Assessment Technical Manual for the Second round (2011)
4
Lessee involvement in monitoring
The monitoring process is aimed at increasing the awareness of lessees in managing the land resource and
focuses on plant and soil resources to determine trends in condition under grazing practices A significant
though small number of pastoral managers have become involved in the monitoring process since the
baseline assessments and have retaken photos at photopoints to monitor seasonal or short-term changes
or effects of stock management practices
The first training lease Coondambo for the second round process in 2005 is one such property where the
manager has regularly revisited and photographed the photopoint sites
Pastoral Lease Assessment Technical Manual for the Second round (2011)
5
Figure 1 Map of pastoral leases within South Australia
Pastoral Lease Assessment Technical Manual for the Second round (2011)
6
PREPARATION FOR AN ASSESSMENT TRIP
The following check list should be completed prior to each trip Contact lesseemanager To arrange a time and location to meet at the beginning of the field trip (Act states 28 days notice) Discuss potential accommodation availability of fuel (if required) Collect property information Copy of first assessment report from Pastoral Land Management Group (PLMG) Adelaide Paddock write-ups site revisit and pastoral inspection sheets from ALIS Blank sheets for new photopoints and upload Getacs (ALIS) Blank Jessup sheets LCI transect measure of distance and list of stops generated Map updates Photopoint manual Recent stock return and past inspection reports Property docket (optional for extra information) Land system and paddock plan maps Photopoint Equipment
100 m surveyor tape with clearly visible and fixed 10 m markers and ties both ends
sledge hammer
2 m measuring rod
jarrah pegs poly posts rebar or other markers Photopointcamera box with
numbered photopoint discs
nails for securing disc to marker peg
site description and species list sheets
Jessup transect recording sheet
digital camera all batteries charged
sighting compass
hand counters (at least 2)
inclinometer Other equipment Clipboards and elastic bands Pencils and sharpener Reference books eg plant books Charged computerGetac for GPS data Hand held GPS cleared of data from previous trips Inverter checked Water tanks filled Ropes Plastic bags Cooking kit Food Fridge
MEETING WITH LESSEESMANAGERS
First Meeting
Explain the assessment process answer any questions and invite them to participate Discuss Infrastructure changes Seasonal conditions eg rainfall fire Problem areasissues Future plans General management including paddock use changes to management feral animal numbers and
kangaroo numbers
Pastoral Lease Assessment Technical Manual for the Second round (2011)
7
Availability of station facilities eg shearers quarters places to camp places to avoid Radio frequency to contact them Photopoints updated eg have they been taking photos do they have a Photopoint manual
Final Meeting
Cross reference map items and do final check that everything has been up dated Discuss
Problem areas get their perspective and plans they have to address problems
Make sure they are aware of negative comments likely to be in the report giving them the opportunity to discuss
Next stage of the process and give them contact details of who they can speak to
Get their preferred contact details eg email phone etc
DESCRIPTION OF METHODOLOGY USED IN THE BASELINE ASSESSMENTS
Land system mapping
This involved identifying landscape patterns on remotely sensed images and describing the units that make up
this pattern in the field Land System boundaries were digitised and transferred to ARCINFO to form a graphical
base for a GIS Land systems descriptions and boundaries are checked during the assessment process A
coloured land system map for each station accompanies the lease assessment report
Lease infrastructure
During the assessment process the layout of the lease is discussed with the Pastoralist and any changes
such as new water point fence line or track developments that are not included on existing maps are noted
These details are then checked in the field and accurately located using a Global Positioning Unit (GPS) and
use of Getac Amendments are then made to the digitised files to update the paddock plans (see figure 2)
and the GIS
Waypoints of features and tracking of line features for updating of mapping products will be made by the field assessors in the second round this includes both new and existing infrastructure not previously captured
Pastoral Lease Assessment Technical Manual for the Second round (2011)
8
Figure 2 Station paddock plan
Monitoring
A monitoring baseline has been established in each paddock This consists of a photopoint and a plant
species list with associated data Fixed belt transects have been used to collect ecological data This is
compiled into a ldquophotopoint manualrdquo and the lessee is given a copy and encouraged to photographically
monitor the sites These sites are usually located on water runs to enable the Pastoralist to inspect the sites
on a regular basis It was planned these sites would be re-measured by the Pastoral Management Branch
every 5-7 years (depending on resources) but in reality only sites in ldquopriority paddocksrdquo have been revisited
at this order of frequency
All previously-established photopoints which can be re-located will be revisited and re-measured Every attempt should be made to relocate photopoints but if not possible new sites will be installed
Plate 1 Pastoralist involvement in the assessment process
Paddock condition
The assessment process also describes the condition of each paddock within a lease and identifies any land
management issues that require attention This information is entered into the database so that a history for
each paddock within a district is developed
Paddocks that require immediate attention or action are detailed in the assessment report for the Board
These ldquopriority paddocksrdquo are inspected on a more regular basis and the lessee must make progress
towards rectifying the identified land management problems ldquoMonitor paddocksrdquo are identified where less
immediate attention is required or where issues should be monitored by lessees and the PLMG
Lease Assessment Reports
A lease Assessment Report is the formal document that provides details of the assessment of the land
condition over the ldquorunrdquo These reports are forwarded to the lessees who have 60 days to consider and
comment The Board then considers all comments and accepts the report
On completion of a district and all LCI scores analysed the Board will set the land management conditions of
the lease which includes a maximum stocking level The lessee may apply to the Pastoral Board at any time
for a temporary increase above this maximum Land management conditions may be adjusted and the term
of the lease extended if the lessee has complied with the lease conditions and fulfilled a duty to improve the
condition of the land
Pastoral Lease Assessment Technical Manual for the Second round (2011)
9
The report provides pastoralists or other land managers with information to ensure sound land management
practices are followed These reports provide details of a monitoring system that will supply the land user
with reliable interpretable and repeatable information to detect changes that result from land use practices
(rangeland condition and trend)
Capacity of the land to carry stock
The Pastoral Board is required to specify a maximum stocking level for the lease and the lessee is not
permitted to exceed this figure without the prior permission of the Board Stock maxima determined under
the previous Act (Pastoral Act 1936) did not include an assessment of the condition of the land and were
often set at inappropriate levels The previous maximum figure has long been represented by the pastoral
industry as the actual carrying capacity of the lease
The Objects of the Act specify that the Pastoral Board must ensure that degradation does not or is not likely
to occur Maximum stocking levels for a lease are far from ideal as an effective method for ensuring that
pastoral land is not degraded as they do not provide for stocking levels in individual paddocks under a range
of condition classes and pasture components
Plate 2 Fenceline contrast resulting from different management practices
The evidence for appropriate long term stocking levels must come primarily from-
what the land has carried in the past without severe degradation
what successful management practices have been implemented for various pasture types
how management practices generally are related to the present land condition
For the first round of assessments the Board determined that the most recent 10 year stocking average
(which includes a range of seasonal conditions) plus 20 allowance for good seasons would provide the
basis of the maximum lease offer This had the effect of bringing a number of leases with unrealistic previous
maximums to a more realistic figure The Board has reviewed its approach (and policy) on the setting of stocking limits for round two however it acknowledges that lease stocking maxima are at best a ldquoblunt instrumentrdquo for use in managing land resources Short-term adjustment of paddock stock numbers appropriate for conditions is the most effective tool but a maximum provides a statutory limit and guide to numbers likely to be able to be carried in the best seasons The current method uses a combination of LCI results paddock condition ratings area and watered area The Board considers that a better way of setting stock maximum would be to do so based on the capability of each land type within its watered area However the current inventory of these resources is not accurate to the level required and steps are being taken to work towards the future use of such a method
Pastoral Lease Assessment Technical Manual for the Second round (2011)
10
LAND CONDITION INDEX
The land condition assessment of the various pasture types involves defining what constitutes an intact or
un-degraded landscape and deciding on the criteria that indicates to what degree disturbance has occurred
The PLMC Acts emphasis on indigenous plant species largely determines an on-ground approach as it is
necessary to ascertain the mix of plant species It is also important to determine if seedlings are present as
this helps to indicate whether the land has a capacity to rehabilitate in cases of past damage It is for this
reason that remote sensing techniques may not be appropriate to determine land condition in most parts of
the sheep pastoral areas according to the Act
The following processes were used in training and calibration for these assessments during the first round of
assessments
The process of land condition assessment involves a preliminary reconnaissance survey by senior scientific
officers to determine pasture types and condition criteria This is followed by a training period for field staff to
become fully competent in using these criteria in assessing the various land condition states
The purpose of this reconnaissance survey by senior officers is to
identify the various pasture types and the sub-units called pasture components that make up these
pasture types within the district
determine the criteria that will be used to identify three condition classes within each pasture
component
Only three land condition classes (1 = poor 2 = fair and 3 = good) are described as this limits the number of
choices and therefore reduces possible observer errors To avoid the influence of seasonal changes and
drought the criteria are based primarily on perennial vegetation components with erosion levels included where
applicable The issue of so-called opportunity country involving only ephemeral growth is dealt with separately
Each condition class for each pasture component is described according to key indicator plants
Photographs and written criteria are compiled that depict each of the three condition classes for each of the
pasture components The criteria and photo-standards are compiled into manuals which are subsequently
used by the assessment officers in carrying out the lease assessments
Field staff are trained in the field to recognise the various condition classes for each of the pasture
components to achieve a uniform standard and tested thereby ensuring that all staff will assess the
condition of land uniformly and without bias
Analysis of changes from round 1 to 2 on any particular station occurs and also changes on a station
comparative to the average change of each pasture type in a district
PHOTOPOINTS
Monitoring the condition and trend of land under various grazing practices is an important on-going
management tool Photopoints are established in most paddocks to provide an indication of these trends
Revisiting these sites enables the development of a photographic sequence supplemented by vegetation
and soil information to provide an objective record of change at a site The photopoint is a sample of land
condtion in a particular paddock where located in a typical area This objective data is used to support
subjective judgements on condition in a paddock and a station overall A photopoint can also be set up in
atypical areas to monitor a specific issue
The Pastoral Land Management group will carry out regular long term monitoring of these sites However it
is important that short-term seasonal changes are also recorded if possible Pastoralists are encouraged to
regularly monitor the photopoints and have been involved in the initial establishment of the sites During this
Pastoral Lease Assessment Technical Manual for the Second round (2011)
11
process the assessment techniques can be demonstrated and the photopoint method explained to ensure
the pastoralist is able to carry on with subsequent monitoring if he or she desires
Through combining short term and long-term records our understanding of ecosystems may be improved
and future grazing practices can be adapted to suit these trends Stock records for each paddock together
with climatic information observations of grazing on desirable plants germination events and other factors
will provide a valuable record that will assist in future decision making regarding the objectives of sustainable
use
Changes in the soil and vegetation components may follow
a fire
extreme seasons wet or dry
a marked change in vegetation cover
defoliation of chenopod shrubs (saltbush or bluebush)
establishment of new shrub seedlings
death of shrubs or trees
invasion by unpalatable plants
Access and relocation of existing photopoints (finding the site)
Sites are generally placed alongside station tracks for ease of relocation If a site is located on a now-unused track then be sure to note how to find the turn-off and any other important features The photopoint peg or post should in open country be visible from the track although it is desirable to place it far enough off the track to reduce the chance of it being driven over or destroyed by road maintenance or minor realignment Experience has shown that sites placed 10-50 metres from the track provide the best chance of not being damaged or rendered useless from road effects while still being easily accessible for revisits Careful recording of the GPS and distances is essential and will assist future assessors Use of hills and other features in a photo may assist in relocation
New Photopoints
Choosing the location for a new photopoint
The photopoint location will depend on the major objective for setting it up
To encourage pastoralists to monitor the sites they need to be easily locatable Record the distance from a
permanent feature eg gate or trough and if possible record the distance from the opposite direction Use
the GPS to capture co-ordinates for the site
The following factors should be considered when choosing a site particularly when monitoring grazing
impact
Distance from water
Grazing intensity of domestic stock decreases with distance from the permanent water source Choosing sites at a consistent distance from water allows for more effective comparison between sites Assessment sites for sheep stations are generally placed about 15 km from permanent water but more importantly should monitor areas where indicator species are still present or be expected to occur In cattle areas the site may be between 2-4 km from water Where an acceptable site does not occur at the desired distance personal judgement must be used in choosing the best location taking the above factors into consideration This may involve locating the site further or a little closer to the watering point or simply abandoning the attempt to locate a site out from that particular water (especially if another track or water in the paddock is also monitored)
Representation of a land unit
If establishing a new site in a paddock which does not have any existing sites this site should be located within a recognisable land unit that is typical of the paddock For example do not choose an isolated
Pastoral Lease Assessment Technical Manual for the Second round (2011)
12
bluebush patch if it is not typical of the paddock Avoid vegetation patches that are obviously atypical or are small areas of transition between communities The unit chosen must also be one that gives a good indication of grazing impact For example do not place a site in a very stable resilient vegetation type if the majority of the paddock or areas preferred by stock are much less resilient
Size and uniformity
The site should be uniform with respect to vegetation soil slope and aspect The more extensive the area of the site the better While a site might take observations of a radius of 200m an area of 100m radius should be considered a minimum but all observations must be made within uniform land typeunit Disturbed areas such as roadsides must not be considered
Other influencing factors
Other factors likely to bias or influence the site vegetation should be recognised and avoided where possible Avoid placing sites in the following situations
on a southern fence since sheep tend to graze into the wind and in most sheep - pastoral areas of SA the prevailing wind is from the south
sheep camp areas or where animals walk parallel to the track resulting in heavily tracking
mechanically disturbed areas
water run-on areas from tracks or where old track marks or erosion is evident
Photopoint setup
Directions to each photopoint should comprise a distance and direction from a known point such as a water
point A metal numbered disc on a polydropper fibreglass or steel rebar post (or wooden peg) marks each photopoint established during or before the first round (refer figure 3) This is referred to as the marker peg
However where the marker has disappeared or deteriorated new markers will consist of some more
permanentvisible materials
Figure 3 Diagram of a typical ldquoQSrdquoPhotopoint Monitoring site
Position the marker peg 10-50 m off the track in a clearly visible location that is not likely to be disturbed
However ensure the area to be monitored is free of vehicle track effects such as water flow stock
movement etc If the marker peg is positioned further than 50 m from the track position another directional
peg near the track and give clear directions on the site sheet to the location of the marker peg or post (ie
Pastoral Lease Assessment Technical Manual for the Second round (2011)
13
bearing and distance from 1st peg) Remember it may be some time before the site is re-visited and the site
is wasted if it can‟t be re-located
A second peg usually a jarrah peg is located approximately 17 paces from the marker peg This is referred to as the sighter peg This peg is positioned such that the photograph area does not include more than 13 skyline
and the bearing will follow the line of the Jessup transect A third peg is placed 100 m from the sighter and used
to mark the end of the Jessup transect Not all sites will have a Jessup transect
Locations of all photopoint sites will be recorded with a GPS from the vehicle and marked on the updated station
paddock plan
The photograph should be taken from the marker peg Record a compass bearing between the marker peg
and sighter peg If other photos are taken from the marker peg the bearing should be marked with an
additional sighter peg
Taking the photograph
Photos are taken with a digital SLR camera and with the zoom set to replicate the original 50mm lens
cameras Photos are taken in RAW format and downloaded daily To take the photograph stand behind the
marker peg and centre on the base of the sighter peg as shown in plate 5 and figure 4 Adjust focus to
infinity to ensure all of the transect is in focus
Plate 3 Taking a photograph
Figure 4 Directions for taking the photograph
Pastoral Lease Assessment Technical Manual for the Second round (2011)
14
RECORDING FIELD INFORMATION
Site description and location
Site sheets and the information collected have changed and evolved over the period of assessment An
example of the current site sheet is shown in appendix 1
Detailed below are the fields of information together with the type of detail that should be recorded Note Completed entry example shown in brackets (italics)
QS OB RS TS Prefix to describe type of photopoint followed by photopoint number
as per the disc (eg QS 2345)
QS - Quantitative site A pegged site used for monitoring vegetation
changes with Jessup andor step-point data (formerly photopoint -
PP)
OB - Observation site A pegged site used as an observation site to
monitor changes that can be detected by a photographic sequence
eg rehabilitation spread of erosion gullies Site description includes
a list of plant species but with no measured plant data collected
RS - Reference site Sites are in areas remote from grazing influence
greater than 5 km from water in sheep country and 8 km in cattle
country Also includes exclosure sites Complete all site description
and plant and soil sheets
TS - Type Site Designated for site characteristic of mapped land
system in early part of baseline assessment process As per OB but
sites were not usually pegged
PC ndash Photo Comparison Should be used strictly where a photo is to
be compared and data collected would not be required eg A
panorama on a hill top where species in the foreground are not
relevant to the background being monitored in a photo
All photopoints should be prefixed with QS OB RS PC or TS
DATE Day Month and Year (eg 01062007)
OBSERVERS Initials of persons involved in data collection Initials of the person
filling out the sheet first followed by second observer (egMTCB)
STATION Pastoral station name Use the full name of the station (eg
Bulgunnia)
PADDOCK Full paddock name may include subscript eg formerly part Cyclone
(Monsoon)
ZONE Grid reference zone generally on the bottom of the map (eg 54)
MAP SHEET Map sheet number 150000 five digits eg 66341 1100000 four
digits eg 5434 (66341)
EASTING amp NORTHING Co-ordinates on GPS Unit
Pastoral Lease Assessment Technical Manual for the Second round (2011)
15
DATUM GDA 94
SERIES Refers to the filing system for photopoint photograph series for the
station indicates the station with the month amp year the photo was
taken First four spaces are for the station (or trip name) abbreviated
to the first four letters eg Bulg for Bulgunnia Next two are digits for the month followed by two digits for the year eg (Bulg 0691)
DIGITAL Image number
WATERPOINT Name of nearest permanent water source by direct route as a sheep
would walk Note type also eg dam trough tank (Moonbi Tank)
DISTANCE (km) Distance (to one decimal point) to water source named above ie by
direct route as a sheep would walk Record the straight-line distance from the GPS (eg 16 km)
CONDITION Condition rating for the site as per condition rating guidelines Refer to
appendix 2 for condition class attributes Notes on attributes in the site comments will help to support this judgement (eg Good)
MUD MAP Diagram of how to relocate the site clearly labelled with distances
Include paddock name and adjacent paddocks track location and
gate zero origin water location site number Orient the map with
north to the top of the page
MUD MAP COMMENTS Clear directions on how to relocate the site completed according to
the following format Keep in mind that this will be printed out for the
lessee
Distance from gate or trough direction on track to next bore or
paddock along fence Place where zero taken from eg tank trough
gate - be specific What type of peg or marker was used and how far it
is off the track and in what direction Distance to sighter peg and
bearing Jessup transect length (normally 100m) and bearing from sighter peg (Use tripmeter if no Halda rally meter or similar)
Example mud map comments (15 km south of Twin Well on track to Gladstone Bore or 35km north
of gate from Dusty paddock Zero at trough Jarrah peg and disc at 15 paces east of track Sighter peg (jarrah) at 17 paces bearing 90deg Jessup transect 100 m x 2 m x 2 at 90deg end marked by jarrah peg)
EROSION Record the severity and type of erosion according to the table in
appendix 4
COMMENTS Record notes that help to further explain observations or that will
assist interpretation of the data for present and future observations
This should include notes to indicate why the site was established and
what it is monitoring It should also include notes that help explain the
condition rating and current impacts or changes including erosion
Data entry Initials of person who entered data on the database and the date of
entry (egCB 5391)
Pastoral Lease Assessment Technical Manual for the Second round (2011)
16
Establishing new sites The site details below are only relevant for new sites set up as part of the second assessmentndash not used for revisits as part of the second round
LAND SYSTEM Land system name taken from land system map (egWeedna)
ROCK TYPE Name of rock type from geological map or rock type identified at site if
geology map incorrect (egred sandstone)
FORMATION Name of rock formation from geological map (egPound Quartzite)
LANDFORM SLOPE Slope of the site measured in degrees by use of clinometer
Do not confuse degrees with (eg2deg)
ELEMENT Landform element of site
1 crest curved in down slope profile and margins at limit of observed
curvature
2 slope considered as planar Note in comments if upper mid or
lower slope
3 flat planar
4 depression may be open or closed
PATTERN Term to describe the landform type eg alluvial plain = ALP See
appendix 3 for abbreviations and descriptions (egALP)
Pastoral Lease Assessment Technical Manual for the Second round (2011)
17
Vegetation
SIGNIFICANT RAIN Yes - data collection following rains that resulted in green ephemeral
response record dates if known of significant falls
No - dry ephemeral growth only
TYPE S (summer) - rain fell between November and March
W (winter) - rain fell between April and October
I (indistinguishable) - cannot tell if resultant green ephemeral growth is
from summer or winter rain events or is a combination of both
VEGETATION SPECIES Effort should be made to record all plant species throughout the site
Recording plant species should be carried out until most species are
recorded (ie until a period of minutes elapses before further species
are not found) Record full species name on the site sheet
If plant species is not known collect a specimen fill out details in the
herbarium collection booklet and include photopoint number and line
number of record on sheet eg 234512 so that this number can be
entered on subsequent site sheets Put the herbarium label with the
specimen in the plant press Keep a list of plants collected and PPline
number so that you can give this number to collected species at other
sites Update the site sheet with the correct species name when it
comes back from the herbarium or identity confirmed
DOM Dominant species This will be used to classify vegetation
associationsgroups
1 visually pre-dominant species forming the tallest stratum CSR
class should exceed 1 (CSR 2-6)
2 if another tallest stratum species is present (co-dominant) it is
selected OR if absent the most abundant understorey species is selected eg Mai sed
3 selected from any stratum usually a lower stratum as an indicator
species (that is a species of known environmental preferences or
of such abundance that it can‟t be ignored) or to distinguish between associations eg Atr ves
4 other conspicuous species to separate associations eg Scl obl
GRAZED If a plant is obviously grazed tick the box If grazing is mainly by
rabbits or goats this should be noted in the comments
RESPROUT If the plant has previously been grazed back and is now showing fresh
new growth tick the box Note extent in comments eg Atr ves adults
showing abundant new growth following recent rains
RECRUITMENT If seedlings are evident or new suckers (eg Bullock bush) tick the
box Note height of seedlings in comments eg Mai sed seedlings to
5 cm abundant in open areas
FRUIT If the plant is in fruit tick the box This will enable data collection on
best times for seed collection Record relevant notes in comments
Pastoral Lease Assessment Technical Manual for the Second round (2011)
18
Crown Separation Ratio (CSR) The average distance between crowns divided by the average size of
the crown grouped into various size classes (see appendix 5)
1 present lt 12 plants in 200 m radii
2 isolated clumps gt20 CSR clumps of two to five woody plants 200
m further apart
3 isolated plants gt20 CSR trees gt100 m apart
4 very sparse 6-20 CSR crowns well separated
5 sparse 1-5 CSR crowns clearly separated
6 mid dense 0-09 CSR crowns touching to slightly separated
7 closed or dense crowns touching to over lapping
JESSUP Refers to the results of the Jessup transect (see section 81
for more details)
See appendix 6 for Jessup transect recording sheet Record total
counts from the Jessup transect field sheet for each species adult
and juvenile
FIRE SCARS Yes - fire scars evident on stumps trees or fence posts Fire scars
should be recorded if fire occurred since the first assessment
No - no fire scars visible
Last burn - date of last known fire Check with the lessee and record
further details in the comments eg fierce summer fire burnt out NW
corner killing all mulga
Pastoral Lease Assessment Technical Manual for the Second round (2011)
19
Vertebrates
VERTEBRATES Presentabsent for dung tracks browsed vegetation burrows
throughout the site
It is only necessary to record current or fresh activity and record as
presence (P) Old or past activity should be noted in the comments
Table 1 Vertebrate pests
Animal Sighted Dung Tracks Browse BurrowsCamp
Rabbit visual sighting fresh buck
heaps
scratchings
present
graze line with chisel
marks on stems
warren heaps
marks
warren active
Sheep visual sighting fresh dung
active padding recent grazing camps
Cattle visual sighting fresh dung active padding recent grazing camps
Goats visual sighting fresh dung active padding browse shrubs
Note in comments
height of browse line
camps
Roos visual sighting fresh dung active padding recent grazing
(check for tail drag)
camphollows
other
Others include fox cat dingo camel horse wombat etc
Note any other useful information in the general comments for example mob of 200 goats sighted More
detailed comments can be included if needed in the paddock description
Pastoral Lease Assessment Technical Manual for the Second round (2011)
20
DENSITY MEASUREMENT OF PERENNIAL PLANT SPECIES
Perennial plants provide stability to grazing management systems due to their ability to persist during dry
periods consequently the measurement of plant attributes such as density and frequency of perennials
particularly those which are palatable are important in understanding plant dynamics and rangeland condition
Plant counts within fixed belt transects have been used to determine the density of shrubs and repeated
measurements allows density changes to be detected To ensure that observer error is minimised it is vital that
the same technique and standards are used in repeat measurements Modifications made in 1990 enabled
changes to be isolated to discreet quadrats and recruitment and deaths of cohorts can be followed
Jessup transect
This method incorporates a belt transect (a standard ecological technique) that is based on an original
survey technique used for chenopod shrublands by Jessup (1951) and further developed by Lay (1979)
Their technique involved driving a vehicle over a site for a set distance and shrubs occurring within the wheel
marks (representing the belt transect) were recorded This rather destructive technique is now simulated by
a fixed 4 m x 100 m transect and enables a density and frequency estimate of perennials for each site The
frequency estimates are not based on the optimum quadrat size for all species and the 10 m x 2 m quadrats
used should not be taken to represent true frequency readings It should also be noted that species
composition by frequency is not equivalent to composition by cover or density The length of some early
transects has varied from the current standard so ensure that any future comparisons use the same transect
configuration (see 821below)
The Jessup transect method measures the density (shrubsarea) and frequency of perennial plants at sites
where perennial cover occurs ie chenopods other shrubs and tussock (perennial) grasses Counting age
classes of shrubs (adultjuvenile) gives further information on population changes Monitoring over time
provides an indication of recruitment trends
Recording is based on all perennial shrubs within the transect being recorded by species and age class
(adultjuvenile) If the base of the plant is in the transect it is counted If the foliage only is in the transect it is
not counted
Transect layout
Jessup transects are permanently marked and comprise
transects 100 m x 2 m x 2 (see figure 5)
recordings separated into 10 m x 2 m blocks
identification of perennial plant species
less than 10 cm high andor non woody base = juvenile
more than 20 individual juvenile bushes or perennial grasses per 10 m x 2 m block = 20+ recording
1 Transects should include only one land unit and preferably be restricted to one element for data
analysis Transects are 100m long and generally at right angles to the track Walk the length of the
transect to ensure it is suitable before setting up the site and identify and discuss species present
with the other observers
2 Record a compass bearing for the transect
3 Secure a surveyors tape (marked into 10 m segments) to the sighter peg and lay out the tape to 100
m keeping the marker and sighter pegs in line
4 Check that the tape is in line with the sighter and marker peg Tension the tape and drive in the peg at the 100 m mark and secure tape to the peg It is important to have the tape extended to full
100m and tight and straight so that data is replicated at the quadrat level
Pastoral Lease Assessment Technical Manual for the Second round (2011)
21
5 If the transect layout is normal note this on the sheet if different note the transect layout on the site
description sheet and orient diagram with north to the top of the page Give clear legible directions
and bearings
Figure 5 Jessup transect layout
Recording a Jessup transect
1 Use a surveyors tape that is clearly marked into 10 m intervals If it is marked with tape check that
this has not slipped from the 10 m graduations Counts should be recorded on a Jessup transect
data sheet (see appendix 6)
2 Commence transect on left side of tape (UP) using 2 m rod (refer plate below) Check that the rod is
2 m A two metre curtain pole is ideal for this
Plate 4 Recording a Jessup transect
3 Identify each perennial species If in doubt collect a specimen
4 Easiest operation is with one person observing (counting) and another recording and acting as a
checking observer The recorder (scribe) stands at the 10 m marker intervals and the observer calls
out the adultjuvenile strikes along each 10 m transect interval The recorder can assist by spotting
hidden plants and small juvenile plants
5 For plants on quadrat margins include only in the quadrat where the rooted stem is located Count
plants only if they are more than 50 rooted within the quadrat
6 Chenopods occur in clumps and it is difficult to distinguish individuals for this reason clumps are
recorded and are recognised as individual clumps if there is more than a 30 cm gap between the
rooted stems Criteria for counting plants growing close together are as follows
End peg Sighter peg Site marker amp disc
11 12 13 14 15 16 17 18 19 20
10 9 8 7 6 5 4 3 2 1
100 m
4 m
Pastoral Lease Assessment Technical Manual for the Second round (2011)
22
distinguish between individual clumps if there is more than a 30 cm gap between rooted stems
if crowns are distinct and bases are less than 30 cm apart count each as an individual
if crowns are touching or overlapping and gap between rooted stems is less than 30 cm count
as one clump
Note In cases of perennial plants such as low bluebush being grazed the reduction of the crown
may lead to higher count of bush numbers Care is required when comparing existing Jessup counts
and noted should be recorded if this type of splitting has occurred
7 Record juveniles as plants less than 10 cm high or wide and not woody However if obviously old
woody plants are grazed back to less then this size record as adults but make comment
accordingly
If greater than 20 juvenile individuals of any species encountered in 10m interval (quadrat) record as
20+ This avoids attempting to count up to 200 seedlings but still provides sufficient data to interpret
that recruitment is occurring Large numbers of seedlings can occur following favourable conditions
and it becomes difficult to count all of these However where feasible a total count of juveniles
should be undertaken
8 For perennial grasses record clumps if greater than 10 cm high or 10 cm wide ie no juvenile
categories Record count as 20 + if greater than 20 individuals within one 10 m x 2 m block This is
to aid interpretation of step-point cover data eg low density but high cover implies large spreading
individuals high density but low cover may imply a grazing effect - site comments should indicate
this The quadrat sizes are not well suited to grasses but do provide an indication of the level of
grasses within a shrubland
9 Do not record dead or completely defoliated bushes but note occurrence in comments
10 Proceed to end of transect and commence quadrats 11-20 (ie 100-0m) on other side of tape
(down)
11 Record minor site variations in comments relating to quadrat intervals eg 20-30m large scaled area
Pastoral Lease Assessment Technical Manual for the Second round (2011)
23
DATABASE AND GIS ndash needs update for ALIS and FDE
Site information is currently entered into the Arid Lands Information System (ALIS) and print-outs and
photographs are supplied to the lessee for every photopoint on the station in the form of a Photopoint
Manual
In 1991 the Geographic Analysis and Research Unit (GAR) of the Department of Housing and Urban
Development has been assisting the Pastoral Management Branch in the establishment and maintenance of
a Pastoral Geographic Information System (Malcolm and Nicolson 1995) The GAR unit operates a
centralised ARCINFO (Environmental Systems Research Institute USA) GIS facility and is the
Environmental Node of South Australia‟s Land Information System
Extensive development was carried out on ALIS and while operational is still undergoing some further
development Management of this system is though Client Services in DENR in collaboration with the
Pastoral Program Development of a system for field data entry onto GETEC tablets has been completed
and is undergoing transition into the operational phase This will improve data collection with validation in the
field and also allow considerable time saving and possible transposition errors removing one stage in the
data entry process
Lease infrastructure information is derived from a number of sources that vary in age scale and accuracy
During the assessment process topographic maps are used as a base map and information is checked
corrected of altered using various techniques Prior to the introduction of Global Positioning Systems (GPS)
in 1992 the information was collected using bearing and distance measurement that were plotted onto base
maps The improved accuracy of GPS units over time has allowed increased accuracy and therefore an
improved mapping product
Lease maps and land system maps are available as hard copy products Watered areas for each paddock
can also be produced that indicate the extent that the lease is utilised by stock Undisturbed areas represent
quality wildlife habitats and further investigations are required to study the relationships between stocking
intensity land condition and wildlife habitat More detailed information can be found in Malcolm and
Nicolson (1995)
POST TRIP PROCEEDURE
The following checklist should be completed after each trip
Download photos and GPS co-ordinates
Data entry
Update photopoint manual and make 2 copies
Conduct LCI peer review
All spatial updates sent to GIS DWLBC
Write draft Assessment report
Submit for review
Pastoral Lease Assessment Technical Manual for the Second round (2011)
CONDITION CLASS
ATTRIBUTE EXCELLENT GOOD FAIR POOR VERY POOR
PLANT SPECIES
COMPOSITION
maximum diversity of
annual and perennial
species possible for the
land type
perennial species of
various ages
some reduction in density
of palatable and
susceptible perennials
increased proportion of
shorter lived species
perennial species of
various ages
significantly reduced
cover density andor
regeneration of
palatable species
establishment of less
preferred or
unpalatable species
dominance of annual and
ephemeral species and
perennials with relatively
low palatability
no regeneration of
desirable perennial
species existing stands
degenerate
seasonal cover of
only pioneer
ephemerals or
unpalatable weeds
large areas totally
unproductive
PLANT
PRODUCTIVITY
at full potential
sustained productivity
annual com unities
maintain litter cover but
not production in dry
seasons
some fluctuation lower in
drought and may be
higher than site potential
for some species eg
Mitchell grass
reduced overall high
productivity in good
season
low in drought
(fluctuates markedly
with season)
impaired productivity
very seasonally
dependant low or non
existent in dry seasons
areas incapable of
any plant growth
SOIL EROSION
STATUS
no erosion (other than
natural features or
processes)
plant and litter cover
protect soil from wind
and water in all
seasons
minor or slight erosion
evident
increased susceptibility of
soils to erosion in dry
seasons
moderate erosion
evident
reduced density and
cover of perennial and
litter increases
susceptibility of soils to
erosion in most
seasons
severe erosion overall
high susceptibility of soils
to erosion in all seasons
extent of past erosion
renders site susceptible
to further soil movement
if grazed at any level
unstable severely
or very eroded
Pastoral Lease Assessment Technical Manual for the Second round (2011)
Appendix 1 Erosion severitytype intensity criteria ndashfor reference to first round data sheets
EROSION SeverityType intensity criteria + RATING (max 200 m radius)
NO ACCELERATED EROSION 00
SLIGHT EROSION (10 of site affected)
slight accumulation of wind blown soil and plant bases and other obstacles 11
removal of finer soil particles evident but soil crust is largely intact 12
occasional rills (lt300 mm deep) evident 13
no gullies present 14
a few scalds present usually less than 2 m in diameter 15
MINOR EROSION (10-25 of site affected)
accumulation of soil around plant bases with plant mounds noticeably enlarged 21
evidence of pedestalling but soil loss minor and plant bases not greatly elevated 22
breaking of surface crust with small erosion faces and some redistribution of soil and
or some rilling evident 23
occasional shallow gullies only 24
scalding evident but scalds relatively small and discontinuous 25
MODERATE EROSION (25-50 of site affected)
wind piling around plant bases and other obstacles is common but no plants completely covered 31
pedestalling apparent with plant bases distinctly raised and with obvious
soil loss and deflation in parts 32
surface sheeting andor rilling common with erosion faces (andor micro-
terracing) and active redistribution of soil 33
gullying present on parts of the site 34
numerous small scalds common andor with a tendency to coalesce to form larger scalds in parts 35
SEVERE EROSION (50-75 of site affected)
extreme hummocking around plants and other obstacles some plants completely covered 41
severe pedestalling with plant bases greatly elevated and major soil loss
from deflation andor much of surface generally unstable with ripple marks 42
major rilling or surface sheeting with extensive exposure of subsoil or parent material
erosion faces (andor microterracing) and active redistribution of soil 43
widespread gullying 44
scalding extensive smaller scalds have coalesced to form large more or
less continuous scalded areas 45
EXTREME EROSION (75-100 of site affected)
general surface movement area more or less bare with formation of shifting dunes 51
most of original land surface altered any last remnants of original soil or
vegetation standing as sentinels in a barren landscape 52
water sheeting andor rilling coalesced to expose subsoil or parent material 53
extensive gullying 54
scalding more or less continuous over large areas 55
Note Record severity first and then type eg 53 = Extreme erosionScalding
Pastoral Lease Assessment Technical Manual for the Second round (2011)
Appendix 2 Crown Separation Ratio
This is a visual estimate of plant cover
It is the average distance between crowns (the area the plant takes up if viewed from above) divided by the
average size of the crown In the field this means visualising how many crowns of a given plant species can be fitted in between the distance to the nearest neighbour of that species on average over the site The
classes are as follows
CLASS TERM CSR FIELD CRITERIA
1 Present lt 12 plants lt12 plants within 200 m radius
2 Isolated clumps gt20 spaces Isolated clumps of two to five woody plants 200 m
further apart
3 Isolated Plants gt20 spaces Isolated plants
4 Very Sparse 6-20 spaces well spaced crowns well separated
5 Sparse 1-5 spaces clearly spaced crowns clearly separated
6 Mid dense 0-09 spaces crowns touching to slight separation
7 Closed or dense 0 crowns touching to overlapping
Modified from Table 14 McDonald (1990)
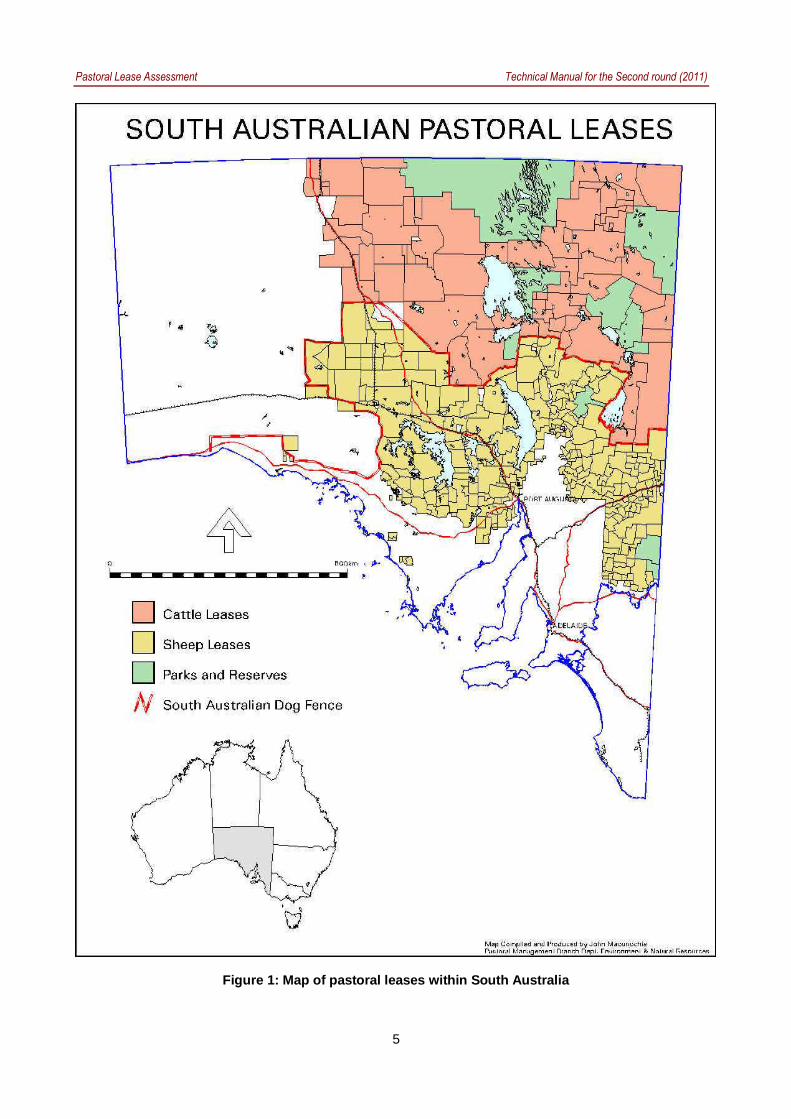
Pastoral Lease Assessment Technical Manual for the Second round (2011)
6
PREPARATION FOR AN ASSESSMENT TRIP
The following check list should be completed prior to each trip Contact lesseemanager To arrange a time and location to meet at the beginning of the field trip (Act states 28 days notice) Discuss potential accommodation availability of fuel (if required) Collect property information Copy of first assessment report from Pastoral Land Management Group (PLMG) Adelaide Paddock write-ups site revisit and pastoral inspection sheets from ALIS Blank sheets for new photopoints and upload Getacs (ALIS) Blank Jessup sheets LCI transect measure of distance and list of stops generated Map updates Photopoint manual Recent stock return and past inspection reports Property docket (optional for extra information) Land system and paddock plan maps Photopoint Equipment
100 m surveyor tape with clearly visible and fixed 10 m markers and ties both ends
sledge hammer
2 m measuring rod
jarrah pegs poly posts rebar or other markers Photopointcamera box with
numbered photopoint discs
nails for securing disc to marker peg
site description and species list sheets
Jessup transect recording sheet
digital camera all batteries charged
sighting compass
hand counters (at least 2)
inclinometer Other equipment Clipboards and elastic bands Pencils and sharpener Reference books eg plant books Charged computerGetac for GPS data Hand held GPS cleared of data from previous trips Inverter checked Water tanks filled Ropes Plastic bags Cooking kit Food Fridge
MEETING WITH LESSEESMANAGERS
First Meeting
Explain the assessment process answer any questions and invite them to participate Discuss Infrastructure changes Seasonal conditions eg rainfall fire Problem areasissues Future plans General management including paddock use changes to management feral animal numbers and
kangaroo numbers
Pastoral Lease Assessment Technical Manual for the Second round (2011)
7
Availability of station facilities eg shearers quarters places to camp places to avoid Radio frequency to contact them Photopoints updated eg have they been taking photos do they have a Photopoint manual
Final Meeting
Cross reference map items and do final check that everything has been up dated Discuss
Problem areas get their perspective and plans they have to address problems
Make sure they are aware of negative comments likely to be in the report giving them the opportunity to discuss
Next stage of the process and give them contact details of who they can speak to
Get their preferred contact details eg email phone etc
DESCRIPTION OF METHODOLOGY USED IN THE BASELINE ASSESSMENTS
Land system mapping
This involved identifying landscape patterns on remotely sensed images and describing the units that make up
this pattern in the field Land System boundaries were digitised and transferred to ARCINFO to form a graphical
base for a GIS Land systems descriptions and boundaries are checked during the assessment process A
coloured land system map for each station accompanies the lease assessment report
Lease infrastructure
During the assessment process the layout of the lease is discussed with the Pastoralist and any changes
such as new water point fence line or track developments that are not included on existing maps are noted
These details are then checked in the field and accurately located using a Global Positioning Unit (GPS) and
use of Getac Amendments are then made to the digitised files to update the paddock plans (see figure 2)
and the GIS
Waypoints of features and tracking of line features for updating of mapping products will be made by the field assessors in the second round this includes both new and existing infrastructure not previously captured
Pastoral Lease Assessment Technical Manual for the Second round (2011)
8
Figure 2 Station paddock plan
Monitoring
A monitoring baseline has been established in each paddock This consists of a photopoint and a plant
species list with associated data Fixed belt transects have been used to collect ecological data This is
compiled into a ldquophotopoint manualrdquo and the lessee is given a copy and encouraged to photographically
monitor the sites These sites are usually located on water runs to enable the Pastoralist to inspect the sites
on a regular basis It was planned these sites would be re-measured by the Pastoral Management Branch
every 5-7 years (depending on resources) but in reality only sites in ldquopriority paddocksrdquo have been revisited
at this order of frequency
All previously-established photopoints which can be re-located will be revisited and re-measured Every attempt should be made to relocate photopoints but if not possible new sites will be installed
Plate 1 Pastoralist involvement in the assessment process
Paddock condition
The assessment process also describes the condition of each paddock within a lease and identifies any land
management issues that require attention This information is entered into the database so that a history for
each paddock within a district is developed
Paddocks that require immediate attention or action are detailed in the assessment report for the Board
These ldquopriority paddocksrdquo are inspected on a more regular basis and the lessee must make progress
towards rectifying the identified land management problems ldquoMonitor paddocksrdquo are identified where less
immediate attention is required or where issues should be monitored by lessees and the PLMG
Lease Assessment Reports
A lease Assessment Report is the formal document that provides details of the assessment of the land
condition over the ldquorunrdquo These reports are forwarded to the lessees who have 60 days to consider and
comment The Board then considers all comments and accepts the report
On completion of a district and all LCI scores analysed the Board will set the land management conditions of
the lease which includes a maximum stocking level The lessee may apply to the Pastoral Board at any time
for a temporary increase above this maximum Land management conditions may be adjusted and the term
of the lease extended if the lessee has complied with the lease conditions and fulfilled a duty to improve the
condition of the land
Pastoral Lease Assessment Technical Manual for the Second round (2011)
9
The report provides pastoralists or other land managers with information to ensure sound land management
practices are followed These reports provide details of a monitoring system that will supply the land user
with reliable interpretable and repeatable information to detect changes that result from land use practices
(rangeland condition and trend)
Capacity of the land to carry stock
The Pastoral Board is required to specify a maximum stocking level for the lease and the lessee is not
permitted to exceed this figure without the prior permission of the Board Stock maxima determined under
the previous Act (Pastoral Act 1936) did not include an assessment of the condition of the land and were
often set at inappropriate levels The previous maximum figure has long been represented by the pastoral
industry as the actual carrying capacity of the lease
The Objects of the Act specify that the Pastoral Board must ensure that degradation does not or is not likely
to occur Maximum stocking levels for a lease are far from ideal as an effective method for ensuring that
pastoral land is not degraded as they do not provide for stocking levels in individual paddocks under a range
of condition classes and pasture components
Plate 2 Fenceline contrast resulting from different management practices
The evidence for appropriate long term stocking levels must come primarily from-
what the land has carried in the past without severe degradation
what successful management practices have been implemented for various pasture types
how management practices generally are related to the present land condition
For the first round of assessments the Board determined that the most recent 10 year stocking average
(which includes a range of seasonal conditions) plus 20 allowance for good seasons would provide the
basis of the maximum lease offer This had the effect of bringing a number of leases with unrealistic previous
maximums to a more realistic figure The Board has reviewed its approach (and policy) on the setting of stocking limits for round two however it acknowledges that lease stocking maxima are at best a ldquoblunt instrumentrdquo for use in managing land resources Short-term adjustment of paddock stock numbers appropriate for conditions is the most effective tool but a maximum provides a statutory limit and guide to numbers likely to be able to be carried in the best seasons The current method uses a combination of LCI results paddock condition ratings area and watered area The Board considers that a better way of setting stock maximum would be to do so based on the capability of each land type within its watered area However the current inventory of these resources is not accurate to the level required and steps are being taken to work towards the future use of such a method
Pastoral Lease Assessment Technical Manual for the Second round (2011)
10
LAND CONDITION INDEX
The land condition assessment of the various pasture types involves defining what constitutes an intact or
un-degraded landscape and deciding on the criteria that indicates to what degree disturbance has occurred
The PLMC Acts emphasis on indigenous plant species largely determines an on-ground approach as it is
necessary to ascertain the mix of plant species It is also important to determine if seedlings are present as
this helps to indicate whether the land has a capacity to rehabilitate in cases of past damage It is for this
reason that remote sensing techniques may not be appropriate to determine land condition in most parts of
the sheep pastoral areas according to the Act
The following processes were used in training and calibration for these assessments during the first round of
assessments
The process of land condition assessment involves a preliminary reconnaissance survey by senior scientific
officers to determine pasture types and condition criteria This is followed by a training period for field staff to
become fully competent in using these criteria in assessing the various land condition states
The purpose of this reconnaissance survey by senior officers is to
identify the various pasture types and the sub-units called pasture components that make up these
pasture types within the district
determine the criteria that will be used to identify three condition classes within each pasture
component
Only three land condition classes (1 = poor 2 = fair and 3 = good) are described as this limits the number of
choices and therefore reduces possible observer errors To avoid the influence of seasonal changes and
drought the criteria are based primarily on perennial vegetation components with erosion levels included where
applicable The issue of so-called opportunity country involving only ephemeral growth is dealt with separately
Each condition class for each pasture component is described according to key indicator plants
Photographs and written criteria are compiled that depict each of the three condition classes for each of the
pasture components The criteria and photo-standards are compiled into manuals which are subsequently
used by the assessment officers in carrying out the lease assessments
Field staff are trained in the field to recognise the various condition classes for each of the pasture
components to achieve a uniform standard and tested thereby ensuring that all staff will assess the
condition of land uniformly and without bias
Analysis of changes from round 1 to 2 on any particular station occurs and also changes on a station
comparative to the average change of each pasture type in a district
PHOTOPOINTS
Monitoring the condition and trend of land under various grazing practices is an important on-going
management tool Photopoints are established in most paddocks to provide an indication of these trends
Revisiting these sites enables the development of a photographic sequence supplemented by vegetation
and soil information to provide an objective record of change at a site The photopoint is a sample of land
condtion in a particular paddock where located in a typical area This objective data is used to support
subjective judgements on condition in a paddock and a station overall A photopoint can also be set up in
atypical areas to monitor a specific issue
The Pastoral Land Management group will carry out regular long term monitoring of these sites However it
is important that short-term seasonal changes are also recorded if possible Pastoralists are encouraged to
regularly monitor the photopoints and have been involved in the initial establishment of the sites During this
Pastoral Lease Assessment Technical Manual for the Second round (2011)
11
process the assessment techniques can be demonstrated and the photopoint method explained to ensure
the pastoralist is able to carry on with subsequent monitoring if he or she desires
Through combining short term and long-term records our understanding of ecosystems may be improved
and future grazing practices can be adapted to suit these trends Stock records for each paddock together
with climatic information observations of grazing on desirable plants germination events and other factors
will provide a valuable record that will assist in future decision making regarding the objectives of sustainable
use
Changes in the soil and vegetation components may follow
a fire
extreme seasons wet or dry
a marked change in vegetation cover
defoliation of chenopod shrubs (saltbush or bluebush)
establishment of new shrub seedlings
death of shrubs or trees
invasion by unpalatable plants
Access and relocation of existing photopoints (finding the site)
Sites are generally placed alongside station tracks for ease of relocation If a site is located on a now-unused track then be sure to note how to find the turn-off and any other important features The photopoint peg or post should in open country be visible from the track although it is desirable to place it far enough off the track to reduce the chance of it being driven over or destroyed by road maintenance or minor realignment Experience has shown that sites placed 10-50 metres from the track provide the best chance of not being damaged or rendered useless from road effects while still being easily accessible for revisits Careful recording of the GPS and distances is essential and will assist future assessors Use of hills and other features in a photo may assist in relocation
New Photopoints
Choosing the location for a new photopoint
The photopoint location will depend on the major objective for setting it up
To encourage pastoralists to monitor the sites they need to be easily locatable Record the distance from a
permanent feature eg gate or trough and if possible record the distance from the opposite direction Use
the GPS to capture co-ordinates for the site
The following factors should be considered when choosing a site particularly when monitoring grazing
impact
Distance from water
Grazing intensity of domestic stock decreases with distance from the permanent water source Choosing sites at a consistent distance from water allows for more effective comparison between sites Assessment sites for sheep stations are generally placed about 15 km from permanent water but more importantly should monitor areas where indicator species are still present or be expected to occur In cattle areas the site may be between 2-4 km from water Where an acceptable site does not occur at the desired distance personal judgement must be used in choosing the best location taking the above factors into consideration This may involve locating the site further or a little closer to the watering point or simply abandoning the attempt to locate a site out from that particular water (especially if another track or water in the paddock is also monitored)
Representation of a land unit
If establishing a new site in a paddock which does not have any existing sites this site should be located within a recognisable land unit that is typical of the paddock For example do not choose an isolated
Pastoral Lease Assessment Technical Manual for the Second round (2011)
12
bluebush patch if it is not typical of the paddock Avoid vegetation patches that are obviously atypical or are small areas of transition between communities The unit chosen must also be one that gives a good indication of grazing impact For example do not place a site in a very stable resilient vegetation type if the majority of the paddock or areas preferred by stock are much less resilient
Size and uniformity
The site should be uniform with respect to vegetation soil slope and aspect The more extensive the area of the site the better While a site might take observations of a radius of 200m an area of 100m radius should be considered a minimum but all observations must be made within uniform land typeunit Disturbed areas such as roadsides must not be considered
Other influencing factors
Other factors likely to bias or influence the site vegetation should be recognised and avoided where possible Avoid placing sites in the following situations
on a southern fence since sheep tend to graze into the wind and in most sheep - pastoral areas of SA the prevailing wind is from the south
sheep camp areas or where animals walk parallel to the track resulting in heavily tracking
mechanically disturbed areas
water run-on areas from tracks or where old track marks or erosion is evident
Photopoint setup
Directions to each photopoint should comprise a distance and direction from a known point such as a water
point A metal numbered disc on a polydropper fibreglass or steel rebar post (or wooden peg) marks each photopoint established during or before the first round (refer figure 3) This is referred to as the marker peg
However where the marker has disappeared or deteriorated new markers will consist of some more
permanentvisible materials
Figure 3 Diagram of a typical ldquoQSrdquoPhotopoint Monitoring site
Position the marker peg 10-50 m off the track in a clearly visible location that is not likely to be disturbed
However ensure the area to be monitored is free of vehicle track effects such as water flow stock
movement etc If the marker peg is positioned further than 50 m from the track position another directional
peg near the track and give clear directions on the site sheet to the location of the marker peg or post (ie
Pastoral Lease Assessment Technical Manual for the Second round (2011)
13
bearing and distance from 1st peg) Remember it may be some time before the site is re-visited and the site
is wasted if it can‟t be re-located
A second peg usually a jarrah peg is located approximately 17 paces from the marker peg This is referred to as the sighter peg This peg is positioned such that the photograph area does not include more than 13 skyline
and the bearing will follow the line of the Jessup transect A third peg is placed 100 m from the sighter and used
to mark the end of the Jessup transect Not all sites will have a Jessup transect
Locations of all photopoint sites will be recorded with a GPS from the vehicle and marked on the updated station
paddock plan
The photograph should be taken from the marker peg Record a compass bearing between the marker peg
and sighter peg If other photos are taken from the marker peg the bearing should be marked with an
additional sighter peg
Taking the photograph
Photos are taken with a digital SLR camera and with the zoom set to replicate the original 50mm lens
cameras Photos are taken in RAW format and downloaded daily To take the photograph stand behind the
marker peg and centre on the base of the sighter peg as shown in plate 5 and figure 4 Adjust focus to
infinity to ensure all of the transect is in focus
Plate 3 Taking a photograph
Figure 4 Directions for taking the photograph
Pastoral Lease Assessment Technical Manual for the Second round (2011)
14
RECORDING FIELD INFORMATION
Site description and location
Site sheets and the information collected have changed and evolved over the period of assessment An
example of the current site sheet is shown in appendix 1
Detailed below are the fields of information together with the type of detail that should be recorded Note Completed entry example shown in brackets (italics)
QS OB RS TS Prefix to describe type of photopoint followed by photopoint number
as per the disc (eg QS 2345)
QS - Quantitative site A pegged site used for monitoring vegetation
changes with Jessup andor step-point data (formerly photopoint -
PP)
OB - Observation site A pegged site used as an observation site to
monitor changes that can be detected by a photographic sequence
eg rehabilitation spread of erosion gullies Site description includes
a list of plant species but with no measured plant data collected
RS - Reference site Sites are in areas remote from grazing influence
greater than 5 km from water in sheep country and 8 km in cattle
country Also includes exclosure sites Complete all site description
and plant and soil sheets
TS - Type Site Designated for site characteristic of mapped land
system in early part of baseline assessment process As per OB but
sites were not usually pegged
PC ndash Photo Comparison Should be used strictly where a photo is to
be compared and data collected would not be required eg A
panorama on a hill top where species in the foreground are not
relevant to the background being monitored in a photo
All photopoints should be prefixed with QS OB RS PC or TS
DATE Day Month and Year (eg 01062007)
OBSERVERS Initials of persons involved in data collection Initials of the person
filling out the sheet first followed by second observer (egMTCB)
STATION Pastoral station name Use the full name of the station (eg
Bulgunnia)
PADDOCK Full paddock name may include subscript eg formerly part Cyclone
(Monsoon)
ZONE Grid reference zone generally on the bottom of the map (eg 54)
MAP SHEET Map sheet number 150000 five digits eg 66341 1100000 four
digits eg 5434 (66341)
EASTING amp NORTHING Co-ordinates on GPS Unit
Pastoral Lease Assessment Technical Manual for the Second round (2011)
15
DATUM GDA 94
SERIES Refers to the filing system for photopoint photograph series for the
station indicates the station with the month amp year the photo was
taken First four spaces are for the station (or trip name) abbreviated
to the first four letters eg Bulg for Bulgunnia Next two are digits for the month followed by two digits for the year eg (Bulg 0691)
DIGITAL Image number
WATERPOINT Name of nearest permanent water source by direct route as a sheep
would walk Note type also eg dam trough tank (Moonbi Tank)
DISTANCE (km) Distance (to one decimal point) to water source named above ie by
direct route as a sheep would walk Record the straight-line distance from the GPS (eg 16 km)
CONDITION Condition rating for the site as per condition rating guidelines Refer to
appendix 2 for condition class attributes Notes on attributes in the site comments will help to support this judgement (eg Good)
MUD MAP Diagram of how to relocate the site clearly labelled with distances
Include paddock name and adjacent paddocks track location and
gate zero origin water location site number Orient the map with
north to the top of the page
MUD MAP COMMENTS Clear directions on how to relocate the site completed according to
the following format Keep in mind that this will be printed out for the
lessee
Distance from gate or trough direction on track to next bore or
paddock along fence Place where zero taken from eg tank trough
gate - be specific What type of peg or marker was used and how far it
is off the track and in what direction Distance to sighter peg and
bearing Jessup transect length (normally 100m) and bearing from sighter peg (Use tripmeter if no Halda rally meter or similar)
Example mud map comments (15 km south of Twin Well on track to Gladstone Bore or 35km north
of gate from Dusty paddock Zero at trough Jarrah peg and disc at 15 paces east of track Sighter peg (jarrah) at 17 paces bearing 90deg Jessup transect 100 m x 2 m x 2 at 90deg end marked by jarrah peg)
EROSION Record the severity and type of erosion according to the table in
appendix 4
COMMENTS Record notes that help to further explain observations or that will
assist interpretation of the data for present and future observations
This should include notes to indicate why the site was established and
what it is monitoring It should also include notes that help explain the
condition rating and current impacts or changes including erosion
Data entry Initials of person who entered data on the database and the date of
entry (egCB 5391)
Pastoral Lease Assessment Technical Manual for the Second round (2011)
16
Establishing new sites The site details below are only relevant for new sites set up as part of the second assessmentndash not used for revisits as part of the second round
LAND SYSTEM Land system name taken from land system map (egWeedna)
ROCK TYPE Name of rock type from geological map or rock type identified at site if
geology map incorrect (egred sandstone)
FORMATION Name of rock formation from geological map (egPound Quartzite)
LANDFORM SLOPE Slope of the site measured in degrees by use of clinometer
Do not confuse degrees with (eg2deg)
ELEMENT Landform element of site
1 crest curved in down slope profile and margins at limit of observed
curvature
2 slope considered as planar Note in comments if upper mid or
lower slope
3 flat planar
4 depression may be open or closed
PATTERN Term to describe the landform type eg alluvial plain = ALP See
appendix 3 for abbreviations and descriptions (egALP)
Pastoral Lease Assessment Technical Manual for the Second round (2011)
17
Vegetation
SIGNIFICANT RAIN Yes - data collection following rains that resulted in green ephemeral
response record dates if known of significant falls
No - dry ephemeral growth only
TYPE S (summer) - rain fell between November and March
W (winter) - rain fell between April and October
I (indistinguishable) - cannot tell if resultant green ephemeral growth is
from summer or winter rain events or is a combination of both
VEGETATION SPECIES Effort should be made to record all plant species throughout the site
Recording plant species should be carried out until most species are
recorded (ie until a period of minutes elapses before further species
are not found) Record full species name on the site sheet
If plant species is not known collect a specimen fill out details in the
herbarium collection booklet and include photopoint number and line
number of record on sheet eg 234512 so that this number can be
entered on subsequent site sheets Put the herbarium label with the
specimen in the plant press Keep a list of plants collected and PPline
number so that you can give this number to collected species at other
sites Update the site sheet with the correct species name when it
comes back from the herbarium or identity confirmed
DOM Dominant species This will be used to classify vegetation
associationsgroups
1 visually pre-dominant species forming the tallest stratum CSR
class should exceed 1 (CSR 2-6)
2 if another tallest stratum species is present (co-dominant) it is
selected OR if absent the most abundant understorey species is selected eg Mai sed
3 selected from any stratum usually a lower stratum as an indicator
species (that is a species of known environmental preferences or
of such abundance that it can‟t be ignored) or to distinguish between associations eg Atr ves
4 other conspicuous species to separate associations eg Scl obl
GRAZED If a plant is obviously grazed tick the box If grazing is mainly by
rabbits or goats this should be noted in the comments
RESPROUT If the plant has previously been grazed back and is now showing fresh
new growth tick the box Note extent in comments eg Atr ves adults
showing abundant new growth following recent rains
RECRUITMENT If seedlings are evident or new suckers (eg Bullock bush) tick the
box Note height of seedlings in comments eg Mai sed seedlings to
5 cm abundant in open areas
FRUIT If the plant is in fruit tick the box This will enable data collection on
best times for seed collection Record relevant notes in comments
Pastoral Lease Assessment Technical Manual for the Second round (2011)
18
Crown Separation Ratio (CSR) The average distance between crowns divided by the average size of
the crown grouped into various size classes (see appendix 5)
1 present lt 12 plants in 200 m radii
2 isolated clumps gt20 CSR clumps of two to five woody plants 200
m further apart
3 isolated plants gt20 CSR trees gt100 m apart
4 very sparse 6-20 CSR crowns well separated
5 sparse 1-5 CSR crowns clearly separated
6 mid dense 0-09 CSR crowns touching to slightly separated
7 closed or dense crowns touching to over lapping
JESSUP Refers to the results of the Jessup transect (see section 81
for more details)
See appendix 6 for Jessup transect recording sheet Record total
counts from the Jessup transect field sheet for each species adult
and juvenile
FIRE SCARS Yes - fire scars evident on stumps trees or fence posts Fire scars
should be recorded if fire occurred since the first assessment
No - no fire scars visible
Last burn - date of last known fire Check with the lessee and record
further details in the comments eg fierce summer fire burnt out NW
corner killing all mulga
Pastoral Lease Assessment Technical Manual for the Second round (2011)
19
Vertebrates
VERTEBRATES Presentabsent for dung tracks browsed vegetation burrows
throughout the site
It is only necessary to record current or fresh activity and record as
presence (P) Old or past activity should be noted in the comments
Table 1 Vertebrate pests
Animal Sighted Dung Tracks Browse BurrowsCamp
Rabbit visual sighting fresh buck
heaps
scratchings
present
graze line with chisel
marks on stems
warren heaps
marks
warren active
Sheep visual sighting fresh dung
active padding recent grazing camps
Cattle visual sighting fresh dung active padding recent grazing camps
Goats visual sighting fresh dung active padding browse shrubs
Note in comments
height of browse line
camps
Roos visual sighting fresh dung active padding recent grazing
(check for tail drag)
camphollows
other
Others include fox cat dingo camel horse wombat etc
Note any other useful information in the general comments for example mob of 200 goats sighted More
detailed comments can be included if needed in the paddock description
Pastoral Lease Assessment Technical Manual for the Second round (2011)
20
DENSITY MEASUREMENT OF PERENNIAL PLANT SPECIES
Perennial plants provide stability to grazing management systems due to their ability to persist during dry
periods consequently the measurement of plant attributes such as density and frequency of perennials
particularly those which are palatable are important in understanding plant dynamics and rangeland condition
Plant counts within fixed belt transects have been used to determine the density of shrubs and repeated
measurements allows density changes to be detected To ensure that observer error is minimised it is vital that
the same technique and standards are used in repeat measurements Modifications made in 1990 enabled
changes to be isolated to discreet quadrats and recruitment and deaths of cohorts can be followed
Jessup transect
This method incorporates a belt transect (a standard ecological technique) that is based on an original
survey technique used for chenopod shrublands by Jessup (1951) and further developed by Lay (1979)
Their technique involved driving a vehicle over a site for a set distance and shrubs occurring within the wheel
marks (representing the belt transect) were recorded This rather destructive technique is now simulated by
a fixed 4 m x 100 m transect and enables a density and frequency estimate of perennials for each site The
frequency estimates are not based on the optimum quadrat size for all species and the 10 m x 2 m quadrats
used should not be taken to represent true frequency readings It should also be noted that species
composition by frequency is not equivalent to composition by cover or density The length of some early
transects has varied from the current standard so ensure that any future comparisons use the same transect
configuration (see 821below)
The Jessup transect method measures the density (shrubsarea) and frequency of perennial plants at sites
where perennial cover occurs ie chenopods other shrubs and tussock (perennial) grasses Counting age
classes of shrubs (adultjuvenile) gives further information on population changes Monitoring over time
provides an indication of recruitment trends
Recording is based on all perennial shrubs within the transect being recorded by species and age class
(adultjuvenile) If the base of the plant is in the transect it is counted If the foliage only is in the transect it is
not counted
Transect layout
Jessup transects are permanently marked and comprise
transects 100 m x 2 m x 2 (see figure 5)
recordings separated into 10 m x 2 m blocks
identification of perennial plant species
less than 10 cm high andor non woody base = juvenile
more than 20 individual juvenile bushes or perennial grasses per 10 m x 2 m block = 20+ recording
1 Transects should include only one land unit and preferably be restricted to one element for data
analysis Transects are 100m long and generally at right angles to the track Walk the length of the
transect to ensure it is suitable before setting up the site and identify and discuss species present
with the other observers
2 Record a compass bearing for the transect
3 Secure a surveyors tape (marked into 10 m segments) to the sighter peg and lay out the tape to 100
m keeping the marker and sighter pegs in line
4 Check that the tape is in line with the sighter and marker peg Tension the tape and drive in the peg at the 100 m mark and secure tape to the peg It is important to have the tape extended to full
100m and tight and straight so that data is replicated at the quadrat level
Pastoral Lease Assessment Technical Manual for the Second round (2011)
21
5 If the transect layout is normal note this on the sheet if different note the transect layout on the site
description sheet and orient diagram with north to the top of the page Give clear legible directions
and bearings
Figure 5 Jessup transect layout
Recording a Jessup transect
1 Use a surveyors tape that is clearly marked into 10 m intervals If it is marked with tape check that
this has not slipped from the 10 m graduations Counts should be recorded on a Jessup transect
data sheet (see appendix 6)
2 Commence transect on left side of tape (UP) using 2 m rod (refer plate below) Check that the rod is
2 m A two metre curtain pole is ideal for this
Plate 4 Recording a Jessup transect
3 Identify each perennial species If in doubt collect a specimen
4 Easiest operation is with one person observing (counting) and another recording and acting as a
checking observer The recorder (scribe) stands at the 10 m marker intervals and the observer calls
out the adultjuvenile strikes along each 10 m transect interval The recorder can assist by spotting
hidden plants and small juvenile plants
5 For plants on quadrat margins include only in the quadrat where the rooted stem is located Count
plants only if they are more than 50 rooted within the quadrat
6 Chenopods occur in clumps and it is difficult to distinguish individuals for this reason clumps are
recorded and are recognised as individual clumps if there is more than a 30 cm gap between the
rooted stems Criteria for counting plants growing close together are as follows
End peg Sighter peg Site marker amp disc
11 12 13 14 15 16 17 18 19 20
10 9 8 7 6 5 4 3 2 1
100 m
4 m
Pastoral Lease Assessment Technical Manual for the Second round (2011)
22
distinguish between individual clumps if there is more than a 30 cm gap between rooted stems
if crowns are distinct and bases are less than 30 cm apart count each as an individual
if crowns are touching or overlapping and gap between rooted stems is less than 30 cm count
as one clump
Note In cases of perennial plants such as low bluebush being grazed the reduction of the crown
may lead to higher count of bush numbers Care is required when comparing existing Jessup counts
and noted should be recorded if this type of splitting has occurred
7 Record juveniles as plants less than 10 cm high or wide and not woody However if obviously old
woody plants are grazed back to less then this size record as adults but make comment
accordingly
If greater than 20 juvenile individuals of any species encountered in 10m interval (quadrat) record as
20+ This avoids attempting to count up to 200 seedlings but still provides sufficient data to interpret
that recruitment is occurring Large numbers of seedlings can occur following favourable conditions
and it becomes difficult to count all of these However where feasible a total count of juveniles
should be undertaken
8 For perennial grasses record clumps if greater than 10 cm high or 10 cm wide ie no juvenile
categories Record count as 20 + if greater than 20 individuals within one 10 m x 2 m block This is
to aid interpretation of step-point cover data eg low density but high cover implies large spreading
individuals high density but low cover may imply a grazing effect - site comments should indicate
this The quadrat sizes are not well suited to grasses but do provide an indication of the level of
grasses within a shrubland
9 Do not record dead or completely defoliated bushes but note occurrence in comments
10 Proceed to end of transect and commence quadrats 11-20 (ie 100-0m) on other side of tape
(down)
11 Record minor site variations in comments relating to quadrat intervals eg 20-30m large scaled area
Pastoral Lease Assessment Technical Manual for the Second round (2011)
23
DATABASE AND GIS ndash needs update for ALIS and FDE
Site information is currently entered into the Arid Lands Information System (ALIS) and print-outs and
photographs are supplied to the lessee for every photopoint on the station in the form of a Photopoint
Manual
In 1991 the Geographic Analysis and Research Unit (GAR) of the Department of Housing and Urban
Development has been assisting the Pastoral Management Branch in the establishment and maintenance of
a Pastoral Geographic Information System (Malcolm and Nicolson 1995) The GAR unit operates a
centralised ARCINFO (Environmental Systems Research Institute USA) GIS facility and is the
Environmental Node of South Australia‟s Land Information System
Extensive development was carried out on ALIS and while operational is still undergoing some further
development Management of this system is though Client Services in DENR in collaboration with the
Pastoral Program Development of a system for field data entry onto GETEC tablets has been completed
and is undergoing transition into the operational phase This will improve data collection with validation in the
field and also allow considerable time saving and possible transposition errors removing one stage in the
data entry process
Lease infrastructure information is derived from a number of sources that vary in age scale and accuracy
During the assessment process topographic maps are used as a base map and information is checked
corrected of altered using various techniques Prior to the introduction of Global Positioning Systems (GPS)
in 1992 the information was collected using bearing and distance measurement that were plotted onto base
maps The improved accuracy of GPS units over time has allowed increased accuracy and therefore an
improved mapping product
Lease maps and land system maps are available as hard copy products Watered areas for each paddock
can also be produced that indicate the extent that the lease is utilised by stock Undisturbed areas represent
quality wildlife habitats and further investigations are required to study the relationships between stocking
intensity land condition and wildlife habitat More detailed information can be found in Malcolm and
Nicolson (1995)
POST TRIP PROCEEDURE
The following checklist should be completed after each trip
Download photos and GPS co-ordinates
Data entry
Update photopoint manual and make 2 copies
Conduct LCI peer review
All spatial updates sent to GIS DWLBC
Write draft Assessment report
Submit for review
Pastoral Lease Assessment Technical Manual for the Second round (2011)
CONDITION CLASS
ATTRIBUTE EXCELLENT GOOD FAIR POOR VERY POOR
PLANT SPECIES
COMPOSITION
maximum diversity of
annual and perennial
species possible for the
land type
perennial species of
various ages
some reduction in density
of palatable and
susceptible perennials
increased proportion of
shorter lived species
perennial species of
various ages
significantly reduced
cover density andor
regeneration of
palatable species
establishment of less
preferred or
unpalatable species
dominance of annual and
ephemeral species and
perennials with relatively
low palatability
no regeneration of
desirable perennial
species existing stands
degenerate
seasonal cover of
only pioneer
ephemerals or
unpalatable weeds
large areas totally
unproductive
PLANT
PRODUCTIVITY
at full potential
sustained productivity
annual com unities
maintain litter cover but
not production in dry
seasons
some fluctuation lower in
drought and may be
higher than site potential
for some species eg
Mitchell grass
reduced overall high
productivity in good
season
low in drought
(fluctuates markedly
with season)
impaired productivity
very seasonally
dependant low or non
existent in dry seasons
areas incapable of
any plant growth
SOIL EROSION
STATUS
no erosion (other than
natural features or
processes)
plant and litter cover
protect soil from wind
and water in all
seasons
minor or slight erosion
evident
increased susceptibility of
soils to erosion in dry
seasons
moderate erosion
evident
reduced density and
cover of perennial and
litter increases
susceptibility of soils to
erosion in most
seasons
severe erosion overall
high susceptibility of soils
to erosion in all seasons
extent of past erosion
renders site susceptible
to further soil movement
if grazed at any level
unstable severely
or very eroded
Pastoral Lease Assessment Technical Manual for the Second round (2011)
Appendix 1 Erosion severitytype intensity criteria ndashfor reference to first round data sheets
EROSION SeverityType intensity criteria + RATING (max 200 m radius)
NO ACCELERATED EROSION 00
SLIGHT EROSION (10 of site affected)
slight accumulation of wind blown soil and plant bases and other obstacles 11
removal of finer soil particles evident but soil crust is largely intact 12
occasional rills (lt300 mm deep) evident 13
no gullies present 14
a few scalds present usually less than 2 m in diameter 15
MINOR EROSION (10-25 of site affected)
accumulation of soil around plant bases with plant mounds noticeably enlarged 21
evidence of pedestalling but soil loss minor and plant bases not greatly elevated 22
breaking of surface crust with small erosion faces and some redistribution of soil and
or some rilling evident 23
occasional shallow gullies only 24
scalding evident but scalds relatively small and discontinuous 25
MODERATE EROSION (25-50 of site affected)
wind piling around plant bases and other obstacles is common but no plants completely covered 31
pedestalling apparent with plant bases distinctly raised and with obvious
soil loss and deflation in parts 32
surface sheeting andor rilling common with erosion faces (andor micro-
terracing) and active redistribution of soil 33
gullying present on parts of the site 34
numerous small scalds common andor with a tendency to coalesce to form larger scalds in parts 35
SEVERE EROSION (50-75 of site affected)
extreme hummocking around plants and other obstacles some plants completely covered 41
severe pedestalling with plant bases greatly elevated and major soil loss
from deflation andor much of surface generally unstable with ripple marks 42
major rilling or surface sheeting with extensive exposure of subsoil or parent material
erosion faces (andor microterracing) and active redistribution of soil 43
widespread gullying 44
scalding extensive smaller scalds have coalesced to form large more or
less continuous scalded areas 45
EXTREME EROSION (75-100 of site affected)
general surface movement area more or less bare with formation of shifting dunes 51
most of original land surface altered any last remnants of original soil or
vegetation standing as sentinels in a barren landscape 52
water sheeting andor rilling coalesced to expose subsoil or parent material 53
extensive gullying 54
scalding more or less continuous over large areas 55
Note Record severity first and then type eg 53 = Extreme erosionScalding
Pastoral Lease Assessment Technical Manual for the Second round (2011)
Appendix 2 Crown Separation Ratio
This is a visual estimate of plant cover
It is the average distance between crowns (the area the plant takes up if viewed from above) divided by the
average size of the crown In the field this means visualising how many crowns of a given plant species can be fitted in between the distance to the nearest neighbour of that species on average over the site The
classes are as follows
CLASS TERM CSR FIELD CRITERIA
1 Present lt 12 plants lt12 plants within 200 m radius
2 Isolated clumps gt20 spaces Isolated clumps of two to five woody plants 200 m
further apart
3 Isolated Plants gt20 spaces Isolated plants
4 Very Sparse 6-20 spaces well spaced crowns well separated
5 Sparse 1-5 spaces clearly spaced crowns clearly separated
6 Mid dense 0-09 spaces crowns touching to slight separation
7 Closed or dense 0 crowns touching to overlapping
Modified from Table 14 McDonald (1990)
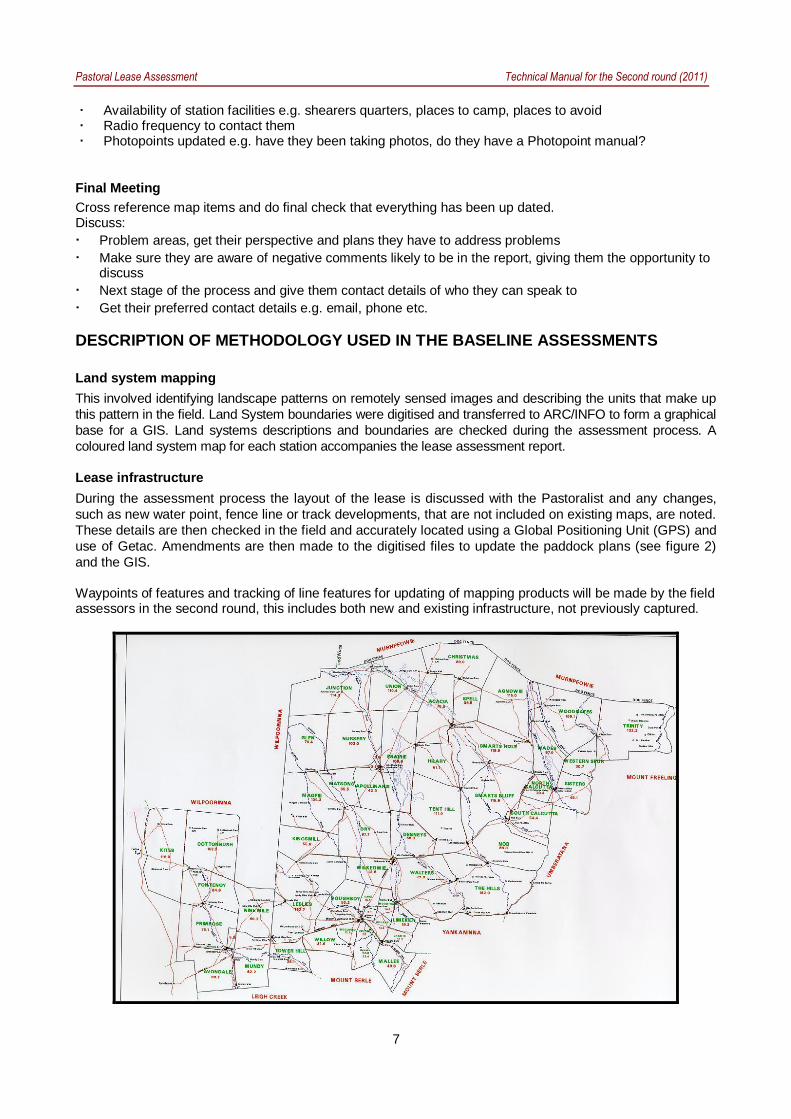
Pastoral Lease Assessment Technical Manual for the Second round (2011)
7
Availability of station facilities eg shearers quarters places to camp places to avoid Radio frequency to contact them Photopoints updated eg have they been taking photos do they have a Photopoint manual
Final Meeting
Cross reference map items and do final check that everything has been up dated Discuss
Problem areas get their perspective and plans they have to address problems
Make sure they are aware of negative comments likely to be in the report giving them the opportunity to discuss
Next stage of the process and give them contact details of who they can speak to
Get their preferred contact details eg email phone etc
DESCRIPTION OF METHODOLOGY USED IN THE BASELINE ASSESSMENTS
Land system mapping
This involved identifying landscape patterns on remotely sensed images and describing the units that make up
this pattern in the field Land System boundaries were digitised and transferred to ARCINFO to form a graphical
base for a GIS Land systems descriptions and boundaries are checked during the assessment process A
coloured land system map for each station accompanies the lease assessment report
Lease infrastructure
During the assessment process the layout of the lease is discussed with the Pastoralist and any changes
such as new water point fence line or track developments that are not included on existing maps are noted
These details are then checked in the field and accurately located using a Global Positioning Unit (GPS) and
use of Getac Amendments are then made to the digitised files to update the paddock plans (see figure 2)
and the GIS
Waypoints of features and tracking of line features for updating of mapping products will be made by the field assessors in the second round this includes both new and existing infrastructure not previously captured
Pastoral Lease Assessment Technical Manual for the Second round (2011)
8
Figure 2 Station paddock plan
Monitoring
A monitoring baseline has been established in each paddock This consists of a photopoint and a plant
species list with associated data Fixed belt transects have been used to collect ecological data This is
compiled into a ldquophotopoint manualrdquo and the lessee is given a copy and encouraged to photographically
monitor the sites These sites are usually located on water runs to enable the Pastoralist to inspect the sites
on a regular basis It was planned these sites would be re-measured by the Pastoral Management Branch
every 5-7 years (depending on resources) but in reality only sites in ldquopriority paddocksrdquo have been revisited
at this order of frequency
All previously-established photopoints which can be re-located will be revisited and re-measured Every attempt should be made to relocate photopoints but if not possible new sites will be installed
Plate 1 Pastoralist involvement in the assessment process
Paddock condition
The assessment process also describes the condition of each paddock within a lease and identifies any land
management issues that require attention This information is entered into the database so that a history for
each paddock within a district is developed
Paddocks that require immediate attention or action are detailed in the assessment report for the Board
These ldquopriority paddocksrdquo are inspected on a more regular basis and the lessee must make progress
towards rectifying the identified land management problems ldquoMonitor paddocksrdquo are identified where less
immediate attention is required or where issues should be monitored by lessees and the PLMG
Lease Assessment Reports
A lease Assessment Report is the formal document that provides details of the assessment of the land
condition over the ldquorunrdquo These reports are forwarded to the lessees who have 60 days to consider and
comment The Board then considers all comments and accepts the report
On completion of a district and all LCI scores analysed the Board will set the land management conditions of
the lease which includes a maximum stocking level The lessee may apply to the Pastoral Board at any time
for a temporary increase above this maximum Land management conditions may be adjusted and the term
of the lease extended if the lessee has complied with the lease conditions and fulfilled a duty to improve the
condition of the land
Pastoral Lease Assessment Technical Manual for the Second round (2011)
9
The report provides pastoralists or other land managers with information to ensure sound land management
practices are followed These reports provide details of a monitoring system that will supply the land user
with reliable interpretable and repeatable information to detect changes that result from land use practices
(rangeland condition and trend)
Capacity of the land to carry stock
The Pastoral Board is required to specify a maximum stocking level for the lease and the lessee is not
permitted to exceed this figure without the prior permission of the Board Stock maxima determined under
the previous Act (Pastoral Act 1936) did not include an assessment of the condition of the land and were
often set at inappropriate levels The previous maximum figure has long been represented by the pastoral
industry as the actual carrying capacity of the lease
The Objects of the Act specify that the Pastoral Board must ensure that degradation does not or is not likely
to occur Maximum stocking levels for a lease are far from ideal as an effective method for ensuring that
pastoral land is not degraded as they do not provide for stocking levels in individual paddocks under a range
of condition classes and pasture components
Plate 2 Fenceline contrast resulting from different management practices
The evidence for appropriate long term stocking levels must come primarily from-
what the land has carried in the past without severe degradation
what successful management practices have been implemented for various pasture types
how management practices generally are related to the present land condition
For the first round of assessments the Board determined that the most recent 10 year stocking average
(which includes a range of seasonal conditions) plus 20 allowance for good seasons would provide the
basis of the maximum lease offer This had the effect of bringing a number of leases with unrealistic previous
maximums to a more realistic figure The Board has reviewed its approach (and policy) on the setting of stocking limits for round two however it acknowledges that lease stocking maxima are at best a ldquoblunt instrumentrdquo for use in managing land resources Short-term adjustment of paddock stock numbers appropriate for conditions is the most effective tool but a maximum provides a statutory limit and guide to numbers likely to be able to be carried in the best seasons The current method uses a combination of LCI results paddock condition ratings area and watered area The Board considers that a better way of setting stock maximum would be to do so based on the capability of each land type within its watered area However the current inventory of these resources is not accurate to the level required and steps are being taken to work towards the future use of such a method
Pastoral Lease Assessment Technical Manual for the Second round (2011)
10
LAND CONDITION INDEX
The land condition assessment of the various pasture types involves defining what constitutes an intact or
un-degraded landscape and deciding on the criteria that indicates to what degree disturbance has occurred
The PLMC Acts emphasis on indigenous plant species largely determines an on-ground approach as it is
necessary to ascertain the mix of plant species It is also important to determine if seedlings are present as
this helps to indicate whether the land has a capacity to rehabilitate in cases of past damage It is for this
reason that remote sensing techniques may not be appropriate to determine land condition in most parts of
the sheep pastoral areas according to the Act
The following processes were used in training and calibration for these assessments during the first round of
assessments
The process of land condition assessment involves a preliminary reconnaissance survey by senior scientific
officers to determine pasture types and condition criteria This is followed by a training period for field staff to
become fully competent in using these criteria in assessing the various land condition states
The purpose of this reconnaissance survey by senior officers is to
identify the various pasture types and the sub-units called pasture components that make up these
pasture types within the district
determine the criteria that will be used to identify three condition classes within each pasture
component
Only three land condition classes (1 = poor 2 = fair and 3 = good) are described as this limits the number of
choices and therefore reduces possible observer errors To avoid the influence of seasonal changes and
drought the criteria are based primarily on perennial vegetation components with erosion levels included where
applicable The issue of so-called opportunity country involving only ephemeral growth is dealt with separately
Each condition class for each pasture component is described according to key indicator plants
Photographs and written criteria are compiled that depict each of the three condition classes for each of the
pasture components The criteria and photo-standards are compiled into manuals which are subsequently
used by the assessment officers in carrying out the lease assessments
Field staff are trained in the field to recognise the various condition classes for each of the pasture
components to achieve a uniform standard and tested thereby ensuring that all staff will assess the
condition of land uniformly and without bias
Analysis of changes from round 1 to 2 on any particular station occurs and also changes on a station
comparative to the average change of each pasture type in a district
PHOTOPOINTS
Monitoring the condition and trend of land under various grazing practices is an important on-going
management tool Photopoints are established in most paddocks to provide an indication of these trends
Revisiting these sites enables the development of a photographic sequence supplemented by vegetation
and soil information to provide an objective record of change at a site The photopoint is a sample of land
condtion in a particular paddock where located in a typical area This objective data is used to support
subjective judgements on condition in a paddock and a station overall A photopoint can also be set up in
atypical areas to monitor a specific issue
The Pastoral Land Management group will carry out regular long term monitoring of these sites However it
is important that short-term seasonal changes are also recorded if possible Pastoralists are encouraged to
regularly monitor the photopoints and have been involved in the initial establishment of the sites During this
Pastoral Lease Assessment Technical Manual for the Second round (2011)
11
process the assessment techniques can be demonstrated and the photopoint method explained to ensure
the pastoralist is able to carry on with subsequent monitoring if he or she desires
Through combining short term and long-term records our understanding of ecosystems may be improved
and future grazing practices can be adapted to suit these trends Stock records for each paddock together
with climatic information observations of grazing on desirable plants germination events and other factors
will provide a valuable record that will assist in future decision making regarding the objectives of sustainable
use
Changes in the soil and vegetation components may follow
a fire
extreme seasons wet or dry
a marked change in vegetation cover
defoliation of chenopod shrubs (saltbush or bluebush)
establishment of new shrub seedlings
death of shrubs or trees
invasion by unpalatable plants
Access and relocation of existing photopoints (finding the site)
Sites are generally placed alongside station tracks for ease of relocation If a site is located on a now-unused track then be sure to note how to find the turn-off and any other important features The photopoint peg or post should in open country be visible from the track although it is desirable to place it far enough off the track to reduce the chance of it being driven over or destroyed by road maintenance or minor realignment Experience has shown that sites placed 10-50 metres from the track provide the best chance of not being damaged or rendered useless from road effects while still being easily accessible for revisits Careful recording of the GPS and distances is essential and will assist future assessors Use of hills and other features in a photo may assist in relocation
New Photopoints
Choosing the location for a new photopoint
The photopoint location will depend on the major objective for setting it up
To encourage pastoralists to monitor the sites they need to be easily locatable Record the distance from a
permanent feature eg gate or trough and if possible record the distance from the opposite direction Use
the GPS to capture co-ordinates for the site
The following factors should be considered when choosing a site particularly when monitoring grazing
impact
Distance from water
Grazing intensity of domestic stock decreases with distance from the permanent water source Choosing sites at a consistent distance from water allows for more effective comparison between sites Assessment sites for sheep stations are generally placed about 15 km from permanent water but more importantly should monitor areas where indicator species are still present or be expected to occur In cattle areas the site may be between 2-4 km from water Where an acceptable site does not occur at the desired distance personal judgement must be used in choosing the best location taking the above factors into consideration This may involve locating the site further or a little closer to the watering point or simply abandoning the attempt to locate a site out from that particular water (especially if another track or water in the paddock is also monitored)
Representation of a land unit
If establishing a new site in a paddock which does not have any existing sites this site should be located within a recognisable land unit that is typical of the paddock For example do not choose an isolated
Pastoral Lease Assessment Technical Manual for the Second round (2011)
12
bluebush patch if it is not typical of the paddock Avoid vegetation patches that are obviously atypical or are small areas of transition between communities The unit chosen must also be one that gives a good indication of grazing impact For example do not place a site in a very stable resilient vegetation type if the majority of the paddock or areas preferred by stock are much less resilient
Size and uniformity
The site should be uniform with respect to vegetation soil slope and aspect The more extensive the area of the site the better While a site might take observations of a radius of 200m an area of 100m radius should be considered a minimum but all observations must be made within uniform land typeunit Disturbed areas such as roadsides must not be considered
Other influencing factors
Other factors likely to bias or influence the site vegetation should be recognised and avoided where possible Avoid placing sites in the following situations
on a southern fence since sheep tend to graze into the wind and in most sheep - pastoral areas of SA the prevailing wind is from the south
sheep camp areas or where animals walk parallel to the track resulting in heavily tracking
mechanically disturbed areas
water run-on areas from tracks or where old track marks or erosion is evident
Photopoint setup
Directions to each photopoint should comprise a distance and direction from a known point such as a water
point A metal numbered disc on a polydropper fibreglass or steel rebar post (or wooden peg) marks each photopoint established during or before the first round (refer figure 3) This is referred to as the marker peg
However where the marker has disappeared or deteriorated new markers will consist of some more
permanentvisible materials
Figure 3 Diagram of a typical ldquoQSrdquoPhotopoint Monitoring site
Position the marker peg 10-50 m off the track in a clearly visible location that is not likely to be disturbed
However ensure the area to be monitored is free of vehicle track effects such as water flow stock
movement etc If the marker peg is positioned further than 50 m from the track position another directional
peg near the track and give clear directions on the site sheet to the location of the marker peg or post (ie
Pastoral Lease Assessment Technical Manual for the Second round (2011)
13
bearing and distance from 1st peg) Remember it may be some time before the site is re-visited and the site
is wasted if it can‟t be re-located
A second peg usually a jarrah peg is located approximately 17 paces from the marker peg This is referred to as the sighter peg This peg is positioned such that the photograph area does not include more than 13 skyline
and the bearing will follow the line of the Jessup transect A third peg is placed 100 m from the sighter and used
to mark the end of the Jessup transect Not all sites will have a Jessup transect
Locations of all photopoint sites will be recorded with a GPS from the vehicle and marked on the updated station
paddock plan
The photograph should be taken from the marker peg Record a compass bearing between the marker peg
and sighter peg If other photos are taken from the marker peg the bearing should be marked with an
additional sighter peg
Taking the photograph
Photos are taken with a digital SLR camera and with the zoom set to replicate the original 50mm lens
cameras Photos are taken in RAW format and downloaded daily To take the photograph stand behind the
marker peg and centre on the base of the sighter peg as shown in plate 5 and figure 4 Adjust focus to
infinity to ensure all of the transect is in focus
Plate 3 Taking a photograph
Figure 4 Directions for taking the photograph
Pastoral Lease Assessment Technical Manual for the Second round (2011)
14
RECORDING FIELD INFORMATION
Site description and location
Site sheets and the information collected have changed and evolved over the period of assessment An
example of the current site sheet is shown in appendix 1
Detailed below are the fields of information together with the type of detail that should be recorded Note Completed entry example shown in brackets (italics)
QS OB RS TS Prefix to describe type of photopoint followed by photopoint number
as per the disc (eg QS 2345)
QS - Quantitative site A pegged site used for monitoring vegetation
changes with Jessup andor step-point data (formerly photopoint -
PP)
OB - Observation site A pegged site used as an observation site to
monitor changes that can be detected by a photographic sequence
eg rehabilitation spread of erosion gullies Site description includes
a list of plant species but with no measured plant data collected
RS - Reference site Sites are in areas remote from grazing influence
greater than 5 km from water in sheep country and 8 km in cattle
country Also includes exclosure sites Complete all site description
and plant and soil sheets
TS - Type Site Designated for site characteristic of mapped land
system in early part of baseline assessment process As per OB but
sites were not usually pegged
PC ndash Photo Comparison Should be used strictly where a photo is to
be compared and data collected would not be required eg A
panorama on a hill top where species in the foreground are not
relevant to the background being monitored in a photo
All photopoints should be prefixed with QS OB RS PC or TS
DATE Day Month and Year (eg 01062007)
OBSERVERS Initials of persons involved in data collection Initials of the person
filling out the sheet first followed by second observer (egMTCB)
STATION Pastoral station name Use the full name of the station (eg
Bulgunnia)
PADDOCK Full paddock name may include subscript eg formerly part Cyclone
(Monsoon)
ZONE Grid reference zone generally on the bottom of the map (eg 54)
MAP SHEET Map sheet number 150000 five digits eg 66341 1100000 four
digits eg 5434 (66341)
EASTING amp NORTHING Co-ordinates on GPS Unit
Pastoral Lease Assessment Technical Manual for the Second round (2011)
15
DATUM GDA 94
SERIES Refers to the filing system for photopoint photograph series for the
station indicates the station with the month amp year the photo was
taken First four spaces are for the station (or trip name) abbreviated
to the first four letters eg Bulg for Bulgunnia Next two are digits for the month followed by two digits for the year eg (Bulg 0691)
DIGITAL Image number
WATERPOINT Name of nearest permanent water source by direct route as a sheep
would walk Note type also eg dam trough tank (Moonbi Tank)
DISTANCE (km) Distance (to one decimal point) to water source named above ie by
direct route as a sheep would walk Record the straight-line distance from the GPS (eg 16 km)
CONDITION Condition rating for the site as per condition rating guidelines Refer to
appendix 2 for condition class attributes Notes on attributes in the site comments will help to support this judgement (eg Good)
MUD MAP Diagram of how to relocate the site clearly labelled with distances
Include paddock name and adjacent paddocks track location and
gate zero origin water location site number Orient the map with
north to the top of the page
MUD MAP COMMENTS Clear directions on how to relocate the site completed according to
the following format Keep in mind that this will be printed out for the
lessee
Distance from gate or trough direction on track to next bore or
paddock along fence Place where zero taken from eg tank trough
gate - be specific What type of peg or marker was used and how far it
is off the track and in what direction Distance to sighter peg and
bearing Jessup transect length (normally 100m) and bearing from sighter peg (Use tripmeter if no Halda rally meter or similar)
Example mud map comments (15 km south of Twin Well on track to Gladstone Bore or 35km north
of gate from Dusty paddock Zero at trough Jarrah peg and disc at 15 paces east of track Sighter peg (jarrah) at 17 paces bearing 90deg Jessup transect 100 m x 2 m x 2 at 90deg end marked by jarrah peg)
EROSION Record the severity and type of erosion according to the table in
appendix 4
COMMENTS Record notes that help to further explain observations or that will
assist interpretation of the data for present and future observations
This should include notes to indicate why the site was established and
what it is monitoring It should also include notes that help explain the
condition rating and current impacts or changes including erosion
Data entry Initials of person who entered data on the database and the date of
entry (egCB 5391)
Pastoral Lease Assessment Technical Manual for the Second round (2011)
16
Establishing new sites The site details below are only relevant for new sites set up as part of the second assessmentndash not used for revisits as part of the second round
LAND SYSTEM Land system name taken from land system map (egWeedna)
ROCK TYPE Name of rock type from geological map or rock type identified at site if
geology map incorrect (egred sandstone)
FORMATION Name of rock formation from geological map (egPound Quartzite)
LANDFORM SLOPE Slope of the site measured in degrees by use of clinometer
Do not confuse degrees with (eg2deg)
ELEMENT Landform element of site
1 crest curved in down slope profile and margins at limit of observed
curvature
2 slope considered as planar Note in comments if upper mid or
lower slope
3 flat planar
4 depression may be open or closed
PATTERN Term to describe the landform type eg alluvial plain = ALP See
appendix 3 for abbreviations and descriptions (egALP)
Pastoral Lease Assessment Technical Manual for the Second round (2011)
17
Vegetation
SIGNIFICANT RAIN Yes - data collection following rains that resulted in green ephemeral
response record dates if known of significant falls
No - dry ephemeral growth only
TYPE S (summer) - rain fell between November and March
W (winter) - rain fell between April and October
I (indistinguishable) - cannot tell if resultant green ephemeral growth is
from summer or winter rain events or is a combination of both
VEGETATION SPECIES Effort should be made to record all plant species throughout the site
Recording plant species should be carried out until most species are
recorded (ie until a period of minutes elapses before further species
are not found) Record full species name on the site sheet
If plant species is not known collect a specimen fill out details in the
herbarium collection booklet and include photopoint number and line
number of record on sheet eg 234512 so that this number can be
entered on subsequent site sheets Put the herbarium label with the
specimen in the plant press Keep a list of plants collected and PPline
number so that you can give this number to collected species at other
sites Update the site sheet with the correct species name when it
comes back from the herbarium or identity confirmed
DOM Dominant species This will be used to classify vegetation
associationsgroups
1 visually pre-dominant species forming the tallest stratum CSR
class should exceed 1 (CSR 2-6)
2 if another tallest stratum species is present (co-dominant) it is
selected OR if absent the most abundant understorey species is selected eg Mai sed
3 selected from any stratum usually a lower stratum as an indicator
species (that is a species of known environmental preferences or
of such abundance that it can‟t be ignored) or to distinguish between associations eg Atr ves
4 other conspicuous species to separate associations eg Scl obl
GRAZED If a plant is obviously grazed tick the box If grazing is mainly by
rabbits or goats this should be noted in the comments
RESPROUT If the plant has previously been grazed back and is now showing fresh
new growth tick the box Note extent in comments eg Atr ves adults
showing abundant new growth following recent rains
RECRUITMENT If seedlings are evident or new suckers (eg Bullock bush) tick the
box Note height of seedlings in comments eg Mai sed seedlings to
5 cm abundant in open areas
FRUIT If the plant is in fruit tick the box This will enable data collection on
best times for seed collection Record relevant notes in comments
Pastoral Lease Assessment Technical Manual for the Second round (2011)
18
Crown Separation Ratio (CSR) The average distance between crowns divided by the average size of
the crown grouped into various size classes (see appendix 5)
1 present lt 12 plants in 200 m radii
2 isolated clumps gt20 CSR clumps of two to five woody plants 200
m further apart
3 isolated plants gt20 CSR trees gt100 m apart
4 very sparse 6-20 CSR crowns well separated
5 sparse 1-5 CSR crowns clearly separated
6 mid dense 0-09 CSR crowns touching to slightly separated
7 closed or dense crowns touching to over lapping
JESSUP Refers to the results of the Jessup transect (see section 81
for more details)
See appendix 6 for Jessup transect recording sheet Record total
counts from the Jessup transect field sheet for each species adult
and juvenile
FIRE SCARS Yes - fire scars evident on stumps trees or fence posts Fire scars
should be recorded if fire occurred since the first assessment
No - no fire scars visible
Last burn - date of last known fire Check with the lessee and record
further details in the comments eg fierce summer fire burnt out NW
corner killing all mulga
Pastoral Lease Assessment Technical Manual for the Second round (2011)
19
Vertebrates
VERTEBRATES Presentabsent for dung tracks browsed vegetation burrows
throughout the site
It is only necessary to record current or fresh activity and record as
presence (P) Old or past activity should be noted in the comments
Table 1 Vertebrate pests
Animal Sighted Dung Tracks Browse BurrowsCamp
Rabbit visual sighting fresh buck
heaps
scratchings
present
graze line with chisel
marks on stems
warren heaps
marks
warren active
Sheep visual sighting fresh dung
active padding recent grazing camps
Cattle visual sighting fresh dung active padding recent grazing camps
Goats visual sighting fresh dung active padding browse shrubs
Note in comments
height of browse line
camps
Roos visual sighting fresh dung active padding recent grazing
(check for tail drag)
camphollows
other
Others include fox cat dingo camel horse wombat etc
Note any other useful information in the general comments for example mob of 200 goats sighted More
detailed comments can be included if needed in the paddock description
Pastoral Lease Assessment Technical Manual for the Second round (2011)
20
DENSITY MEASUREMENT OF PERENNIAL PLANT SPECIES
Perennial plants provide stability to grazing management systems due to their ability to persist during dry
periods consequently the measurement of plant attributes such as density and frequency of perennials
particularly those which are palatable are important in understanding plant dynamics and rangeland condition
Plant counts within fixed belt transects have been used to determine the density of shrubs and repeated
measurements allows density changes to be detected To ensure that observer error is minimised it is vital that
the same technique and standards are used in repeat measurements Modifications made in 1990 enabled
changes to be isolated to discreet quadrats and recruitment and deaths of cohorts can be followed
Jessup transect
This method incorporates a belt transect (a standard ecological technique) that is based on an original
survey technique used for chenopod shrublands by Jessup (1951) and further developed by Lay (1979)
Their technique involved driving a vehicle over a site for a set distance and shrubs occurring within the wheel
marks (representing the belt transect) were recorded This rather destructive technique is now simulated by
a fixed 4 m x 100 m transect and enables a density and frequency estimate of perennials for each site The
frequency estimates are not based on the optimum quadrat size for all species and the 10 m x 2 m quadrats
used should not be taken to represent true frequency readings It should also be noted that species
composition by frequency is not equivalent to composition by cover or density The length of some early
transects has varied from the current standard so ensure that any future comparisons use the same transect
configuration (see 821below)
The Jessup transect method measures the density (shrubsarea) and frequency of perennial plants at sites
where perennial cover occurs ie chenopods other shrubs and tussock (perennial) grasses Counting age
classes of shrubs (adultjuvenile) gives further information on population changes Monitoring over time
provides an indication of recruitment trends
Recording is based on all perennial shrubs within the transect being recorded by species and age class
(adultjuvenile) If the base of the plant is in the transect it is counted If the foliage only is in the transect it is
not counted
Transect layout
Jessup transects are permanently marked and comprise
transects 100 m x 2 m x 2 (see figure 5)
recordings separated into 10 m x 2 m blocks
identification of perennial plant species
less than 10 cm high andor non woody base = juvenile
more than 20 individual juvenile bushes or perennial grasses per 10 m x 2 m block = 20+ recording
1 Transects should include only one land unit and preferably be restricted to one element for data
analysis Transects are 100m long and generally at right angles to the track Walk the length of the
transect to ensure it is suitable before setting up the site and identify and discuss species present
with the other observers
2 Record a compass bearing for the transect
3 Secure a surveyors tape (marked into 10 m segments) to the sighter peg and lay out the tape to 100
m keeping the marker and sighter pegs in line
4 Check that the tape is in line with the sighter and marker peg Tension the tape and drive in the peg at the 100 m mark and secure tape to the peg It is important to have the tape extended to full
100m and tight and straight so that data is replicated at the quadrat level
Pastoral Lease Assessment Technical Manual for the Second round (2011)
21
5 If the transect layout is normal note this on the sheet if different note the transect layout on the site
description sheet and orient diagram with north to the top of the page Give clear legible directions
and bearings
Figure 5 Jessup transect layout
Recording a Jessup transect
1 Use a surveyors tape that is clearly marked into 10 m intervals If it is marked with tape check that
this has not slipped from the 10 m graduations Counts should be recorded on a Jessup transect
data sheet (see appendix 6)
2 Commence transect on left side of tape (UP) using 2 m rod (refer plate below) Check that the rod is
2 m A two metre curtain pole is ideal for this
Plate 4 Recording a Jessup transect
3 Identify each perennial species If in doubt collect a specimen
4 Easiest operation is with one person observing (counting) and another recording and acting as a
checking observer The recorder (scribe) stands at the 10 m marker intervals and the observer calls
out the adultjuvenile strikes along each 10 m transect interval The recorder can assist by spotting
hidden plants and small juvenile plants
5 For plants on quadrat margins include only in the quadrat where the rooted stem is located Count
plants only if they are more than 50 rooted within the quadrat
6 Chenopods occur in clumps and it is difficult to distinguish individuals for this reason clumps are
recorded and are recognised as individual clumps if there is more than a 30 cm gap between the
rooted stems Criteria for counting plants growing close together are as follows
End peg Sighter peg Site marker amp disc
11 12 13 14 15 16 17 18 19 20
10 9 8 7 6 5 4 3 2 1
100 m
4 m
Pastoral Lease Assessment Technical Manual for the Second round (2011)
22
distinguish between individual clumps if there is more than a 30 cm gap between rooted stems
if crowns are distinct and bases are less than 30 cm apart count each as an individual
if crowns are touching or overlapping and gap between rooted stems is less than 30 cm count
as one clump
Note In cases of perennial plants such as low bluebush being grazed the reduction of the crown
may lead to higher count of bush numbers Care is required when comparing existing Jessup counts
and noted should be recorded if this type of splitting has occurred
7 Record juveniles as plants less than 10 cm high or wide and not woody However if obviously old
woody plants are grazed back to less then this size record as adults but make comment
accordingly
If greater than 20 juvenile individuals of any species encountered in 10m interval (quadrat) record as
20+ This avoids attempting to count up to 200 seedlings but still provides sufficient data to interpret
that recruitment is occurring Large numbers of seedlings can occur following favourable conditions
and it becomes difficult to count all of these However where feasible a total count of juveniles
should be undertaken
8 For perennial grasses record clumps if greater than 10 cm high or 10 cm wide ie no juvenile
categories Record count as 20 + if greater than 20 individuals within one 10 m x 2 m block This is
to aid interpretation of step-point cover data eg low density but high cover implies large spreading
individuals high density but low cover may imply a grazing effect - site comments should indicate
this The quadrat sizes are not well suited to grasses but do provide an indication of the level of
grasses within a shrubland
9 Do not record dead or completely defoliated bushes but note occurrence in comments
10 Proceed to end of transect and commence quadrats 11-20 (ie 100-0m) on other side of tape
(down)
11 Record minor site variations in comments relating to quadrat intervals eg 20-30m large scaled area
Pastoral Lease Assessment Technical Manual for the Second round (2011)
23
DATABASE AND GIS ndash needs update for ALIS and FDE
Site information is currently entered into the Arid Lands Information System (ALIS) and print-outs and
photographs are supplied to the lessee for every photopoint on the station in the form of a Photopoint
Manual
In 1991 the Geographic Analysis and Research Unit (GAR) of the Department of Housing and Urban
Development has been assisting the Pastoral Management Branch in the establishment and maintenance of
a Pastoral Geographic Information System (Malcolm and Nicolson 1995) The GAR unit operates a
centralised ARCINFO (Environmental Systems Research Institute USA) GIS facility and is the
Environmental Node of South Australia‟s Land Information System
Extensive development was carried out on ALIS and while operational is still undergoing some further
development Management of this system is though Client Services in DENR in collaboration with the
Pastoral Program Development of a system for field data entry onto GETEC tablets has been completed
and is undergoing transition into the operational phase This will improve data collection with validation in the
field and also allow considerable time saving and possible transposition errors removing one stage in the
data entry process
Lease infrastructure information is derived from a number of sources that vary in age scale and accuracy
During the assessment process topographic maps are used as a base map and information is checked
corrected of altered using various techniques Prior to the introduction of Global Positioning Systems (GPS)
in 1992 the information was collected using bearing and distance measurement that were plotted onto base
maps The improved accuracy of GPS units over time has allowed increased accuracy and therefore an
improved mapping product
Lease maps and land system maps are available as hard copy products Watered areas for each paddock
can also be produced that indicate the extent that the lease is utilised by stock Undisturbed areas represent
quality wildlife habitats and further investigations are required to study the relationships between stocking
intensity land condition and wildlife habitat More detailed information can be found in Malcolm and
Nicolson (1995)
POST TRIP PROCEEDURE
The following checklist should be completed after each trip
Download photos and GPS co-ordinates
Data entry
Update photopoint manual and make 2 copies
Conduct LCI peer review
All spatial updates sent to GIS DWLBC
Write draft Assessment report
Submit for review
Pastoral Lease Assessment Technical Manual for the Second round (2011)
CONDITION CLASS
ATTRIBUTE EXCELLENT GOOD FAIR POOR VERY POOR
PLANT SPECIES
COMPOSITION
maximum diversity of
annual and perennial
species possible for the
land type
perennial species of
various ages
some reduction in density
of palatable and
susceptible perennials
increased proportion of
shorter lived species
perennial species of
various ages
significantly reduced
cover density andor
regeneration of
palatable species
establishment of less
preferred or
unpalatable species
dominance of annual and
ephemeral species and
perennials with relatively
low palatability
no regeneration of
desirable perennial
species existing stands
degenerate
seasonal cover of
only pioneer
ephemerals or
unpalatable weeds
large areas totally
unproductive
PLANT
PRODUCTIVITY
at full potential
sustained productivity
annual com unities
maintain litter cover but
not production in dry
seasons
some fluctuation lower in
drought and may be
higher than site potential
for some species eg
Mitchell grass
reduced overall high
productivity in good
season
low in drought
(fluctuates markedly
with season)
impaired productivity
very seasonally
dependant low or non
existent in dry seasons
areas incapable of
any plant growth
SOIL EROSION
STATUS
no erosion (other than
natural features or
processes)
plant and litter cover
protect soil from wind
and water in all
seasons
minor or slight erosion
evident
increased susceptibility of
soils to erosion in dry
seasons
moderate erosion
evident
reduced density and
cover of perennial and
litter increases
susceptibility of soils to
erosion in most
seasons
severe erosion overall
high susceptibility of soils
to erosion in all seasons
extent of past erosion
renders site susceptible
to further soil movement
if grazed at any level
unstable severely
or very eroded
Pastoral Lease Assessment Technical Manual for the Second round (2011)
Appendix 1 Erosion severitytype intensity criteria ndashfor reference to first round data sheets
EROSION SeverityType intensity criteria + RATING (max 200 m radius)
NO ACCELERATED EROSION 00
SLIGHT EROSION (10 of site affected)
slight accumulation of wind blown soil and plant bases and other obstacles 11
removal of finer soil particles evident but soil crust is largely intact 12
occasional rills (lt300 mm deep) evident 13
no gullies present 14
a few scalds present usually less than 2 m in diameter 15
MINOR EROSION (10-25 of site affected)
accumulation of soil around plant bases with plant mounds noticeably enlarged 21
evidence of pedestalling but soil loss minor and plant bases not greatly elevated 22
breaking of surface crust with small erosion faces and some redistribution of soil and
or some rilling evident 23
occasional shallow gullies only 24
scalding evident but scalds relatively small and discontinuous 25
MODERATE EROSION (25-50 of site affected)
wind piling around plant bases and other obstacles is common but no plants completely covered 31
pedestalling apparent with plant bases distinctly raised and with obvious
soil loss and deflation in parts 32
surface sheeting andor rilling common with erosion faces (andor micro-
terracing) and active redistribution of soil 33
gullying present on parts of the site 34
numerous small scalds common andor with a tendency to coalesce to form larger scalds in parts 35
SEVERE EROSION (50-75 of site affected)
extreme hummocking around plants and other obstacles some plants completely covered 41
severe pedestalling with plant bases greatly elevated and major soil loss
from deflation andor much of surface generally unstable with ripple marks 42
major rilling or surface sheeting with extensive exposure of subsoil or parent material
erosion faces (andor microterracing) and active redistribution of soil 43
widespread gullying 44
scalding extensive smaller scalds have coalesced to form large more or
less continuous scalded areas 45
EXTREME EROSION (75-100 of site affected)
general surface movement area more or less bare with formation of shifting dunes 51
most of original land surface altered any last remnants of original soil or
vegetation standing as sentinels in a barren landscape 52
water sheeting andor rilling coalesced to expose subsoil or parent material 53
extensive gullying 54
scalding more or less continuous over large areas 55
Note Record severity first and then type eg 53 = Extreme erosionScalding
Pastoral Lease Assessment Technical Manual for the Second round (2011)
Appendix 2 Crown Separation Ratio
This is a visual estimate of plant cover
It is the average distance between crowns (the area the plant takes up if viewed from above) divided by the
average size of the crown In the field this means visualising how many crowns of a given plant species can be fitted in between the distance to the nearest neighbour of that species on average over the site The
classes are as follows
CLASS TERM CSR FIELD CRITERIA
1 Present lt 12 plants lt12 plants within 200 m radius
2 Isolated clumps gt20 spaces Isolated clumps of two to five woody plants 200 m
further apart
3 Isolated Plants gt20 spaces Isolated plants
4 Very Sparse 6-20 spaces well spaced crowns well separated
5 Sparse 1-5 spaces clearly spaced crowns clearly separated
6 Mid dense 0-09 spaces crowns touching to slight separation
7 Closed or dense 0 crowns touching to overlapping
Modified from Table 14 McDonald (1990)
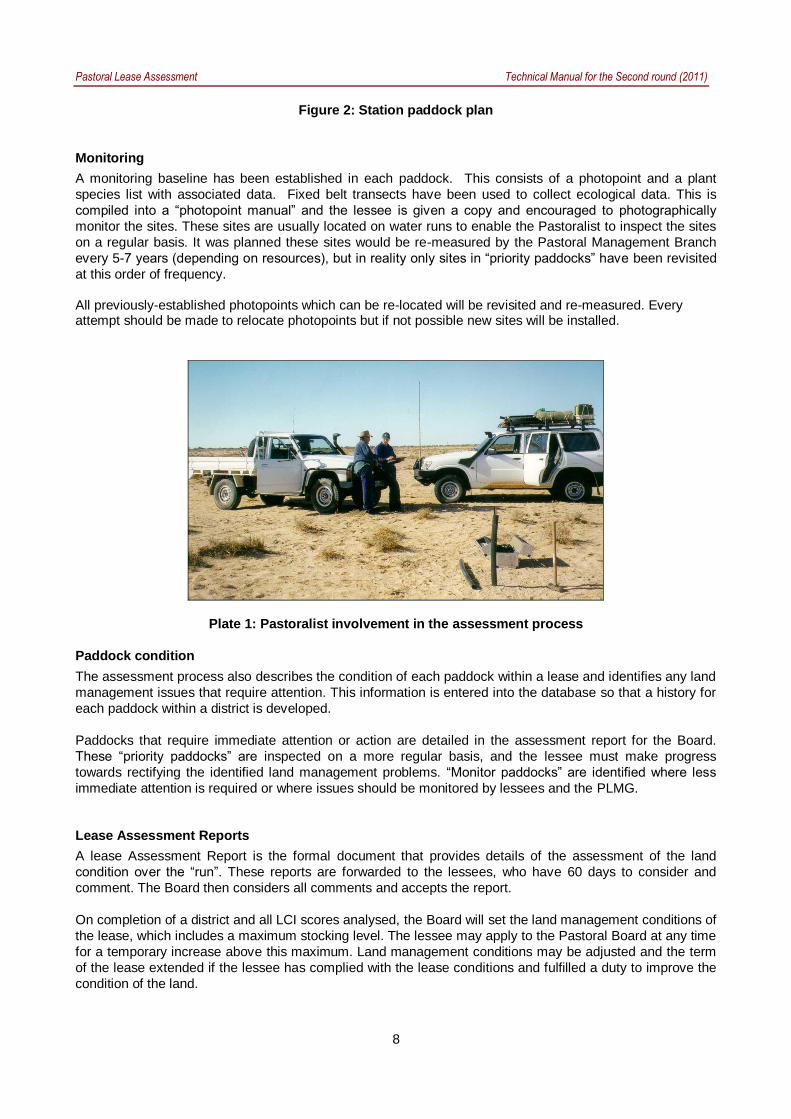
Pastoral Lease Assessment Technical Manual for the Second round (2011)
8
Figure 2 Station paddock plan
Monitoring
A monitoring baseline has been established in each paddock This consists of a photopoint and a plant
species list with associated data Fixed belt transects have been used to collect ecological data This is
compiled into a ldquophotopoint manualrdquo and the lessee is given a copy and encouraged to photographically
monitor the sites These sites are usually located on water runs to enable the Pastoralist to inspect the sites
on a regular basis It was planned these sites would be re-measured by the Pastoral Management Branch
every 5-7 years (depending on resources) but in reality only sites in ldquopriority paddocksrdquo have been revisited
at this order of frequency
All previously-established photopoints which can be re-located will be revisited and re-measured Every attempt should be made to relocate photopoints but if not possible new sites will be installed
Plate 1 Pastoralist involvement in the assessment process
Paddock condition
The assessment process also describes the condition of each paddock within a lease and identifies any land
management issues that require attention This information is entered into the database so that a history for
each paddock within a district is developed
Paddocks that require immediate attention or action are detailed in the assessment report for the Board
These ldquopriority paddocksrdquo are inspected on a more regular basis and the lessee must make progress
towards rectifying the identified land management problems ldquoMonitor paddocksrdquo are identified where less
immediate attention is required or where issues should be monitored by lessees and the PLMG
Lease Assessment Reports
A lease Assessment Report is the formal document that provides details of the assessment of the land
condition over the ldquorunrdquo These reports are forwarded to the lessees who have 60 days to consider and
comment The Board then considers all comments and accepts the report
On completion of a district and all LCI scores analysed the Board will set the land management conditions of
the lease which includes a maximum stocking level The lessee may apply to the Pastoral Board at any time
for a temporary increase above this maximum Land management conditions may be adjusted and the term
of the lease extended if the lessee has complied with the lease conditions and fulfilled a duty to improve the
condition of the land
Pastoral Lease Assessment Technical Manual for the Second round (2011)
9
The report provides pastoralists or other land managers with information to ensure sound land management
practices are followed These reports provide details of a monitoring system that will supply the land user
with reliable interpretable and repeatable information to detect changes that result from land use practices
(rangeland condition and trend)
Capacity of the land to carry stock
The Pastoral Board is required to specify a maximum stocking level for the lease and the lessee is not
permitted to exceed this figure without the prior permission of the Board Stock maxima determined under
the previous Act (Pastoral Act 1936) did not include an assessment of the condition of the land and were
often set at inappropriate levels The previous maximum figure has long been represented by the pastoral
industry as the actual carrying capacity of the lease
The Objects of the Act specify that the Pastoral Board must ensure that degradation does not or is not likely
to occur Maximum stocking levels for a lease are far from ideal as an effective method for ensuring that
pastoral land is not degraded as they do not provide for stocking levels in individual paddocks under a range
of condition classes and pasture components
Plate 2 Fenceline contrast resulting from different management practices
The evidence for appropriate long term stocking levels must come primarily from-
what the land has carried in the past without severe degradation
what successful management practices have been implemented for various pasture types
how management practices generally are related to the present land condition
For the first round of assessments the Board determined that the most recent 10 year stocking average
(which includes a range of seasonal conditions) plus 20 allowance for good seasons would provide the
basis of the maximum lease offer This had the effect of bringing a number of leases with unrealistic previous
maximums to a more realistic figure The Board has reviewed its approach (and policy) on the setting of stocking limits for round two however it acknowledges that lease stocking maxima are at best a ldquoblunt instrumentrdquo for use in managing land resources Short-term adjustment of paddock stock numbers appropriate for conditions is the most effective tool but a maximum provides a statutory limit and guide to numbers likely to be able to be carried in the best seasons The current method uses a combination of LCI results paddock condition ratings area and watered area The Board considers that a better way of setting stock maximum would be to do so based on the capability of each land type within its watered area However the current inventory of these resources is not accurate to the level required and steps are being taken to work towards the future use of such a method
Pastoral Lease Assessment Technical Manual for the Second round (2011)
10
LAND CONDITION INDEX
The land condition assessment of the various pasture types involves defining what constitutes an intact or
un-degraded landscape and deciding on the criteria that indicates to what degree disturbance has occurred
The PLMC Acts emphasis on indigenous plant species largely determines an on-ground approach as it is
necessary to ascertain the mix of plant species It is also important to determine if seedlings are present as
this helps to indicate whether the land has a capacity to rehabilitate in cases of past damage It is for this
reason that remote sensing techniques may not be appropriate to determine land condition in most parts of
the sheep pastoral areas according to the Act
The following processes were used in training and calibration for these assessments during the first round of
assessments
The process of land condition assessment involves a preliminary reconnaissance survey by senior scientific
officers to determine pasture types and condition criteria This is followed by a training period for field staff to
become fully competent in using these criteria in assessing the various land condition states
The purpose of this reconnaissance survey by senior officers is to
identify the various pasture types and the sub-units called pasture components that make up these
pasture types within the district
determine the criteria that will be used to identify three condition classes within each pasture
component
Only three land condition classes (1 = poor 2 = fair and 3 = good) are described as this limits the number of
choices and therefore reduces possible observer errors To avoid the influence of seasonal changes and
drought the criteria are based primarily on perennial vegetation components with erosion levels included where
applicable The issue of so-called opportunity country involving only ephemeral growth is dealt with separately
Each condition class for each pasture component is described according to key indicator plants
Photographs and written criteria are compiled that depict each of the three condition classes for each of the
pasture components The criteria and photo-standards are compiled into manuals which are subsequently
used by the assessment officers in carrying out the lease assessments
Field staff are trained in the field to recognise the various condition classes for each of the pasture
components to achieve a uniform standard and tested thereby ensuring that all staff will assess the
condition of land uniformly and without bias
Analysis of changes from round 1 to 2 on any particular station occurs and also changes on a station
comparative to the average change of each pasture type in a district
PHOTOPOINTS
Monitoring the condition and trend of land under various grazing practices is an important on-going
management tool Photopoints are established in most paddocks to provide an indication of these trends
Revisiting these sites enables the development of a photographic sequence supplemented by vegetation
and soil information to provide an objective record of change at a site The photopoint is a sample of land
condtion in a particular paddock where located in a typical area This objective data is used to support
subjective judgements on condition in a paddock and a station overall A photopoint can also be set up in
atypical areas to monitor a specific issue
The Pastoral Land Management group will carry out regular long term monitoring of these sites However it
is important that short-term seasonal changes are also recorded if possible Pastoralists are encouraged to
regularly monitor the photopoints and have been involved in the initial establishment of the sites During this
Pastoral Lease Assessment Technical Manual for the Second round (2011)
11
process the assessment techniques can be demonstrated and the photopoint method explained to ensure
the pastoralist is able to carry on with subsequent monitoring if he or she desires
Through combining short term and long-term records our understanding of ecosystems may be improved
and future grazing practices can be adapted to suit these trends Stock records for each paddock together
with climatic information observations of grazing on desirable plants germination events and other factors
will provide a valuable record that will assist in future decision making regarding the objectives of sustainable
use
Changes in the soil and vegetation components may follow
a fire
extreme seasons wet or dry
a marked change in vegetation cover
defoliation of chenopod shrubs (saltbush or bluebush)
establishment of new shrub seedlings
death of shrubs or trees
invasion by unpalatable plants
Access and relocation of existing photopoints (finding the site)
Sites are generally placed alongside station tracks for ease of relocation If a site is located on a now-unused track then be sure to note how to find the turn-off and any other important features The photopoint peg or post should in open country be visible from the track although it is desirable to place it far enough off the track to reduce the chance of it being driven over or destroyed by road maintenance or minor realignment Experience has shown that sites placed 10-50 metres from the track provide the best chance of not being damaged or rendered useless from road effects while still being easily accessible for revisits Careful recording of the GPS and distances is essential and will assist future assessors Use of hills and other features in a photo may assist in relocation
New Photopoints
Choosing the location for a new photopoint
The photopoint location will depend on the major objective for setting it up
To encourage pastoralists to monitor the sites they need to be easily locatable Record the distance from a
permanent feature eg gate or trough and if possible record the distance from the opposite direction Use
the GPS to capture co-ordinates for the site
The following factors should be considered when choosing a site particularly when monitoring grazing
impact
Distance from water
Grazing intensity of domestic stock decreases with distance from the permanent water source Choosing sites at a consistent distance from water allows for more effective comparison between sites Assessment sites for sheep stations are generally placed about 15 km from permanent water but more importantly should monitor areas where indicator species are still present or be expected to occur In cattle areas the site may be between 2-4 km from water Where an acceptable site does not occur at the desired distance personal judgement must be used in choosing the best location taking the above factors into consideration This may involve locating the site further or a little closer to the watering point or simply abandoning the attempt to locate a site out from that particular water (especially if another track or water in the paddock is also monitored)
Representation of a land unit
If establishing a new site in a paddock which does not have any existing sites this site should be located within a recognisable land unit that is typical of the paddock For example do not choose an isolated
Pastoral Lease Assessment Technical Manual for the Second round (2011)
12
bluebush patch if it is not typical of the paddock Avoid vegetation patches that are obviously atypical or are small areas of transition between communities The unit chosen must also be one that gives a good indication of grazing impact For example do not place a site in a very stable resilient vegetation type if the majority of the paddock or areas preferred by stock are much less resilient
Size and uniformity
The site should be uniform with respect to vegetation soil slope and aspect The more extensive the area of the site the better While a site might take observations of a radius of 200m an area of 100m radius should be considered a minimum but all observations must be made within uniform land typeunit Disturbed areas such as roadsides must not be considered
Other influencing factors
Other factors likely to bias or influence the site vegetation should be recognised and avoided where possible Avoid placing sites in the following situations
on a southern fence since sheep tend to graze into the wind and in most sheep - pastoral areas of SA the prevailing wind is from the south
sheep camp areas or where animals walk parallel to the track resulting in heavily tracking
mechanically disturbed areas
water run-on areas from tracks or where old track marks or erosion is evident
Photopoint setup
Directions to each photopoint should comprise a distance and direction from a known point such as a water
point A metal numbered disc on a polydropper fibreglass or steel rebar post (or wooden peg) marks each photopoint established during or before the first round (refer figure 3) This is referred to as the marker peg
However where the marker has disappeared or deteriorated new markers will consist of some more
permanentvisible materials
Figure 3 Diagram of a typical ldquoQSrdquoPhotopoint Monitoring site
Position the marker peg 10-50 m off the track in a clearly visible location that is not likely to be disturbed
However ensure the area to be monitored is free of vehicle track effects such as water flow stock
movement etc If the marker peg is positioned further than 50 m from the track position another directional
peg near the track and give clear directions on the site sheet to the location of the marker peg or post (ie
Pastoral Lease Assessment Technical Manual for the Second round (2011)
13
bearing and distance from 1st peg) Remember it may be some time before the site is re-visited and the site
is wasted if it can‟t be re-located
A second peg usually a jarrah peg is located approximately 17 paces from the marker peg This is referred to as the sighter peg This peg is positioned such that the photograph area does not include more than 13 skyline
and the bearing will follow the line of the Jessup transect A third peg is placed 100 m from the sighter and used
to mark the end of the Jessup transect Not all sites will have a Jessup transect
Locations of all photopoint sites will be recorded with a GPS from the vehicle and marked on the updated station
paddock plan
The photograph should be taken from the marker peg Record a compass bearing between the marker peg
and sighter peg If other photos are taken from the marker peg the bearing should be marked with an
additional sighter peg
Taking the photograph
Photos are taken with a digital SLR camera and with the zoom set to replicate the original 50mm lens
cameras Photos are taken in RAW format and downloaded daily To take the photograph stand behind the
marker peg and centre on the base of the sighter peg as shown in plate 5 and figure 4 Adjust focus to
infinity to ensure all of the transect is in focus
Plate 3 Taking a photograph
Figure 4 Directions for taking the photograph
Pastoral Lease Assessment Technical Manual for the Second round (2011)
14
RECORDING FIELD INFORMATION
Site description and location
Site sheets and the information collected have changed and evolved over the period of assessment An
example of the current site sheet is shown in appendix 1
Detailed below are the fields of information together with the type of detail that should be recorded Note Completed entry example shown in brackets (italics)
QS OB RS TS Prefix to describe type of photopoint followed by photopoint number
as per the disc (eg QS 2345)
QS - Quantitative site A pegged site used for monitoring vegetation
changes with Jessup andor step-point data (formerly photopoint -
PP)
OB - Observation site A pegged site used as an observation site to
monitor changes that can be detected by a photographic sequence
eg rehabilitation spread of erosion gullies Site description includes
a list of plant species but with no measured plant data collected
RS - Reference site Sites are in areas remote from grazing influence
greater than 5 km from water in sheep country and 8 km in cattle
country Also includes exclosure sites Complete all site description
and plant and soil sheets
TS - Type Site Designated for site characteristic of mapped land
system in early part of baseline assessment process As per OB but
sites were not usually pegged
PC ndash Photo Comparison Should be used strictly where a photo is to
be compared and data collected would not be required eg A
panorama on a hill top where species in the foreground are not
relevant to the background being monitored in a photo
All photopoints should be prefixed with QS OB RS PC or TS
DATE Day Month and Year (eg 01062007)
OBSERVERS Initials of persons involved in data collection Initials of the person
filling out the sheet first followed by second observer (egMTCB)
STATION Pastoral station name Use the full name of the station (eg
Bulgunnia)
PADDOCK Full paddock name may include subscript eg formerly part Cyclone
(Monsoon)
ZONE Grid reference zone generally on the bottom of the map (eg 54)
MAP SHEET Map sheet number 150000 five digits eg 66341 1100000 four
digits eg 5434 (66341)
EASTING amp NORTHING Co-ordinates on GPS Unit
Pastoral Lease Assessment Technical Manual for the Second round (2011)
15
DATUM GDA 94
SERIES Refers to the filing system for photopoint photograph series for the
station indicates the station with the month amp year the photo was
taken First four spaces are for the station (or trip name) abbreviated
to the first four letters eg Bulg for Bulgunnia Next two are digits for the month followed by two digits for the year eg (Bulg 0691)
DIGITAL Image number
WATERPOINT Name of nearest permanent water source by direct route as a sheep
would walk Note type also eg dam trough tank (Moonbi Tank)
DISTANCE (km) Distance (to one decimal point) to water source named above ie by
direct route as a sheep would walk Record the straight-line distance from the GPS (eg 16 km)
CONDITION Condition rating for the site as per condition rating guidelines Refer to
appendix 2 for condition class attributes Notes on attributes in the site comments will help to support this judgement (eg Good)
MUD MAP Diagram of how to relocate the site clearly labelled with distances
Include paddock name and adjacent paddocks track location and
gate zero origin water location site number Orient the map with
north to the top of the page
MUD MAP COMMENTS Clear directions on how to relocate the site completed according to
the following format Keep in mind that this will be printed out for the
lessee
Distance from gate or trough direction on track to next bore or
paddock along fence Place where zero taken from eg tank trough
gate - be specific What type of peg or marker was used and how far it
is off the track and in what direction Distance to sighter peg and
bearing Jessup transect length (normally 100m) and bearing from sighter peg (Use tripmeter if no Halda rally meter or similar)
Example mud map comments (15 km south of Twin Well on track to Gladstone Bore or 35km north
of gate from Dusty paddock Zero at trough Jarrah peg and disc at 15 paces east of track Sighter peg (jarrah) at 17 paces bearing 90deg Jessup transect 100 m x 2 m x 2 at 90deg end marked by jarrah peg)
EROSION Record the severity and type of erosion according to the table in
appendix 4
COMMENTS Record notes that help to further explain observations or that will
assist interpretation of the data for present and future observations
This should include notes to indicate why the site was established and
what it is monitoring It should also include notes that help explain the
condition rating and current impacts or changes including erosion
Data entry Initials of person who entered data on the database and the date of
entry (egCB 5391)
Pastoral Lease Assessment Technical Manual for the Second round (2011)
16
Establishing new sites The site details below are only relevant for new sites set up as part of the second assessmentndash not used for revisits as part of the second round
LAND SYSTEM Land system name taken from land system map (egWeedna)
ROCK TYPE Name of rock type from geological map or rock type identified at site if
geology map incorrect (egred sandstone)
FORMATION Name of rock formation from geological map (egPound Quartzite)
LANDFORM SLOPE Slope of the site measured in degrees by use of clinometer
Do not confuse degrees with (eg2deg)
ELEMENT Landform element of site
1 crest curved in down slope profile and margins at limit of observed
curvature
2 slope considered as planar Note in comments if upper mid or
lower slope
3 flat planar
4 depression may be open or closed
PATTERN Term to describe the landform type eg alluvial plain = ALP See
appendix 3 for abbreviations and descriptions (egALP)
Pastoral Lease Assessment Technical Manual for the Second round (2011)
17
Vegetation
SIGNIFICANT RAIN Yes - data collection following rains that resulted in green ephemeral
response record dates if known of significant falls
No - dry ephemeral growth only
TYPE S (summer) - rain fell between November and March
W (winter) - rain fell between April and October
I (indistinguishable) - cannot tell if resultant green ephemeral growth is
from summer or winter rain events or is a combination of both
VEGETATION SPECIES Effort should be made to record all plant species throughout the site
Recording plant species should be carried out until most species are
recorded (ie until a period of minutes elapses before further species
are not found) Record full species name on the site sheet
If plant species is not known collect a specimen fill out details in the
herbarium collection booklet and include photopoint number and line
number of record on sheet eg 234512 so that this number can be
entered on subsequent site sheets Put the herbarium label with the
specimen in the plant press Keep a list of plants collected and PPline
number so that you can give this number to collected species at other
sites Update the site sheet with the correct species name when it
comes back from the herbarium or identity confirmed
DOM Dominant species This will be used to classify vegetation
associationsgroups
1 visually pre-dominant species forming the tallest stratum CSR
class should exceed 1 (CSR 2-6)
2 if another tallest stratum species is present (co-dominant) it is
selected OR if absent the most abundant understorey species is selected eg Mai sed
3 selected from any stratum usually a lower stratum as an indicator
species (that is a species of known environmental preferences or
of such abundance that it can‟t be ignored) or to distinguish between associations eg Atr ves
4 other conspicuous species to separate associations eg Scl obl
GRAZED If a plant is obviously grazed tick the box If grazing is mainly by
rabbits or goats this should be noted in the comments
RESPROUT If the plant has previously been grazed back and is now showing fresh
new growth tick the box Note extent in comments eg Atr ves adults
showing abundant new growth following recent rains
RECRUITMENT If seedlings are evident or new suckers (eg Bullock bush) tick the
box Note height of seedlings in comments eg Mai sed seedlings to
5 cm abundant in open areas
FRUIT If the plant is in fruit tick the box This will enable data collection on
best times for seed collection Record relevant notes in comments
Pastoral Lease Assessment Technical Manual for the Second round (2011)
18
Crown Separation Ratio (CSR) The average distance between crowns divided by the average size of
the crown grouped into various size classes (see appendix 5)
1 present lt 12 plants in 200 m radii
2 isolated clumps gt20 CSR clumps of two to five woody plants 200
m further apart
3 isolated plants gt20 CSR trees gt100 m apart
4 very sparse 6-20 CSR crowns well separated
5 sparse 1-5 CSR crowns clearly separated
6 mid dense 0-09 CSR crowns touching to slightly separated
7 closed or dense crowns touching to over lapping
JESSUP Refers to the results of the Jessup transect (see section 81
for more details)
See appendix 6 for Jessup transect recording sheet Record total
counts from the Jessup transect field sheet for each species adult
and juvenile
FIRE SCARS Yes - fire scars evident on stumps trees or fence posts Fire scars
should be recorded if fire occurred since the first assessment
No - no fire scars visible
Last burn - date of last known fire Check with the lessee and record
further details in the comments eg fierce summer fire burnt out NW
corner killing all mulga
Pastoral Lease Assessment Technical Manual for the Second round (2011)
19
Vertebrates
VERTEBRATES Presentabsent for dung tracks browsed vegetation burrows
throughout the site
It is only necessary to record current or fresh activity and record as
presence (P) Old or past activity should be noted in the comments
Table 1 Vertebrate pests
Animal Sighted Dung Tracks Browse BurrowsCamp
Rabbit visual sighting fresh buck
heaps
scratchings
present
graze line with chisel
marks on stems
warren heaps
marks
warren active
Sheep visual sighting fresh dung
active padding recent grazing camps
Cattle visual sighting fresh dung active padding recent grazing camps
Goats visual sighting fresh dung active padding browse shrubs
Note in comments
height of browse line
camps
Roos visual sighting fresh dung active padding recent grazing
(check for tail drag)
camphollows
other
Others include fox cat dingo camel horse wombat etc
Note any other useful information in the general comments for example mob of 200 goats sighted More
detailed comments can be included if needed in the paddock description
Pastoral Lease Assessment Technical Manual for the Second round (2011)
20
DENSITY MEASUREMENT OF PERENNIAL PLANT SPECIES
Perennial plants provide stability to grazing management systems due to their ability to persist during dry
periods consequently the measurement of plant attributes such as density and frequency of perennials
particularly those which are palatable are important in understanding plant dynamics and rangeland condition
Plant counts within fixed belt transects have been used to determine the density of shrubs and repeated
measurements allows density changes to be detected To ensure that observer error is minimised it is vital that
the same technique and standards are used in repeat measurements Modifications made in 1990 enabled
changes to be isolated to discreet quadrats and recruitment and deaths of cohorts can be followed
Jessup transect
This method incorporates a belt transect (a standard ecological technique) that is based on an original
survey technique used for chenopod shrublands by Jessup (1951) and further developed by Lay (1979)
Their technique involved driving a vehicle over a site for a set distance and shrubs occurring within the wheel
marks (representing the belt transect) were recorded This rather destructive technique is now simulated by
a fixed 4 m x 100 m transect and enables a density and frequency estimate of perennials for each site The
frequency estimates are not based on the optimum quadrat size for all species and the 10 m x 2 m quadrats
used should not be taken to represent true frequency readings It should also be noted that species
composition by frequency is not equivalent to composition by cover or density The length of some early
transects has varied from the current standard so ensure that any future comparisons use the same transect
configuration (see 821below)
The Jessup transect method measures the density (shrubsarea) and frequency of perennial plants at sites
where perennial cover occurs ie chenopods other shrubs and tussock (perennial) grasses Counting age
classes of shrubs (adultjuvenile) gives further information on population changes Monitoring over time
provides an indication of recruitment trends
Recording is based on all perennial shrubs within the transect being recorded by species and age class
(adultjuvenile) If the base of the plant is in the transect it is counted If the foliage only is in the transect it is
not counted
Transect layout
Jessup transects are permanently marked and comprise
transects 100 m x 2 m x 2 (see figure 5)
recordings separated into 10 m x 2 m blocks
identification of perennial plant species
less than 10 cm high andor non woody base = juvenile
more than 20 individual juvenile bushes or perennial grasses per 10 m x 2 m block = 20+ recording
1 Transects should include only one land unit and preferably be restricted to one element for data
analysis Transects are 100m long and generally at right angles to the track Walk the length of the
transect to ensure it is suitable before setting up the site and identify and discuss species present
with the other observers
2 Record a compass bearing for the transect
3 Secure a surveyors tape (marked into 10 m segments) to the sighter peg and lay out the tape to 100
m keeping the marker and sighter pegs in line
4 Check that the tape is in line with the sighter and marker peg Tension the tape and drive in the peg at the 100 m mark and secure tape to the peg It is important to have the tape extended to full
100m and tight and straight so that data is replicated at the quadrat level
Pastoral Lease Assessment Technical Manual for the Second round (2011)
21
5 If the transect layout is normal note this on the sheet if different note the transect layout on the site
description sheet and orient diagram with north to the top of the page Give clear legible directions
and bearings
Figure 5 Jessup transect layout
Recording a Jessup transect
1 Use a surveyors tape that is clearly marked into 10 m intervals If it is marked with tape check that
this has not slipped from the 10 m graduations Counts should be recorded on a Jessup transect
data sheet (see appendix 6)
2 Commence transect on left side of tape (UP) using 2 m rod (refer plate below) Check that the rod is
2 m A two metre curtain pole is ideal for this
Plate 4 Recording a Jessup transect
3 Identify each perennial species If in doubt collect a specimen
4 Easiest operation is with one person observing (counting) and another recording and acting as a
checking observer The recorder (scribe) stands at the 10 m marker intervals and the observer calls
out the adultjuvenile strikes along each 10 m transect interval The recorder can assist by spotting
hidden plants and small juvenile plants
5 For plants on quadrat margins include only in the quadrat where the rooted stem is located Count
plants only if they are more than 50 rooted within the quadrat
6 Chenopods occur in clumps and it is difficult to distinguish individuals for this reason clumps are
recorded and are recognised as individual clumps if there is more than a 30 cm gap between the
rooted stems Criteria for counting plants growing close together are as follows
End peg Sighter peg Site marker amp disc
11 12 13 14 15 16 17 18 19 20
10 9 8 7 6 5 4 3 2 1
100 m
4 m
Pastoral Lease Assessment Technical Manual for the Second round (2011)
22
distinguish between individual clumps if there is more than a 30 cm gap between rooted stems
if crowns are distinct and bases are less than 30 cm apart count each as an individual
if crowns are touching or overlapping and gap between rooted stems is less than 30 cm count
as one clump
Note In cases of perennial plants such as low bluebush being grazed the reduction of the crown
may lead to higher count of bush numbers Care is required when comparing existing Jessup counts
and noted should be recorded if this type of splitting has occurred
7 Record juveniles as plants less than 10 cm high or wide and not woody However if obviously old
woody plants are grazed back to less then this size record as adults but make comment
accordingly
If greater than 20 juvenile individuals of any species encountered in 10m interval (quadrat) record as
20+ This avoids attempting to count up to 200 seedlings but still provides sufficient data to interpret
that recruitment is occurring Large numbers of seedlings can occur following favourable conditions
and it becomes difficult to count all of these However where feasible a total count of juveniles
should be undertaken
8 For perennial grasses record clumps if greater than 10 cm high or 10 cm wide ie no juvenile
categories Record count as 20 + if greater than 20 individuals within one 10 m x 2 m block This is
to aid interpretation of step-point cover data eg low density but high cover implies large spreading
individuals high density but low cover may imply a grazing effect - site comments should indicate
this The quadrat sizes are not well suited to grasses but do provide an indication of the level of
grasses within a shrubland
9 Do not record dead or completely defoliated bushes but note occurrence in comments
10 Proceed to end of transect and commence quadrats 11-20 (ie 100-0m) on other side of tape
(down)
11 Record minor site variations in comments relating to quadrat intervals eg 20-30m large scaled area
Pastoral Lease Assessment Technical Manual for the Second round (2011)
23
DATABASE AND GIS ndash needs update for ALIS and FDE
Site information is currently entered into the Arid Lands Information System (ALIS) and print-outs and
photographs are supplied to the lessee for every photopoint on the station in the form of a Photopoint
Manual
In 1991 the Geographic Analysis and Research Unit (GAR) of the Department of Housing and Urban
Development has been assisting the Pastoral Management Branch in the establishment and maintenance of
a Pastoral Geographic Information System (Malcolm and Nicolson 1995) The GAR unit operates a
centralised ARCINFO (Environmental Systems Research Institute USA) GIS facility and is the
Environmental Node of South Australia‟s Land Information System
Extensive development was carried out on ALIS and while operational is still undergoing some further
development Management of this system is though Client Services in DENR in collaboration with the
Pastoral Program Development of a system for field data entry onto GETEC tablets has been completed
and is undergoing transition into the operational phase This will improve data collection with validation in the
field and also allow considerable time saving and possible transposition errors removing one stage in the
data entry process
Lease infrastructure information is derived from a number of sources that vary in age scale and accuracy
During the assessment process topographic maps are used as a base map and information is checked
corrected of altered using various techniques Prior to the introduction of Global Positioning Systems (GPS)
in 1992 the information was collected using bearing and distance measurement that were plotted onto base
maps The improved accuracy of GPS units over time has allowed increased accuracy and therefore an
improved mapping product
Lease maps and land system maps are available as hard copy products Watered areas for each paddock
can also be produced that indicate the extent that the lease is utilised by stock Undisturbed areas represent
quality wildlife habitats and further investigations are required to study the relationships between stocking
intensity land condition and wildlife habitat More detailed information can be found in Malcolm and
Nicolson (1995)
POST TRIP PROCEEDURE
The following checklist should be completed after each trip
Download photos and GPS co-ordinates
Data entry
Update photopoint manual and make 2 copies
Conduct LCI peer review
All spatial updates sent to GIS DWLBC
Write draft Assessment report
Submit for review
Pastoral Lease Assessment Technical Manual for the Second round (2011)
CONDITION CLASS
ATTRIBUTE EXCELLENT GOOD FAIR POOR VERY POOR
PLANT SPECIES
COMPOSITION
maximum diversity of
annual and perennial
species possible for the
land type
perennial species of
various ages
some reduction in density
of palatable and
susceptible perennials
increased proportion of
shorter lived species
perennial species of
various ages
significantly reduced
cover density andor
regeneration of
palatable species
establishment of less
preferred or
unpalatable species
dominance of annual and
ephemeral species and
perennials with relatively
low palatability
no regeneration of
desirable perennial
species existing stands
degenerate
seasonal cover of
only pioneer
ephemerals or
unpalatable weeds
large areas totally
unproductive
PLANT
PRODUCTIVITY
at full potential
sustained productivity
annual com unities
maintain litter cover but
not production in dry
seasons
some fluctuation lower in
drought and may be
higher than site potential
for some species eg
Mitchell grass
reduced overall high
productivity in good
season
low in drought
(fluctuates markedly
with season)
impaired productivity
very seasonally
dependant low or non
existent in dry seasons
areas incapable of
any plant growth
SOIL EROSION
STATUS
no erosion (other than
natural features or
processes)
plant and litter cover
protect soil from wind
and water in all
seasons
minor or slight erosion
evident
increased susceptibility of
soils to erosion in dry
seasons
moderate erosion
evident
reduced density and
cover of perennial and
litter increases
susceptibility of soils to
erosion in most
seasons
severe erosion overall
high susceptibility of soils
to erosion in all seasons
extent of past erosion
renders site susceptible
to further soil movement
if grazed at any level
unstable severely
or very eroded
Pastoral Lease Assessment Technical Manual for the Second round (2011)
Appendix 1 Erosion severitytype intensity criteria ndashfor reference to first round data sheets
EROSION SeverityType intensity criteria + RATING (max 200 m radius)
NO ACCELERATED EROSION 00
SLIGHT EROSION (10 of site affected)
slight accumulation of wind blown soil and plant bases and other obstacles 11
removal of finer soil particles evident but soil crust is largely intact 12
occasional rills (lt300 mm deep) evident 13
no gullies present 14
a few scalds present usually less than 2 m in diameter 15
MINOR EROSION (10-25 of site affected)
accumulation of soil around plant bases with plant mounds noticeably enlarged 21
evidence of pedestalling but soil loss minor and plant bases not greatly elevated 22
breaking of surface crust with small erosion faces and some redistribution of soil and
or some rilling evident 23
occasional shallow gullies only 24
scalding evident but scalds relatively small and discontinuous 25
MODERATE EROSION (25-50 of site affected)
wind piling around plant bases and other obstacles is common but no plants completely covered 31
pedestalling apparent with plant bases distinctly raised and with obvious
soil loss and deflation in parts 32
surface sheeting andor rilling common with erosion faces (andor micro-
terracing) and active redistribution of soil 33
gullying present on parts of the site 34
numerous small scalds common andor with a tendency to coalesce to form larger scalds in parts 35
SEVERE EROSION (50-75 of site affected)
extreme hummocking around plants and other obstacles some plants completely covered 41
severe pedestalling with plant bases greatly elevated and major soil loss
from deflation andor much of surface generally unstable with ripple marks 42
major rilling or surface sheeting with extensive exposure of subsoil or parent material
erosion faces (andor microterracing) and active redistribution of soil 43
widespread gullying 44
scalding extensive smaller scalds have coalesced to form large more or
less continuous scalded areas 45
EXTREME EROSION (75-100 of site affected)
general surface movement area more or less bare with formation of shifting dunes 51
most of original land surface altered any last remnants of original soil or
vegetation standing as sentinels in a barren landscape 52
water sheeting andor rilling coalesced to expose subsoil or parent material 53
extensive gullying 54
scalding more or less continuous over large areas 55
Note Record severity first and then type eg 53 = Extreme erosionScalding
Pastoral Lease Assessment Technical Manual for the Second round (2011)
Appendix 2 Crown Separation Ratio
This is a visual estimate of plant cover
It is the average distance between crowns (the area the plant takes up if viewed from above) divided by the
average size of the crown In the field this means visualising how many crowns of a given plant species can be fitted in between the distance to the nearest neighbour of that species on average over the site The
classes are as follows
CLASS TERM CSR FIELD CRITERIA
1 Present lt 12 plants lt12 plants within 200 m radius
2 Isolated clumps gt20 spaces Isolated clumps of two to five woody plants 200 m
further apart
3 Isolated Plants gt20 spaces Isolated plants
4 Very Sparse 6-20 spaces well spaced crowns well separated
5 Sparse 1-5 spaces clearly spaced crowns clearly separated
6 Mid dense 0-09 spaces crowns touching to slight separation
7 Closed or dense 0 crowns touching to overlapping
Modified from Table 14 McDonald (1990)
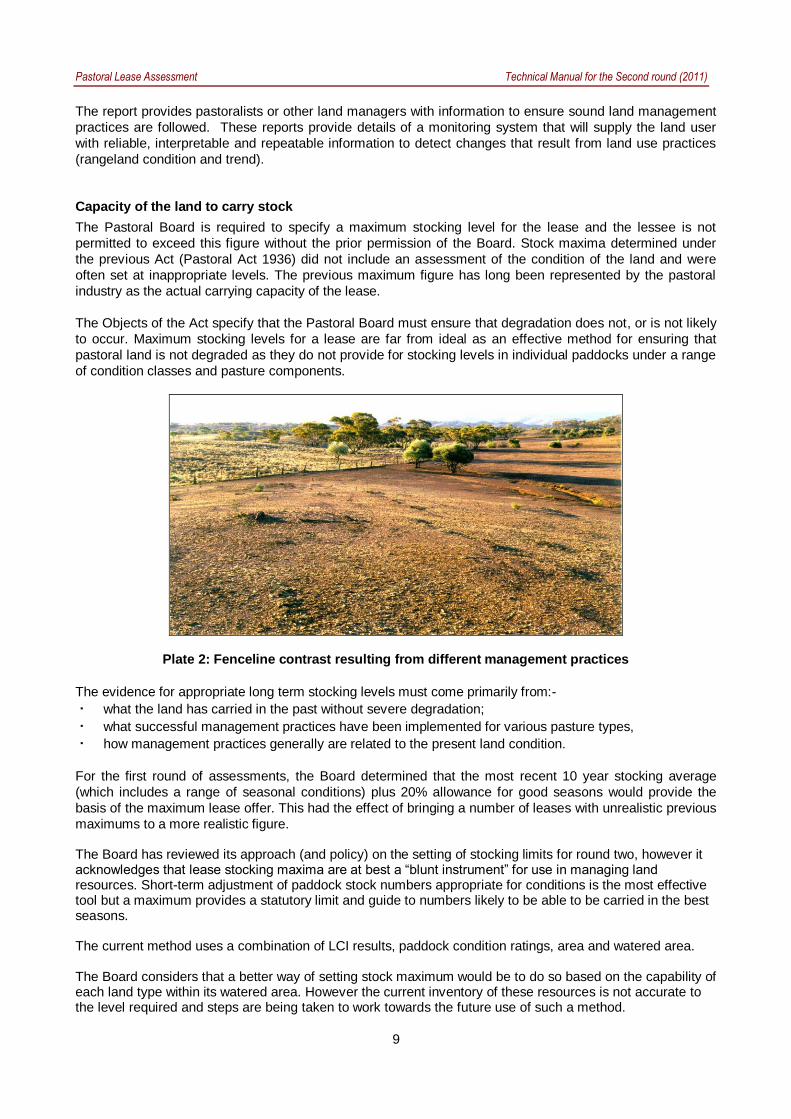
Pastoral Lease Assessment Technical Manual for the Second round (2011)
10
LAND CONDITION INDEX
The land condition assessment of the various pasture types involves defining what constitutes an intact or
un-degraded landscape and deciding on the criteria that indicates to what degree disturbance has occurred
The PLMC Acts emphasis on indigenous plant species largely determines an on-ground approach as it is
necessary to ascertain the mix of plant species It is also important to determine if seedlings are present as
this helps to indicate whether the land has a capacity to rehabilitate in cases of past damage It is for this
reason that remote sensing techniques may not be appropriate to determine land condition in most parts of
the sheep pastoral areas according to the Act
The following processes were used in training and calibration for these assessments during the first round of
assessments
The process of land condition assessment involves a preliminary reconnaissance survey by senior scientific
officers to determine pasture types and condition criteria This is followed by a training period for field staff to
become fully competent in using these criteria in assessing the various land condition states
The purpose of this reconnaissance survey by senior officers is to
identify the various pasture types and the sub-units called pasture components that make up these
pasture types within the district
determine the criteria that will be used to identify three condition classes within each pasture
component
Only three land condition classes (1 = poor 2 = fair and 3 = good) are described as this limits the number of
choices and therefore reduces possible observer errors To avoid the influence of seasonal changes and
drought the criteria are based primarily on perennial vegetation components with erosion levels included where
applicable The issue of so-called opportunity country involving only ephemeral growth is dealt with separately
Each condition class for each pasture component is described according to key indicator plants
Photographs and written criteria are compiled that depict each of the three condition classes for each of the
pasture components The criteria and photo-standards are compiled into manuals which are subsequently
used by the assessment officers in carrying out the lease assessments
Field staff are trained in the field to recognise the various condition classes for each of the pasture
components to achieve a uniform standard and tested thereby ensuring that all staff will assess the
condition of land uniformly and without bias
Analysis of changes from round 1 to 2 on any particular station occurs and also changes on a station
comparative to the average change of each pasture type in a district
PHOTOPOINTS
Monitoring the condition and trend of land under various grazing practices is an important on-going
management tool Photopoints are established in most paddocks to provide an indication of these trends
Revisiting these sites enables the development of a photographic sequence supplemented by vegetation
and soil information to provide an objective record of change at a site The photopoint is a sample of land
condtion in a particular paddock where located in a typical area This objective data is used to support
subjective judgements on condition in a paddock and a station overall A photopoint can also be set up in
atypical areas to monitor a specific issue
The Pastoral Land Management group will carry out regular long term monitoring of these sites However it
is important that short-term seasonal changes are also recorded if possible Pastoralists are encouraged to
regularly monitor the photopoints and have been involved in the initial establishment of the sites During this
Pastoral Lease Assessment Technical Manual for the Second round (2011)
11
process the assessment techniques can be demonstrated and the photopoint method explained to ensure
the pastoralist is able to carry on with subsequent monitoring if he or she desires
Through combining short term and long-term records our understanding of ecosystems may be improved
and future grazing practices can be adapted to suit these trends Stock records for each paddock together
with climatic information observations of grazing on desirable plants germination events and other factors
will provide a valuable record that will assist in future decision making regarding the objectives of sustainable
use
Changes in the soil and vegetation components may follow
a fire
extreme seasons wet or dry
a marked change in vegetation cover
defoliation of chenopod shrubs (saltbush or bluebush)
establishment of new shrub seedlings
death of shrubs or trees
invasion by unpalatable plants
Access and relocation of existing photopoints (finding the site)
Sites are generally placed alongside station tracks for ease of relocation If a site is located on a now-unused track then be sure to note how to find the turn-off and any other important features The photopoint peg or post should in open country be visible from the track although it is desirable to place it far enough off the track to reduce the chance of it being driven over or destroyed by road maintenance or minor realignment Experience has shown that sites placed 10-50 metres from the track provide the best chance of not being damaged or rendered useless from road effects while still being easily accessible for revisits Careful recording of the GPS and distances is essential and will assist future assessors Use of hills and other features in a photo may assist in relocation
New Photopoints
Choosing the location for a new photopoint
The photopoint location will depend on the major objective for setting it up
To encourage pastoralists to monitor the sites they need to be easily locatable Record the distance from a
permanent feature eg gate or trough and if possible record the distance from the opposite direction Use
the GPS to capture co-ordinates for the site
The following factors should be considered when choosing a site particularly when monitoring grazing
impact
Distance from water
Grazing intensity of domestic stock decreases with distance from the permanent water source Choosing sites at a consistent distance from water allows for more effective comparison between sites Assessment sites for sheep stations are generally placed about 15 km from permanent water but more importantly should monitor areas where indicator species are still present or be expected to occur In cattle areas the site may be between 2-4 km from water Where an acceptable site does not occur at the desired distance personal judgement must be used in choosing the best location taking the above factors into consideration This may involve locating the site further or a little closer to the watering point or simply abandoning the attempt to locate a site out from that particular water (especially if another track or water in the paddock is also monitored)
Representation of a land unit
If establishing a new site in a paddock which does not have any existing sites this site should be located within a recognisable land unit that is typical of the paddock For example do not choose an isolated
Pastoral Lease Assessment Technical Manual for the Second round (2011)
12
bluebush patch if it is not typical of the paddock Avoid vegetation patches that are obviously atypical or are small areas of transition between communities The unit chosen must also be one that gives a good indication of grazing impact For example do not place a site in a very stable resilient vegetation type if the majority of the paddock or areas preferred by stock are much less resilient
Size and uniformity
The site should be uniform with respect to vegetation soil slope and aspect The more extensive the area of the site the better While a site might take observations of a radius of 200m an area of 100m radius should be considered a minimum but all observations must be made within uniform land typeunit Disturbed areas such as roadsides must not be considered
Other influencing factors
Other factors likely to bias or influence the site vegetation should be recognised and avoided where possible Avoid placing sites in the following situations
on a southern fence since sheep tend to graze into the wind and in most sheep - pastoral areas of SA the prevailing wind is from the south
sheep camp areas or where animals walk parallel to the track resulting in heavily tracking
mechanically disturbed areas
water run-on areas from tracks or where old track marks or erosion is evident
Photopoint setup
Directions to each photopoint should comprise a distance and direction from a known point such as a water
point A metal numbered disc on a polydropper fibreglass or steel rebar post (or wooden peg) marks each photopoint established during or before the first round (refer figure 3) This is referred to as the marker peg
However where the marker has disappeared or deteriorated new markers will consist of some more
permanentvisible materials
Figure 3 Diagram of a typical ldquoQSrdquoPhotopoint Monitoring site
Position the marker peg 10-50 m off the track in a clearly visible location that is not likely to be disturbed
However ensure the area to be monitored is free of vehicle track effects such as water flow stock
movement etc If the marker peg is positioned further than 50 m from the track position another directional
peg near the track and give clear directions on the site sheet to the location of the marker peg or post (ie
Pastoral Lease Assessment Technical Manual for the Second round (2011)
13
bearing and distance from 1st peg) Remember it may be some time before the site is re-visited and the site
is wasted if it can‟t be re-located
A second peg usually a jarrah peg is located approximately 17 paces from the marker peg This is referred to as the sighter peg This peg is positioned such that the photograph area does not include more than 13 skyline
and the bearing will follow the line of the Jessup transect A third peg is placed 100 m from the sighter and used
to mark the end of the Jessup transect Not all sites will have a Jessup transect
Locations of all photopoint sites will be recorded with a GPS from the vehicle and marked on the updated station
paddock plan
The photograph should be taken from the marker peg Record a compass bearing between the marker peg
and sighter peg If other photos are taken from the marker peg the bearing should be marked with an
additional sighter peg
Taking the photograph
Photos are taken with a digital SLR camera and with the zoom set to replicate the original 50mm lens
cameras Photos are taken in RAW format and downloaded daily To take the photograph stand behind the
marker peg and centre on the base of the sighter peg as shown in plate 5 and figure 4 Adjust focus to
infinity to ensure all of the transect is in focus
Plate 3 Taking a photograph
Figure 4 Directions for taking the photograph
Pastoral Lease Assessment Technical Manual for the Second round (2011)
14
RECORDING FIELD INFORMATION
Site description and location
Site sheets and the information collected have changed and evolved over the period of assessment An
example of the current site sheet is shown in appendix 1
Detailed below are the fields of information together with the type of detail that should be recorded Note Completed entry example shown in brackets (italics)
QS OB RS TS Prefix to describe type of photopoint followed by photopoint number
as per the disc (eg QS 2345)
QS - Quantitative site A pegged site used for monitoring vegetation
changes with Jessup andor step-point data (formerly photopoint -
PP)
OB - Observation site A pegged site used as an observation site to
monitor changes that can be detected by a photographic sequence
eg rehabilitation spread of erosion gullies Site description includes
a list of plant species but with no measured plant data collected
RS - Reference site Sites are in areas remote from grazing influence
greater than 5 km from water in sheep country and 8 km in cattle
country Also includes exclosure sites Complete all site description
and plant and soil sheets
TS - Type Site Designated for site characteristic of mapped land
system in early part of baseline assessment process As per OB but
sites were not usually pegged
PC ndash Photo Comparison Should be used strictly where a photo is to
be compared and data collected would not be required eg A
panorama on a hill top where species in the foreground are not
relevant to the background being monitored in a photo
All photopoints should be prefixed with QS OB RS PC or TS
DATE Day Month and Year (eg 01062007)
OBSERVERS Initials of persons involved in data collection Initials of the person
filling out the sheet first followed by second observer (egMTCB)
STATION Pastoral station name Use the full name of the station (eg
Bulgunnia)
PADDOCK Full paddock name may include subscript eg formerly part Cyclone
(Monsoon)
ZONE Grid reference zone generally on the bottom of the map (eg 54)
MAP SHEET Map sheet number 150000 five digits eg 66341 1100000 four
digits eg 5434 (66341)
EASTING amp NORTHING Co-ordinates on GPS Unit
Pastoral Lease Assessment Technical Manual for the Second round (2011)
15
DATUM GDA 94
SERIES Refers to the filing system for photopoint photograph series for the
station indicates the station with the month amp year the photo was
taken First four spaces are for the station (or trip name) abbreviated
to the first four letters eg Bulg for Bulgunnia Next two are digits for the month followed by two digits for the year eg (Bulg 0691)
DIGITAL Image number
WATERPOINT Name of nearest permanent water source by direct route as a sheep
would walk Note type also eg dam trough tank (Moonbi Tank)
DISTANCE (km) Distance (to one decimal point) to water source named above ie by
direct route as a sheep would walk Record the straight-line distance from the GPS (eg 16 km)
CONDITION Condition rating for the site as per condition rating guidelines Refer to
appendix 2 for condition class attributes Notes on attributes in the site comments will help to support this judgement (eg Good)
MUD MAP Diagram of how to relocate the site clearly labelled with distances
Include paddock name and adjacent paddocks track location and
gate zero origin water location site number Orient the map with
north to the top of the page
MUD MAP COMMENTS Clear directions on how to relocate the site completed according to
the following format Keep in mind that this will be printed out for the
lessee
Distance from gate or trough direction on track to next bore or
paddock along fence Place where zero taken from eg tank trough
gate - be specific What type of peg or marker was used and how far it
is off the track and in what direction Distance to sighter peg and
bearing Jessup transect length (normally 100m) and bearing from sighter peg (Use tripmeter if no Halda rally meter or similar)
Example mud map comments (15 km south of Twin Well on track to Gladstone Bore or 35km north
of gate from Dusty paddock Zero at trough Jarrah peg and disc at 15 paces east of track Sighter peg (jarrah) at 17 paces bearing 90deg Jessup transect 100 m x 2 m x 2 at 90deg end marked by jarrah peg)
EROSION Record the severity and type of erosion according to the table in
appendix 4
COMMENTS Record notes that help to further explain observations or that will
assist interpretation of the data for present and future observations
This should include notes to indicate why the site was established and
what it is monitoring It should also include notes that help explain the
condition rating and current impacts or changes including erosion
Data entry Initials of person who entered data on the database and the date of
entry (egCB 5391)
Pastoral Lease Assessment Technical Manual for the Second round (2011)
16
Establishing new sites The site details below are only relevant for new sites set up as part of the second assessmentndash not used for revisits as part of the second round
LAND SYSTEM Land system name taken from land system map (egWeedna)
ROCK TYPE Name of rock type from geological map or rock type identified at site if
geology map incorrect (egred sandstone)
FORMATION Name of rock formation from geological map (egPound Quartzite)
LANDFORM SLOPE Slope of the site measured in degrees by use of clinometer
Do not confuse degrees with (eg2deg)
ELEMENT Landform element of site
1 crest curved in down slope profile and margins at limit of observed
curvature
2 slope considered as planar Note in comments if upper mid or
lower slope
3 flat planar
4 depression may be open or closed
PATTERN Term to describe the landform type eg alluvial plain = ALP See
appendix 3 for abbreviations and descriptions (egALP)
Pastoral Lease Assessment Technical Manual for the Second round (2011)
17
Vegetation
SIGNIFICANT RAIN Yes - data collection following rains that resulted in green ephemeral
response record dates if known of significant falls
No - dry ephemeral growth only
TYPE S (summer) - rain fell between November and March
W (winter) - rain fell between April and October
I (indistinguishable) - cannot tell if resultant green ephemeral growth is
from summer or winter rain events or is a combination of both
VEGETATION SPECIES Effort should be made to record all plant species throughout the site
Recording plant species should be carried out until most species are
recorded (ie until a period of minutes elapses before further species
are not found) Record full species name on the site sheet
If plant species is not known collect a specimen fill out details in the
herbarium collection booklet and include photopoint number and line
number of record on sheet eg 234512 so that this number can be
entered on subsequent site sheets Put the herbarium label with the
specimen in the plant press Keep a list of plants collected and PPline
number so that you can give this number to collected species at other
sites Update the site sheet with the correct species name when it
comes back from the herbarium or identity confirmed
DOM Dominant species This will be used to classify vegetation
associationsgroups
1 visually pre-dominant species forming the tallest stratum CSR
class should exceed 1 (CSR 2-6)
2 if another tallest stratum species is present (co-dominant) it is
selected OR if absent the most abundant understorey species is selected eg Mai sed
3 selected from any stratum usually a lower stratum as an indicator
species (that is a species of known environmental preferences or
of such abundance that it can‟t be ignored) or to distinguish between associations eg Atr ves
4 other conspicuous species to separate associations eg Scl obl
GRAZED If a plant is obviously grazed tick the box If grazing is mainly by
rabbits or goats this should be noted in the comments
RESPROUT If the plant has previously been grazed back and is now showing fresh
new growth tick the box Note extent in comments eg Atr ves adults
showing abundant new growth following recent rains
RECRUITMENT If seedlings are evident or new suckers (eg Bullock bush) tick the
box Note height of seedlings in comments eg Mai sed seedlings to
5 cm abundant in open areas
FRUIT If the plant is in fruit tick the box This will enable data collection on
best times for seed collection Record relevant notes in comments
Pastoral Lease Assessment Technical Manual for the Second round (2011)
18
Crown Separation Ratio (CSR) The average distance between crowns divided by the average size of
the crown grouped into various size classes (see appendix 5)
1 present lt 12 plants in 200 m radii
2 isolated clumps gt20 CSR clumps of two to five woody plants 200
m further apart
3 isolated plants gt20 CSR trees gt100 m apart
4 very sparse 6-20 CSR crowns well separated
5 sparse 1-5 CSR crowns clearly separated
6 mid dense 0-09 CSR crowns touching to slightly separated
7 closed or dense crowns touching to over lapping
JESSUP Refers to the results of the Jessup transect (see section 81
for more details)
See appendix 6 for Jessup transect recording sheet Record total
counts from the Jessup transect field sheet for each species adult
and juvenile
FIRE SCARS Yes - fire scars evident on stumps trees or fence posts Fire scars
should be recorded if fire occurred since the first assessment
No - no fire scars visible
Last burn - date of last known fire Check with the lessee and record
further details in the comments eg fierce summer fire burnt out NW
corner killing all mulga
Pastoral Lease Assessment Technical Manual for the Second round (2011)
19
Vertebrates
VERTEBRATES Presentabsent for dung tracks browsed vegetation burrows
throughout the site
It is only necessary to record current or fresh activity and record as
presence (P) Old or past activity should be noted in the comments
Table 1 Vertebrate pests
Animal Sighted Dung Tracks Browse BurrowsCamp
Rabbit visual sighting fresh buck
heaps
scratchings
present
graze line with chisel
marks on stems
warren heaps
marks
warren active
Sheep visual sighting fresh dung
active padding recent grazing camps
Cattle visual sighting fresh dung active padding recent grazing camps
Goats visual sighting fresh dung active padding browse shrubs
Note in comments
height of browse line
camps
Roos visual sighting fresh dung active padding recent grazing
(check for tail drag)
camphollows
other
Others include fox cat dingo camel horse wombat etc
Note any other useful information in the general comments for example mob of 200 goats sighted More
detailed comments can be included if needed in the paddock description
Pastoral Lease Assessment Technical Manual for the Second round (2011)
20
DENSITY MEASUREMENT OF PERENNIAL PLANT SPECIES
Perennial plants provide stability to grazing management systems due to their ability to persist during dry
periods consequently the measurement of plant attributes such as density and frequency of perennials
particularly those which are palatable are important in understanding plant dynamics and rangeland condition
Plant counts within fixed belt transects have been used to determine the density of shrubs and repeated
measurements allows density changes to be detected To ensure that observer error is minimised it is vital that
the same technique and standards are used in repeat measurements Modifications made in 1990 enabled
changes to be isolated to discreet quadrats and recruitment and deaths of cohorts can be followed
Jessup transect
This method incorporates a belt transect (a standard ecological technique) that is based on an original
survey technique used for chenopod shrublands by Jessup (1951) and further developed by Lay (1979)
Their technique involved driving a vehicle over a site for a set distance and shrubs occurring within the wheel
marks (representing the belt transect) were recorded This rather destructive technique is now simulated by
a fixed 4 m x 100 m transect and enables a density and frequency estimate of perennials for each site The
frequency estimates are not based on the optimum quadrat size for all species and the 10 m x 2 m quadrats
used should not be taken to represent true frequency readings It should also be noted that species
composition by frequency is not equivalent to composition by cover or density The length of some early
transects has varied from the current standard so ensure that any future comparisons use the same transect
configuration (see 821below)
The Jessup transect method measures the density (shrubsarea) and frequency of perennial plants at sites
where perennial cover occurs ie chenopods other shrubs and tussock (perennial) grasses Counting age
classes of shrubs (adultjuvenile) gives further information on population changes Monitoring over time
provides an indication of recruitment trends
Recording is based on all perennial shrubs within the transect being recorded by species and age class
(adultjuvenile) If the base of the plant is in the transect it is counted If the foliage only is in the transect it is
not counted
Transect layout
Jessup transects are permanently marked and comprise
transects 100 m x 2 m x 2 (see figure 5)
recordings separated into 10 m x 2 m blocks
identification of perennial plant species
less than 10 cm high andor non woody base = juvenile
more than 20 individual juvenile bushes or perennial grasses per 10 m x 2 m block = 20+ recording
1 Transects should include only one land unit and preferably be restricted to one element for data
analysis Transects are 100m long and generally at right angles to the track Walk the length of the
transect to ensure it is suitable before setting up the site and identify and discuss species present
with the other observers
2 Record a compass bearing for the transect
3 Secure a surveyors tape (marked into 10 m segments) to the sighter peg and lay out the tape to 100
m keeping the marker and sighter pegs in line
4 Check that the tape is in line with the sighter and marker peg Tension the tape and drive in the peg at the 100 m mark and secure tape to the peg It is important to have the tape extended to full
100m and tight and straight so that data is replicated at the quadrat level
Pastoral Lease Assessment Technical Manual for the Second round (2011)
21
5 If the transect layout is normal note this on the sheet if different note the transect layout on the site
description sheet and orient diagram with north to the top of the page Give clear legible directions
and bearings
Figure 5 Jessup transect layout
Recording a Jessup transect
1 Use a surveyors tape that is clearly marked into 10 m intervals If it is marked with tape check that
this has not slipped from the 10 m graduations Counts should be recorded on a Jessup transect
data sheet (see appendix 6)
2 Commence transect on left side of tape (UP) using 2 m rod (refer plate below) Check that the rod is
2 m A two metre curtain pole is ideal for this
Plate 4 Recording a Jessup transect
3 Identify each perennial species If in doubt collect a specimen
4 Easiest operation is with one person observing (counting) and another recording and acting as a
checking observer The recorder (scribe) stands at the 10 m marker intervals and the observer calls
out the adultjuvenile strikes along each 10 m transect interval The recorder can assist by spotting
hidden plants and small juvenile plants
5 For plants on quadrat margins include only in the quadrat where the rooted stem is located Count
plants only if they are more than 50 rooted within the quadrat
6 Chenopods occur in clumps and it is difficult to distinguish individuals for this reason clumps are
recorded and are recognised as individual clumps if there is more than a 30 cm gap between the
rooted stems Criteria for counting plants growing close together are as follows
End peg Sighter peg Site marker amp disc
11 12 13 14 15 16 17 18 19 20
10 9 8 7 6 5 4 3 2 1
100 m
4 m
Pastoral Lease Assessment Technical Manual for the Second round (2011)
22
distinguish between individual clumps if there is more than a 30 cm gap between rooted stems
if crowns are distinct and bases are less than 30 cm apart count each as an individual
if crowns are touching or overlapping and gap between rooted stems is less than 30 cm count
as one clump
Note In cases of perennial plants such as low bluebush being grazed the reduction of the crown
may lead to higher count of bush numbers Care is required when comparing existing Jessup counts
and noted should be recorded if this type of splitting has occurred
7 Record juveniles as plants less than 10 cm high or wide and not woody However if obviously old
woody plants are grazed back to less then this size record as adults but make comment
accordingly
If greater than 20 juvenile individuals of any species encountered in 10m interval (quadrat) record as
20+ This avoids attempting to count up to 200 seedlings but still provides sufficient data to interpret
that recruitment is occurring Large numbers of seedlings can occur following favourable conditions
and it becomes difficult to count all of these However where feasible a total count of juveniles
should be undertaken
8 For perennial grasses record clumps if greater than 10 cm high or 10 cm wide ie no juvenile
categories Record count as 20 + if greater than 20 individuals within one 10 m x 2 m block This is
to aid interpretation of step-point cover data eg low density but high cover implies large spreading
individuals high density but low cover may imply a grazing effect - site comments should indicate
this The quadrat sizes are not well suited to grasses but do provide an indication of the level of
grasses within a shrubland
9 Do not record dead or completely defoliated bushes but note occurrence in comments
10 Proceed to end of transect and commence quadrats 11-20 (ie 100-0m) on other side of tape
(down)
11 Record minor site variations in comments relating to quadrat intervals eg 20-30m large scaled area
Pastoral Lease Assessment Technical Manual for the Second round (2011)
23
DATABASE AND GIS ndash needs update for ALIS and FDE
Site information is currently entered into the Arid Lands Information System (ALIS) and print-outs and
photographs are supplied to the lessee for every photopoint on the station in the form of a Photopoint
Manual
In 1991 the Geographic Analysis and Research Unit (GAR) of the Department of Housing and Urban
Development has been assisting the Pastoral Management Branch in the establishment and maintenance of
a Pastoral Geographic Information System (Malcolm and Nicolson 1995) The GAR unit operates a
centralised ARCINFO (Environmental Systems Research Institute USA) GIS facility and is the
Environmental Node of South Australia‟s Land Information System
Extensive development was carried out on ALIS and while operational is still undergoing some further
development Management of this system is though Client Services in DENR in collaboration with the
Pastoral Program Development of a system for field data entry onto GETEC tablets has been completed
and is undergoing transition into the operational phase This will improve data collection with validation in the
field and also allow considerable time saving and possible transposition errors removing one stage in the
data entry process
Lease infrastructure information is derived from a number of sources that vary in age scale and accuracy
During the assessment process topographic maps are used as a base map and information is checked
corrected of altered using various techniques Prior to the introduction of Global Positioning Systems (GPS)
in 1992 the information was collected using bearing and distance measurement that were plotted onto base
maps The improved accuracy of GPS units over time has allowed increased accuracy and therefore an
improved mapping product
Lease maps and land system maps are available as hard copy products Watered areas for each paddock
can also be produced that indicate the extent that the lease is utilised by stock Undisturbed areas represent
quality wildlife habitats and further investigations are required to study the relationships between stocking
intensity land condition and wildlife habitat More detailed information can be found in Malcolm and
Nicolson (1995)
POST TRIP PROCEEDURE
The following checklist should be completed after each trip
Download photos and GPS co-ordinates
Data entry
Update photopoint manual and make 2 copies
Conduct LCI peer review
All spatial updates sent to GIS DWLBC
Write draft Assessment report
Submit for review
Pastoral Lease Assessment Technical Manual for the Second round (2011)
CONDITION CLASS
ATTRIBUTE EXCELLENT GOOD FAIR POOR VERY POOR
PLANT SPECIES
COMPOSITION
maximum diversity of
annual and perennial
species possible for the
land type
perennial species of
various ages
some reduction in density
of palatable and
susceptible perennials
increased proportion of
shorter lived species
perennial species of
various ages
significantly reduced
cover density andor
regeneration of
palatable species
establishment of less
preferred or
unpalatable species
dominance of annual and
ephemeral species and
perennials with relatively
low palatability
no regeneration of
desirable perennial
species existing stands
degenerate
seasonal cover of
only pioneer
ephemerals or
unpalatable weeds
large areas totally
unproductive
PLANT
PRODUCTIVITY
at full potential
sustained productivity
annual com unities
maintain litter cover but
not production in dry
seasons
some fluctuation lower in
drought and may be
higher than site potential
for some species eg
Mitchell grass
reduced overall high
productivity in good
season
low in drought
(fluctuates markedly
with season)
impaired productivity
very seasonally
dependant low or non
existent in dry seasons
areas incapable of
any plant growth
SOIL EROSION
STATUS
no erosion (other than
natural features or
processes)
plant and litter cover
protect soil from wind
and water in all
seasons
minor or slight erosion
evident
increased susceptibility of
soils to erosion in dry
seasons
moderate erosion
evident
reduced density and
cover of perennial and
litter increases
susceptibility of soils to
erosion in most
seasons
severe erosion overall
high susceptibility of soils
to erosion in all seasons
extent of past erosion
renders site susceptible
to further soil movement
if grazed at any level
unstable severely
or very eroded
Pastoral Lease Assessment Technical Manual for the Second round (2011)
Appendix 1 Erosion severitytype intensity criteria ndashfor reference to first round data sheets
EROSION SeverityType intensity criteria + RATING (max 200 m radius)
NO ACCELERATED EROSION 00
SLIGHT EROSION (10 of site affected)
slight accumulation of wind blown soil and plant bases and other obstacles 11
removal of finer soil particles evident but soil crust is largely intact 12
occasional rills (lt300 mm deep) evident 13
no gullies present 14
a few scalds present usually less than 2 m in diameter 15
MINOR EROSION (10-25 of site affected)
accumulation of soil around plant bases with plant mounds noticeably enlarged 21
evidence of pedestalling but soil loss minor and plant bases not greatly elevated 22
breaking of surface crust with small erosion faces and some redistribution of soil and
or some rilling evident 23
occasional shallow gullies only 24
scalding evident but scalds relatively small and discontinuous 25
MODERATE EROSION (25-50 of site affected)
wind piling around plant bases and other obstacles is common but no plants completely covered 31
pedestalling apparent with plant bases distinctly raised and with obvious
soil loss and deflation in parts 32
surface sheeting andor rilling common with erosion faces (andor micro-
terracing) and active redistribution of soil 33
gullying present on parts of the site 34
numerous small scalds common andor with a tendency to coalesce to form larger scalds in parts 35
SEVERE EROSION (50-75 of site affected)
extreme hummocking around plants and other obstacles some plants completely covered 41
severe pedestalling with plant bases greatly elevated and major soil loss
from deflation andor much of surface generally unstable with ripple marks 42
major rilling or surface sheeting with extensive exposure of subsoil or parent material
erosion faces (andor microterracing) and active redistribution of soil 43
widespread gullying 44
scalding extensive smaller scalds have coalesced to form large more or
less continuous scalded areas 45
EXTREME EROSION (75-100 of site affected)
general surface movement area more or less bare with formation of shifting dunes 51
most of original land surface altered any last remnants of original soil or
vegetation standing as sentinels in a barren landscape 52
water sheeting andor rilling coalesced to expose subsoil or parent material 53
extensive gullying 54
scalding more or less continuous over large areas 55
Note Record severity first and then type eg 53 = Extreme erosionScalding
Pastoral Lease Assessment Technical Manual for the Second round (2011)
Appendix 2 Crown Separation Ratio
This is a visual estimate of plant cover
It is the average distance between crowns (the area the plant takes up if viewed from above) divided by the
average size of the crown In the field this means visualising how many crowns of a given plant species can be fitted in between the distance to the nearest neighbour of that species on average over the site The
classes are as follows
CLASS TERM CSR FIELD CRITERIA
1 Present lt 12 plants lt12 plants within 200 m radius
2 Isolated clumps gt20 spaces Isolated clumps of two to five woody plants 200 m
further apart
3 Isolated Plants gt20 spaces Isolated plants
4 Very Sparse 6-20 spaces well spaced crowns well separated
5 Sparse 1-5 spaces clearly spaced crowns clearly separated
6 Mid dense 0-09 spaces crowns touching to slight separation
7 Closed or dense 0 crowns touching to overlapping
Modified from Table 14 McDonald (1990)
Pastoral Lease Assessment Technical Manual for the Second round (2011)
11
process the assessment techniques can be demonstrated and the photopoint method explained to ensure
the pastoralist is able to carry on with subsequent monitoring if he or she desires
Through combining short term and long-term records our understanding of ecosystems may be improved
and future grazing practices can be adapted to suit these trends Stock records for each paddock together
with climatic information observations of grazing on desirable plants germination events and other factors
will provide a valuable record that will assist in future decision making regarding the objectives of sustainable
use
Changes in the soil and vegetation components may follow
a fire
extreme seasons wet or dry
a marked change in vegetation cover
defoliation of chenopod shrubs (saltbush or bluebush)
establishment of new shrub seedlings
death of shrubs or trees
invasion by unpalatable plants
Access and relocation of existing photopoints (finding the site)
Sites are generally placed alongside station tracks for ease of relocation If a site is located on a now-unused track then be sure to note how to find the turn-off and any other important features The photopoint peg or post should in open country be visible from the track although it is desirable to place it far enough off the track to reduce the chance of it being driven over or destroyed by road maintenance or minor realignment Experience has shown that sites placed 10-50 metres from the track provide the best chance of not being damaged or rendered useless from road effects while still being easily accessible for revisits Careful recording of the GPS and distances is essential and will assist future assessors Use of hills and other features in a photo may assist in relocation
New Photopoints
Choosing the location for a new photopoint
The photopoint location will depend on the major objective for setting it up
To encourage pastoralists to monitor the sites they need to be easily locatable Record the distance from a
permanent feature eg gate or trough and if possible record the distance from the opposite direction Use
the GPS to capture co-ordinates for the site
The following factors should be considered when choosing a site particularly when monitoring grazing
impact
Distance from water
Grazing intensity of domestic stock decreases with distance from the permanent water source Choosing sites at a consistent distance from water allows for more effective comparison between sites Assessment sites for sheep stations are generally placed about 15 km from permanent water but more importantly should monitor areas where indicator species are still present or be expected to occur In cattle areas the site may be between 2-4 km from water Where an acceptable site does not occur at the desired distance personal judgement must be used in choosing the best location taking the above factors into consideration This may involve locating the site further or a little closer to the watering point or simply abandoning the attempt to locate a site out from that particular water (especially if another track or water in the paddock is also monitored)
Representation of a land unit
If establishing a new site in a paddock which does not have any existing sites this site should be located within a recognisable land unit that is typical of the paddock For example do not choose an isolated
Pastoral Lease Assessment Technical Manual for the Second round (2011)
12
bluebush patch if it is not typical of the paddock Avoid vegetation patches that are obviously atypical or are small areas of transition between communities The unit chosen must also be one that gives a good indication of grazing impact For example do not place a site in a very stable resilient vegetation type if the majority of the paddock or areas preferred by stock are much less resilient
Size and uniformity
The site should be uniform with respect to vegetation soil slope and aspect The more extensive the area of the site the better While a site might take observations of a radius of 200m an area of 100m radius should be considered a minimum but all observations must be made within uniform land typeunit Disturbed areas such as roadsides must not be considered
Other influencing factors
Other factors likely to bias or influence the site vegetation should be recognised and avoided where possible Avoid placing sites in the following situations
on a southern fence since sheep tend to graze into the wind and in most sheep - pastoral areas of SA the prevailing wind is from the south
sheep camp areas or where animals walk parallel to the track resulting in heavily tracking
mechanically disturbed areas
water run-on areas from tracks or where old track marks or erosion is evident
Photopoint setup
Directions to each photopoint should comprise a distance and direction from a known point such as a water
point A metal numbered disc on a polydropper fibreglass or steel rebar post (or wooden peg) marks each photopoint established during or before the first round (refer figure 3) This is referred to as the marker peg
However where the marker has disappeared or deteriorated new markers will consist of some more
permanentvisible materials
Figure 3 Diagram of a typical ldquoQSrdquoPhotopoint Monitoring site
Position the marker peg 10-50 m off the track in a clearly visible location that is not likely to be disturbed
However ensure the area to be monitored is free of vehicle track effects such as water flow stock
movement etc If the marker peg is positioned further than 50 m from the track position another directional
peg near the track and give clear directions on the site sheet to the location of the marker peg or post (ie
Pastoral Lease Assessment Technical Manual for the Second round (2011)
13
bearing and distance from 1st peg) Remember it may be some time before the site is re-visited and the site
is wasted if it can‟t be re-located
A second peg usually a jarrah peg is located approximately 17 paces from the marker peg This is referred to as the sighter peg This peg is positioned such that the photograph area does not include more than 13 skyline
and the bearing will follow the line of the Jessup transect A third peg is placed 100 m from the sighter and used
to mark the end of the Jessup transect Not all sites will have a Jessup transect
Locations of all photopoint sites will be recorded with a GPS from the vehicle and marked on the updated station
paddock plan
The photograph should be taken from the marker peg Record a compass bearing between the marker peg
and sighter peg If other photos are taken from the marker peg the bearing should be marked with an
additional sighter peg
Taking the photograph
Photos are taken with a digital SLR camera and with the zoom set to replicate the original 50mm lens
cameras Photos are taken in RAW format and downloaded daily To take the photograph stand behind the
marker peg and centre on the base of the sighter peg as shown in plate 5 and figure 4 Adjust focus to
infinity to ensure all of the transect is in focus
Plate 3 Taking a photograph
Figure 4 Directions for taking the photograph
Pastoral Lease Assessment Technical Manual for the Second round (2011)
14
RECORDING FIELD INFORMATION
Site description and location
Site sheets and the information collected have changed and evolved over the period of assessment An
example of the current site sheet is shown in appendix 1
Detailed below are the fields of information together with the type of detail that should be recorded Note Completed entry example shown in brackets (italics)
QS OB RS TS Prefix to describe type of photopoint followed by photopoint number
as per the disc (eg QS 2345)
QS - Quantitative site A pegged site used for monitoring vegetation
changes with Jessup andor step-point data (formerly photopoint -
PP)
OB - Observation site A pegged site used as an observation site to
monitor changes that can be detected by a photographic sequence
eg rehabilitation spread of erosion gullies Site description includes
a list of plant species but with no measured plant data collected
RS - Reference site Sites are in areas remote from grazing influence
greater than 5 km from water in sheep country and 8 km in cattle
country Also includes exclosure sites Complete all site description
and plant and soil sheets
TS - Type Site Designated for site characteristic of mapped land
system in early part of baseline assessment process As per OB but
sites were not usually pegged
PC ndash Photo Comparison Should be used strictly where a photo is to
be compared and data collected would not be required eg A
panorama on a hill top where species in the foreground are not
relevant to the background being monitored in a photo
All photopoints should be prefixed with QS OB RS PC or TS
DATE Day Month and Year (eg 01062007)
OBSERVERS Initials of persons involved in data collection Initials of the person
filling out the sheet first followed by second observer (egMTCB)
STATION Pastoral station name Use the full name of the station (eg
Bulgunnia)
PADDOCK Full paddock name may include subscript eg formerly part Cyclone
(Monsoon)
ZONE Grid reference zone generally on the bottom of the map (eg 54)
MAP SHEET Map sheet number 150000 five digits eg 66341 1100000 four
digits eg 5434 (66341)
EASTING amp NORTHING Co-ordinates on GPS Unit
Pastoral Lease Assessment Technical Manual for the Second round (2011)
15
DATUM GDA 94
SERIES Refers to the filing system for photopoint photograph series for the
station indicates the station with the month amp year the photo was
taken First four spaces are for the station (or trip name) abbreviated
to the first four letters eg Bulg for Bulgunnia Next two are digits for the month followed by two digits for the year eg (Bulg 0691)
DIGITAL Image number
WATERPOINT Name of nearest permanent water source by direct route as a sheep
would walk Note type also eg dam trough tank (Moonbi Tank)
DISTANCE (km) Distance (to one decimal point) to water source named above ie by
direct route as a sheep would walk Record the straight-line distance from the GPS (eg 16 km)
CONDITION Condition rating for the site as per condition rating guidelines Refer to
appendix 2 for condition class attributes Notes on attributes in the site comments will help to support this judgement (eg Good)
MUD MAP Diagram of how to relocate the site clearly labelled with distances
Include paddock name and adjacent paddocks track location and
gate zero origin water location site number Orient the map with
north to the top of the page
MUD MAP COMMENTS Clear directions on how to relocate the site completed according to
the following format Keep in mind that this will be printed out for the
lessee
Distance from gate or trough direction on track to next bore or
paddock along fence Place where zero taken from eg tank trough
gate - be specific What type of peg or marker was used and how far it
is off the track and in what direction Distance to sighter peg and
bearing Jessup transect length (normally 100m) and bearing from sighter peg (Use tripmeter if no Halda rally meter or similar)
Example mud map comments (15 km south of Twin Well on track to Gladstone Bore or 35km north
of gate from Dusty paddock Zero at trough Jarrah peg and disc at 15 paces east of track Sighter peg (jarrah) at 17 paces bearing 90deg Jessup transect 100 m x 2 m x 2 at 90deg end marked by jarrah peg)
EROSION Record the severity and type of erosion according to the table in
appendix 4
COMMENTS Record notes that help to further explain observations or that will
assist interpretation of the data for present and future observations
This should include notes to indicate why the site was established and
what it is monitoring It should also include notes that help explain the
condition rating and current impacts or changes including erosion
Data entry Initials of person who entered data on the database and the date of
entry (egCB 5391)
Pastoral Lease Assessment Technical Manual for the Second round (2011)
16
Establishing new sites The site details below are only relevant for new sites set up as part of the second assessmentndash not used for revisits as part of the second round
LAND SYSTEM Land system name taken from land system map (egWeedna)
ROCK TYPE Name of rock type from geological map or rock type identified at site if
geology map incorrect (egred sandstone)
FORMATION Name of rock formation from geological map (egPound Quartzite)
LANDFORM SLOPE Slope of the site measured in degrees by use of clinometer
Do not confuse degrees with (eg2deg)
ELEMENT Landform element of site
1 crest curved in down slope profile and margins at limit of observed
curvature
2 slope considered as planar Note in comments if upper mid or
lower slope
3 flat planar
4 depression may be open or closed
PATTERN Term to describe the landform type eg alluvial plain = ALP See
appendix 3 for abbreviations and descriptions (egALP)
Pastoral Lease Assessment Technical Manual for the Second round (2011)
17
Vegetation
SIGNIFICANT RAIN Yes - data collection following rains that resulted in green ephemeral
response record dates if known of significant falls
No - dry ephemeral growth only
TYPE S (summer) - rain fell between November and March
W (winter) - rain fell between April and October
I (indistinguishable) - cannot tell if resultant green ephemeral growth is
from summer or winter rain events or is a combination of both
VEGETATION SPECIES Effort should be made to record all plant species throughout the site
Recording plant species should be carried out until most species are
recorded (ie until a period of minutes elapses before further species
are not found) Record full species name on the site sheet
If plant species is not known collect a specimen fill out details in the
herbarium collection booklet and include photopoint number and line
number of record on sheet eg 234512 so that this number can be
entered on subsequent site sheets Put the herbarium label with the
specimen in the plant press Keep a list of plants collected and PPline
number so that you can give this number to collected species at other
sites Update the site sheet with the correct species name when it
comes back from the herbarium or identity confirmed
DOM Dominant species This will be used to classify vegetation
associationsgroups
1 visually pre-dominant species forming the tallest stratum CSR
class should exceed 1 (CSR 2-6)
2 if another tallest stratum species is present (co-dominant) it is
selected OR if absent the most abundant understorey species is selected eg Mai sed
3 selected from any stratum usually a lower stratum as an indicator
species (that is a species of known environmental preferences or
of such abundance that it can‟t be ignored) or to distinguish between associations eg Atr ves
4 other conspicuous species to separate associations eg Scl obl
GRAZED If a plant is obviously grazed tick the box If grazing is mainly by
rabbits or goats this should be noted in the comments
RESPROUT If the plant has previously been grazed back and is now showing fresh
new growth tick the box Note extent in comments eg Atr ves adults
showing abundant new growth following recent rains
RECRUITMENT If seedlings are evident or new suckers (eg Bullock bush) tick the
box Note height of seedlings in comments eg Mai sed seedlings to
5 cm abundant in open areas
FRUIT If the plant is in fruit tick the box This will enable data collection on
best times for seed collection Record relevant notes in comments
Pastoral Lease Assessment Technical Manual for the Second round (2011)
18
Crown Separation Ratio (CSR) The average distance between crowns divided by the average size of
the crown grouped into various size classes (see appendix 5)
1 present lt 12 plants in 200 m radii
2 isolated clumps gt20 CSR clumps of two to five woody plants 200
m further apart
3 isolated plants gt20 CSR trees gt100 m apart
4 very sparse 6-20 CSR crowns well separated
5 sparse 1-5 CSR crowns clearly separated
6 mid dense 0-09 CSR crowns touching to slightly separated
7 closed or dense crowns touching to over lapping
JESSUP Refers to the results of the Jessup transect (see section 81
for more details)
See appendix 6 for Jessup transect recording sheet Record total
counts from the Jessup transect field sheet for each species adult
and juvenile
FIRE SCARS Yes - fire scars evident on stumps trees or fence posts Fire scars
should be recorded if fire occurred since the first assessment
No - no fire scars visible
Last burn - date of last known fire Check with the lessee and record
further details in the comments eg fierce summer fire burnt out NW
corner killing all mulga
Pastoral Lease Assessment Technical Manual for the Second round (2011)
19
Vertebrates
VERTEBRATES Presentabsent for dung tracks browsed vegetation burrows
throughout the site
It is only necessary to record current or fresh activity and record as
presence (P) Old or past activity should be noted in the comments
Table 1 Vertebrate pests
Animal Sighted Dung Tracks Browse BurrowsCamp
Rabbit visual sighting fresh buck
heaps
scratchings
present
graze line with chisel
marks on stems
warren heaps
marks
warren active
Sheep visual sighting fresh dung
active padding recent grazing camps
Cattle visual sighting fresh dung active padding recent grazing camps
Goats visual sighting fresh dung active padding browse shrubs
Note in comments
height of browse line
camps
Roos visual sighting fresh dung active padding recent grazing
(check for tail drag)
camphollows
other
Others include fox cat dingo camel horse wombat etc
Note any other useful information in the general comments for example mob of 200 goats sighted More
detailed comments can be included if needed in the paddock description
Pastoral Lease Assessment Technical Manual for the Second round (2011)
20
DENSITY MEASUREMENT OF PERENNIAL PLANT SPECIES
Perennial plants provide stability to grazing management systems due to their ability to persist during dry
periods consequently the measurement of plant attributes such as density and frequency of perennials
particularly those which are palatable are important in understanding plant dynamics and rangeland condition
Plant counts within fixed belt transects have been used to determine the density of shrubs and repeated
measurements allows density changes to be detected To ensure that observer error is minimised it is vital that
the same technique and standards are used in repeat measurements Modifications made in 1990 enabled
changes to be isolated to discreet quadrats and recruitment and deaths of cohorts can be followed
Jessup transect
This method incorporates a belt transect (a standard ecological technique) that is based on an original
survey technique used for chenopod shrublands by Jessup (1951) and further developed by Lay (1979)
Their technique involved driving a vehicle over a site for a set distance and shrubs occurring within the wheel
marks (representing the belt transect) were recorded This rather destructive technique is now simulated by
a fixed 4 m x 100 m transect and enables a density and frequency estimate of perennials for each site The
frequency estimates are not based on the optimum quadrat size for all species and the 10 m x 2 m quadrats
used should not be taken to represent true frequency readings It should also be noted that species
composition by frequency is not equivalent to composition by cover or density The length of some early
transects has varied from the current standard so ensure that any future comparisons use the same transect
configuration (see 821below)
The Jessup transect method measures the density (shrubsarea) and frequency of perennial plants at sites
where perennial cover occurs ie chenopods other shrubs and tussock (perennial) grasses Counting age
classes of shrubs (adultjuvenile) gives further information on population changes Monitoring over time
provides an indication of recruitment trends
Recording is based on all perennial shrubs within the transect being recorded by species and age class
(adultjuvenile) If the base of the plant is in the transect it is counted If the foliage only is in the transect it is
not counted
Transect layout
Jessup transects are permanently marked and comprise
transects 100 m x 2 m x 2 (see figure 5)
recordings separated into 10 m x 2 m blocks
identification of perennial plant species
less than 10 cm high andor non woody base = juvenile
more than 20 individual juvenile bushes or perennial grasses per 10 m x 2 m block = 20+ recording
1 Transects should include only one land unit and preferably be restricted to one element for data
analysis Transects are 100m long and generally at right angles to the track Walk the length of the
transect to ensure it is suitable before setting up the site and identify and discuss species present
with the other observers
2 Record a compass bearing for the transect
3 Secure a surveyors tape (marked into 10 m segments) to the sighter peg and lay out the tape to 100
m keeping the marker and sighter pegs in line
4 Check that the tape is in line with the sighter and marker peg Tension the tape and drive in the peg at the 100 m mark and secure tape to the peg It is important to have the tape extended to full
100m and tight and straight so that data is replicated at the quadrat level
Pastoral Lease Assessment Technical Manual for the Second round (2011)
21
5 If the transect layout is normal note this on the sheet if different note the transect layout on the site
description sheet and orient diagram with north to the top of the page Give clear legible directions
and bearings
Figure 5 Jessup transect layout
Recording a Jessup transect
1 Use a surveyors tape that is clearly marked into 10 m intervals If it is marked with tape check that
this has not slipped from the 10 m graduations Counts should be recorded on a Jessup transect
data sheet (see appendix 6)
2 Commence transect on left side of tape (UP) using 2 m rod (refer plate below) Check that the rod is
2 m A two metre curtain pole is ideal for this
Plate 4 Recording a Jessup transect
3 Identify each perennial species If in doubt collect a specimen
4 Easiest operation is with one person observing (counting) and another recording and acting as a
checking observer The recorder (scribe) stands at the 10 m marker intervals and the observer calls
out the adultjuvenile strikes along each 10 m transect interval The recorder can assist by spotting
hidden plants and small juvenile plants
5 For plants on quadrat margins include only in the quadrat where the rooted stem is located Count
plants only if they are more than 50 rooted within the quadrat
6 Chenopods occur in clumps and it is difficult to distinguish individuals for this reason clumps are
recorded and are recognised as individual clumps if there is more than a 30 cm gap between the
rooted stems Criteria for counting plants growing close together are as follows
End peg Sighter peg Site marker amp disc
11 12 13 14 15 16 17 18 19 20
10 9 8 7 6 5 4 3 2 1
100 m
4 m
Pastoral Lease Assessment Technical Manual for the Second round (2011)
22
distinguish between individual clumps if there is more than a 30 cm gap between rooted stems
if crowns are distinct and bases are less than 30 cm apart count each as an individual
if crowns are touching or overlapping and gap between rooted stems is less than 30 cm count
as one clump
Note In cases of perennial plants such as low bluebush being grazed the reduction of the crown
may lead to higher count of bush numbers Care is required when comparing existing Jessup counts
and noted should be recorded if this type of splitting has occurred
7 Record juveniles as plants less than 10 cm high or wide and not woody However if obviously old
woody plants are grazed back to less then this size record as adults but make comment
accordingly
If greater than 20 juvenile individuals of any species encountered in 10m interval (quadrat) record as
20+ This avoids attempting to count up to 200 seedlings but still provides sufficient data to interpret
that recruitment is occurring Large numbers of seedlings can occur following favourable conditions
and it becomes difficult to count all of these However where feasible a total count of juveniles
should be undertaken
8 For perennial grasses record clumps if greater than 10 cm high or 10 cm wide ie no juvenile
categories Record count as 20 + if greater than 20 individuals within one 10 m x 2 m block This is
to aid interpretation of step-point cover data eg low density but high cover implies large spreading
individuals high density but low cover may imply a grazing effect - site comments should indicate
this The quadrat sizes are not well suited to grasses but do provide an indication of the level of
grasses within a shrubland
9 Do not record dead or completely defoliated bushes but note occurrence in comments
10 Proceed to end of transect and commence quadrats 11-20 (ie 100-0m) on other side of tape
(down)
11 Record minor site variations in comments relating to quadrat intervals eg 20-30m large scaled area
Pastoral Lease Assessment Technical Manual for the Second round (2011)
23
DATABASE AND GIS ndash needs update for ALIS and FDE
Site information is currently entered into the Arid Lands Information System (ALIS) and print-outs and
photographs are supplied to the lessee for every photopoint on the station in the form of a Photopoint
Manual
In 1991 the Geographic Analysis and Research Unit (GAR) of the Department of Housing and Urban
Development has been assisting the Pastoral Management Branch in the establishment and maintenance of
a Pastoral Geographic Information System (Malcolm and Nicolson 1995) The GAR unit operates a
centralised ARCINFO (Environmental Systems Research Institute USA) GIS facility and is the
Environmental Node of South Australia‟s Land Information System
Extensive development was carried out on ALIS and while operational is still undergoing some further
development Management of this system is though Client Services in DENR in collaboration with the
Pastoral Program Development of a system for field data entry onto GETEC tablets has been completed
and is undergoing transition into the operational phase This will improve data collection with validation in the
field and also allow considerable time saving and possible transposition errors removing one stage in the
data entry process
Lease infrastructure information is derived from a number of sources that vary in age scale and accuracy
During the assessment process topographic maps are used as a base map and information is checked
corrected of altered using various techniques Prior to the introduction of Global Positioning Systems (GPS)
in 1992 the information was collected using bearing and distance measurement that were plotted onto base
maps The improved accuracy of GPS units over time has allowed increased accuracy and therefore an
improved mapping product
Lease maps and land system maps are available as hard copy products Watered areas for each paddock
can also be produced that indicate the extent that the lease is utilised by stock Undisturbed areas represent
quality wildlife habitats and further investigations are required to study the relationships between stocking
intensity land condition and wildlife habitat More detailed information can be found in Malcolm and
Nicolson (1995)
POST TRIP PROCEEDURE
The following checklist should be completed after each trip
Download photos and GPS co-ordinates
Data entry
Update photopoint manual and make 2 copies
Conduct LCI peer review
All spatial updates sent to GIS DWLBC
Write draft Assessment report
Submit for review
Pastoral Lease Assessment Technical Manual for the Second round (2011)
CONDITION CLASS
ATTRIBUTE EXCELLENT GOOD FAIR POOR VERY POOR
PLANT SPECIES
COMPOSITION
maximum diversity of
annual and perennial
species possible for the
land type
perennial species of
various ages
some reduction in density
of palatable and
susceptible perennials
increased proportion of
shorter lived species
perennial species of
various ages
significantly reduced
cover density andor
regeneration of
palatable species
establishment of less
preferred or
unpalatable species
dominance of annual and
ephemeral species and
perennials with relatively
low palatability
no regeneration of
desirable perennial
species existing stands
degenerate
seasonal cover of
only pioneer
ephemerals or
unpalatable weeds
large areas totally
unproductive
PLANT
PRODUCTIVITY
at full potential
sustained productivity
annual com unities
maintain litter cover but
not production in dry
seasons
some fluctuation lower in
drought and may be
higher than site potential
for some species eg
Mitchell grass
reduced overall high
productivity in good
season
low in drought
(fluctuates markedly
with season)
impaired productivity
very seasonally
dependant low or non
existent in dry seasons
areas incapable of
any plant growth
SOIL EROSION
STATUS
no erosion (other than
natural features or
processes)
plant and litter cover
protect soil from wind
and water in all
seasons
minor or slight erosion
evident
increased susceptibility of
soils to erosion in dry
seasons
moderate erosion
evident
reduced density and
cover of perennial and
litter increases
susceptibility of soils to
erosion in most
seasons
severe erosion overall
high susceptibility of soils
to erosion in all seasons
extent of past erosion
renders site susceptible
to further soil movement
if grazed at any level
unstable severely
or very eroded
Pastoral Lease Assessment Technical Manual for the Second round (2011)
Appendix 1 Erosion severitytype intensity criteria ndashfor reference to first round data sheets
EROSION SeverityType intensity criteria + RATING (max 200 m radius)
NO ACCELERATED EROSION 00
SLIGHT EROSION (10 of site affected)
slight accumulation of wind blown soil and plant bases and other obstacles 11
removal of finer soil particles evident but soil crust is largely intact 12
occasional rills (lt300 mm deep) evident 13
no gullies present 14
a few scalds present usually less than 2 m in diameter 15
MINOR EROSION (10-25 of site affected)
accumulation of soil around plant bases with plant mounds noticeably enlarged 21
evidence of pedestalling but soil loss minor and plant bases not greatly elevated 22
breaking of surface crust with small erosion faces and some redistribution of soil and
or some rilling evident 23
occasional shallow gullies only 24
scalding evident but scalds relatively small and discontinuous 25
MODERATE EROSION (25-50 of site affected)
wind piling around plant bases and other obstacles is common but no plants completely covered 31
pedestalling apparent with plant bases distinctly raised and with obvious
soil loss and deflation in parts 32
surface sheeting andor rilling common with erosion faces (andor micro-
terracing) and active redistribution of soil 33
gullying present on parts of the site 34
numerous small scalds common andor with a tendency to coalesce to form larger scalds in parts 35
SEVERE EROSION (50-75 of site affected)
extreme hummocking around plants and other obstacles some plants completely covered 41
severe pedestalling with plant bases greatly elevated and major soil loss
from deflation andor much of surface generally unstable with ripple marks 42
major rilling or surface sheeting with extensive exposure of subsoil or parent material
erosion faces (andor microterracing) and active redistribution of soil 43
widespread gullying 44
scalding extensive smaller scalds have coalesced to form large more or
less continuous scalded areas 45
EXTREME EROSION (75-100 of site affected)
general surface movement area more or less bare with formation of shifting dunes 51
most of original land surface altered any last remnants of original soil or
vegetation standing as sentinels in a barren landscape 52
water sheeting andor rilling coalesced to expose subsoil or parent material 53
extensive gullying 54
scalding more or less continuous over large areas 55
Note Record severity first and then type eg 53 = Extreme erosionScalding
Pastoral Lease Assessment Technical Manual for the Second round (2011)
Appendix 2 Crown Separation Ratio
This is a visual estimate of plant cover
It is the average distance between crowns (the area the plant takes up if viewed from above) divided by the
average size of the crown In the field this means visualising how many crowns of a given plant species can be fitted in between the distance to the nearest neighbour of that species on average over the site The
classes are as follows
CLASS TERM CSR FIELD CRITERIA
1 Present lt 12 plants lt12 plants within 200 m radius
2 Isolated clumps gt20 spaces Isolated clumps of two to five woody plants 200 m
further apart
3 Isolated Plants gt20 spaces Isolated plants
4 Very Sparse 6-20 spaces well spaced crowns well separated
5 Sparse 1-5 spaces clearly spaced crowns clearly separated
6 Mid dense 0-09 spaces crowns touching to slight separation
7 Closed or dense 0 crowns touching to overlapping
Modified from Table 14 McDonald (1990)
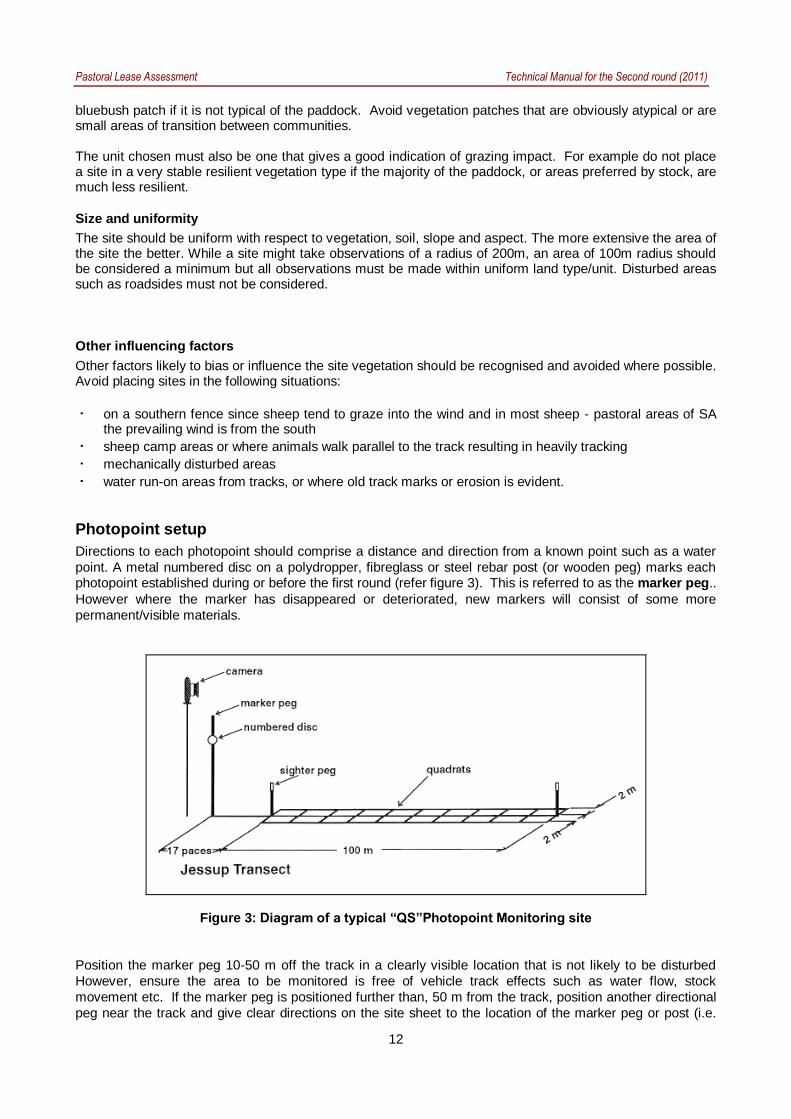
Pastoral Lease Assessment Technical Manual for the Second round (2011)
12
bluebush patch if it is not typical of the paddock Avoid vegetation patches that are obviously atypical or are small areas of transition between communities The unit chosen must also be one that gives a good indication of grazing impact For example do not place a site in a very stable resilient vegetation type if the majority of the paddock or areas preferred by stock are much less resilient
Size and uniformity
The site should be uniform with respect to vegetation soil slope and aspect The more extensive the area of the site the better While a site might take observations of a radius of 200m an area of 100m radius should be considered a minimum but all observations must be made within uniform land typeunit Disturbed areas such as roadsides must not be considered
Other influencing factors
Other factors likely to bias or influence the site vegetation should be recognised and avoided where possible Avoid placing sites in the following situations
on a southern fence since sheep tend to graze into the wind and in most sheep - pastoral areas of SA the prevailing wind is from the south
sheep camp areas or where animals walk parallel to the track resulting in heavily tracking
mechanically disturbed areas
water run-on areas from tracks or where old track marks or erosion is evident
Photopoint setup
Directions to each photopoint should comprise a distance and direction from a known point such as a water
point A metal numbered disc on a polydropper fibreglass or steel rebar post (or wooden peg) marks each photopoint established during or before the first round (refer figure 3) This is referred to as the marker peg
However where the marker has disappeared or deteriorated new markers will consist of some more
permanentvisible materials
Figure 3 Diagram of a typical ldquoQSrdquoPhotopoint Monitoring site
Position the marker peg 10-50 m off the track in a clearly visible location that is not likely to be disturbed
However ensure the area to be monitored is free of vehicle track effects such as water flow stock
movement etc If the marker peg is positioned further than 50 m from the track position another directional
peg near the track and give clear directions on the site sheet to the location of the marker peg or post (ie
Pastoral Lease Assessment Technical Manual for the Second round (2011)
13
bearing and distance from 1st peg) Remember it may be some time before the site is re-visited and the site
is wasted if it can‟t be re-located
A second peg usually a jarrah peg is located approximately 17 paces from the marker peg This is referred to as the sighter peg This peg is positioned such that the photograph area does not include more than 13 skyline
and the bearing will follow the line of the Jessup transect A third peg is placed 100 m from the sighter and used
to mark the end of the Jessup transect Not all sites will have a Jessup transect
Locations of all photopoint sites will be recorded with a GPS from the vehicle and marked on the updated station
paddock plan
The photograph should be taken from the marker peg Record a compass bearing between the marker peg
and sighter peg If other photos are taken from the marker peg the bearing should be marked with an
additional sighter peg
Taking the photograph
Photos are taken with a digital SLR camera and with the zoom set to replicate the original 50mm lens
cameras Photos are taken in RAW format and downloaded daily To take the photograph stand behind the
marker peg and centre on the base of the sighter peg as shown in plate 5 and figure 4 Adjust focus to
infinity to ensure all of the transect is in focus
Plate 3 Taking a photograph
Figure 4 Directions for taking the photograph
Pastoral Lease Assessment Technical Manual for the Second round (2011)
14
RECORDING FIELD INFORMATION
Site description and location
Site sheets and the information collected have changed and evolved over the period of assessment An
example of the current site sheet is shown in appendix 1
Detailed below are the fields of information together with the type of detail that should be recorded Note Completed entry example shown in brackets (italics)
QS OB RS TS Prefix to describe type of photopoint followed by photopoint number
as per the disc (eg QS 2345)
QS - Quantitative site A pegged site used for monitoring vegetation
changes with Jessup andor step-point data (formerly photopoint -
PP)
OB - Observation site A pegged site used as an observation site to
monitor changes that can be detected by a photographic sequence
eg rehabilitation spread of erosion gullies Site description includes
a list of plant species but with no measured plant data collected
RS - Reference site Sites are in areas remote from grazing influence
greater than 5 km from water in sheep country and 8 km in cattle
country Also includes exclosure sites Complete all site description
and plant and soil sheets
TS - Type Site Designated for site characteristic of mapped land
system in early part of baseline assessment process As per OB but
sites were not usually pegged
PC ndash Photo Comparison Should be used strictly where a photo is to
be compared and data collected would not be required eg A
panorama on a hill top where species in the foreground are not
relevant to the background being monitored in a photo
All photopoints should be prefixed with QS OB RS PC or TS
DATE Day Month and Year (eg 01062007)
OBSERVERS Initials of persons involved in data collection Initials of the person
filling out the sheet first followed by second observer (egMTCB)
STATION Pastoral station name Use the full name of the station (eg
Bulgunnia)
PADDOCK Full paddock name may include subscript eg formerly part Cyclone
(Monsoon)
ZONE Grid reference zone generally on the bottom of the map (eg 54)
MAP SHEET Map sheet number 150000 five digits eg 66341 1100000 four
digits eg 5434 (66341)
EASTING amp NORTHING Co-ordinates on GPS Unit
Pastoral Lease Assessment Technical Manual for the Second round (2011)
15
DATUM GDA 94
SERIES Refers to the filing system for photopoint photograph series for the
station indicates the station with the month amp year the photo was
taken First four spaces are for the station (or trip name) abbreviated
to the first four letters eg Bulg for Bulgunnia Next two are digits for the month followed by two digits for the year eg (Bulg 0691)
DIGITAL Image number
WATERPOINT Name of nearest permanent water source by direct route as a sheep
would walk Note type also eg dam trough tank (Moonbi Tank)
DISTANCE (km) Distance (to one decimal point) to water source named above ie by
direct route as a sheep would walk Record the straight-line distance from the GPS (eg 16 km)
CONDITION Condition rating for the site as per condition rating guidelines Refer to
appendix 2 for condition class attributes Notes on attributes in the site comments will help to support this judgement (eg Good)
MUD MAP Diagram of how to relocate the site clearly labelled with distances
Include paddock name and adjacent paddocks track location and
gate zero origin water location site number Orient the map with
north to the top of the page
MUD MAP COMMENTS Clear directions on how to relocate the site completed according to
the following format Keep in mind that this will be printed out for the
lessee
Distance from gate or trough direction on track to next bore or
paddock along fence Place where zero taken from eg tank trough
gate - be specific What type of peg or marker was used and how far it
is off the track and in what direction Distance to sighter peg and
bearing Jessup transect length (normally 100m) and bearing from sighter peg (Use tripmeter if no Halda rally meter or similar)
Example mud map comments (15 km south of Twin Well on track to Gladstone Bore or 35km north
of gate from Dusty paddock Zero at trough Jarrah peg and disc at 15 paces east of track Sighter peg (jarrah) at 17 paces bearing 90deg Jessup transect 100 m x 2 m x 2 at 90deg end marked by jarrah peg)
EROSION Record the severity and type of erosion according to the table in
appendix 4
COMMENTS Record notes that help to further explain observations or that will
assist interpretation of the data for present and future observations
This should include notes to indicate why the site was established and
what it is monitoring It should also include notes that help explain the
condition rating and current impacts or changes including erosion
Data entry Initials of person who entered data on the database and the date of
entry (egCB 5391)
Pastoral Lease Assessment Technical Manual for the Second round (2011)
16
Establishing new sites The site details below are only relevant for new sites set up as part of the second assessmentndash not used for revisits as part of the second round
LAND SYSTEM Land system name taken from land system map (egWeedna)
ROCK TYPE Name of rock type from geological map or rock type identified at site if
geology map incorrect (egred sandstone)
FORMATION Name of rock formation from geological map (egPound Quartzite)
LANDFORM SLOPE Slope of the site measured in degrees by use of clinometer
Do not confuse degrees with (eg2deg)
ELEMENT Landform element of site
1 crest curved in down slope profile and margins at limit of observed
curvature
2 slope considered as planar Note in comments if upper mid or
lower slope
3 flat planar
4 depression may be open or closed
PATTERN Term to describe the landform type eg alluvial plain = ALP See
appendix 3 for abbreviations and descriptions (egALP)
Pastoral Lease Assessment Technical Manual for the Second round (2011)
17
Vegetation
SIGNIFICANT RAIN Yes - data collection following rains that resulted in green ephemeral
response record dates if known of significant falls
No - dry ephemeral growth only
TYPE S (summer) - rain fell between November and March
W (winter) - rain fell between April and October
I (indistinguishable) - cannot tell if resultant green ephemeral growth is
from summer or winter rain events or is a combination of both
VEGETATION SPECIES Effort should be made to record all plant species throughout the site
Recording plant species should be carried out until most species are
recorded (ie until a period of minutes elapses before further species
are not found) Record full species name on the site sheet
If plant species is not known collect a specimen fill out details in the
herbarium collection booklet and include photopoint number and line
number of record on sheet eg 234512 so that this number can be
entered on subsequent site sheets Put the herbarium label with the
specimen in the plant press Keep a list of plants collected and PPline
number so that you can give this number to collected species at other
sites Update the site sheet with the correct species name when it
comes back from the herbarium or identity confirmed
DOM Dominant species This will be used to classify vegetation
associationsgroups
1 visually pre-dominant species forming the tallest stratum CSR
class should exceed 1 (CSR 2-6)
2 if another tallest stratum species is present (co-dominant) it is
selected OR if absent the most abundant understorey species is selected eg Mai sed
3 selected from any stratum usually a lower stratum as an indicator
species (that is a species of known environmental preferences or
of such abundance that it can‟t be ignored) or to distinguish between associations eg Atr ves
4 other conspicuous species to separate associations eg Scl obl
GRAZED If a plant is obviously grazed tick the box If grazing is mainly by
rabbits or goats this should be noted in the comments
RESPROUT If the plant has previously been grazed back and is now showing fresh
new growth tick the box Note extent in comments eg Atr ves adults
showing abundant new growth following recent rains
RECRUITMENT If seedlings are evident or new suckers (eg Bullock bush) tick the
box Note height of seedlings in comments eg Mai sed seedlings to
5 cm abundant in open areas
FRUIT If the plant is in fruit tick the box This will enable data collection on
best times for seed collection Record relevant notes in comments
Pastoral Lease Assessment Technical Manual for the Second round (2011)
18
Crown Separation Ratio (CSR) The average distance between crowns divided by the average size of
the crown grouped into various size classes (see appendix 5)
1 present lt 12 plants in 200 m radii
2 isolated clumps gt20 CSR clumps of two to five woody plants 200
m further apart
3 isolated plants gt20 CSR trees gt100 m apart
4 very sparse 6-20 CSR crowns well separated
5 sparse 1-5 CSR crowns clearly separated
6 mid dense 0-09 CSR crowns touching to slightly separated
7 closed or dense crowns touching to over lapping
JESSUP Refers to the results of the Jessup transect (see section 81
for more details)
See appendix 6 for Jessup transect recording sheet Record total
counts from the Jessup transect field sheet for each species adult
and juvenile
FIRE SCARS Yes - fire scars evident on stumps trees or fence posts Fire scars
should be recorded if fire occurred since the first assessment
No - no fire scars visible
Last burn - date of last known fire Check with the lessee and record
further details in the comments eg fierce summer fire burnt out NW
corner killing all mulga
Pastoral Lease Assessment Technical Manual for the Second round (2011)
19
Vertebrates
VERTEBRATES Presentabsent for dung tracks browsed vegetation burrows
throughout the site
It is only necessary to record current or fresh activity and record as
presence (P) Old or past activity should be noted in the comments
Table 1 Vertebrate pests
Animal Sighted Dung Tracks Browse BurrowsCamp
Rabbit visual sighting fresh buck
heaps
scratchings
present
graze line with chisel
marks on stems
warren heaps
marks
warren active
Sheep visual sighting fresh dung
active padding recent grazing camps
Cattle visual sighting fresh dung active padding recent grazing camps
Goats visual sighting fresh dung active padding browse shrubs
Note in comments
height of browse line
camps
Roos visual sighting fresh dung active padding recent grazing
(check for tail drag)
camphollows
other
Others include fox cat dingo camel horse wombat etc
Note any other useful information in the general comments for example mob of 200 goats sighted More
detailed comments can be included if needed in the paddock description
Pastoral Lease Assessment Technical Manual for the Second round (2011)
20
DENSITY MEASUREMENT OF PERENNIAL PLANT SPECIES
Perennial plants provide stability to grazing management systems due to their ability to persist during dry
periods consequently the measurement of plant attributes such as density and frequency of perennials
particularly those which are palatable are important in understanding plant dynamics and rangeland condition
Plant counts within fixed belt transects have been used to determine the density of shrubs and repeated
measurements allows density changes to be detected To ensure that observer error is minimised it is vital that
the same technique and standards are used in repeat measurements Modifications made in 1990 enabled
changes to be isolated to discreet quadrats and recruitment and deaths of cohorts can be followed
Jessup transect
This method incorporates a belt transect (a standard ecological technique) that is based on an original
survey technique used for chenopod shrublands by Jessup (1951) and further developed by Lay (1979)
Their technique involved driving a vehicle over a site for a set distance and shrubs occurring within the wheel
marks (representing the belt transect) were recorded This rather destructive technique is now simulated by
a fixed 4 m x 100 m transect and enables a density and frequency estimate of perennials for each site The
frequency estimates are not based on the optimum quadrat size for all species and the 10 m x 2 m quadrats
used should not be taken to represent true frequency readings It should also be noted that species
composition by frequency is not equivalent to composition by cover or density The length of some early
transects has varied from the current standard so ensure that any future comparisons use the same transect
configuration (see 821below)
The Jessup transect method measures the density (shrubsarea) and frequency of perennial plants at sites
where perennial cover occurs ie chenopods other shrubs and tussock (perennial) grasses Counting age
classes of shrubs (adultjuvenile) gives further information on population changes Monitoring over time
provides an indication of recruitment trends
Recording is based on all perennial shrubs within the transect being recorded by species and age class
(adultjuvenile) If the base of the plant is in the transect it is counted If the foliage only is in the transect it is
not counted
Transect layout
Jessup transects are permanently marked and comprise
transects 100 m x 2 m x 2 (see figure 5)
recordings separated into 10 m x 2 m blocks
identification of perennial plant species
less than 10 cm high andor non woody base = juvenile
more than 20 individual juvenile bushes or perennial grasses per 10 m x 2 m block = 20+ recording
1 Transects should include only one land unit and preferably be restricted to one element for data
analysis Transects are 100m long and generally at right angles to the track Walk the length of the
transect to ensure it is suitable before setting up the site and identify and discuss species present
with the other observers
2 Record a compass bearing for the transect
3 Secure a surveyors tape (marked into 10 m segments) to the sighter peg and lay out the tape to 100
m keeping the marker and sighter pegs in line
4 Check that the tape is in line with the sighter and marker peg Tension the tape and drive in the peg at the 100 m mark and secure tape to the peg It is important to have the tape extended to full
100m and tight and straight so that data is replicated at the quadrat level
Pastoral Lease Assessment Technical Manual for the Second round (2011)
21
5 If the transect layout is normal note this on the sheet if different note the transect layout on the site
description sheet and orient diagram with north to the top of the page Give clear legible directions
and bearings
Figure 5 Jessup transect layout
Recording a Jessup transect
1 Use a surveyors tape that is clearly marked into 10 m intervals If it is marked with tape check that
this has not slipped from the 10 m graduations Counts should be recorded on a Jessup transect
data sheet (see appendix 6)
2 Commence transect on left side of tape (UP) using 2 m rod (refer plate below) Check that the rod is
2 m A two metre curtain pole is ideal for this
Plate 4 Recording a Jessup transect
3 Identify each perennial species If in doubt collect a specimen
4 Easiest operation is with one person observing (counting) and another recording and acting as a
checking observer The recorder (scribe) stands at the 10 m marker intervals and the observer calls
out the adultjuvenile strikes along each 10 m transect interval The recorder can assist by spotting
hidden plants and small juvenile plants
5 For plants on quadrat margins include only in the quadrat where the rooted stem is located Count
plants only if they are more than 50 rooted within the quadrat
6 Chenopods occur in clumps and it is difficult to distinguish individuals for this reason clumps are
recorded and are recognised as individual clumps if there is more than a 30 cm gap between the
rooted stems Criteria for counting plants growing close together are as follows
End peg Sighter peg Site marker amp disc
11 12 13 14 15 16 17 18 19 20
10 9 8 7 6 5 4 3 2 1
100 m
4 m
Pastoral Lease Assessment Technical Manual for the Second round (2011)
22
distinguish between individual clumps if there is more than a 30 cm gap between rooted stems
if crowns are distinct and bases are less than 30 cm apart count each as an individual
if crowns are touching or overlapping and gap between rooted stems is less than 30 cm count
as one clump
Note In cases of perennial plants such as low bluebush being grazed the reduction of the crown
may lead to higher count of bush numbers Care is required when comparing existing Jessup counts
and noted should be recorded if this type of splitting has occurred
7 Record juveniles as plants less than 10 cm high or wide and not woody However if obviously old
woody plants are grazed back to less then this size record as adults but make comment
accordingly
If greater than 20 juvenile individuals of any species encountered in 10m interval (quadrat) record as
20+ This avoids attempting to count up to 200 seedlings but still provides sufficient data to interpret
that recruitment is occurring Large numbers of seedlings can occur following favourable conditions
and it becomes difficult to count all of these However where feasible a total count of juveniles
should be undertaken
8 For perennial grasses record clumps if greater than 10 cm high or 10 cm wide ie no juvenile
categories Record count as 20 + if greater than 20 individuals within one 10 m x 2 m block This is
to aid interpretation of step-point cover data eg low density but high cover implies large spreading
individuals high density but low cover may imply a grazing effect - site comments should indicate
this The quadrat sizes are not well suited to grasses but do provide an indication of the level of
grasses within a shrubland
9 Do not record dead or completely defoliated bushes but note occurrence in comments
10 Proceed to end of transect and commence quadrats 11-20 (ie 100-0m) on other side of tape
(down)
11 Record minor site variations in comments relating to quadrat intervals eg 20-30m large scaled area
Pastoral Lease Assessment Technical Manual for the Second round (2011)
23
DATABASE AND GIS ndash needs update for ALIS and FDE
Site information is currently entered into the Arid Lands Information System (ALIS) and print-outs and
photographs are supplied to the lessee for every photopoint on the station in the form of a Photopoint
Manual
In 1991 the Geographic Analysis and Research Unit (GAR) of the Department of Housing and Urban
Development has been assisting the Pastoral Management Branch in the establishment and maintenance of
a Pastoral Geographic Information System (Malcolm and Nicolson 1995) The GAR unit operates a
centralised ARCINFO (Environmental Systems Research Institute USA) GIS facility and is the
Environmental Node of South Australia‟s Land Information System
Extensive development was carried out on ALIS and while operational is still undergoing some further
development Management of this system is though Client Services in DENR in collaboration with the
Pastoral Program Development of a system for field data entry onto GETEC tablets has been completed
and is undergoing transition into the operational phase This will improve data collection with validation in the
field and also allow considerable time saving and possible transposition errors removing one stage in the
data entry process
Lease infrastructure information is derived from a number of sources that vary in age scale and accuracy
During the assessment process topographic maps are used as a base map and information is checked
corrected of altered using various techniques Prior to the introduction of Global Positioning Systems (GPS)
in 1992 the information was collected using bearing and distance measurement that were plotted onto base
maps The improved accuracy of GPS units over time has allowed increased accuracy and therefore an
improved mapping product
Lease maps and land system maps are available as hard copy products Watered areas for each paddock
can also be produced that indicate the extent that the lease is utilised by stock Undisturbed areas represent
quality wildlife habitats and further investigations are required to study the relationships between stocking
intensity land condition and wildlife habitat More detailed information can be found in Malcolm and
Nicolson (1995)
POST TRIP PROCEEDURE
The following checklist should be completed after each trip
Download photos and GPS co-ordinates
Data entry
Update photopoint manual and make 2 copies
Conduct LCI peer review
All spatial updates sent to GIS DWLBC
Write draft Assessment report
Submit for review
Pastoral Lease Assessment Technical Manual for the Second round (2011)
CONDITION CLASS
ATTRIBUTE EXCELLENT GOOD FAIR POOR VERY POOR
PLANT SPECIES
COMPOSITION
maximum diversity of
annual and perennial
species possible for the
land type
perennial species of
various ages
some reduction in density
of palatable and
susceptible perennials
increased proportion of
shorter lived species
perennial species of
various ages
significantly reduced
cover density andor
regeneration of
palatable species
establishment of less
preferred or
unpalatable species
dominance of annual and
ephemeral species and
perennials with relatively
low palatability
no regeneration of
desirable perennial
species existing stands
degenerate
seasonal cover of
only pioneer
ephemerals or
unpalatable weeds
large areas totally
unproductive
PLANT
PRODUCTIVITY
at full potential
sustained productivity
annual com unities
maintain litter cover but
not production in dry
seasons
some fluctuation lower in
drought and may be
higher than site potential
for some species eg
Mitchell grass
reduced overall high
productivity in good
season
low in drought
(fluctuates markedly
with season)
impaired productivity
very seasonally
dependant low or non
existent in dry seasons
areas incapable of
any plant growth
SOIL EROSION
STATUS
no erosion (other than
natural features or
processes)
plant and litter cover
protect soil from wind
and water in all
seasons
minor or slight erosion
evident
increased susceptibility of
soils to erosion in dry
seasons
moderate erosion
evident
reduced density and
cover of perennial and
litter increases
susceptibility of soils to
erosion in most
seasons
severe erosion overall
high susceptibility of soils
to erosion in all seasons
extent of past erosion
renders site susceptible
to further soil movement
if grazed at any level
unstable severely
or very eroded
Pastoral Lease Assessment Technical Manual for the Second round (2011)
Appendix 1 Erosion severitytype intensity criteria ndashfor reference to first round data sheets
EROSION SeverityType intensity criteria + RATING (max 200 m radius)
NO ACCELERATED EROSION 00
SLIGHT EROSION (10 of site affected)
slight accumulation of wind blown soil and plant bases and other obstacles 11
removal of finer soil particles evident but soil crust is largely intact 12
occasional rills (lt300 mm deep) evident 13
no gullies present 14
a few scalds present usually less than 2 m in diameter 15
MINOR EROSION (10-25 of site affected)
accumulation of soil around plant bases with plant mounds noticeably enlarged 21
evidence of pedestalling but soil loss minor and plant bases not greatly elevated 22
breaking of surface crust with small erosion faces and some redistribution of soil and
or some rilling evident 23
occasional shallow gullies only 24
scalding evident but scalds relatively small and discontinuous 25
MODERATE EROSION (25-50 of site affected)
wind piling around plant bases and other obstacles is common but no plants completely covered 31
pedestalling apparent with plant bases distinctly raised and with obvious
soil loss and deflation in parts 32
surface sheeting andor rilling common with erosion faces (andor micro-
terracing) and active redistribution of soil 33
gullying present on parts of the site 34
numerous small scalds common andor with a tendency to coalesce to form larger scalds in parts 35
SEVERE EROSION (50-75 of site affected)
extreme hummocking around plants and other obstacles some plants completely covered 41
severe pedestalling with plant bases greatly elevated and major soil loss
from deflation andor much of surface generally unstable with ripple marks 42
major rilling or surface sheeting with extensive exposure of subsoil or parent material
erosion faces (andor microterracing) and active redistribution of soil 43
widespread gullying 44
scalding extensive smaller scalds have coalesced to form large more or
less continuous scalded areas 45
EXTREME EROSION (75-100 of site affected)
general surface movement area more or less bare with formation of shifting dunes 51
most of original land surface altered any last remnants of original soil or
vegetation standing as sentinels in a barren landscape 52
water sheeting andor rilling coalesced to expose subsoil or parent material 53
extensive gullying 54
scalding more or less continuous over large areas 55
Note Record severity first and then type eg 53 = Extreme erosionScalding
Pastoral Lease Assessment Technical Manual for the Second round (2011)
Appendix 2 Crown Separation Ratio
This is a visual estimate of plant cover
It is the average distance between crowns (the area the plant takes up if viewed from above) divided by the
average size of the crown In the field this means visualising how many crowns of a given plant species can be fitted in between the distance to the nearest neighbour of that species on average over the site The
classes are as follows
CLASS TERM CSR FIELD CRITERIA
1 Present lt 12 plants lt12 plants within 200 m radius
2 Isolated clumps gt20 spaces Isolated clumps of two to five woody plants 200 m
further apart
3 Isolated Plants gt20 spaces Isolated plants
4 Very Sparse 6-20 spaces well spaced crowns well separated
5 Sparse 1-5 spaces clearly spaced crowns clearly separated
6 Mid dense 0-09 spaces crowns touching to slight separation
7 Closed or dense 0 crowns touching to overlapping
Modified from Table 14 McDonald (1990)
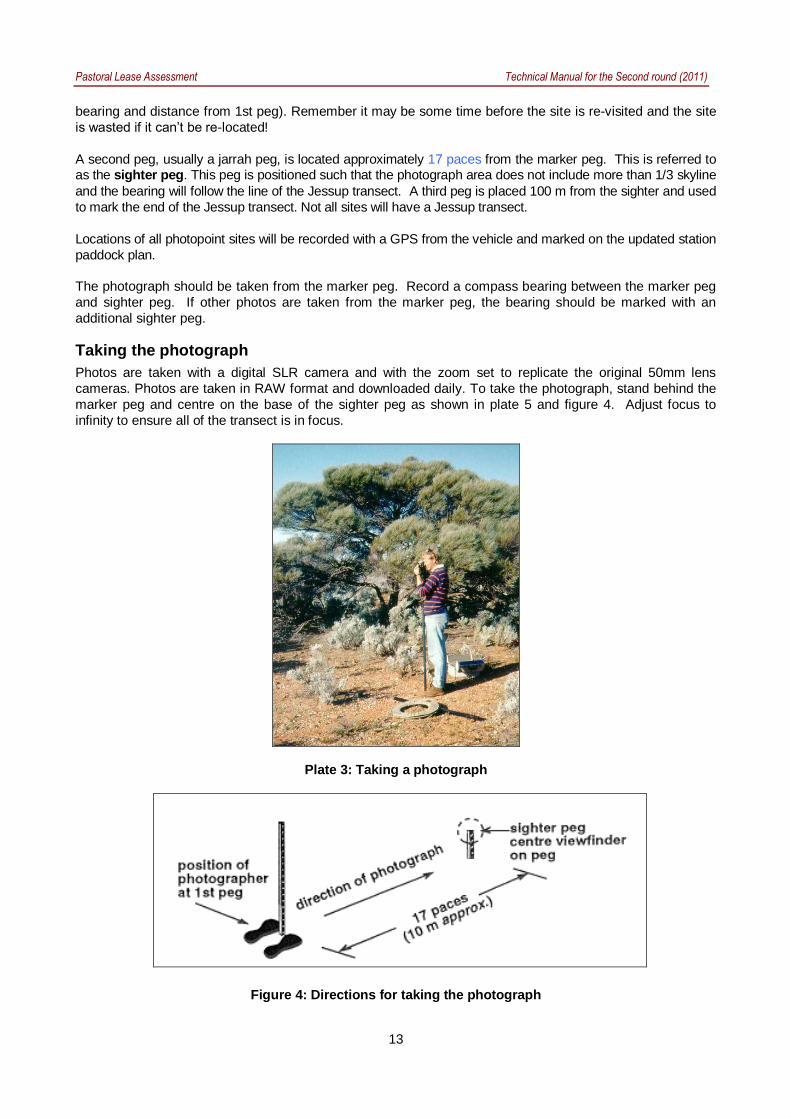
Pastoral Lease Assessment Technical Manual for the Second round (2011)
13
bearing and distance from 1st peg) Remember it may be some time before the site is re-visited and the site
is wasted if it can‟t be re-located
A second peg usually a jarrah peg is located approximately 17 paces from the marker peg This is referred to as the sighter peg This peg is positioned such that the photograph area does not include more than 13 skyline
and the bearing will follow the line of the Jessup transect A third peg is placed 100 m from the sighter and used
to mark the end of the Jessup transect Not all sites will have a Jessup transect
Locations of all photopoint sites will be recorded with a GPS from the vehicle and marked on the updated station
paddock plan
The photograph should be taken from the marker peg Record a compass bearing between the marker peg
and sighter peg If other photos are taken from the marker peg the bearing should be marked with an
additional sighter peg
Taking the photograph
Photos are taken with a digital SLR camera and with the zoom set to replicate the original 50mm lens
cameras Photos are taken in RAW format and downloaded daily To take the photograph stand behind the
marker peg and centre on the base of the sighter peg as shown in plate 5 and figure 4 Adjust focus to
infinity to ensure all of the transect is in focus
Plate 3 Taking a photograph
Figure 4 Directions for taking the photograph
Pastoral Lease Assessment Technical Manual for the Second round (2011)
14
RECORDING FIELD INFORMATION
Site description and location
Site sheets and the information collected have changed and evolved over the period of assessment An
example of the current site sheet is shown in appendix 1
Detailed below are the fields of information together with the type of detail that should be recorded Note Completed entry example shown in brackets (italics)
QS OB RS TS Prefix to describe type of photopoint followed by photopoint number
as per the disc (eg QS 2345)
QS - Quantitative site A pegged site used for monitoring vegetation
changes with Jessup andor step-point data (formerly photopoint -
PP)
OB - Observation site A pegged site used as an observation site to
monitor changes that can be detected by a photographic sequence
eg rehabilitation spread of erosion gullies Site description includes
a list of plant species but with no measured plant data collected
RS - Reference site Sites are in areas remote from grazing influence
greater than 5 km from water in sheep country and 8 km in cattle
country Also includes exclosure sites Complete all site description
and plant and soil sheets
TS - Type Site Designated for site characteristic of mapped land
system in early part of baseline assessment process As per OB but
sites were not usually pegged
PC ndash Photo Comparison Should be used strictly where a photo is to
be compared and data collected would not be required eg A
panorama on a hill top where species in the foreground are not
relevant to the background being monitored in a photo
All photopoints should be prefixed with QS OB RS PC or TS
DATE Day Month and Year (eg 01062007)
OBSERVERS Initials of persons involved in data collection Initials of the person
filling out the sheet first followed by second observer (egMTCB)
STATION Pastoral station name Use the full name of the station (eg
Bulgunnia)
PADDOCK Full paddock name may include subscript eg formerly part Cyclone
(Monsoon)
ZONE Grid reference zone generally on the bottom of the map (eg 54)
MAP SHEET Map sheet number 150000 five digits eg 66341 1100000 four
digits eg 5434 (66341)
EASTING amp NORTHING Co-ordinates on GPS Unit
Pastoral Lease Assessment Technical Manual for the Second round (2011)
15
DATUM GDA 94
SERIES Refers to the filing system for photopoint photograph series for the
station indicates the station with the month amp year the photo was
taken First four spaces are for the station (or trip name) abbreviated
to the first four letters eg Bulg for Bulgunnia Next two are digits for the month followed by two digits for the year eg (Bulg 0691)
DIGITAL Image number
WATERPOINT Name of nearest permanent water source by direct route as a sheep
would walk Note type also eg dam trough tank (Moonbi Tank)
DISTANCE (km) Distance (to one decimal point) to water source named above ie by
direct route as a sheep would walk Record the straight-line distance from the GPS (eg 16 km)
CONDITION Condition rating for the site as per condition rating guidelines Refer to
appendix 2 for condition class attributes Notes on attributes in the site comments will help to support this judgement (eg Good)
MUD MAP Diagram of how to relocate the site clearly labelled with distances
Include paddock name and adjacent paddocks track location and
gate zero origin water location site number Orient the map with
north to the top of the page
MUD MAP COMMENTS Clear directions on how to relocate the site completed according to
the following format Keep in mind that this will be printed out for the
lessee
Distance from gate or trough direction on track to next bore or
paddock along fence Place where zero taken from eg tank trough
gate - be specific What type of peg or marker was used and how far it
is off the track and in what direction Distance to sighter peg and
bearing Jessup transect length (normally 100m) and bearing from sighter peg (Use tripmeter if no Halda rally meter or similar)
Example mud map comments (15 km south of Twin Well on track to Gladstone Bore or 35km north
of gate from Dusty paddock Zero at trough Jarrah peg and disc at 15 paces east of track Sighter peg (jarrah) at 17 paces bearing 90deg Jessup transect 100 m x 2 m x 2 at 90deg end marked by jarrah peg)
EROSION Record the severity and type of erosion according to the table in
appendix 4
COMMENTS Record notes that help to further explain observations or that will
assist interpretation of the data for present and future observations
This should include notes to indicate why the site was established and
what it is monitoring It should also include notes that help explain the
condition rating and current impacts or changes including erosion
Data entry Initials of person who entered data on the database and the date of
entry (egCB 5391)
Pastoral Lease Assessment Technical Manual for the Second round (2011)
16
Establishing new sites The site details below are only relevant for new sites set up as part of the second assessmentndash not used for revisits as part of the second round
LAND SYSTEM Land system name taken from land system map (egWeedna)
ROCK TYPE Name of rock type from geological map or rock type identified at site if
geology map incorrect (egred sandstone)
FORMATION Name of rock formation from geological map (egPound Quartzite)
LANDFORM SLOPE Slope of the site measured in degrees by use of clinometer
Do not confuse degrees with (eg2deg)
ELEMENT Landform element of site
1 crest curved in down slope profile and margins at limit of observed
curvature
2 slope considered as planar Note in comments if upper mid or
lower slope
3 flat planar
4 depression may be open or closed
PATTERN Term to describe the landform type eg alluvial plain = ALP See
appendix 3 for abbreviations and descriptions (egALP)
Pastoral Lease Assessment Technical Manual for the Second round (2011)
17
Vegetation
SIGNIFICANT RAIN Yes - data collection following rains that resulted in green ephemeral
response record dates if known of significant falls
No - dry ephemeral growth only
TYPE S (summer) - rain fell between November and March
W (winter) - rain fell between April and October
I (indistinguishable) - cannot tell if resultant green ephemeral growth is
from summer or winter rain events or is a combination of both
VEGETATION SPECIES Effort should be made to record all plant species throughout the site
Recording plant species should be carried out until most species are
recorded (ie until a period of minutes elapses before further species
are not found) Record full species name on the site sheet
If plant species is not known collect a specimen fill out details in the
herbarium collection booklet and include photopoint number and line
number of record on sheet eg 234512 so that this number can be
entered on subsequent site sheets Put the herbarium label with the
specimen in the plant press Keep a list of plants collected and PPline
number so that you can give this number to collected species at other
sites Update the site sheet with the correct species name when it
comes back from the herbarium or identity confirmed
DOM Dominant species This will be used to classify vegetation
associationsgroups
1 visually pre-dominant species forming the tallest stratum CSR
class should exceed 1 (CSR 2-6)
2 if another tallest stratum species is present (co-dominant) it is
selected OR if absent the most abundant understorey species is selected eg Mai sed
3 selected from any stratum usually a lower stratum as an indicator
species (that is a species of known environmental preferences or
of such abundance that it can‟t be ignored) or to distinguish between associations eg Atr ves
4 other conspicuous species to separate associations eg Scl obl
GRAZED If a plant is obviously grazed tick the box If grazing is mainly by
rabbits or goats this should be noted in the comments
RESPROUT If the plant has previously been grazed back and is now showing fresh
new growth tick the box Note extent in comments eg Atr ves adults
showing abundant new growth following recent rains
RECRUITMENT If seedlings are evident or new suckers (eg Bullock bush) tick the
box Note height of seedlings in comments eg Mai sed seedlings to
5 cm abundant in open areas
FRUIT If the plant is in fruit tick the box This will enable data collection on
best times for seed collection Record relevant notes in comments
Pastoral Lease Assessment Technical Manual for the Second round (2011)
18
Crown Separation Ratio (CSR) The average distance between crowns divided by the average size of
the crown grouped into various size classes (see appendix 5)
1 present lt 12 plants in 200 m radii
2 isolated clumps gt20 CSR clumps of two to five woody plants 200
m further apart
3 isolated plants gt20 CSR trees gt100 m apart
4 very sparse 6-20 CSR crowns well separated
5 sparse 1-5 CSR crowns clearly separated
6 mid dense 0-09 CSR crowns touching to slightly separated
7 closed or dense crowns touching to over lapping
JESSUP Refers to the results of the Jessup transect (see section 81
for more details)
See appendix 6 for Jessup transect recording sheet Record total
counts from the Jessup transect field sheet for each species adult
and juvenile
FIRE SCARS Yes - fire scars evident on stumps trees or fence posts Fire scars
should be recorded if fire occurred since the first assessment
No - no fire scars visible
Last burn - date of last known fire Check with the lessee and record
further details in the comments eg fierce summer fire burnt out NW
corner killing all mulga
Pastoral Lease Assessment Technical Manual for the Second round (2011)
19
Vertebrates
VERTEBRATES Presentabsent for dung tracks browsed vegetation burrows
throughout the site
It is only necessary to record current or fresh activity and record as
presence (P) Old or past activity should be noted in the comments
Table 1 Vertebrate pests
Animal Sighted Dung Tracks Browse BurrowsCamp
Rabbit visual sighting fresh buck
heaps
scratchings
present
graze line with chisel
marks on stems
warren heaps
marks
warren active
Sheep visual sighting fresh dung
active padding recent grazing camps
Cattle visual sighting fresh dung active padding recent grazing camps
Goats visual sighting fresh dung active padding browse shrubs
Note in comments
height of browse line
camps
Roos visual sighting fresh dung active padding recent grazing
(check for tail drag)
camphollows
other
Others include fox cat dingo camel horse wombat etc
Note any other useful information in the general comments for example mob of 200 goats sighted More
detailed comments can be included if needed in the paddock description
Pastoral Lease Assessment Technical Manual for the Second round (2011)
20
DENSITY MEASUREMENT OF PERENNIAL PLANT SPECIES
Perennial plants provide stability to grazing management systems due to their ability to persist during dry
periods consequently the measurement of plant attributes such as density and frequency of perennials
particularly those which are palatable are important in understanding plant dynamics and rangeland condition
Plant counts within fixed belt transects have been used to determine the density of shrubs and repeated
measurements allows density changes to be detected To ensure that observer error is minimised it is vital that
the same technique and standards are used in repeat measurements Modifications made in 1990 enabled
changes to be isolated to discreet quadrats and recruitment and deaths of cohorts can be followed
Jessup transect
This method incorporates a belt transect (a standard ecological technique) that is based on an original
survey technique used for chenopod shrublands by Jessup (1951) and further developed by Lay (1979)
Their technique involved driving a vehicle over a site for a set distance and shrubs occurring within the wheel
marks (representing the belt transect) were recorded This rather destructive technique is now simulated by
a fixed 4 m x 100 m transect and enables a density and frequency estimate of perennials for each site The
frequency estimates are not based on the optimum quadrat size for all species and the 10 m x 2 m quadrats
used should not be taken to represent true frequency readings It should also be noted that species
composition by frequency is not equivalent to composition by cover or density The length of some early
transects has varied from the current standard so ensure that any future comparisons use the same transect
configuration (see 821below)
The Jessup transect method measures the density (shrubsarea) and frequency of perennial plants at sites
where perennial cover occurs ie chenopods other shrubs and tussock (perennial) grasses Counting age
classes of shrubs (adultjuvenile) gives further information on population changes Monitoring over time
provides an indication of recruitment trends
Recording is based on all perennial shrubs within the transect being recorded by species and age class
(adultjuvenile) If the base of the plant is in the transect it is counted If the foliage only is in the transect it is
not counted
Transect layout
Jessup transects are permanently marked and comprise
transects 100 m x 2 m x 2 (see figure 5)
recordings separated into 10 m x 2 m blocks
identification of perennial plant species
less than 10 cm high andor non woody base = juvenile
more than 20 individual juvenile bushes or perennial grasses per 10 m x 2 m block = 20+ recording
1 Transects should include only one land unit and preferably be restricted to one element for data
analysis Transects are 100m long and generally at right angles to the track Walk the length of the
transect to ensure it is suitable before setting up the site and identify and discuss species present
with the other observers
2 Record a compass bearing for the transect
3 Secure a surveyors tape (marked into 10 m segments) to the sighter peg and lay out the tape to 100
m keeping the marker and sighter pegs in line
4 Check that the tape is in line with the sighter and marker peg Tension the tape and drive in the peg at the 100 m mark and secure tape to the peg It is important to have the tape extended to full
100m and tight and straight so that data is replicated at the quadrat level
Pastoral Lease Assessment Technical Manual for the Second round (2011)
21
5 If the transect layout is normal note this on the sheet if different note the transect layout on the site
description sheet and orient diagram with north to the top of the page Give clear legible directions
and bearings
Figure 5 Jessup transect layout
Recording a Jessup transect
1 Use a surveyors tape that is clearly marked into 10 m intervals If it is marked with tape check that
this has not slipped from the 10 m graduations Counts should be recorded on a Jessup transect
data sheet (see appendix 6)
2 Commence transect on left side of tape (UP) using 2 m rod (refer plate below) Check that the rod is
2 m A two metre curtain pole is ideal for this
Plate 4 Recording a Jessup transect
3 Identify each perennial species If in doubt collect a specimen
4 Easiest operation is with one person observing (counting) and another recording and acting as a
checking observer The recorder (scribe) stands at the 10 m marker intervals and the observer calls
out the adultjuvenile strikes along each 10 m transect interval The recorder can assist by spotting
hidden plants and small juvenile plants
5 For plants on quadrat margins include only in the quadrat where the rooted stem is located Count
plants only if they are more than 50 rooted within the quadrat
6 Chenopods occur in clumps and it is difficult to distinguish individuals for this reason clumps are
recorded and are recognised as individual clumps if there is more than a 30 cm gap between the
rooted stems Criteria for counting plants growing close together are as follows
End peg Sighter peg Site marker amp disc
11 12 13 14 15 16 17 18 19 20
10 9 8 7 6 5 4 3 2 1
100 m
4 m
Pastoral Lease Assessment Technical Manual for the Second round (2011)
22
distinguish between individual clumps if there is more than a 30 cm gap between rooted stems
if crowns are distinct and bases are less than 30 cm apart count each as an individual
if crowns are touching or overlapping and gap between rooted stems is less than 30 cm count
as one clump
Note In cases of perennial plants such as low bluebush being grazed the reduction of the crown
may lead to higher count of bush numbers Care is required when comparing existing Jessup counts
and noted should be recorded if this type of splitting has occurred
7 Record juveniles as plants less than 10 cm high or wide and not woody However if obviously old
woody plants are grazed back to less then this size record as adults but make comment
accordingly
If greater than 20 juvenile individuals of any species encountered in 10m interval (quadrat) record as
20+ This avoids attempting to count up to 200 seedlings but still provides sufficient data to interpret
that recruitment is occurring Large numbers of seedlings can occur following favourable conditions
and it becomes difficult to count all of these However where feasible a total count of juveniles
should be undertaken
8 For perennial grasses record clumps if greater than 10 cm high or 10 cm wide ie no juvenile
categories Record count as 20 + if greater than 20 individuals within one 10 m x 2 m block This is
to aid interpretation of step-point cover data eg low density but high cover implies large spreading
individuals high density but low cover may imply a grazing effect - site comments should indicate
this The quadrat sizes are not well suited to grasses but do provide an indication of the level of
grasses within a shrubland
9 Do not record dead or completely defoliated bushes but note occurrence in comments
10 Proceed to end of transect and commence quadrats 11-20 (ie 100-0m) on other side of tape
(down)
11 Record minor site variations in comments relating to quadrat intervals eg 20-30m large scaled area
Pastoral Lease Assessment Technical Manual for the Second round (2011)
23
DATABASE AND GIS ndash needs update for ALIS and FDE
Site information is currently entered into the Arid Lands Information System (ALIS) and print-outs and
photographs are supplied to the lessee for every photopoint on the station in the form of a Photopoint
Manual
In 1991 the Geographic Analysis and Research Unit (GAR) of the Department of Housing and Urban
Development has been assisting the Pastoral Management Branch in the establishment and maintenance of
a Pastoral Geographic Information System (Malcolm and Nicolson 1995) The GAR unit operates a
centralised ARCINFO (Environmental Systems Research Institute USA) GIS facility and is the
Environmental Node of South Australia‟s Land Information System
Extensive development was carried out on ALIS and while operational is still undergoing some further
development Management of this system is though Client Services in DENR in collaboration with the
Pastoral Program Development of a system for field data entry onto GETEC tablets has been completed
and is undergoing transition into the operational phase This will improve data collection with validation in the
field and also allow considerable time saving and possible transposition errors removing one stage in the
data entry process
Lease infrastructure information is derived from a number of sources that vary in age scale and accuracy
During the assessment process topographic maps are used as a base map and information is checked
corrected of altered using various techniques Prior to the introduction of Global Positioning Systems (GPS)
in 1992 the information was collected using bearing and distance measurement that were plotted onto base
maps The improved accuracy of GPS units over time has allowed increased accuracy and therefore an
improved mapping product
Lease maps and land system maps are available as hard copy products Watered areas for each paddock
can also be produced that indicate the extent that the lease is utilised by stock Undisturbed areas represent
quality wildlife habitats and further investigations are required to study the relationships between stocking
intensity land condition and wildlife habitat More detailed information can be found in Malcolm and
Nicolson (1995)
POST TRIP PROCEEDURE
The following checklist should be completed after each trip
Download photos and GPS co-ordinates
Data entry
Update photopoint manual and make 2 copies
Conduct LCI peer review
All spatial updates sent to GIS DWLBC
Write draft Assessment report
Submit for review
Pastoral Lease Assessment Technical Manual for the Second round (2011)
CONDITION CLASS
ATTRIBUTE EXCELLENT GOOD FAIR POOR VERY POOR
PLANT SPECIES
COMPOSITION
maximum diversity of
annual and perennial
species possible for the
land type
perennial species of
various ages
some reduction in density
of palatable and
susceptible perennials
increased proportion of
shorter lived species
perennial species of
various ages
significantly reduced
cover density andor
regeneration of
palatable species
establishment of less
preferred or
unpalatable species
dominance of annual and
ephemeral species and
perennials with relatively
low palatability
no regeneration of
desirable perennial
species existing stands
degenerate
seasonal cover of
only pioneer
ephemerals or
unpalatable weeds
large areas totally
unproductive
PLANT
PRODUCTIVITY
at full potential
sustained productivity
annual com unities
maintain litter cover but
not production in dry
seasons
some fluctuation lower in
drought and may be
higher than site potential
for some species eg
Mitchell grass
reduced overall high
productivity in good
season
low in drought
(fluctuates markedly
with season)
impaired productivity
very seasonally
dependant low or non
existent in dry seasons
areas incapable of
any plant growth
SOIL EROSION
STATUS
no erosion (other than
natural features or
processes)
plant and litter cover
protect soil from wind
and water in all
seasons
minor or slight erosion
evident
increased susceptibility of
soils to erosion in dry
seasons
moderate erosion
evident
reduced density and
cover of perennial and
litter increases
susceptibility of soils to
erosion in most
seasons
severe erosion overall
high susceptibility of soils
to erosion in all seasons
extent of past erosion
renders site susceptible
to further soil movement
if grazed at any level
unstable severely
or very eroded
Pastoral Lease Assessment Technical Manual for the Second round (2011)
Appendix 1 Erosion severitytype intensity criteria ndashfor reference to first round data sheets
EROSION SeverityType intensity criteria + RATING (max 200 m radius)
NO ACCELERATED EROSION 00
SLIGHT EROSION (10 of site affected)
slight accumulation of wind blown soil and plant bases and other obstacles 11
removal of finer soil particles evident but soil crust is largely intact 12
occasional rills (lt300 mm deep) evident 13
no gullies present 14
a few scalds present usually less than 2 m in diameter 15
MINOR EROSION (10-25 of site affected)
accumulation of soil around plant bases with plant mounds noticeably enlarged 21
evidence of pedestalling but soil loss minor and plant bases not greatly elevated 22
breaking of surface crust with small erosion faces and some redistribution of soil and
or some rilling evident 23
occasional shallow gullies only 24
scalding evident but scalds relatively small and discontinuous 25
MODERATE EROSION (25-50 of site affected)
wind piling around plant bases and other obstacles is common but no plants completely covered 31
pedestalling apparent with plant bases distinctly raised and with obvious
soil loss and deflation in parts 32
surface sheeting andor rilling common with erosion faces (andor micro-
terracing) and active redistribution of soil 33
gullying present on parts of the site 34
numerous small scalds common andor with a tendency to coalesce to form larger scalds in parts 35
SEVERE EROSION (50-75 of site affected)
extreme hummocking around plants and other obstacles some plants completely covered 41
severe pedestalling with plant bases greatly elevated and major soil loss
from deflation andor much of surface generally unstable with ripple marks 42
major rilling or surface sheeting with extensive exposure of subsoil or parent material
erosion faces (andor microterracing) and active redistribution of soil 43
widespread gullying 44
scalding extensive smaller scalds have coalesced to form large more or
less continuous scalded areas 45
EXTREME EROSION (75-100 of site affected)
general surface movement area more or less bare with formation of shifting dunes 51
most of original land surface altered any last remnants of original soil or
vegetation standing as sentinels in a barren landscape 52
water sheeting andor rilling coalesced to expose subsoil or parent material 53
extensive gullying 54
scalding more or less continuous over large areas 55
Note Record severity first and then type eg 53 = Extreme erosionScalding
Pastoral Lease Assessment Technical Manual for the Second round (2011)
Appendix 2 Crown Separation Ratio
This is a visual estimate of plant cover
It is the average distance between crowns (the area the plant takes up if viewed from above) divided by the
average size of the crown In the field this means visualising how many crowns of a given plant species can be fitted in between the distance to the nearest neighbour of that species on average over the site The
classes are as follows
CLASS TERM CSR FIELD CRITERIA
1 Present lt 12 plants lt12 plants within 200 m radius
2 Isolated clumps gt20 spaces Isolated clumps of two to five woody plants 200 m
further apart
3 Isolated Plants gt20 spaces Isolated plants
4 Very Sparse 6-20 spaces well spaced crowns well separated
5 Sparse 1-5 spaces clearly spaced crowns clearly separated
6 Mid dense 0-09 spaces crowns touching to slight separation
7 Closed or dense 0 crowns touching to overlapping
Modified from Table 14 McDonald (1990)
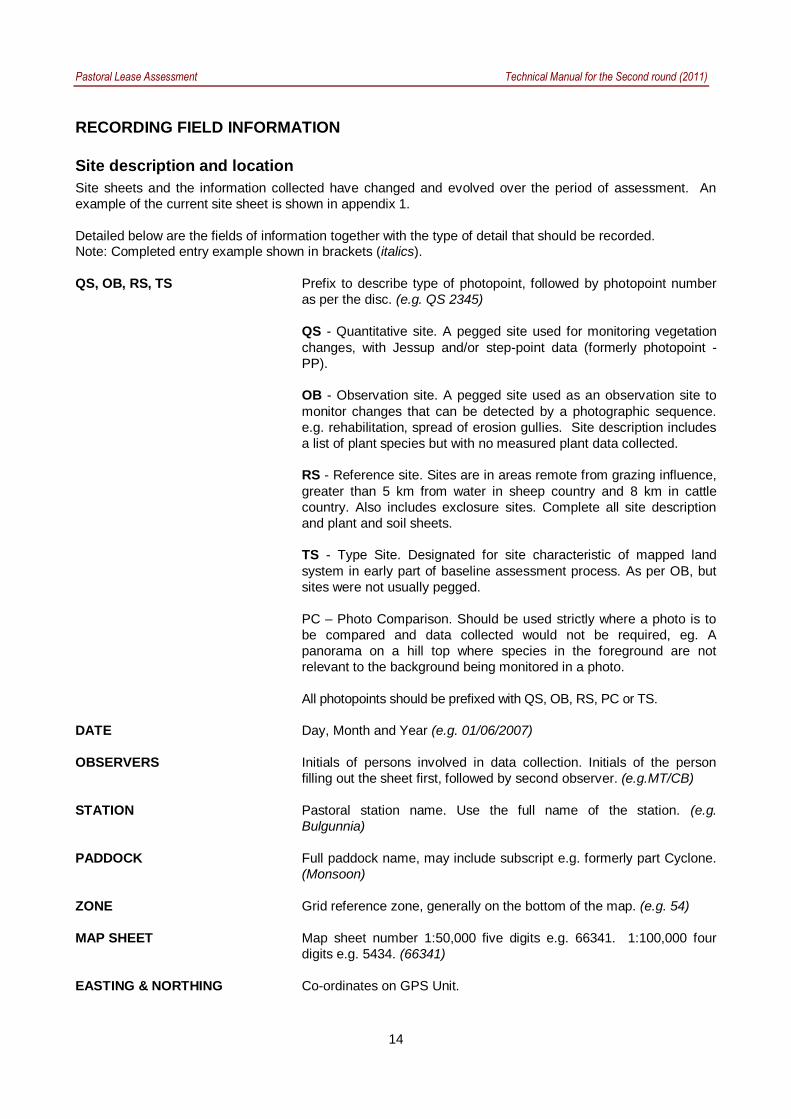
Pastoral Lease Assessment Technical Manual for the Second round (2011)
14
RECORDING FIELD INFORMATION
Site description and location
Site sheets and the information collected have changed and evolved over the period of assessment An
example of the current site sheet is shown in appendix 1
Detailed below are the fields of information together with the type of detail that should be recorded Note Completed entry example shown in brackets (italics)
QS OB RS TS Prefix to describe type of photopoint followed by photopoint number
as per the disc (eg QS 2345)
QS - Quantitative site A pegged site used for monitoring vegetation
changes with Jessup andor step-point data (formerly photopoint -
PP)
OB - Observation site A pegged site used as an observation site to
monitor changes that can be detected by a photographic sequence
eg rehabilitation spread of erosion gullies Site description includes
a list of plant species but with no measured plant data collected
RS - Reference site Sites are in areas remote from grazing influence
greater than 5 km from water in sheep country and 8 km in cattle
country Also includes exclosure sites Complete all site description
and plant and soil sheets
TS - Type Site Designated for site characteristic of mapped land
system in early part of baseline assessment process As per OB but
sites were not usually pegged
PC ndash Photo Comparison Should be used strictly where a photo is to
be compared and data collected would not be required eg A
panorama on a hill top where species in the foreground are not
relevant to the background being monitored in a photo
All photopoints should be prefixed with QS OB RS PC or TS
DATE Day Month and Year (eg 01062007)
OBSERVERS Initials of persons involved in data collection Initials of the person
filling out the sheet first followed by second observer (egMTCB)
STATION Pastoral station name Use the full name of the station (eg
Bulgunnia)
PADDOCK Full paddock name may include subscript eg formerly part Cyclone
(Monsoon)
ZONE Grid reference zone generally on the bottom of the map (eg 54)
MAP SHEET Map sheet number 150000 five digits eg 66341 1100000 four
digits eg 5434 (66341)
EASTING amp NORTHING Co-ordinates on GPS Unit
Pastoral Lease Assessment Technical Manual for the Second round (2011)
15
DATUM GDA 94
SERIES Refers to the filing system for photopoint photograph series for the
station indicates the station with the month amp year the photo was
taken First four spaces are for the station (or trip name) abbreviated
to the first four letters eg Bulg for Bulgunnia Next two are digits for the month followed by two digits for the year eg (Bulg 0691)
DIGITAL Image number
WATERPOINT Name of nearest permanent water source by direct route as a sheep
would walk Note type also eg dam trough tank (Moonbi Tank)
DISTANCE (km) Distance (to one decimal point) to water source named above ie by
direct route as a sheep would walk Record the straight-line distance from the GPS (eg 16 km)
CONDITION Condition rating for the site as per condition rating guidelines Refer to
appendix 2 for condition class attributes Notes on attributes in the site comments will help to support this judgement (eg Good)
MUD MAP Diagram of how to relocate the site clearly labelled with distances
Include paddock name and adjacent paddocks track location and
gate zero origin water location site number Orient the map with
north to the top of the page
MUD MAP COMMENTS Clear directions on how to relocate the site completed according to
the following format Keep in mind that this will be printed out for the
lessee
Distance from gate or trough direction on track to next bore or
paddock along fence Place where zero taken from eg tank trough
gate - be specific What type of peg or marker was used and how far it
is off the track and in what direction Distance to sighter peg and
bearing Jessup transect length (normally 100m) and bearing from sighter peg (Use tripmeter if no Halda rally meter or similar)
Example mud map comments (15 km south of Twin Well on track to Gladstone Bore or 35km north
of gate from Dusty paddock Zero at trough Jarrah peg and disc at 15 paces east of track Sighter peg (jarrah) at 17 paces bearing 90deg Jessup transect 100 m x 2 m x 2 at 90deg end marked by jarrah peg)
EROSION Record the severity and type of erosion according to the table in
appendix 4
COMMENTS Record notes that help to further explain observations or that will
assist interpretation of the data for present and future observations
This should include notes to indicate why the site was established and
what it is monitoring It should also include notes that help explain the
condition rating and current impacts or changes including erosion
Data entry Initials of person who entered data on the database and the date of
entry (egCB 5391)
Pastoral Lease Assessment Technical Manual for the Second round (2011)
16
Establishing new sites The site details below are only relevant for new sites set up as part of the second assessmentndash not used for revisits as part of the second round
LAND SYSTEM Land system name taken from land system map (egWeedna)
ROCK TYPE Name of rock type from geological map or rock type identified at site if
geology map incorrect (egred sandstone)
FORMATION Name of rock formation from geological map (egPound Quartzite)
LANDFORM SLOPE Slope of the site measured in degrees by use of clinometer
Do not confuse degrees with (eg2deg)
ELEMENT Landform element of site
1 crest curved in down slope profile and margins at limit of observed
curvature
2 slope considered as planar Note in comments if upper mid or
lower slope
3 flat planar
4 depression may be open or closed
PATTERN Term to describe the landform type eg alluvial plain = ALP See
appendix 3 for abbreviations and descriptions (egALP)
Pastoral Lease Assessment Technical Manual for the Second round (2011)
17
Vegetation
SIGNIFICANT RAIN Yes - data collection following rains that resulted in green ephemeral
response record dates if known of significant falls
No - dry ephemeral growth only
TYPE S (summer) - rain fell between November and March
W (winter) - rain fell between April and October
I (indistinguishable) - cannot tell if resultant green ephemeral growth is
from summer or winter rain events or is a combination of both
VEGETATION SPECIES Effort should be made to record all plant species throughout the site
Recording plant species should be carried out until most species are
recorded (ie until a period of minutes elapses before further species
are not found) Record full species name on the site sheet
If plant species is not known collect a specimen fill out details in the
herbarium collection booklet and include photopoint number and line
number of record on sheet eg 234512 so that this number can be
entered on subsequent site sheets Put the herbarium label with the
specimen in the plant press Keep a list of plants collected and PPline
number so that you can give this number to collected species at other
sites Update the site sheet with the correct species name when it
comes back from the herbarium or identity confirmed
DOM Dominant species This will be used to classify vegetation
associationsgroups
1 visually pre-dominant species forming the tallest stratum CSR
class should exceed 1 (CSR 2-6)
2 if another tallest stratum species is present (co-dominant) it is
selected OR if absent the most abundant understorey species is selected eg Mai sed
3 selected from any stratum usually a lower stratum as an indicator
species (that is a species of known environmental preferences or
of such abundance that it can‟t be ignored) or to distinguish between associations eg Atr ves
4 other conspicuous species to separate associations eg Scl obl
GRAZED If a plant is obviously grazed tick the box If grazing is mainly by
rabbits or goats this should be noted in the comments
RESPROUT If the plant has previously been grazed back and is now showing fresh
new growth tick the box Note extent in comments eg Atr ves adults
showing abundant new growth following recent rains
RECRUITMENT If seedlings are evident or new suckers (eg Bullock bush) tick the
box Note height of seedlings in comments eg Mai sed seedlings to
5 cm abundant in open areas
FRUIT If the plant is in fruit tick the box This will enable data collection on
best times for seed collection Record relevant notes in comments
Pastoral Lease Assessment Technical Manual for the Second round (2011)
18
Crown Separation Ratio (CSR) The average distance between crowns divided by the average size of
the crown grouped into various size classes (see appendix 5)
1 present lt 12 plants in 200 m radii
2 isolated clumps gt20 CSR clumps of two to five woody plants 200
m further apart
3 isolated plants gt20 CSR trees gt100 m apart
4 very sparse 6-20 CSR crowns well separated
5 sparse 1-5 CSR crowns clearly separated
6 mid dense 0-09 CSR crowns touching to slightly separated
7 closed or dense crowns touching to over lapping
JESSUP Refers to the results of the Jessup transect (see section 81
for more details)
See appendix 6 for Jessup transect recording sheet Record total
counts from the Jessup transect field sheet for each species adult
and juvenile
FIRE SCARS Yes - fire scars evident on stumps trees or fence posts Fire scars
should be recorded if fire occurred since the first assessment
No - no fire scars visible
Last burn - date of last known fire Check with the lessee and record
further details in the comments eg fierce summer fire burnt out NW
corner killing all mulga
Pastoral Lease Assessment Technical Manual for the Second round (2011)
19
Vertebrates
VERTEBRATES Presentabsent for dung tracks browsed vegetation burrows
throughout the site
It is only necessary to record current or fresh activity and record as
presence (P) Old or past activity should be noted in the comments
Table 1 Vertebrate pests
Animal Sighted Dung Tracks Browse BurrowsCamp
Rabbit visual sighting fresh buck
heaps
scratchings
present
graze line with chisel
marks on stems
warren heaps
marks
warren active
Sheep visual sighting fresh dung
active padding recent grazing camps
Cattle visual sighting fresh dung active padding recent grazing camps
Goats visual sighting fresh dung active padding browse shrubs
Note in comments
height of browse line
camps
Roos visual sighting fresh dung active padding recent grazing
(check for tail drag)
camphollows
other
Others include fox cat dingo camel horse wombat etc
Note any other useful information in the general comments for example mob of 200 goats sighted More
detailed comments can be included if needed in the paddock description
Pastoral Lease Assessment Technical Manual for the Second round (2011)
20
DENSITY MEASUREMENT OF PERENNIAL PLANT SPECIES
Perennial plants provide stability to grazing management systems due to their ability to persist during dry
periods consequently the measurement of plant attributes such as density and frequency of perennials
particularly those which are palatable are important in understanding plant dynamics and rangeland condition
Plant counts within fixed belt transects have been used to determine the density of shrubs and repeated
measurements allows density changes to be detected To ensure that observer error is minimised it is vital that
the same technique and standards are used in repeat measurements Modifications made in 1990 enabled
changes to be isolated to discreet quadrats and recruitment and deaths of cohorts can be followed
Jessup transect
This method incorporates a belt transect (a standard ecological technique) that is based on an original
survey technique used for chenopod shrublands by Jessup (1951) and further developed by Lay (1979)
Their technique involved driving a vehicle over a site for a set distance and shrubs occurring within the wheel
marks (representing the belt transect) were recorded This rather destructive technique is now simulated by
a fixed 4 m x 100 m transect and enables a density and frequency estimate of perennials for each site The
frequency estimates are not based on the optimum quadrat size for all species and the 10 m x 2 m quadrats
used should not be taken to represent true frequency readings It should also be noted that species
composition by frequency is not equivalent to composition by cover or density The length of some early
transects has varied from the current standard so ensure that any future comparisons use the same transect
configuration (see 821below)
The Jessup transect method measures the density (shrubsarea) and frequency of perennial plants at sites
where perennial cover occurs ie chenopods other shrubs and tussock (perennial) grasses Counting age
classes of shrubs (adultjuvenile) gives further information on population changes Monitoring over time
provides an indication of recruitment trends
Recording is based on all perennial shrubs within the transect being recorded by species and age class
(adultjuvenile) If the base of the plant is in the transect it is counted If the foliage only is in the transect it is
not counted
Transect layout
Jessup transects are permanently marked and comprise
transects 100 m x 2 m x 2 (see figure 5)
recordings separated into 10 m x 2 m blocks
identification of perennial plant species
less than 10 cm high andor non woody base = juvenile
more than 20 individual juvenile bushes or perennial grasses per 10 m x 2 m block = 20+ recording
1 Transects should include only one land unit and preferably be restricted to one element for data
analysis Transects are 100m long and generally at right angles to the track Walk the length of the
transect to ensure it is suitable before setting up the site and identify and discuss species present
with the other observers
2 Record a compass bearing for the transect
3 Secure a surveyors tape (marked into 10 m segments) to the sighter peg and lay out the tape to 100
m keeping the marker and sighter pegs in line
4 Check that the tape is in line with the sighter and marker peg Tension the tape and drive in the peg at the 100 m mark and secure tape to the peg It is important to have the tape extended to full
100m and tight and straight so that data is replicated at the quadrat level
Pastoral Lease Assessment Technical Manual for the Second round (2011)
21
5 If the transect layout is normal note this on the sheet if different note the transect layout on the site
description sheet and orient diagram with north to the top of the page Give clear legible directions
and bearings
Figure 5 Jessup transect layout
Recording a Jessup transect
1 Use a surveyors tape that is clearly marked into 10 m intervals If it is marked with tape check that
this has not slipped from the 10 m graduations Counts should be recorded on a Jessup transect
data sheet (see appendix 6)
2 Commence transect on left side of tape (UP) using 2 m rod (refer plate below) Check that the rod is
2 m A two metre curtain pole is ideal for this
Plate 4 Recording a Jessup transect
3 Identify each perennial species If in doubt collect a specimen
4 Easiest operation is with one person observing (counting) and another recording and acting as a
checking observer The recorder (scribe) stands at the 10 m marker intervals and the observer calls
out the adultjuvenile strikes along each 10 m transect interval The recorder can assist by spotting
hidden plants and small juvenile plants
5 For plants on quadrat margins include only in the quadrat where the rooted stem is located Count
plants only if they are more than 50 rooted within the quadrat
6 Chenopods occur in clumps and it is difficult to distinguish individuals for this reason clumps are
recorded and are recognised as individual clumps if there is more than a 30 cm gap between the
rooted stems Criteria for counting plants growing close together are as follows
End peg Sighter peg Site marker amp disc
11 12 13 14 15 16 17 18 19 20
10 9 8 7 6 5 4 3 2 1
100 m
4 m
Pastoral Lease Assessment Technical Manual for the Second round (2011)
22
distinguish between individual clumps if there is more than a 30 cm gap between rooted stems
if crowns are distinct and bases are less than 30 cm apart count each as an individual
if crowns are touching or overlapping and gap between rooted stems is less than 30 cm count
as one clump
Note In cases of perennial plants such as low bluebush being grazed the reduction of the crown
may lead to higher count of bush numbers Care is required when comparing existing Jessup counts
and noted should be recorded if this type of splitting has occurred
7 Record juveniles as plants less than 10 cm high or wide and not woody However if obviously old
woody plants are grazed back to less then this size record as adults but make comment
accordingly
If greater than 20 juvenile individuals of any species encountered in 10m interval (quadrat) record as
20+ This avoids attempting to count up to 200 seedlings but still provides sufficient data to interpret
that recruitment is occurring Large numbers of seedlings can occur following favourable conditions
and it becomes difficult to count all of these However where feasible a total count of juveniles
should be undertaken
8 For perennial grasses record clumps if greater than 10 cm high or 10 cm wide ie no juvenile
categories Record count as 20 + if greater than 20 individuals within one 10 m x 2 m block This is
to aid interpretation of step-point cover data eg low density but high cover implies large spreading
individuals high density but low cover may imply a grazing effect - site comments should indicate
this The quadrat sizes are not well suited to grasses but do provide an indication of the level of
grasses within a shrubland
9 Do not record dead or completely defoliated bushes but note occurrence in comments
10 Proceed to end of transect and commence quadrats 11-20 (ie 100-0m) on other side of tape
(down)
11 Record minor site variations in comments relating to quadrat intervals eg 20-30m large scaled area
Pastoral Lease Assessment Technical Manual for the Second round (2011)
23
DATABASE AND GIS ndash needs update for ALIS and FDE
Site information is currently entered into the Arid Lands Information System (ALIS) and print-outs and
photographs are supplied to the lessee for every photopoint on the station in the form of a Photopoint
Manual
In 1991 the Geographic Analysis and Research Unit (GAR) of the Department of Housing and Urban
Development has been assisting the Pastoral Management Branch in the establishment and maintenance of
a Pastoral Geographic Information System (Malcolm and Nicolson 1995) The GAR unit operates a
centralised ARCINFO (Environmental Systems Research Institute USA) GIS facility and is the
Environmental Node of South Australia‟s Land Information System
Extensive development was carried out on ALIS and while operational is still undergoing some further
development Management of this system is though Client Services in DENR in collaboration with the
Pastoral Program Development of a system for field data entry onto GETEC tablets has been completed
and is undergoing transition into the operational phase This will improve data collection with validation in the
field and also allow considerable time saving and possible transposition errors removing one stage in the
data entry process
Lease infrastructure information is derived from a number of sources that vary in age scale and accuracy
During the assessment process topographic maps are used as a base map and information is checked
corrected of altered using various techniques Prior to the introduction of Global Positioning Systems (GPS)
in 1992 the information was collected using bearing and distance measurement that were plotted onto base
maps The improved accuracy of GPS units over time has allowed increased accuracy and therefore an
improved mapping product
Lease maps and land system maps are available as hard copy products Watered areas for each paddock
can also be produced that indicate the extent that the lease is utilised by stock Undisturbed areas represent
quality wildlife habitats and further investigations are required to study the relationships between stocking
intensity land condition and wildlife habitat More detailed information can be found in Malcolm and
Nicolson (1995)
POST TRIP PROCEEDURE
The following checklist should be completed after each trip
Download photos and GPS co-ordinates
Data entry
Update photopoint manual and make 2 copies
Conduct LCI peer review
All spatial updates sent to GIS DWLBC
Write draft Assessment report
Submit for review
Pastoral Lease Assessment Technical Manual for the Second round (2011)
CONDITION CLASS
ATTRIBUTE EXCELLENT GOOD FAIR POOR VERY POOR
PLANT SPECIES
COMPOSITION
maximum diversity of
annual and perennial
species possible for the
land type
perennial species of
various ages
some reduction in density
of palatable and
susceptible perennials
increased proportion of
shorter lived species
perennial species of
various ages
significantly reduced
cover density andor
regeneration of
palatable species
establishment of less
preferred or
unpalatable species
dominance of annual and
ephemeral species and
perennials with relatively
low palatability
no regeneration of
desirable perennial
species existing stands
degenerate
seasonal cover of
only pioneer
ephemerals or
unpalatable weeds
large areas totally
unproductive
PLANT
PRODUCTIVITY
at full potential
sustained productivity
annual com unities
maintain litter cover but
not production in dry
seasons
some fluctuation lower in
drought and may be
higher than site potential
for some species eg
Mitchell grass
reduced overall high
productivity in good
season
low in drought
(fluctuates markedly
with season)
impaired productivity
very seasonally
dependant low or non
existent in dry seasons
areas incapable of
any plant growth
SOIL EROSION
STATUS
no erosion (other than
natural features or
processes)
plant and litter cover
protect soil from wind
and water in all
seasons
minor or slight erosion
evident
increased susceptibility of
soils to erosion in dry
seasons
moderate erosion
evident
reduced density and
cover of perennial and
litter increases
susceptibility of soils to
erosion in most
seasons
severe erosion overall
high susceptibility of soils
to erosion in all seasons
extent of past erosion
renders site susceptible
to further soil movement
if grazed at any level
unstable severely
or very eroded
Pastoral Lease Assessment Technical Manual for the Second round (2011)
Appendix 1 Erosion severitytype intensity criteria ndashfor reference to first round data sheets
EROSION SeverityType intensity criteria + RATING (max 200 m radius)
NO ACCELERATED EROSION 00
SLIGHT EROSION (10 of site affected)
slight accumulation of wind blown soil and plant bases and other obstacles 11
removal of finer soil particles evident but soil crust is largely intact 12
occasional rills (lt300 mm deep) evident 13
no gullies present 14
a few scalds present usually less than 2 m in diameter 15
MINOR EROSION (10-25 of site affected)
accumulation of soil around plant bases with plant mounds noticeably enlarged 21
evidence of pedestalling but soil loss minor and plant bases not greatly elevated 22
breaking of surface crust with small erosion faces and some redistribution of soil and
or some rilling evident 23
occasional shallow gullies only 24
scalding evident but scalds relatively small and discontinuous 25
MODERATE EROSION (25-50 of site affected)
wind piling around plant bases and other obstacles is common but no plants completely covered 31
pedestalling apparent with plant bases distinctly raised and with obvious
soil loss and deflation in parts 32
surface sheeting andor rilling common with erosion faces (andor micro-
terracing) and active redistribution of soil 33
gullying present on parts of the site 34
numerous small scalds common andor with a tendency to coalesce to form larger scalds in parts 35
SEVERE EROSION (50-75 of site affected)
extreme hummocking around plants and other obstacles some plants completely covered 41
severe pedestalling with plant bases greatly elevated and major soil loss
from deflation andor much of surface generally unstable with ripple marks 42
major rilling or surface sheeting with extensive exposure of subsoil or parent material
erosion faces (andor microterracing) and active redistribution of soil 43
widespread gullying 44
scalding extensive smaller scalds have coalesced to form large more or
less continuous scalded areas 45
EXTREME EROSION (75-100 of site affected)
general surface movement area more or less bare with formation of shifting dunes 51
most of original land surface altered any last remnants of original soil or
vegetation standing as sentinels in a barren landscape 52
water sheeting andor rilling coalesced to expose subsoil or parent material 53
extensive gullying 54
scalding more or less continuous over large areas 55
Note Record severity first and then type eg 53 = Extreme erosionScalding
Pastoral Lease Assessment Technical Manual for the Second round (2011)
Appendix 2 Crown Separation Ratio
This is a visual estimate of plant cover
It is the average distance between crowns (the area the plant takes up if viewed from above) divided by the
average size of the crown In the field this means visualising how many crowns of a given plant species can be fitted in between the distance to the nearest neighbour of that species on average over the site The
classes are as follows
CLASS TERM CSR FIELD CRITERIA
1 Present lt 12 plants lt12 plants within 200 m radius
2 Isolated clumps gt20 spaces Isolated clumps of two to five woody plants 200 m
further apart
3 Isolated Plants gt20 spaces Isolated plants
4 Very Sparse 6-20 spaces well spaced crowns well separated
5 Sparse 1-5 spaces clearly spaced crowns clearly separated
6 Mid dense 0-09 spaces crowns touching to slight separation
7 Closed or dense 0 crowns touching to overlapping
Modified from Table 14 McDonald (1990)
Pastoral Lease Assessment Technical Manual for the Second round (2011)
15
DATUM GDA 94
SERIES Refers to the filing system for photopoint photograph series for the
station indicates the station with the month amp year the photo was
taken First four spaces are for the station (or trip name) abbreviated
to the first four letters eg Bulg for Bulgunnia Next two are digits for the month followed by two digits for the year eg (Bulg 0691)
DIGITAL Image number
WATERPOINT Name of nearest permanent water source by direct route as a sheep
would walk Note type also eg dam trough tank (Moonbi Tank)
DISTANCE (km) Distance (to one decimal point) to water source named above ie by
direct route as a sheep would walk Record the straight-line distance from the GPS (eg 16 km)
CONDITION Condition rating for the site as per condition rating guidelines Refer to
appendix 2 for condition class attributes Notes on attributes in the site comments will help to support this judgement (eg Good)
MUD MAP Diagram of how to relocate the site clearly labelled with distances
Include paddock name and adjacent paddocks track location and
gate zero origin water location site number Orient the map with
north to the top of the page
MUD MAP COMMENTS Clear directions on how to relocate the site completed according to
the following format Keep in mind that this will be printed out for the
lessee
Distance from gate or trough direction on track to next bore or
paddock along fence Place where zero taken from eg tank trough
gate - be specific What type of peg or marker was used and how far it
is off the track and in what direction Distance to sighter peg and
bearing Jessup transect length (normally 100m) and bearing from sighter peg (Use tripmeter if no Halda rally meter or similar)
Example mud map comments (15 km south of Twin Well on track to Gladstone Bore or 35km north
of gate from Dusty paddock Zero at trough Jarrah peg and disc at 15 paces east of track Sighter peg (jarrah) at 17 paces bearing 90deg Jessup transect 100 m x 2 m x 2 at 90deg end marked by jarrah peg)
EROSION Record the severity and type of erosion according to the table in
appendix 4
COMMENTS Record notes that help to further explain observations or that will
assist interpretation of the data for present and future observations
This should include notes to indicate why the site was established and
what it is monitoring It should also include notes that help explain the
condition rating and current impacts or changes including erosion
Data entry Initials of person who entered data on the database and the date of
entry (egCB 5391)
Pastoral Lease Assessment Technical Manual for the Second round (2011)
16
Establishing new sites The site details below are only relevant for new sites set up as part of the second assessmentndash not used for revisits as part of the second round
LAND SYSTEM Land system name taken from land system map (egWeedna)
ROCK TYPE Name of rock type from geological map or rock type identified at site if
geology map incorrect (egred sandstone)
FORMATION Name of rock formation from geological map (egPound Quartzite)
LANDFORM SLOPE Slope of the site measured in degrees by use of clinometer
Do not confuse degrees with (eg2deg)
ELEMENT Landform element of site
1 crest curved in down slope profile and margins at limit of observed
curvature
2 slope considered as planar Note in comments if upper mid or
lower slope
3 flat planar
4 depression may be open or closed
PATTERN Term to describe the landform type eg alluvial plain = ALP See
appendix 3 for abbreviations and descriptions (egALP)
Pastoral Lease Assessment Technical Manual for the Second round (2011)
17
Vegetation
SIGNIFICANT RAIN Yes - data collection following rains that resulted in green ephemeral
response record dates if known of significant falls
No - dry ephemeral growth only
TYPE S (summer) - rain fell between November and March
W (winter) - rain fell between April and October
I (indistinguishable) - cannot tell if resultant green ephemeral growth is
from summer or winter rain events or is a combination of both
VEGETATION SPECIES Effort should be made to record all plant species throughout the site
Recording plant species should be carried out until most species are
recorded (ie until a period of minutes elapses before further species
are not found) Record full species name on the site sheet
If plant species is not known collect a specimen fill out details in the
herbarium collection booklet and include photopoint number and line
number of record on sheet eg 234512 so that this number can be
entered on subsequent site sheets Put the herbarium label with the
specimen in the plant press Keep a list of plants collected and PPline
number so that you can give this number to collected species at other
sites Update the site sheet with the correct species name when it
comes back from the herbarium or identity confirmed
DOM Dominant species This will be used to classify vegetation
associationsgroups
1 visually pre-dominant species forming the tallest stratum CSR
class should exceed 1 (CSR 2-6)
2 if another tallest stratum species is present (co-dominant) it is
selected OR if absent the most abundant understorey species is selected eg Mai sed
3 selected from any stratum usually a lower stratum as an indicator
species (that is a species of known environmental preferences or
of such abundance that it can‟t be ignored) or to distinguish between associations eg Atr ves
4 other conspicuous species to separate associations eg Scl obl
GRAZED If a plant is obviously grazed tick the box If grazing is mainly by
rabbits or goats this should be noted in the comments
RESPROUT If the plant has previously been grazed back and is now showing fresh
new growth tick the box Note extent in comments eg Atr ves adults
showing abundant new growth following recent rains
RECRUITMENT If seedlings are evident or new suckers (eg Bullock bush) tick the
box Note height of seedlings in comments eg Mai sed seedlings to
5 cm abundant in open areas
FRUIT If the plant is in fruit tick the box This will enable data collection on
best times for seed collection Record relevant notes in comments
Pastoral Lease Assessment Technical Manual for the Second round (2011)
18
Crown Separation Ratio (CSR) The average distance between crowns divided by the average size of
the crown grouped into various size classes (see appendix 5)
1 present lt 12 plants in 200 m radii
2 isolated clumps gt20 CSR clumps of two to five woody plants 200
m further apart
3 isolated plants gt20 CSR trees gt100 m apart
4 very sparse 6-20 CSR crowns well separated
5 sparse 1-5 CSR crowns clearly separated
6 mid dense 0-09 CSR crowns touching to slightly separated
7 closed or dense crowns touching to over lapping
JESSUP Refers to the results of the Jessup transect (see section 81
for more details)
See appendix 6 for Jessup transect recording sheet Record total
counts from the Jessup transect field sheet for each species adult
and juvenile
FIRE SCARS Yes - fire scars evident on stumps trees or fence posts Fire scars
should be recorded if fire occurred since the first assessment
No - no fire scars visible
Last burn - date of last known fire Check with the lessee and record
further details in the comments eg fierce summer fire burnt out NW
corner killing all mulga
Pastoral Lease Assessment Technical Manual for the Second round (2011)
19
Vertebrates
VERTEBRATES Presentabsent for dung tracks browsed vegetation burrows
throughout the site
It is only necessary to record current or fresh activity and record as
presence (P) Old or past activity should be noted in the comments
Table 1 Vertebrate pests
Animal Sighted Dung Tracks Browse BurrowsCamp
Rabbit visual sighting fresh buck
heaps
scratchings
present
graze line with chisel
marks on stems
warren heaps
marks
warren active
Sheep visual sighting fresh dung
active padding recent grazing camps
Cattle visual sighting fresh dung active padding recent grazing camps
Goats visual sighting fresh dung active padding browse shrubs
Note in comments
height of browse line
camps
Roos visual sighting fresh dung active padding recent grazing
(check for tail drag)
camphollows
other
Others include fox cat dingo camel horse wombat etc
Note any other useful information in the general comments for example mob of 200 goats sighted More
detailed comments can be included if needed in the paddock description
Pastoral Lease Assessment Technical Manual for the Second round (2011)
20
DENSITY MEASUREMENT OF PERENNIAL PLANT SPECIES
Perennial plants provide stability to grazing management systems due to their ability to persist during dry
periods consequently the measurement of plant attributes such as density and frequency of perennials
particularly those which are palatable are important in understanding plant dynamics and rangeland condition
Plant counts within fixed belt transects have been used to determine the density of shrubs and repeated
measurements allows density changes to be detected To ensure that observer error is minimised it is vital that
the same technique and standards are used in repeat measurements Modifications made in 1990 enabled
changes to be isolated to discreet quadrats and recruitment and deaths of cohorts can be followed
Jessup transect
This method incorporates a belt transect (a standard ecological technique) that is based on an original
survey technique used for chenopod shrublands by Jessup (1951) and further developed by Lay (1979)
Their technique involved driving a vehicle over a site for a set distance and shrubs occurring within the wheel
marks (representing the belt transect) were recorded This rather destructive technique is now simulated by
a fixed 4 m x 100 m transect and enables a density and frequency estimate of perennials for each site The
frequency estimates are not based on the optimum quadrat size for all species and the 10 m x 2 m quadrats
used should not be taken to represent true frequency readings It should also be noted that species
composition by frequency is not equivalent to composition by cover or density The length of some early
transects has varied from the current standard so ensure that any future comparisons use the same transect
configuration (see 821below)
The Jessup transect method measures the density (shrubsarea) and frequency of perennial plants at sites
where perennial cover occurs ie chenopods other shrubs and tussock (perennial) grasses Counting age
classes of shrubs (adultjuvenile) gives further information on population changes Monitoring over time
provides an indication of recruitment trends
Recording is based on all perennial shrubs within the transect being recorded by species and age class
(adultjuvenile) If the base of the plant is in the transect it is counted If the foliage only is in the transect it is
not counted
Transect layout
Jessup transects are permanently marked and comprise
transects 100 m x 2 m x 2 (see figure 5)
recordings separated into 10 m x 2 m blocks
identification of perennial plant species
less than 10 cm high andor non woody base = juvenile
more than 20 individual juvenile bushes or perennial grasses per 10 m x 2 m block = 20+ recording
1 Transects should include only one land unit and preferably be restricted to one element for data
analysis Transects are 100m long and generally at right angles to the track Walk the length of the
transect to ensure it is suitable before setting up the site and identify and discuss species present
with the other observers
2 Record a compass bearing for the transect
3 Secure a surveyors tape (marked into 10 m segments) to the sighter peg and lay out the tape to 100
m keeping the marker and sighter pegs in line
4 Check that the tape is in line with the sighter and marker peg Tension the tape and drive in the peg at the 100 m mark and secure tape to the peg It is important to have the tape extended to full
100m and tight and straight so that data is replicated at the quadrat level
Pastoral Lease Assessment Technical Manual for the Second round (2011)
21
5 If the transect layout is normal note this on the sheet if different note the transect layout on the site
description sheet and orient diagram with north to the top of the page Give clear legible directions
and bearings
Figure 5 Jessup transect layout
Recording a Jessup transect
1 Use a surveyors tape that is clearly marked into 10 m intervals If it is marked with tape check that
this has not slipped from the 10 m graduations Counts should be recorded on a Jessup transect
data sheet (see appendix 6)
2 Commence transect on left side of tape (UP) using 2 m rod (refer plate below) Check that the rod is
2 m A two metre curtain pole is ideal for this
Plate 4 Recording a Jessup transect
3 Identify each perennial species If in doubt collect a specimen
4 Easiest operation is with one person observing (counting) and another recording and acting as a
checking observer The recorder (scribe) stands at the 10 m marker intervals and the observer calls
out the adultjuvenile strikes along each 10 m transect interval The recorder can assist by spotting
hidden plants and small juvenile plants
5 For plants on quadrat margins include only in the quadrat where the rooted stem is located Count
plants only if they are more than 50 rooted within the quadrat
6 Chenopods occur in clumps and it is difficult to distinguish individuals for this reason clumps are
recorded and are recognised as individual clumps if there is more than a 30 cm gap between the
rooted stems Criteria for counting plants growing close together are as follows
End peg Sighter peg Site marker amp disc
11 12 13 14 15 16 17 18 19 20
10 9 8 7 6 5 4 3 2 1
100 m
4 m
Pastoral Lease Assessment Technical Manual for the Second round (2011)
22
distinguish between individual clumps if there is more than a 30 cm gap between rooted stems
if crowns are distinct and bases are less than 30 cm apart count each as an individual
if crowns are touching or overlapping and gap between rooted stems is less than 30 cm count
as one clump
Note In cases of perennial plants such as low bluebush being grazed the reduction of the crown
may lead to higher count of bush numbers Care is required when comparing existing Jessup counts
and noted should be recorded if this type of splitting has occurred
7 Record juveniles as plants less than 10 cm high or wide and not woody However if obviously old
woody plants are grazed back to less then this size record as adults but make comment
accordingly
If greater than 20 juvenile individuals of any species encountered in 10m interval (quadrat) record as
20+ This avoids attempting to count up to 200 seedlings but still provides sufficient data to interpret
that recruitment is occurring Large numbers of seedlings can occur following favourable conditions
and it becomes difficult to count all of these However where feasible a total count of juveniles
should be undertaken
8 For perennial grasses record clumps if greater than 10 cm high or 10 cm wide ie no juvenile
categories Record count as 20 + if greater than 20 individuals within one 10 m x 2 m block This is
to aid interpretation of step-point cover data eg low density but high cover implies large spreading
individuals high density but low cover may imply a grazing effect - site comments should indicate
this The quadrat sizes are not well suited to grasses but do provide an indication of the level of
grasses within a shrubland
9 Do not record dead or completely defoliated bushes but note occurrence in comments
10 Proceed to end of transect and commence quadrats 11-20 (ie 100-0m) on other side of tape
(down)
11 Record minor site variations in comments relating to quadrat intervals eg 20-30m large scaled area
Pastoral Lease Assessment Technical Manual for the Second round (2011)
23
DATABASE AND GIS ndash needs update for ALIS and FDE
Site information is currently entered into the Arid Lands Information System (ALIS) and print-outs and
photographs are supplied to the lessee for every photopoint on the station in the form of a Photopoint
Manual
In 1991 the Geographic Analysis and Research Unit (GAR) of the Department of Housing and Urban
Development has been assisting the Pastoral Management Branch in the establishment and maintenance of
a Pastoral Geographic Information System (Malcolm and Nicolson 1995) The GAR unit operates a
centralised ARCINFO (Environmental Systems Research Institute USA) GIS facility and is the
Environmental Node of South Australia‟s Land Information System
Extensive development was carried out on ALIS and while operational is still undergoing some further
development Management of this system is though Client Services in DENR in collaboration with the
Pastoral Program Development of a system for field data entry onto GETEC tablets has been completed
and is undergoing transition into the operational phase This will improve data collection with validation in the
field and also allow considerable time saving and possible transposition errors removing one stage in the
data entry process
Lease infrastructure information is derived from a number of sources that vary in age scale and accuracy
During the assessment process topographic maps are used as a base map and information is checked
corrected of altered using various techniques Prior to the introduction of Global Positioning Systems (GPS)
in 1992 the information was collected using bearing and distance measurement that were plotted onto base
maps The improved accuracy of GPS units over time has allowed increased accuracy and therefore an
improved mapping product
Lease maps and land system maps are available as hard copy products Watered areas for each paddock
can also be produced that indicate the extent that the lease is utilised by stock Undisturbed areas represent
quality wildlife habitats and further investigations are required to study the relationships between stocking
intensity land condition and wildlife habitat More detailed information can be found in Malcolm and
Nicolson (1995)
POST TRIP PROCEEDURE
The following checklist should be completed after each trip
Download photos and GPS co-ordinates
Data entry
Update photopoint manual and make 2 copies
Conduct LCI peer review
All spatial updates sent to GIS DWLBC
Write draft Assessment report
Submit for review
Pastoral Lease Assessment Technical Manual for the Second round (2011)
CONDITION CLASS
ATTRIBUTE EXCELLENT GOOD FAIR POOR VERY POOR
PLANT SPECIES
COMPOSITION
maximum diversity of
annual and perennial
species possible for the
land type
perennial species of
various ages
some reduction in density
of palatable and
susceptible perennials
increased proportion of
shorter lived species
perennial species of
various ages
significantly reduced
cover density andor
regeneration of
palatable species
establishment of less
preferred or
unpalatable species
dominance of annual and
ephemeral species and
perennials with relatively
low palatability
no regeneration of
desirable perennial
species existing stands
degenerate
seasonal cover of
only pioneer
ephemerals or
unpalatable weeds
large areas totally
unproductive
PLANT
PRODUCTIVITY
at full potential
sustained productivity
annual com unities
maintain litter cover but
not production in dry
seasons
some fluctuation lower in
drought and may be
higher than site potential
for some species eg
Mitchell grass
reduced overall high
productivity in good
season
low in drought
(fluctuates markedly
with season)
impaired productivity
very seasonally
dependant low or non
existent in dry seasons
areas incapable of
any plant growth
SOIL EROSION
STATUS
no erosion (other than
natural features or
processes)
plant and litter cover
protect soil from wind
and water in all
seasons
minor or slight erosion
evident
increased susceptibility of
soils to erosion in dry
seasons
moderate erosion
evident
reduced density and
cover of perennial and
litter increases
susceptibility of soils to
erosion in most
seasons
severe erosion overall
high susceptibility of soils
to erosion in all seasons
extent of past erosion
renders site susceptible
to further soil movement
if grazed at any level
unstable severely
or very eroded
Pastoral Lease Assessment Technical Manual for the Second round (2011)
Appendix 1 Erosion severitytype intensity criteria ndashfor reference to first round data sheets
EROSION SeverityType intensity criteria + RATING (max 200 m radius)
NO ACCELERATED EROSION 00
SLIGHT EROSION (10 of site affected)
slight accumulation of wind blown soil and plant bases and other obstacles 11
removal of finer soil particles evident but soil crust is largely intact 12
occasional rills (lt300 mm deep) evident 13
no gullies present 14
a few scalds present usually less than 2 m in diameter 15
MINOR EROSION (10-25 of site affected)
accumulation of soil around plant bases with plant mounds noticeably enlarged 21
evidence of pedestalling but soil loss minor and plant bases not greatly elevated 22
breaking of surface crust with small erosion faces and some redistribution of soil and
or some rilling evident 23
occasional shallow gullies only 24
scalding evident but scalds relatively small and discontinuous 25
MODERATE EROSION (25-50 of site affected)
wind piling around plant bases and other obstacles is common but no plants completely covered 31
pedestalling apparent with plant bases distinctly raised and with obvious
soil loss and deflation in parts 32
surface sheeting andor rilling common with erosion faces (andor micro-
terracing) and active redistribution of soil 33
gullying present on parts of the site 34
numerous small scalds common andor with a tendency to coalesce to form larger scalds in parts 35
SEVERE EROSION (50-75 of site affected)
extreme hummocking around plants and other obstacles some plants completely covered 41
severe pedestalling with plant bases greatly elevated and major soil loss
from deflation andor much of surface generally unstable with ripple marks 42
major rilling or surface sheeting with extensive exposure of subsoil or parent material
erosion faces (andor microterracing) and active redistribution of soil 43
widespread gullying 44
scalding extensive smaller scalds have coalesced to form large more or
less continuous scalded areas 45
EXTREME EROSION (75-100 of site affected)
general surface movement area more or less bare with formation of shifting dunes 51
most of original land surface altered any last remnants of original soil or
vegetation standing as sentinels in a barren landscape 52
water sheeting andor rilling coalesced to expose subsoil or parent material 53
extensive gullying 54
scalding more or less continuous over large areas 55
Note Record severity first and then type eg 53 = Extreme erosionScalding
Pastoral Lease Assessment Technical Manual for the Second round (2011)
Appendix 2 Crown Separation Ratio
This is a visual estimate of plant cover
It is the average distance between crowns (the area the plant takes up if viewed from above) divided by the
average size of the crown In the field this means visualising how many crowns of a given plant species can be fitted in between the distance to the nearest neighbour of that species on average over the site The
classes are as follows
CLASS TERM CSR FIELD CRITERIA
1 Present lt 12 plants lt12 plants within 200 m radius
2 Isolated clumps gt20 spaces Isolated clumps of two to five woody plants 200 m
further apart
3 Isolated Plants gt20 spaces Isolated plants
4 Very Sparse 6-20 spaces well spaced crowns well separated
5 Sparse 1-5 spaces clearly spaced crowns clearly separated
6 Mid dense 0-09 spaces crowns touching to slight separation
7 Closed or dense 0 crowns touching to overlapping
Modified from Table 14 McDonald (1990)

Pastoral Lease Assessment Technical Manual for the Second round (2011)
18
Crown Separation Ratio (CSR) The average distance between crowns divided by the average size of
the crown grouped into various size classes (see appendix 5)
1 present lt 12 plants in 200 m radii
2 isolated clumps gt20 CSR clumps of two to five woody plants 200
m further apart
3 isolated plants gt20 CSR trees gt100 m apart
4 very sparse 6-20 CSR crowns well separated
5 sparse 1-5 CSR crowns clearly separated
6 mid dense 0-09 CSR crowns touching to slightly separated
7 closed or dense crowns touching to over lapping
JESSUP Refers to the results of the Jessup transect (see section 81
for more details)
See appendix 6 for Jessup transect recording sheet Record total
counts from the Jessup transect field sheet for each species adult
and juvenile
FIRE SCARS Yes - fire scars evident on stumps trees or fence posts Fire scars
should be recorded if fire occurred since the first assessment
No - no fire scars visible
Last burn - date of last known fire Check with the lessee and record
further details in the comments eg fierce summer fire burnt out NW
corner killing all mulga
Pastoral Lease Assessment Technical Manual for the Second round (2011)
19
Vertebrates
VERTEBRATES Presentabsent for dung tracks browsed vegetation burrows
throughout the site
It is only necessary to record current or fresh activity and record as
presence (P) Old or past activity should be noted in the comments
Table 1 Vertebrate pests
Animal Sighted Dung Tracks Browse BurrowsCamp
Rabbit visual sighting fresh buck
heaps
scratchings
present
graze line with chisel
marks on stems
warren heaps
marks
warren active
Sheep visual sighting fresh dung
active padding recent grazing camps
Cattle visual sighting fresh dung active padding recent grazing camps
Goats visual sighting fresh dung active padding browse shrubs
Note in comments
height of browse line
camps
Roos visual sighting fresh dung active padding recent grazing
(check for tail drag)
camphollows
other
Others include fox cat dingo camel horse wombat etc
Note any other useful information in the general comments for example mob of 200 goats sighted More
detailed comments can be included if needed in the paddock description
Pastoral Lease Assessment Technical Manual for the Second round (2011)
20
DENSITY MEASUREMENT OF PERENNIAL PLANT SPECIES
Perennial plants provide stability to grazing management systems due to their ability to persist during dry
periods consequently the measurement of plant attributes such as density and frequency of perennials
particularly those which are palatable are important in understanding plant dynamics and rangeland condition
Plant counts within fixed belt transects have been used to determine the density of shrubs and repeated
measurements allows density changes to be detected To ensure that observer error is minimised it is vital that
the same technique and standards are used in repeat measurements Modifications made in 1990 enabled
changes to be isolated to discreet quadrats and recruitment and deaths of cohorts can be followed
Jessup transect
This method incorporates a belt transect (a standard ecological technique) that is based on an original
survey technique used for chenopod shrublands by Jessup (1951) and further developed by Lay (1979)
Their technique involved driving a vehicle over a site for a set distance and shrubs occurring within the wheel
marks (representing the belt transect) were recorded This rather destructive technique is now simulated by
a fixed 4 m x 100 m transect and enables a density and frequency estimate of perennials for each site The
frequency estimates are not based on the optimum quadrat size for all species and the 10 m x 2 m quadrats
used should not be taken to represent true frequency readings It should also be noted that species
composition by frequency is not equivalent to composition by cover or density The length of some early
transects has varied from the current standard so ensure that any future comparisons use the same transect
configuration (see 821below)
The Jessup transect method measures the density (shrubsarea) and frequency of perennial plants at sites
where perennial cover occurs ie chenopods other shrubs and tussock (perennial) grasses Counting age
classes of shrubs (adultjuvenile) gives further information on population changes Monitoring over time
provides an indication of recruitment trends
Recording is based on all perennial shrubs within the transect being recorded by species and age class
(adultjuvenile) If the base of the plant is in the transect it is counted If the foliage only is in the transect it is
not counted
Transect layout
Jessup transects are permanently marked and comprise
transects 100 m x 2 m x 2 (see figure 5)
recordings separated into 10 m x 2 m blocks
identification of perennial plant species
less than 10 cm high andor non woody base = juvenile
more than 20 individual juvenile bushes or perennial grasses per 10 m x 2 m block = 20+ recording
1 Transects should include only one land unit and preferably be restricted to one element for data
analysis Transects are 100m long and generally at right angles to the track Walk the length of the
transect to ensure it is suitable before setting up the site and identify and discuss species present
with the other observers
2 Record a compass bearing for the transect
3 Secure a surveyors tape (marked into 10 m segments) to the sighter peg and lay out the tape to 100
m keeping the marker and sighter pegs in line
4 Check that the tape is in line with the sighter and marker peg Tension the tape and drive in the peg at the 100 m mark and secure tape to the peg It is important to have the tape extended to full
100m and tight and straight so that data is replicated at the quadrat level
Pastoral Lease Assessment Technical Manual for the Second round (2011)
21
5 If the transect layout is normal note this on the sheet if different note the transect layout on the site
description sheet and orient diagram with north to the top of the page Give clear legible directions
and bearings
Figure 5 Jessup transect layout
Recording a Jessup transect
1 Use a surveyors tape that is clearly marked into 10 m intervals If it is marked with tape check that
this has not slipped from the 10 m graduations Counts should be recorded on a Jessup transect
data sheet (see appendix 6)
2 Commence transect on left side of tape (UP) using 2 m rod (refer plate below) Check that the rod is
2 m A two metre curtain pole is ideal for this
Plate 4 Recording a Jessup transect
3 Identify each perennial species If in doubt collect a specimen
4 Easiest operation is with one person observing (counting) and another recording and acting as a
checking observer The recorder (scribe) stands at the 10 m marker intervals and the observer calls
out the adultjuvenile strikes along each 10 m transect interval The recorder can assist by spotting
hidden plants and small juvenile plants
5 For plants on quadrat margins include only in the quadrat where the rooted stem is located Count
plants only if they are more than 50 rooted within the quadrat
6 Chenopods occur in clumps and it is difficult to distinguish individuals for this reason clumps are
recorded and are recognised as individual clumps if there is more than a 30 cm gap between the
rooted stems Criteria for counting plants growing close together are as follows
End peg Sighter peg Site marker amp disc
11 12 13 14 15 16 17 18 19 20
10 9 8 7 6 5 4 3 2 1
100 m
4 m
Pastoral Lease Assessment Technical Manual for the Second round (2011)
22
distinguish between individual clumps if there is more than a 30 cm gap between rooted stems
if crowns are distinct and bases are less than 30 cm apart count each as an individual
if crowns are touching or overlapping and gap between rooted stems is less than 30 cm count
as one clump
Note In cases of perennial plants such as low bluebush being grazed the reduction of the crown
may lead to higher count of bush numbers Care is required when comparing existing Jessup counts
and noted should be recorded if this type of splitting has occurred
7 Record juveniles as plants less than 10 cm high or wide and not woody However if obviously old
woody plants are grazed back to less then this size record as adults but make comment
accordingly
If greater than 20 juvenile individuals of any species encountered in 10m interval (quadrat) record as
20+ This avoids attempting to count up to 200 seedlings but still provides sufficient data to interpret
that recruitment is occurring Large numbers of seedlings can occur following favourable conditions
and it becomes difficult to count all of these However where feasible a total count of juveniles
should be undertaken
8 For perennial grasses record clumps if greater than 10 cm high or 10 cm wide ie no juvenile
categories Record count as 20 + if greater than 20 individuals within one 10 m x 2 m block This is
to aid interpretation of step-point cover data eg low density but high cover implies large spreading
individuals high density but low cover may imply a grazing effect - site comments should indicate
this The quadrat sizes are not well suited to grasses but do provide an indication of the level of
grasses within a shrubland
9 Do not record dead or completely defoliated bushes but note occurrence in comments
10 Proceed to end of transect and commence quadrats 11-20 (ie 100-0m) on other side of tape
(down)
11 Record minor site variations in comments relating to quadrat intervals eg 20-30m large scaled area
Pastoral Lease Assessment Technical Manual for the Second round (2011)
23
DATABASE AND GIS ndash needs update for ALIS and FDE
Site information is currently entered into the Arid Lands Information System (ALIS) and print-outs and
photographs are supplied to the lessee for every photopoint on the station in the form of a Photopoint
Manual
In 1991 the Geographic Analysis and Research Unit (GAR) of the Department of Housing and Urban
Development has been assisting the Pastoral Management Branch in the establishment and maintenance of
a Pastoral Geographic Information System (Malcolm and Nicolson 1995) The GAR unit operates a
centralised ARCINFO (Environmental Systems Research Institute USA) GIS facility and is the
Environmental Node of South Australia‟s Land Information System
Extensive development was carried out on ALIS and while operational is still undergoing some further
development Management of this system is though Client Services in DENR in collaboration with the
Pastoral Program Development of a system for field data entry onto GETEC tablets has been completed
and is undergoing transition into the operational phase This will improve data collection with validation in the
field and also allow considerable time saving and possible transposition errors removing one stage in the
data entry process
Lease infrastructure information is derived from a number of sources that vary in age scale and accuracy
During the assessment process topographic maps are used as a base map and information is checked
corrected of altered using various techniques Prior to the introduction of Global Positioning Systems (GPS)
in 1992 the information was collected using bearing and distance measurement that were plotted onto base
maps The improved accuracy of GPS units over time has allowed increased accuracy and therefore an
improved mapping product
Lease maps and land system maps are available as hard copy products Watered areas for each paddock
can also be produced that indicate the extent that the lease is utilised by stock Undisturbed areas represent
quality wildlife habitats and further investigations are required to study the relationships between stocking
intensity land condition and wildlife habitat More detailed information can be found in Malcolm and
Nicolson (1995)
POST TRIP PROCEEDURE
The following checklist should be completed after each trip
Download photos and GPS co-ordinates
Data entry
Update photopoint manual and make 2 copies
Conduct LCI peer review
All spatial updates sent to GIS DWLBC
Write draft Assessment report
Submit for review
Pastoral Lease Assessment Technical Manual for the Second round (2011)
CONDITION CLASS
ATTRIBUTE EXCELLENT GOOD FAIR POOR VERY POOR
PLANT SPECIES
COMPOSITION
maximum diversity of
annual and perennial
species possible for the
land type
perennial species of
various ages
some reduction in density
of palatable and
susceptible perennials
increased proportion of
shorter lived species
perennial species of
various ages
significantly reduced
cover density andor
regeneration of
palatable species
establishment of less
preferred or
unpalatable species
dominance of annual and
ephemeral species and
perennials with relatively
low palatability
no regeneration of
desirable perennial
species existing stands
degenerate
seasonal cover of
only pioneer
ephemerals or
unpalatable weeds
large areas totally
unproductive
PLANT
PRODUCTIVITY
at full potential
sustained productivity
annual com unities
maintain litter cover but
not production in dry
seasons
some fluctuation lower in
drought and may be
higher than site potential
for some species eg
Mitchell grass
reduced overall high
productivity in good
season
low in drought
(fluctuates markedly
with season)
impaired productivity
very seasonally
dependant low or non
existent in dry seasons
areas incapable of
any plant growth
SOIL EROSION
STATUS
no erosion (other than
natural features or
processes)
plant and litter cover
protect soil from wind
and water in all
seasons
minor or slight erosion
evident
increased susceptibility of
soils to erosion in dry
seasons
moderate erosion
evident
reduced density and
cover of perennial and
litter increases
susceptibility of soils to
erosion in most
seasons
severe erosion overall
high susceptibility of soils
to erosion in all seasons
extent of past erosion
renders site susceptible
to further soil movement
if grazed at any level
unstable severely
or very eroded
Pastoral Lease Assessment Technical Manual for the Second round (2011)
Appendix 1 Erosion severitytype intensity criteria ndashfor reference to first round data sheets
EROSION SeverityType intensity criteria + RATING (max 200 m radius)
NO ACCELERATED EROSION 00
SLIGHT EROSION (10 of site affected)
slight accumulation of wind blown soil and plant bases and other obstacles 11
removal of finer soil particles evident but soil crust is largely intact 12
occasional rills (lt300 mm deep) evident 13
no gullies present 14
a few scalds present usually less than 2 m in diameter 15
MINOR EROSION (10-25 of site affected)
accumulation of soil around plant bases with plant mounds noticeably enlarged 21
evidence of pedestalling but soil loss minor and plant bases not greatly elevated 22
breaking of surface crust with small erosion faces and some redistribution of soil and
or some rilling evident 23
occasional shallow gullies only 24
scalding evident but scalds relatively small and discontinuous 25
MODERATE EROSION (25-50 of site affected)
wind piling around plant bases and other obstacles is common but no plants completely covered 31
pedestalling apparent with plant bases distinctly raised and with obvious
soil loss and deflation in parts 32
surface sheeting andor rilling common with erosion faces (andor micro-
terracing) and active redistribution of soil 33
gullying present on parts of the site 34
numerous small scalds common andor with a tendency to coalesce to form larger scalds in parts 35
SEVERE EROSION (50-75 of site affected)
extreme hummocking around plants and other obstacles some plants completely covered 41
severe pedestalling with plant bases greatly elevated and major soil loss
from deflation andor much of surface generally unstable with ripple marks 42
major rilling or surface sheeting with extensive exposure of subsoil or parent material
erosion faces (andor microterracing) and active redistribution of soil 43
widespread gullying 44
scalding extensive smaller scalds have coalesced to form large more or
less continuous scalded areas 45
EXTREME EROSION (75-100 of site affected)
general surface movement area more or less bare with formation of shifting dunes 51
most of original land surface altered any last remnants of original soil or
vegetation standing as sentinels in a barren landscape 52
water sheeting andor rilling coalesced to expose subsoil or parent material 53
extensive gullying 54
scalding more or less continuous over large areas 55
Note Record severity first and then type eg 53 = Extreme erosionScalding
Pastoral Lease Assessment Technical Manual for the Second round (2011)
Appendix 2 Crown Separation Ratio
This is a visual estimate of plant cover
It is the average distance between crowns (the area the plant takes up if viewed from above) divided by the
average size of the crown In the field this means visualising how many crowns of a given plant species can be fitted in between the distance to the nearest neighbour of that species on average over the site The
classes are as follows
CLASS TERM CSR FIELD CRITERIA
1 Present lt 12 plants lt12 plants within 200 m radius
2 Isolated clumps gt20 spaces Isolated clumps of two to five woody plants 200 m
further apart
3 Isolated Plants gt20 spaces Isolated plants
4 Very Sparse 6-20 spaces well spaced crowns well separated
5 Sparse 1-5 spaces clearly spaced crowns clearly separated
6 Mid dense 0-09 spaces crowns touching to slight separation
7 Closed or dense 0 crowns touching to overlapping
Modified from Table 14 McDonald (1990)
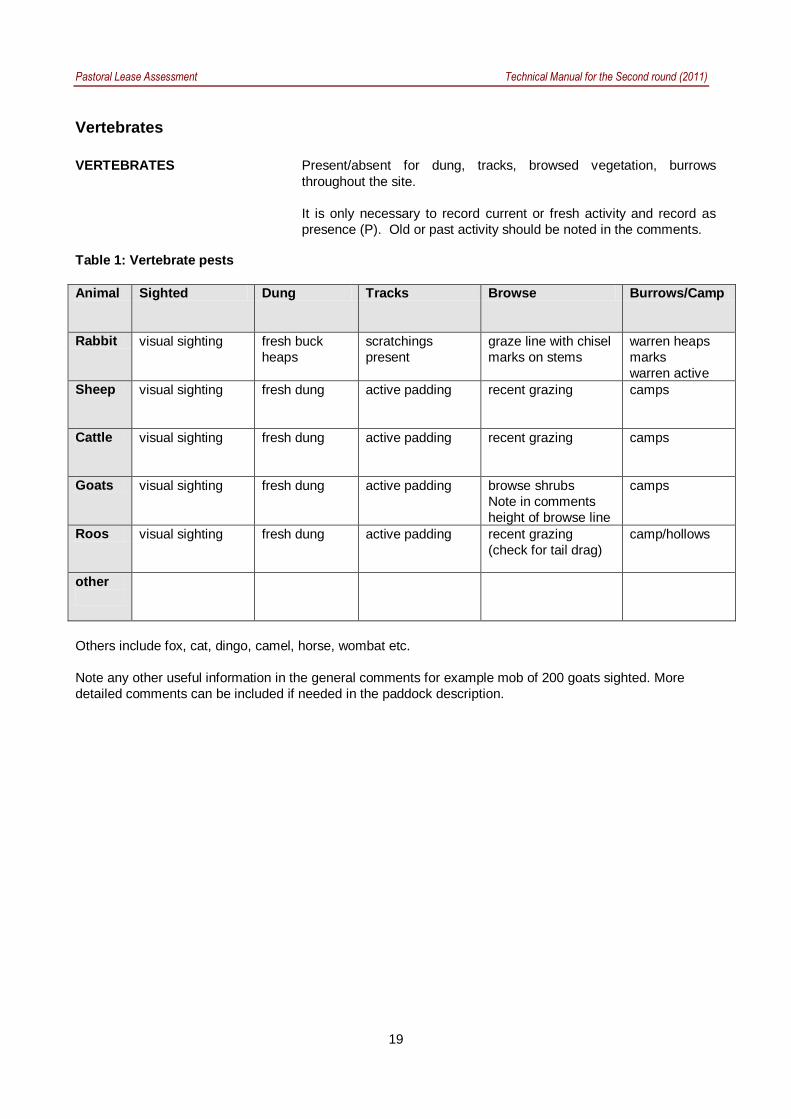
Pastoral Lease Assessment Technical Manual for the Second round (2011)
19
Vertebrates
VERTEBRATES Presentabsent for dung tracks browsed vegetation burrows
throughout the site
It is only necessary to record current or fresh activity and record as
presence (P) Old or past activity should be noted in the comments
Table 1 Vertebrate pests
Animal Sighted Dung Tracks Browse BurrowsCamp
Rabbit visual sighting fresh buck
heaps
scratchings
present
graze line with chisel
marks on stems
warren heaps
marks
warren active
Sheep visual sighting fresh dung
active padding recent grazing camps
Cattle visual sighting fresh dung active padding recent grazing camps
Goats visual sighting fresh dung active padding browse shrubs
Note in comments
height of browse line
camps
Roos visual sighting fresh dung active padding recent grazing
(check for tail drag)
camphollows
other
Others include fox cat dingo camel horse wombat etc
Note any other useful information in the general comments for example mob of 200 goats sighted More
detailed comments can be included if needed in the paddock description
Pastoral Lease Assessment Technical Manual for the Second round (2011)
20
DENSITY MEASUREMENT OF PERENNIAL PLANT SPECIES
Perennial plants provide stability to grazing management systems due to their ability to persist during dry
periods consequently the measurement of plant attributes such as density and frequency of perennials
particularly those which are palatable are important in understanding plant dynamics and rangeland condition
Plant counts within fixed belt transects have been used to determine the density of shrubs and repeated
measurements allows density changes to be detected To ensure that observer error is minimised it is vital that
the same technique and standards are used in repeat measurements Modifications made in 1990 enabled
changes to be isolated to discreet quadrats and recruitment and deaths of cohorts can be followed
Jessup transect
This method incorporates a belt transect (a standard ecological technique) that is based on an original
survey technique used for chenopod shrublands by Jessup (1951) and further developed by Lay (1979)
Their technique involved driving a vehicle over a site for a set distance and shrubs occurring within the wheel
marks (representing the belt transect) were recorded This rather destructive technique is now simulated by
a fixed 4 m x 100 m transect and enables a density and frequency estimate of perennials for each site The
frequency estimates are not based on the optimum quadrat size for all species and the 10 m x 2 m quadrats
used should not be taken to represent true frequency readings It should also be noted that species
composition by frequency is not equivalent to composition by cover or density The length of some early
transects has varied from the current standard so ensure that any future comparisons use the same transect
configuration (see 821below)
The Jessup transect method measures the density (shrubsarea) and frequency of perennial plants at sites
where perennial cover occurs ie chenopods other shrubs and tussock (perennial) grasses Counting age
classes of shrubs (adultjuvenile) gives further information on population changes Monitoring over time
provides an indication of recruitment trends
Recording is based on all perennial shrubs within the transect being recorded by species and age class
(adultjuvenile) If the base of the plant is in the transect it is counted If the foliage only is in the transect it is
not counted
Transect layout
Jessup transects are permanently marked and comprise
transects 100 m x 2 m x 2 (see figure 5)
recordings separated into 10 m x 2 m blocks
identification of perennial plant species
less than 10 cm high andor non woody base = juvenile
more than 20 individual juvenile bushes or perennial grasses per 10 m x 2 m block = 20+ recording
1 Transects should include only one land unit and preferably be restricted to one element for data
analysis Transects are 100m long and generally at right angles to the track Walk the length of the
transect to ensure it is suitable before setting up the site and identify and discuss species present
with the other observers
2 Record a compass bearing for the transect
3 Secure a surveyors tape (marked into 10 m segments) to the sighter peg and lay out the tape to 100
m keeping the marker and sighter pegs in line
4 Check that the tape is in line with the sighter and marker peg Tension the tape and drive in the peg at the 100 m mark and secure tape to the peg It is important to have the tape extended to full
100m and tight and straight so that data is replicated at the quadrat level
Pastoral Lease Assessment Technical Manual for the Second round (2011)
21
5 If the transect layout is normal note this on the sheet if different note the transect layout on the site
description sheet and orient diagram with north to the top of the page Give clear legible directions
and bearings
Figure 5 Jessup transect layout
Recording a Jessup transect
1 Use a surveyors tape that is clearly marked into 10 m intervals If it is marked with tape check that
this has not slipped from the 10 m graduations Counts should be recorded on a Jessup transect
data sheet (see appendix 6)
2 Commence transect on left side of tape (UP) using 2 m rod (refer plate below) Check that the rod is
2 m A two metre curtain pole is ideal for this
Plate 4 Recording a Jessup transect
3 Identify each perennial species If in doubt collect a specimen
4 Easiest operation is with one person observing (counting) and another recording and acting as a
checking observer The recorder (scribe) stands at the 10 m marker intervals and the observer calls
out the adultjuvenile strikes along each 10 m transect interval The recorder can assist by spotting
hidden plants and small juvenile plants
5 For plants on quadrat margins include only in the quadrat where the rooted stem is located Count
plants only if they are more than 50 rooted within the quadrat
6 Chenopods occur in clumps and it is difficult to distinguish individuals for this reason clumps are
recorded and are recognised as individual clumps if there is more than a 30 cm gap between the
rooted stems Criteria for counting plants growing close together are as follows
End peg Sighter peg Site marker amp disc
11 12 13 14 15 16 17 18 19 20
10 9 8 7 6 5 4 3 2 1
100 m
4 m
Pastoral Lease Assessment Technical Manual for the Second round (2011)
22
distinguish between individual clumps if there is more than a 30 cm gap between rooted stems
if crowns are distinct and bases are less than 30 cm apart count each as an individual
if crowns are touching or overlapping and gap between rooted stems is less than 30 cm count
as one clump
Note In cases of perennial plants such as low bluebush being grazed the reduction of the crown
may lead to higher count of bush numbers Care is required when comparing existing Jessup counts
and noted should be recorded if this type of splitting has occurred
7 Record juveniles as plants less than 10 cm high or wide and not woody However if obviously old
woody plants are grazed back to less then this size record as adults but make comment
accordingly
If greater than 20 juvenile individuals of any species encountered in 10m interval (quadrat) record as
20+ This avoids attempting to count up to 200 seedlings but still provides sufficient data to interpret
that recruitment is occurring Large numbers of seedlings can occur following favourable conditions
and it becomes difficult to count all of these However where feasible a total count of juveniles
should be undertaken
8 For perennial grasses record clumps if greater than 10 cm high or 10 cm wide ie no juvenile
categories Record count as 20 + if greater than 20 individuals within one 10 m x 2 m block This is
to aid interpretation of step-point cover data eg low density but high cover implies large spreading
individuals high density but low cover may imply a grazing effect - site comments should indicate
this The quadrat sizes are not well suited to grasses but do provide an indication of the level of
grasses within a shrubland
9 Do not record dead or completely defoliated bushes but note occurrence in comments
10 Proceed to end of transect and commence quadrats 11-20 (ie 100-0m) on other side of tape
(down)
11 Record minor site variations in comments relating to quadrat intervals eg 20-30m large scaled area
Pastoral Lease Assessment Technical Manual for the Second round (2011)
23
DATABASE AND GIS ndash needs update for ALIS and FDE
Site information is currently entered into the Arid Lands Information System (ALIS) and print-outs and
photographs are supplied to the lessee for every photopoint on the station in the form of a Photopoint
Manual
In 1991 the Geographic Analysis and Research Unit (GAR) of the Department of Housing and Urban
Development has been assisting the Pastoral Management Branch in the establishment and maintenance of
a Pastoral Geographic Information System (Malcolm and Nicolson 1995) The GAR unit operates a
centralised ARCINFO (Environmental Systems Research Institute USA) GIS facility and is the
Environmental Node of South Australia‟s Land Information System
Extensive development was carried out on ALIS and while operational is still undergoing some further
development Management of this system is though Client Services in DENR in collaboration with the
Pastoral Program Development of a system for field data entry onto GETEC tablets has been completed
and is undergoing transition into the operational phase This will improve data collection with validation in the
field and also allow considerable time saving and possible transposition errors removing one stage in the
data entry process
Lease infrastructure information is derived from a number of sources that vary in age scale and accuracy
During the assessment process topographic maps are used as a base map and information is checked
corrected of altered using various techniques Prior to the introduction of Global Positioning Systems (GPS)
in 1992 the information was collected using bearing and distance measurement that were plotted onto base
maps The improved accuracy of GPS units over time has allowed increased accuracy and therefore an
improved mapping product
Lease maps and land system maps are available as hard copy products Watered areas for each paddock
can also be produced that indicate the extent that the lease is utilised by stock Undisturbed areas represent
quality wildlife habitats and further investigations are required to study the relationships between stocking
intensity land condition and wildlife habitat More detailed information can be found in Malcolm and
Nicolson (1995)
POST TRIP PROCEEDURE
The following checklist should be completed after each trip
Download photos and GPS co-ordinates
Data entry
Update photopoint manual and make 2 copies
Conduct LCI peer review
All spatial updates sent to GIS DWLBC
Write draft Assessment report
Submit for review
Pastoral Lease Assessment Technical Manual for the Second round (2011)
CONDITION CLASS
ATTRIBUTE EXCELLENT GOOD FAIR POOR VERY POOR
PLANT SPECIES
COMPOSITION
maximum diversity of
annual and perennial
species possible for the
land type
perennial species of
various ages
some reduction in density
of palatable and
susceptible perennials
increased proportion of
shorter lived species
perennial species of
various ages
significantly reduced
cover density andor
regeneration of
palatable species
establishment of less
preferred or
unpalatable species
dominance of annual and
ephemeral species and
perennials with relatively
low palatability
no regeneration of
desirable perennial
species existing stands
degenerate
seasonal cover of
only pioneer
ephemerals or
unpalatable weeds
large areas totally
unproductive
PLANT
PRODUCTIVITY
at full potential
sustained productivity
annual com unities
maintain litter cover but
not production in dry
seasons
some fluctuation lower in
drought and may be
higher than site potential
for some species eg
Mitchell grass
reduced overall high
productivity in good
season
low in drought
(fluctuates markedly
with season)
impaired productivity
very seasonally
dependant low or non
existent in dry seasons
areas incapable of
any plant growth
SOIL EROSION
STATUS
no erosion (other than
natural features or
processes)
plant and litter cover
protect soil from wind
and water in all
seasons
minor or slight erosion
evident
increased susceptibility of
soils to erosion in dry
seasons
moderate erosion
evident
reduced density and
cover of perennial and
litter increases
susceptibility of soils to
erosion in most
seasons
severe erosion overall
high susceptibility of soils
to erosion in all seasons
extent of past erosion
renders site susceptible
to further soil movement
if grazed at any level
unstable severely
or very eroded
Pastoral Lease Assessment Technical Manual for the Second round (2011)
Appendix 1 Erosion severitytype intensity criteria ndashfor reference to first round data sheets
EROSION SeverityType intensity criteria + RATING (max 200 m radius)
NO ACCELERATED EROSION 00
SLIGHT EROSION (10 of site affected)
slight accumulation of wind blown soil and plant bases and other obstacles 11
removal of finer soil particles evident but soil crust is largely intact 12
occasional rills (lt300 mm deep) evident 13
no gullies present 14
a few scalds present usually less than 2 m in diameter 15
MINOR EROSION (10-25 of site affected)
accumulation of soil around plant bases with plant mounds noticeably enlarged 21
evidence of pedestalling but soil loss minor and plant bases not greatly elevated 22
breaking of surface crust with small erosion faces and some redistribution of soil and
or some rilling evident 23
occasional shallow gullies only 24
scalding evident but scalds relatively small and discontinuous 25
MODERATE EROSION (25-50 of site affected)
wind piling around plant bases and other obstacles is common but no plants completely covered 31
pedestalling apparent with plant bases distinctly raised and with obvious
soil loss and deflation in parts 32
surface sheeting andor rilling common with erosion faces (andor micro-
terracing) and active redistribution of soil 33
gullying present on parts of the site 34
numerous small scalds common andor with a tendency to coalesce to form larger scalds in parts 35
SEVERE EROSION (50-75 of site affected)
extreme hummocking around plants and other obstacles some plants completely covered 41
severe pedestalling with plant bases greatly elevated and major soil loss
from deflation andor much of surface generally unstable with ripple marks 42
major rilling or surface sheeting with extensive exposure of subsoil or parent material
erosion faces (andor microterracing) and active redistribution of soil 43
widespread gullying 44
scalding extensive smaller scalds have coalesced to form large more or
less continuous scalded areas 45
EXTREME EROSION (75-100 of site affected)
general surface movement area more or less bare with formation of shifting dunes 51
most of original land surface altered any last remnants of original soil or
vegetation standing as sentinels in a barren landscape 52
water sheeting andor rilling coalesced to expose subsoil or parent material 53
extensive gullying 54
scalding more or less continuous over large areas 55
Note Record severity first and then type eg 53 = Extreme erosionScalding
Pastoral Lease Assessment Technical Manual for the Second round (2011)
Appendix 2 Crown Separation Ratio
This is a visual estimate of plant cover
It is the average distance between crowns (the area the plant takes up if viewed from above) divided by the
average size of the crown In the field this means visualising how many crowns of a given plant species can be fitted in between the distance to the nearest neighbour of that species on average over the site The
classes are as follows
CLASS TERM CSR FIELD CRITERIA
1 Present lt 12 plants lt12 plants within 200 m radius
2 Isolated clumps gt20 spaces Isolated clumps of two to five woody plants 200 m
further apart
3 Isolated Plants gt20 spaces Isolated plants
4 Very Sparse 6-20 spaces well spaced crowns well separated
5 Sparse 1-5 spaces clearly spaced crowns clearly separated
6 Mid dense 0-09 spaces crowns touching to slight separation
7 Closed or dense 0 crowns touching to overlapping
Modified from Table 14 McDonald (1990)
Pastoral Lease Assessment Technical Manual for the Second round (2011)
20
DENSITY MEASUREMENT OF PERENNIAL PLANT SPECIES
Perennial plants provide stability to grazing management systems due to their ability to persist during dry
periods consequently the measurement of plant attributes such as density and frequency of perennials
particularly those which are palatable are important in understanding plant dynamics and rangeland condition
Plant counts within fixed belt transects have been used to determine the density of shrubs and repeated
measurements allows density changes to be detected To ensure that observer error is minimised it is vital that
the same technique and standards are used in repeat measurements Modifications made in 1990 enabled
changes to be isolated to discreet quadrats and recruitment and deaths of cohorts can be followed
Jessup transect
This method incorporates a belt transect (a standard ecological technique) that is based on an original
survey technique used for chenopod shrublands by Jessup (1951) and further developed by Lay (1979)
Their technique involved driving a vehicle over a site for a set distance and shrubs occurring within the wheel
marks (representing the belt transect) were recorded This rather destructive technique is now simulated by
a fixed 4 m x 100 m transect and enables a density and frequency estimate of perennials for each site The
frequency estimates are not based on the optimum quadrat size for all species and the 10 m x 2 m quadrats
used should not be taken to represent true frequency readings It should also be noted that species
composition by frequency is not equivalent to composition by cover or density The length of some early
transects has varied from the current standard so ensure that any future comparisons use the same transect
configuration (see 821below)
The Jessup transect method measures the density (shrubsarea) and frequency of perennial plants at sites
where perennial cover occurs ie chenopods other shrubs and tussock (perennial) grasses Counting age
classes of shrubs (adultjuvenile) gives further information on population changes Monitoring over time
provides an indication of recruitment trends
Recording is based on all perennial shrubs within the transect being recorded by species and age class
(adultjuvenile) If the base of the plant is in the transect it is counted If the foliage only is in the transect it is
not counted
Transect layout
Jessup transects are permanently marked and comprise
transects 100 m x 2 m x 2 (see figure 5)
recordings separated into 10 m x 2 m blocks
identification of perennial plant species
less than 10 cm high andor non woody base = juvenile
more than 20 individual juvenile bushes or perennial grasses per 10 m x 2 m block = 20+ recording
1 Transects should include only one land unit and preferably be restricted to one element for data
analysis Transects are 100m long and generally at right angles to the track Walk the length of the
transect to ensure it is suitable before setting up the site and identify and discuss species present
with the other observers
2 Record a compass bearing for the transect
3 Secure a surveyors tape (marked into 10 m segments) to the sighter peg and lay out the tape to 100
m keeping the marker and sighter pegs in line
4 Check that the tape is in line with the sighter and marker peg Tension the tape and drive in the peg at the 100 m mark and secure tape to the peg It is important to have the tape extended to full
100m and tight and straight so that data is replicated at the quadrat level
Pastoral Lease Assessment Technical Manual for the Second round (2011)
21
5 If the transect layout is normal note this on the sheet if different note the transect layout on the site
description sheet and orient diagram with north to the top of the page Give clear legible directions
and bearings
Figure 5 Jessup transect layout
Recording a Jessup transect
1 Use a surveyors tape that is clearly marked into 10 m intervals If it is marked with tape check that
this has not slipped from the 10 m graduations Counts should be recorded on a Jessup transect
data sheet (see appendix 6)
2 Commence transect on left side of tape (UP) using 2 m rod (refer plate below) Check that the rod is
2 m A two metre curtain pole is ideal for this
Plate 4 Recording a Jessup transect
3 Identify each perennial species If in doubt collect a specimen
4 Easiest operation is with one person observing (counting) and another recording and acting as a
checking observer The recorder (scribe) stands at the 10 m marker intervals and the observer calls
out the adultjuvenile strikes along each 10 m transect interval The recorder can assist by spotting
hidden plants and small juvenile plants
5 For plants on quadrat margins include only in the quadrat where the rooted stem is located Count
plants only if they are more than 50 rooted within the quadrat
6 Chenopods occur in clumps and it is difficult to distinguish individuals for this reason clumps are
recorded and are recognised as individual clumps if there is more than a 30 cm gap between the
rooted stems Criteria for counting plants growing close together are as follows
End peg Sighter peg Site marker amp disc
11 12 13 14 15 16 17 18 19 20
10 9 8 7 6 5 4 3 2 1
100 m
4 m
Pastoral Lease Assessment Technical Manual for the Second round (2011)
22
distinguish between individual clumps if there is more than a 30 cm gap between rooted stems
if crowns are distinct and bases are less than 30 cm apart count each as an individual
if crowns are touching or overlapping and gap between rooted stems is less than 30 cm count
as one clump
Note In cases of perennial plants such as low bluebush being grazed the reduction of the crown
may lead to higher count of bush numbers Care is required when comparing existing Jessup counts
and noted should be recorded if this type of splitting has occurred
7 Record juveniles as plants less than 10 cm high or wide and not woody However if obviously old
woody plants are grazed back to less then this size record as adults but make comment
accordingly
If greater than 20 juvenile individuals of any species encountered in 10m interval (quadrat) record as
20+ This avoids attempting to count up to 200 seedlings but still provides sufficient data to interpret
that recruitment is occurring Large numbers of seedlings can occur following favourable conditions
and it becomes difficult to count all of these However where feasible a total count of juveniles
should be undertaken
8 For perennial grasses record clumps if greater than 10 cm high or 10 cm wide ie no juvenile
categories Record count as 20 + if greater than 20 individuals within one 10 m x 2 m block This is
to aid interpretation of step-point cover data eg low density but high cover implies large spreading
individuals high density but low cover may imply a grazing effect - site comments should indicate
this The quadrat sizes are not well suited to grasses but do provide an indication of the level of
grasses within a shrubland
9 Do not record dead or completely defoliated bushes but note occurrence in comments
10 Proceed to end of transect and commence quadrats 11-20 (ie 100-0m) on other side of tape
(down)
11 Record minor site variations in comments relating to quadrat intervals eg 20-30m large scaled area
Pastoral Lease Assessment Technical Manual for the Second round (2011)
23
DATABASE AND GIS ndash needs update for ALIS and FDE
Site information is currently entered into the Arid Lands Information System (ALIS) and print-outs and
photographs are supplied to the lessee for every photopoint on the station in the form of a Photopoint
Manual
In 1991 the Geographic Analysis and Research Unit (GAR) of the Department of Housing and Urban
Development has been assisting the Pastoral Management Branch in the establishment and maintenance of
a Pastoral Geographic Information System (Malcolm and Nicolson 1995) The GAR unit operates a
centralised ARCINFO (Environmental Systems Research Institute USA) GIS facility and is the
Environmental Node of South Australia‟s Land Information System
Extensive development was carried out on ALIS and while operational is still undergoing some further
development Management of this system is though Client Services in DENR in collaboration with the
Pastoral Program Development of a system for field data entry onto GETEC tablets has been completed
and is undergoing transition into the operational phase This will improve data collection with validation in the
field and also allow considerable time saving and possible transposition errors removing one stage in the
data entry process
Lease infrastructure information is derived from a number of sources that vary in age scale and accuracy
During the assessment process topographic maps are used as a base map and information is checked
corrected of altered using various techniques Prior to the introduction of Global Positioning Systems (GPS)
in 1992 the information was collected using bearing and distance measurement that were plotted onto base
maps The improved accuracy of GPS units over time has allowed increased accuracy and therefore an
improved mapping product
Lease maps and land system maps are available as hard copy products Watered areas for each paddock
can also be produced that indicate the extent that the lease is utilised by stock Undisturbed areas represent
quality wildlife habitats and further investigations are required to study the relationships between stocking
intensity land condition and wildlife habitat More detailed information can be found in Malcolm and
Nicolson (1995)
POST TRIP PROCEEDURE
The following checklist should be completed after each trip
Download photos and GPS co-ordinates
Data entry
Update photopoint manual and make 2 copies
Conduct LCI peer review
All spatial updates sent to GIS DWLBC
Write draft Assessment report
Submit for review
Pastoral Lease Assessment Technical Manual for the Second round (2011)
CONDITION CLASS
ATTRIBUTE EXCELLENT GOOD FAIR POOR VERY POOR
PLANT SPECIES
COMPOSITION
maximum diversity of
annual and perennial
species possible for the
land type
perennial species of
various ages
some reduction in density
of palatable and
susceptible perennials
increased proportion of
shorter lived species
perennial species of
various ages
significantly reduced
cover density andor
regeneration of
palatable species
establishment of less
preferred or
unpalatable species
dominance of annual and
ephemeral species and
perennials with relatively
low palatability
no regeneration of
desirable perennial
species existing stands
degenerate
seasonal cover of
only pioneer
ephemerals or
unpalatable weeds
large areas totally
unproductive
PLANT
PRODUCTIVITY
at full potential
sustained productivity
annual com unities
maintain litter cover but
not production in dry
seasons
some fluctuation lower in
drought and may be
higher than site potential
for some species eg
Mitchell grass
reduced overall high
productivity in good
season
low in drought
(fluctuates markedly
with season)
impaired productivity
very seasonally
dependant low or non
existent in dry seasons
areas incapable of
any plant growth
SOIL EROSION
STATUS
no erosion (other than
natural features or
processes)
plant and litter cover
protect soil from wind
and water in all
seasons
minor or slight erosion
evident
increased susceptibility of
soils to erosion in dry
seasons
moderate erosion
evident
reduced density and
cover of perennial and
litter increases
susceptibility of soils to
erosion in most
seasons
severe erosion overall
high susceptibility of soils
to erosion in all seasons
extent of past erosion
renders site susceptible
to further soil movement
if grazed at any level
unstable severely
or very eroded
Pastoral Lease Assessment Technical Manual for the Second round (2011)
Appendix 1 Erosion severitytype intensity criteria ndashfor reference to first round data sheets
EROSION SeverityType intensity criteria + RATING (max 200 m radius)
NO ACCELERATED EROSION 00
SLIGHT EROSION (10 of site affected)
slight accumulation of wind blown soil and plant bases and other obstacles 11
removal of finer soil particles evident but soil crust is largely intact 12
occasional rills (lt300 mm deep) evident 13
no gullies present 14
a few scalds present usually less than 2 m in diameter 15
MINOR EROSION (10-25 of site affected)
accumulation of soil around plant bases with plant mounds noticeably enlarged 21
evidence of pedestalling but soil loss minor and plant bases not greatly elevated 22
breaking of surface crust with small erosion faces and some redistribution of soil and
or some rilling evident 23
occasional shallow gullies only 24
scalding evident but scalds relatively small and discontinuous 25
MODERATE EROSION (25-50 of site affected)
wind piling around plant bases and other obstacles is common but no plants completely covered 31
pedestalling apparent with plant bases distinctly raised and with obvious
soil loss and deflation in parts 32
surface sheeting andor rilling common with erosion faces (andor micro-
terracing) and active redistribution of soil 33
gullying present on parts of the site 34
numerous small scalds common andor with a tendency to coalesce to form larger scalds in parts 35
SEVERE EROSION (50-75 of site affected)
extreme hummocking around plants and other obstacles some plants completely covered 41
severe pedestalling with plant bases greatly elevated and major soil loss
from deflation andor much of surface generally unstable with ripple marks 42
major rilling or surface sheeting with extensive exposure of subsoil or parent material
erosion faces (andor microterracing) and active redistribution of soil 43
widespread gullying 44
scalding extensive smaller scalds have coalesced to form large more or
less continuous scalded areas 45
EXTREME EROSION (75-100 of site affected)
general surface movement area more or less bare with formation of shifting dunes 51
most of original land surface altered any last remnants of original soil or
vegetation standing as sentinels in a barren landscape 52
water sheeting andor rilling coalesced to expose subsoil or parent material 53
extensive gullying 54
scalding more or less continuous over large areas 55
Note Record severity first and then type eg 53 = Extreme erosionScalding
Pastoral Lease Assessment Technical Manual for the Second round (2011)
Appendix 2 Crown Separation Ratio
This is a visual estimate of plant cover
It is the average distance between crowns (the area the plant takes up if viewed from above) divided by the
average size of the crown In the field this means visualising how many crowns of a given plant species can be fitted in between the distance to the nearest neighbour of that species on average over the site The
classes are as follows
CLASS TERM CSR FIELD CRITERIA
1 Present lt 12 plants lt12 plants within 200 m radius
2 Isolated clumps gt20 spaces Isolated clumps of two to five woody plants 200 m
further apart
3 Isolated Plants gt20 spaces Isolated plants
4 Very Sparse 6-20 spaces well spaced crowns well separated
5 Sparse 1-5 spaces clearly spaced crowns clearly separated
6 Mid dense 0-09 spaces crowns touching to slight separation
7 Closed or dense 0 crowns touching to overlapping
Modified from Table 14 McDonald (1990)
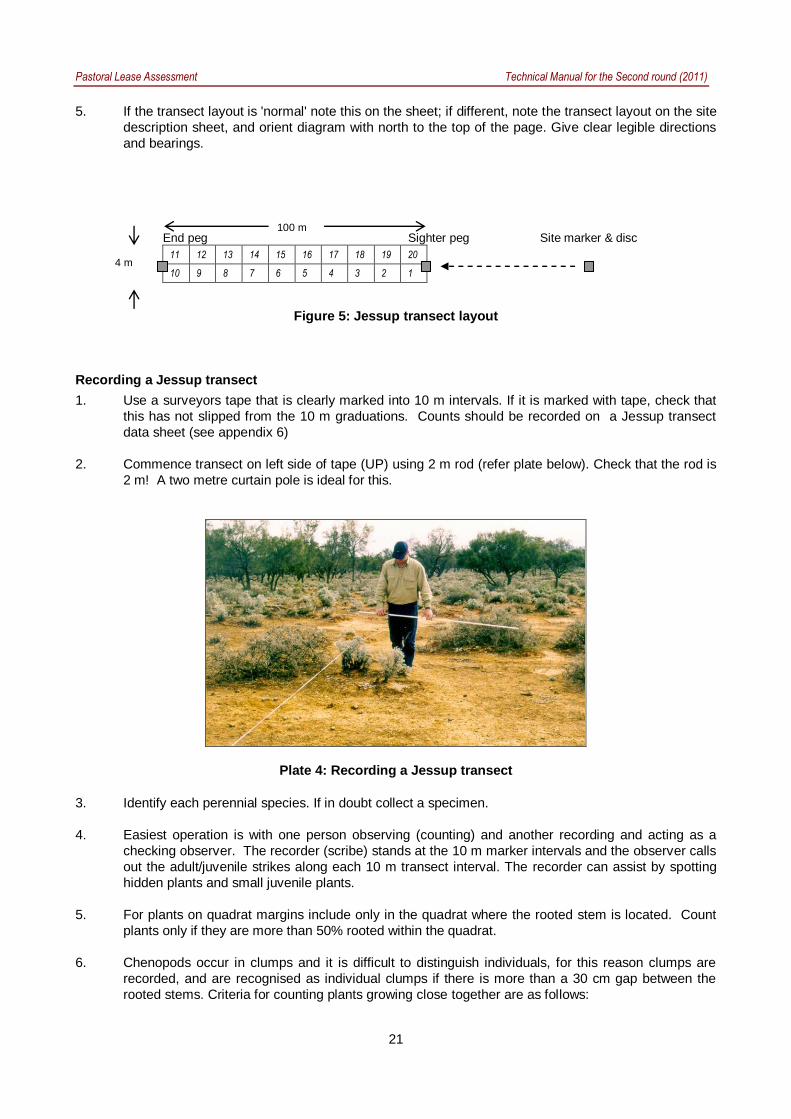
Pastoral Lease Assessment Technical Manual for the Second round (2011)
22
distinguish between individual clumps if there is more than a 30 cm gap between rooted stems
if crowns are distinct and bases are less than 30 cm apart count each as an individual
if crowns are touching or overlapping and gap between rooted stems is less than 30 cm count
as one clump
Note In cases of perennial plants such as low bluebush being grazed the reduction of the crown
may lead to higher count of bush numbers Care is required when comparing existing Jessup counts
and noted should be recorded if this type of splitting has occurred
7 Record juveniles as plants less than 10 cm high or wide and not woody However if obviously old
woody plants are grazed back to less then this size record as adults but make comment
accordingly
If greater than 20 juvenile individuals of any species encountered in 10m interval (quadrat) record as
20+ This avoids attempting to count up to 200 seedlings but still provides sufficient data to interpret
that recruitment is occurring Large numbers of seedlings can occur following favourable conditions
and it becomes difficult to count all of these However where feasible a total count of juveniles
should be undertaken
8 For perennial grasses record clumps if greater than 10 cm high or 10 cm wide ie no juvenile
categories Record count as 20 + if greater than 20 individuals within one 10 m x 2 m block This is
to aid interpretation of step-point cover data eg low density but high cover implies large spreading
individuals high density but low cover may imply a grazing effect - site comments should indicate
this The quadrat sizes are not well suited to grasses but do provide an indication of the level of
grasses within a shrubland
9 Do not record dead or completely defoliated bushes but note occurrence in comments
10 Proceed to end of transect and commence quadrats 11-20 (ie 100-0m) on other side of tape
(down)
11 Record minor site variations in comments relating to quadrat intervals eg 20-30m large scaled area
Pastoral Lease Assessment Technical Manual for the Second round (2011)
23
DATABASE AND GIS ndash needs update for ALIS and FDE
Site information is currently entered into the Arid Lands Information System (ALIS) and print-outs and
photographs are supplied to the lessee for every photopoint on the station in the form of a Photopoint
Manual
In 1991 the Geographic Analysis and Research Unit (GAR) of the Department of Housing and Urban
Development has been assisting the Pastoral Management Branch in the establishment and maintenance of
a Pastoral Geographic Information System (Malcolm and Nicolson 1995) The GAR unit operates a
centralised ARCINFO (Environmental Systems Research Institute USA) GIS facility and is the
Environmental Node of South Australia‟s Land Information System
Extensive development was carried out on ALIS and while operational is still undergoing some further
development Management of this system is though Client Services in DENR in collaboration with the
Pastoral Program Development of a system for field data entry onto GETEC tablets has been completed
and is undergoing transition into the operational phase This will improve data collection with validation in the
field and also allow considerable time saving and possible transposition errors removing one stage in the
data entry process
Lease infrastructure information is derived from a number of sources that vary in age scale and accuracy
During the assessment process topographic maps are used as a base map and information is checked
corrected of altered using various techniques Prior to the introduction of Global Positioning Systems (GPS)
in 1992 the information was collected using bearing and distance measurement that were plotted onto base
maps The improved accuracy of GPS units over time has allowed increased accuracy and therefore an
improved mapping product
Lease maps and land system maps are available as hard copy products Watered areas for each paddock
can also be produced that indicate the extent that the lease is utilised by stock Undisturbed areas represent
quality wildlife habitats and further investigations are required to study the relationships between stocking
intensity land condition and wildlife habitat More detailed information can be found in Malcolm and
Nicolson (1995)
POST TRIP PROCEEDURE
The following checklist should be completed after each trip
Download photos and GPS co-ordinates
Data entry
Update photopoint manual and make 2 copies
Conduct LCI peer review
All spatial updates sent to GIS DWLBC
Write draft Assessment report
Submit for review
Pastoral Lease Assessment Technical Manual for the Second round (2011)
CONDITION CLASS
ATTRIBUTE EXCELLENT GOOD FAIR POOR VERY POOR
PLANT SPECIES
COMPOSITION
maximum diversity of
annual and perennial
species possible for the
land type
perennial species of
various ages
some reduction in density
of palatable and
susceptible perennials
increased proportion of
shorter lived species
perennial species of
various ages
significantly reduced
cover density andor
regeneration of
palatable species
establishment of less
preferred or
unpalatable species
dominance of annual and
ephemeral species and
perennials with relatively
low palatability
no regeneration of
desirable perennial
species existing stands
degenerate
seasonal cover of
only pioneer
ephemerals or
unpalatable weeds
large areas totally
unproductive
PLANT
PRODUCTIVITY
at full potential
sustained productivity
annual com unities
maintain litter cover but
not production in dry
seasons
some fluctuation lower in
drought and may be
higher than site potential
for some species eg
Mitchell grass
reduced overall high
productivity in good
season
low in drought
(fluctuates markedly
with season)
impaired productivity
very seasonally
dependant low or non
existent in dry seasons
areas incapable of
any plant growth
SOIL EROSION
STATUS
no erosion (other than
natural features or
processes)
plant and litter cover
protect soil from wind
and water in all
seasons
minor or slight erosion
evident
increased susceptibility of
soils to erosion in dry
seasons
moderate erosion
evident
reduced density and
cover of perennial and
litter increases
susceptibility of soils to
erosion in most
seasons
severe erosion overall
high susceptibility of soils
to erosion in all seasons
extent of past erosion
renders site susceptible
to further soil movement
if grazed at any level
unstable severely
or very eroded
Pastoral Lease Assessment Technical Manual for the Second round (2011)
Appendix 1 Erosion severitytype intensity criteria ndashfor reference to first round data sheets
EROSION SeverityType intensity criteria + RATING (max 200 m radius)
NO ACCELERATED EROSION 00
SLIGHT EROSION (10 of site affected)
slight accumulation of wind blown soil and plant bases and other obstacles 11
removal of finer soil particles evident but soil crust is largely intact 12
occasional rills (lt300 mm deep) evident 13
no gullies present 14
a few scalds present usually less than 2 m in diameter 15
MINOR EROSION (10-25 of site affected)
accumulation of soil around plant bases with plant mounds noticeably enlarged 21
evidence of pedestalling but soil loss minor and plant bases not greatly elevated 22
breaking of surface crust with small erosion faces and some redistribution of soil and
or some rilling evident 23
occasional shallow gullies only 24
scalding evident but scalds relatively small and discontinuous 25
MODERATE EROSION (25-50 of site affected)
wind piling around plant bases and other obstacles is common but no plants completely covered 31
pedestalling apparent with plant bases distinctly raised and with obvious
soil loss and deflation in parts 32
surface sheeting andor rilling common with erosion faces (andor micro-
terracing) and active redistribution of soil 33
gullying present on parts of the site 34
numerous small scalds common andor with a tendency to coalesce to form larger scalds in parts 35
SEVERE EROSION (50-75 of site affected)
extreme hummocking around plants and other obstacles some plants completely covered 41
severe pedestalling with plant bases greatly elevated and major soil loss
from deflation andor much of surface generally unstable with ripple marks 42
major rilling or surface sheeting with extensive exposure of subsoil or parent material
erosion faces (andor microterracing) and active redistribution of soil 43
widespread gullying 44
scalding extensive smaller scalds have coalesced to form large more or
less continuous scalded areas 45
EXTREME EROSION (75-100 of site affected)
general surface movement area more or less bare with formation of shifting dunes 51
most of original land surface altered any last remnants of original soil or
vegetation standing as sentinels in a barren landscape 52
water sheeting andor rilling coalesced to expose subsoil or parent material 53
extensive gullying 54
scalding more or less continuous over large areas 55
Note Record severity first and then type eg 53 = Extreme erosionScalding
Pastoral Lease Assessment Technical Manual for the Second round (2011)
Appendix 2 Crown Separation Ratio
This is a visual estimate of plant cover
It is the average distance between crowns (the area the plant takes up if viewed from above) divided by the
average size of the crown In the field this means visualising how many crowns of a given plant species can be fitted in between the distance to the nearest neighbour of that species on average over the site The
classes are as follows
CLASS TERM CSR FIELD CRITERIA
1 Present lt 12 plants lt12 plants within 200 m radius
2 Isolated clumps gt20 spaces Isolated clumps of two to five woody plants 200 m
further apart
3 Isolated Plants gt20 spaces Isolated plants
4 Very Sparse 6-20 spaces well spaced crowns well separated
5 Sparse 1-5 spaces clearly spaced crowns clearly separated
6 Mid dense 0-09 spaces crowns touching to slight separation
7 Closed or dense 0 crowns touching to overlapping
Modified from Table 14 McDonald (1990)
Pastoral Lease Assessment Technical Manual for the Second round (2011)
23
DATABASE AND GIS ndash needs update for ALIS and FDE
Site information is currently entered into the Arid Lands Information System (ALIS) and print-outs and
photographs are supplied to the lessee for every photopoint on the station in the form of a Photopoint
Manual
In 1991 the Geographic Analysis and Research Unit (GAR) of the Department of Housing and Urban
Development has been assisting the Pastoral Management Branch in the establishment and maintenance of
a Pastoral Geographic Information System (Malcolm and Nicolson 1995) The GAR unit operates a
centralised ARCINFO (Environmental Systems Research Institute USA) GIS facility and is the
Environmental Node of South Australia‟s Land Information System
Extensive development was carried out on ALIS and while operational is still undergoing some further
development Management of this system is though Client Services in DENR in collaboration with the
Pastoral Program Development of a system for field data entry onto GETEC tablets has been completed
and is undergoing transition into the operational phase This will improve data collection with validation in the
field and also allow considerable time saving and possible transposition errors removing one stage in the
data entry process
Lease infrastructure information is derived from a number of sources that vary in age scale and accuracy
During the assessment process topographic maps are used as a base map and information is checked
corrected of altered using various techniques Prior to the introduction of Global Positioning Systems (GPS)
in 1992 the information was collected using bearing and distance measurement that were plotted onto base
maps The improved accuracy of GPS units over time has allowed increased accuracy and therefore an
improved mapping product
Lease maps and land system maps are available as hard copy products Watered areas for each paddock
can also be produced that indicate the extent that the lease is utilised by stock Undisturbed areas represent
quality wildlife habitats and further investigations are required to study the relationships between stocking
intensity land condition and wildlife habitat More detailed information can be found in Malcolm and
Nicolson (1995)
POST TRIP PROCEEDURE
The following checklist should be completed after each trip
Download photos and GPS co-ordinates
Data entry
Update photopoint manual and make 2 copies
Conduct LCI peer review
All spatial updates sent to GIS DWLBC
Write draft Assessment report
Submit for review
Pastoral Lease Assessment Technical Manual for the Second round (2011)
CONDITION CLASS
ATTRIBUTE EXCELLENT GOOD FAIR POOR VERY POOR
PLANT SPECIES
COMPOSITION
maximum diversity of
annual and perennial
species possible for the
land type
perennial species of
various ages
some reduction in density
of palatable and
susceptible perennials
increased proportion of
shorter lived species
perennial species of
various ages
significantly reduced
cover density andor
regeneration of
palatable species
establishment of less
preferred or
unpalatable species
dominance of annual and
ephemeral species and
perennials with relatively
low palatability
no regeneration of
desirable perennial
species existing stands
degenerate
seasonal cover of
only pioneer
ephemerals or
unpalatable weeds
large areas totally
unproductive
PLANT
PRODUCTIVITY
at full potential
sustained productivity
annual com unities
maintain litter cover but
not production in dry
seasons
some fluctuation lower in
drought and may be
higher than site potential
for some species eg
Mitchell grass
reduced overall high
productivity in good
season
low in drought
(fluctuates markedly
with season)
impaired productivity
very seasonally
dependant low or non
existent in dry seasons
areas incapable of
any plant growth
SOIL EROSION
STATUS
no erosion (other than
natural features or
processes)
plant and litter cover
protect soil from wind
and water in all
seasons
minor or slight erosion
evident
increased susceptibility of
soils to erosion in dry
seasons
moderate erosion
evident
reduced density and
cover of perennial and
litter increases
susceptibility of soils to
erosion in most
seasons
severe erosion overall
high susceptibility of soils
to erosion in all seasons
extent of past erosion
renders site susceptible
to further soil movement
if grazed at any level
unstable severely
or very eroded
Pastoral Lease Assessment Technical Manual for the Second round (2011)
Appendix 1 Erosion severitytype intensity criteria ndashfor reference to first round data sheets
EROSION SeverityType intensity criteria + RATING (max 200 m radius)
NO ACCELERATED EROSION 00
SLIGHT EROSION (10 of site affected)
slight accumulation of wind blown soil and plant bases and other obstacles 11
removal of finer soil particles evident but soil crust is largely intact 12
occasional rills (lt300 mm deep) evident 13
no gullies present 14
a few scalds present usually less than 2 m in diameter 15
MINOR EROSION (10-25 of site affected)
accumulation of soil around plant bases with plant mounds noticeably enlarged 21
evidence of pedestalling but soil loss minor and plant bases not greatly elevated 22
breaking of surface crust with small erosion faces and some redistribution of soil and
or some rilling evident 23
occasional shallow gullies only 24
scalding evident but scalds relatively small and discontinuous 25
MODERATE EROSION (25-50 of site affected)
wind piling around plant bases and other obstacles is common but no plants completely covered 31
pedestalling apparent with plant bases distinctly raised and with obvious
soil loss and deflation in parts 32
surface sheeting andor rilling common with erosion faces (andor micro-
terracing) and active redistribution of soil 33
gullying present on parts of the site 34
numerous small scalds common andor with a tendency to coalesce to form larger scalds in parts 35
SEVERE EROSION (50-75 of site affected)
extreme hummocking around plants and other obstacles some plants completely covered 41
severe pedestalling with plant bases greatly elevated and major soil loss
from deflation andor much of surface generally unstable with ripple marks 42
major rilling or surface sheeting with extensive exposure of subsoil or parent material
erosion faces (andor microterracing) and active redistribution of soil 43
widespread gullying 44
scalding extensive smaller scalds have coalesced to form large more or
less continuous scalded areas 45
EXTREME EROSION (75-100 of site affected)
general surface movement area more or less bare with formation of shifting dunes 51
most of original land surface altered any last remnants of original soil or
vegetation standing as sentinels in a barren landscape 52
water sheeting andor rilling coalesced to expose subsoil or parent material 53
extensive gullying 54
scalding more or less continuous over large areas 55
Note Record severity first and then type eg 53 = Extreme erosionScalding
Pastoral Lease Assessment Technical Manual for the Second round (2011)
Appendix 2 Crown Separation Ratio
This is a visual estimate of plant cover
It is the average distance between crowns (the area the plant takes up if viewed from above) divided by the
average size of the crown In the field this means visualising how many crowns of a given plant species can be fitted in between the distance to the nearest neighbour of that species on average over the site The
classes are as follows
CLASS TERM CSR FIELD CRITERIA
1 Present lt 12 plants lt12 plants within 200 m radius
2 Isolated clumps gt20 spaces Isolated clumps of two to five woody plants 200 m
further apart
3 Isolated Plants gt20 spaces Isolated plants
4 Very Sparse 6-20 spaces well spaced crowns well separated
5 Sparse 1-5 spaces clearly spaced crowns clearly separated
6 Mid dense 0-09 spaces crowns touching to slight separation
7 Closed or dense 0 crowns touching to overlapping
Modified from Table 14 McDonald (1990)
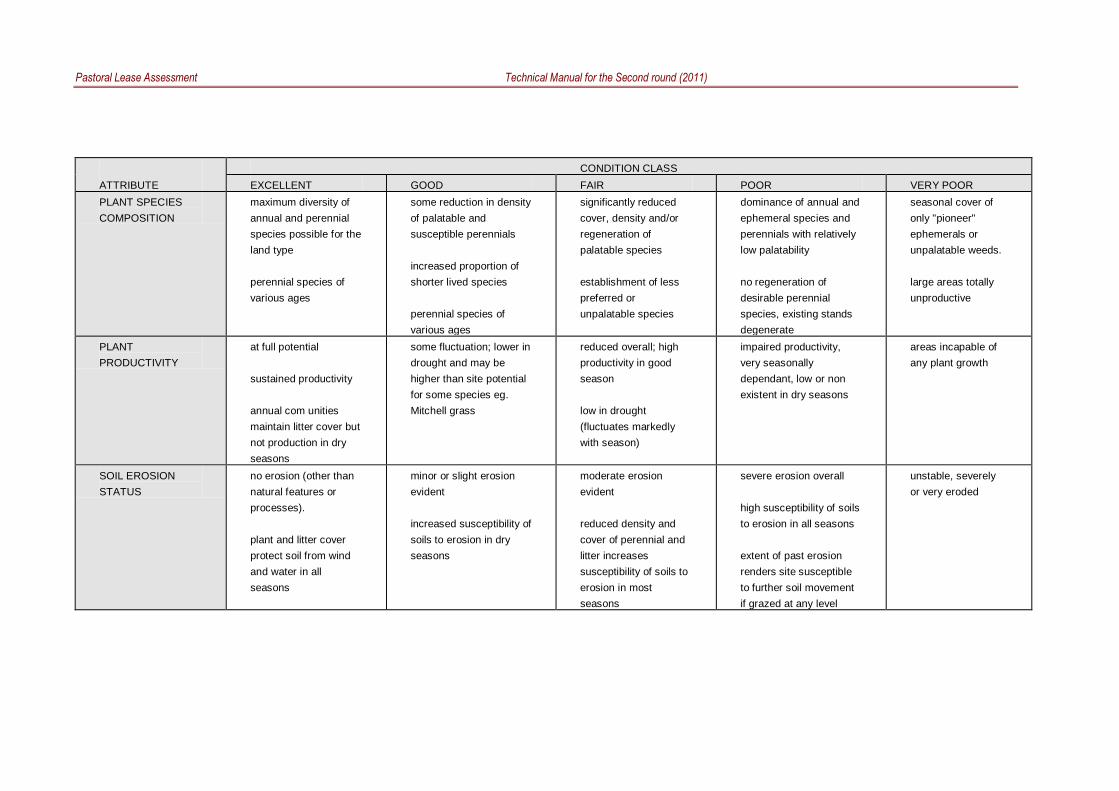
Pastoral Lease Assessment Technical Manual for the Second round (2011)
Appendix 1 Erosion severitytype intensity criteria ndashfor reference to first round data sheets
EROSION SeverityType intensity criteria + RATING (max 200 m radius)
NO ACCELERATED EROSION 00
SLIGHT EROSION (10 of site affected)
slight accumulation of wind blown soil and plant bases and other obstacles 11
removal of finer soil particles evident but soil crust is largely intact 12
occasional rills (lt300 mm deep) evident 13
no gullies present 14
a few scalds present usually less than 2 m in diameter 15
MINOR EROSION (10-25 of site affected)
accumulation of soil around plant bases with plant mounds noticeably enlarged 21
evidence of pedestalling but soil loss minor and plant bases not greatly elevated 22
breaking of surface crust with small erosion faces and some redistribution of soil and
or some rilling evident 23
occasional shallow gullies only 24
scalding evident but scalds relatively small and discontinuous 25
MODERATE EROSION (25-50 of site affected)
wind piling around plant bases and other obstacles is common but no plants completely covered 31
pedestalling apparent with plant bases distinctly raised and with obvious
soil loss and deflation in parts 32
surface sheeting andor rilling common with erosion faces (andor micro-
terracing) and active redistribution of soil 33
gullying present on parts of the site 34
numerous small scalds common andor with a tendency to coalesce to form larger scalds in parts 35
SEVERE EROSION (50-75 of site affected)
extreme hummocking around plants and other obstacles some plants completely covered 41
severe pedestalling with plant bases greatly elevated and major soil loss
from deflation andor much of surface generally unstable with ripple marks 42
major rilling or surface sheeting with extensive exposure of subsoil or parent material
erosion faces (andor microterracing) and active redistribution of soil 43
widespread gullying 44
scalding extensive smaller scalds have coalesced to form large more or
less continuous scalded areas 45
EXTREME EROSION (75-100 of site affected)
general surface movement area more or less bare with formation of shifting dunes 51
most of original land surface altered any last remnants of original soil or
vegetation standing as sentinels in a barren landscape 52
water sheeting andor rilling coalesced to expose subsoil or parent material 53
extensive gullying 54
scalding more or less continuous over large areas 55
Note Record severity first and then type eg 53 = Extreme erosionScalding
Pastoral Lease Assessment Technical Manual for the Second round (2011)
Appendix 2 Crown Separation Ratio
This is a visual estimate of plant cover
It is the average distance between crowns (the area the plant takes up if viewed from above) divided by the
average size of the crown In the field this means visualising how many crowns of a given plant species can be fitted in between the distance to the nearest neighbour of that species on average over the site The
classes are as follows
CLASS TERM CSR FIELD CRITERIA
1 Present lt 12 plants lt12 plants within 200 m radius
2 Isolated clumps gt20 spaces Isolated clumps of two to five woody plants 200 m
further apart
3 Isolated Plants gt20 spaces Isolated plants
4 Very Sparse 6-20 spaces well spaced crowns well separated
5 Sparse 1-5 spaces clearly spaced crowns clearly separated
6 Mid dense 0-09 spaces crowns touching to slight separation
7 Closed or dense 0 crowns touching to overlapping
Modified from Table 14 McDonald (1990)
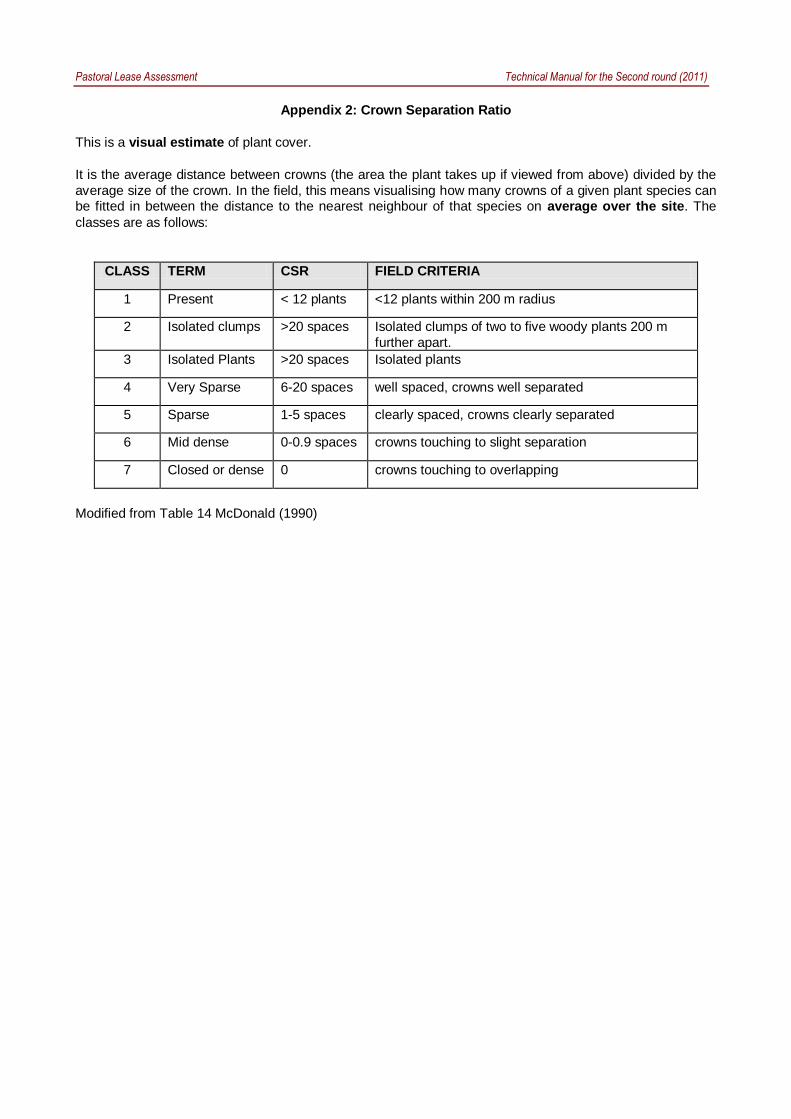
Pastoral Lease Assessment Technical Manual for the Second round (2011)
Appendix 2 Crown Separation Ratio
This is a visual estimate of plant cover
It is the average distance between crowns (the area the plant takes up if viewed from above) divided by the
average size of the crown In the field this means visualising how many crowns of a given plant species can be fitted in between the distance to the nearest neighbour of that species on average over the site The
classes are as follows
CLASS TERM CSR FIELD CRITERIA
1 Present lt 12 plants lt12 plants within 200 m radius
2 Isolated clumps gt20 spaces Isolated clumps of two to five woody plants 200 m
further apart
3 Isolated Plants gt20 spaces Isolated plants
4 Very Sparse 6-20 spaces well spaced crowns well separated
5 Sparse 1-5 spaces clearly spaced crowns clearly separated
6 Mid dense 0-09 spaces crowns touching to slight separation
7 Closed or dense 0 crowns touching to overlapping
Modified from Table 14 McDonald (1990)
![DATED THIS _____ of _________________ 2008€¦ · Web view“Leasehold Property” shall mean the [real property] held on lease/sub-lease or license/sub-license or similar basis](https://img.pdfslide.us/doc/110x75/60341d0b9b0a545997285419/dated-this-of-2008-web-view-aoeleasehold-propertya-shall.jpg)