Embed Size (px)
Citation preview
DURUM WHEAT AND PASTA
Pasta Containing Regrinds: Effect of High Temperature Dryingon Product Quality
KEXUAN FANG' and KHALIL KHAN',2
ABSTRACT Cereal Chem. 73(3):317-322
Low, high, and ultra high temperature dried (LTD, HTD, UTD) pasta not significantly affect the quality of the products. However, the tem-regrinds were used at several replacement levels with semolina to perature at which regrinds were dried influenced the finished products.produce spaghetti and elbow macaroni. Products were dried at 40 (low), Low-temperature regrinds (LTR) produced significantly better firmness73 (high), and 90'C (ultra high) and evaluated for quality factors such as of the spaghetti and elbow macaroni and less cooking loss of the elbowcolor, firmness, cooking loss, and cooked weight. Blending decreased macaroni. Increasing the regrind drying temperature slightly improvedfirmness and increased cooking loss. HTD or UTD significantly im- product color. A sensory panel found spaghetti containing up to 30%proved firmness and cooking loss. HTD also improved spaghetti and HTD regrinds (HTR) acceptable. Also the control and 10 and 20% ofelbow macaroni color, whereas UTD improved elbow macaroni color but LTR were more acceptable than 30% of LTR or 10, 20, or 30% of HTR.adversely affected spaghetti color. Variation in regrind granulation did
In the pasta industry, about 5 to 10% of dry goods becomeregrinds (Donnelly 1980). Regrinds are those dried pasta productswhich, due to breakage, checking or cracking, and trimming oflong goods, are reground to small particle size. These regrinds areblended with semolina to produce short or long pasta products.
Annual pasta consumption in the United States is about 4.8billion pounds (National Pasta Association 1992). Therefore,regrinds can amount to 240-480 million pounds of pasta produc-tion that end up as blended products. However, only two reportsdiscussing the effect of regrinds on pasta quality were found inthe literature. One report detailed the effect of blending regrindswith semolina on the conventional low temperature dried (LTD)spaghetti quality parameters of color, cooked weight, cookingloss, and cooked firmness (Donnelly 1980). Donnelly concludedthat increasing amounts of regrinds decreased cooked firmnessand color scores, and increased cooking loss. The second reportconcerned the effect of regrinds on pigments, starch damage, andstickiness of high temperature dried (HTD) (720C) spaghetti(Grant 1989). Grant suggested that blends without regrinds had ahigher amount of pigment, and that adding regrinds increasedstarch damage and stickiness. No published information wasavailable for those high or ultra high temperature dried pastaregrinds (HTR and UTR) that may influence the HTD, UTD, orconventional dried pasta products.
Several advantages of HTD or UTD (60-120'C) pasta, such asimproved color, better firmness, less cooking loss, reduced sticki-ness, increased resistance to cracking, shorter drying time,reduced floor space and energy cost, and lower bacteria count,have been reported in the literature. Wyland (1981) reported thatincreasing the drying temperature (from 40 to 800C) improvedspaghetti color, increased firmness values, and decreased cookingloss and cooked weight values. Braibanti (1980) suggested thatduring HTD, the gluten was partially coagulated. This glutenstructure retained the starch longer during cooking, leading toless starch loss. Dexter et al (1981) found that high temperature(HT) at the initial stages of drying yielded a spaghetti with sig-nificantly improved color intensity compared to LTD spaghetti,
lGraduate student and associate professor, respectively, Cereal Science, NorthDakota State University, Fargo, ND 58105.
2 Corresponding author. E-mail: [email protected]
Publication no. C-1996-0402-04R.© 1996 American Association of Cereal Chemists, Inc.
whereas HT during the latter stages of drying yielded a spaghettiwith improved strength and cooking quality without sacrificingcolor quality. Ibrahim (1982) reported that, in some cases, HTDslightly improved the yellow color of spaghetti. An increase intemperature from 60 to 80'C resulted in a progressive increase incooked spaghetti firmness and progressive decrease in cookedweight and cooking loss. Grant (1989) reported that HTD (720 C)decreased cooking loss regardless of variety, sprout damage, orlength of cooking, but did not appear to affect cooked spaghettiweight. Grant also reported that the incorporation of spaghettiregrinds increased stickiness. However, HTD decreased stickinessin similar samples. Aktan (1990) reported that the mean colorscore for spaghetti dried at 90'C was significantly higher thanthose for spaghetti dried at 40, 60, 70, and 80'C. Aktan and Khan(1992) reported that cooked weight increased, cooking lossdecreased, and firmness generally increased as drying tempera-ture increased.
It is clear from the literature that the use of HTD or UTD mayresult in higher quality of pasta products. However, there is littleinformation about the quality of the products that incorporatedregrinds. Therefore, the purpose of this study was to investigatethe effect of blending HTR, UTR, and conventional temperaturedried pasta regrinds with semolina on the quality of spaghetti andelbow macaroni products dried at high (730C), ultra high (90'C),and conventional (40'C) temperatures. Effect of particle-size dis-tribution of regrinds on product quality and physicochemicalproperties of regrinds also were investigated. Both instrumentaland sensory testing methods were used to evaluate the products.
MATERIALS AND METHODS
Regrind SamplesThree samples, low (520C) and high (720C) temperature dried
pasta regrinds (LTR and HTR) and partly ground ultra high(880C) temperature dried pasta regrinds (UTR), were obtainedfrom two U.S. pasta processors. These regrinds were producedfrom 100% durum wheat semolina. The partly ground UTR wasprocessed by sieving off the fine particles, grinding the coarseparticles, and then mixing all particles to produce UTR (particlesize similar to LTR and HTR). Fine UTR (finer that LTR andHTR) and coarse UTR (coarser than LTR and HTR) were alsoproduced. A laboratory hammer mill (model 66-B, JacobsonMachine Works, Inc., Minneapolis, MN) was used for the grind-ing process.
Vol. 73, No. 3,1996 317
Semolina SampleEnriched durum wheat semolina from North Dakota Mills
(Grand Forks) and its extruded products represent the control(100% semolina) samples.
Blending ProceduresTo investigate the effect of blending on product quality, blends
were prepared by mixing LTR, HTR, and UTR samples, respec-tively, with semolina at 10, 15, 20, 25, and 30% replacement lev-els for spaghetti, and 15, 25, 35, and 50% replacement levels formacaroni processing.
To investigate the effect of granulation of regrinds on productquality, blends were prepared by mixing UTR, fine UTR, andcoarse UTR, respectively, with semolina at the 25% replacementlevel for both spaghetti and macaroni processing. A Cross-FlowBlender (Patterson Kelley Co., East Stroudsburg, PA) was usedfor both procedures.
Quality Evaluation of Regrinds and SemolinaParticle-size distribution was obtained on a Ro-Tap shaker
(model RX 29, W.S. Tyler Inc., Mentor, OH), using 100 g ofsample and shaking for 1 min (Donnelly 1980). Speck count wasdetermined by spreading each sample on a flat surface andcounting the visible specks (bran or black particles) in three dif-ferent 1-in2 areas enclosed by a special framed glass plate. Theaverage of the three readings was converted to the number ofspecks/10 in2 (64.5 cm2). High speck count (>40 specks/10 in2
1
carries over into the pasta, resulting in a product with poorappearance and consumer appeal (Vasiljevic and Banasik 1980).
Moisture, protein, and ash contents were determined usingstandard methods 44-15, 46-11, and 08-01 (AACC 1983),respectively. Samples were dry-ashed according to method923.23 and iron content was determined according to method965.09 (AOAC 1990). Falling number and damaged starch weredetermined using standard method 56-81B (AACC 1983) and themethod of Gibson et al (1993), respectively. Sodium dodecyl sul-fate (SDS) sedimentation test was performed according to themicro-sedimentation procedure of Dick and Quick (1983).Machine-washed wet gluten was determined using standardmethod 38-11 (AACC 1983). Hand-washed wet gluten wasdetermined by standard method 38-10 (AACC 1983), with thefollowing modification for regrind samples: 10 g of regrind wereblended with 25 g of semolina and mixed with 21 ml of water,rather than using 25 g of semolina and 15 ml of water. Regrindand semolina color were determined by using the Minolta colordifference meter (model CR310, Minolta Co., Ramsey, NJ) andconverting the L (brightness) and b (yellowness) values to colorscores using a chromaticity diagram (Debbouz 1994).
Mixograms were obtained using standard method 54-40A(AACC 1983), except that water was put into the bowl beforeusing the regrind sample. An overall empirical classificationincorporating peak height and general curve characteristics wasassigned. A scale of 1-8 was used (Vasiljevic and Banasik 1980).The higher the number, the stronger the curve type.
Farinograms were obtained using standard method 54-21(AACC 1983). Absorptions were adjusted so that the resultingfarinograph peaks touched the 500 BU line.
Pasta ProcessingThe procedure described by Walsh et al (1971) was used to
prepare spaghetti (average diameter 1.50 mm) and elbow maca-roni (average diameter 4.30 mm, with hollow diameter 2.00 mm)from the semolina control and blends. A constant 31.5% water(based on semolina) was used (0.5% additional water was usedfor those of incorporated regrinds). The LT (400C) and HT (730C)drying cycles described by Debbouz (1994), and the modifiedBraibanti UTD (90 0C) drying cycle were used. All samples(1,000 g) were processed in replicate on two different days on the
318 CEREAL CHEMISTRY
DeMaco continuous semicommercial scale vacuum pasta extruderwith die 43131 for spaghetti and die 33319 for elbow macaroni(D. Maldari and Sons Inc., Brooklyn, NY).
Instrumental Evaluation of Spaghetti and Elbow MacaroniColor of raw spaghetti and elbow macaroni was determined
using the Minolta color difference meter and converting the L(brightness) and b (yellowness) values to color scores using aspaghetti color map, according to the procedure at the Depart-ment of Cereal Science, North Dakota State University (Walsh1970, Debbouz 1994).
Spaghetti cooking quality, expressed by cooked weight, cook-ing loss, and cooked firmness, was determined on all samples(Method 16-50, AACC 1983). Cooked weight was the weight of10 g of dry spaghetti after cooking 12 min or 10 g of dry elbowmacaroni after cooking 8 min in 300 ml of boiling distilled water.Results were expressed in grams. Cooking loss was the solids lostto the water during the cooking, reported as a percentage basis ofthe dry pasta. Firmness was measured using two strands of spa-ghetti and one elbow macaroni and expressed as grams centimeters.
Sensory Evaluation of SpaghettiNine experienced panelists from the Department of Cereal Sci-
ence, North Dakota State University, were trained to do the sen-sory evaluation of the spaghetti products. A minimum of fivepanelists has been suggested for descriptive and discriminationtesting. Panelists were supplied with deionized, distilled water,napkins, and spittoons at their individual booths in a distraction-free room. In the training session, panelists became familiar withthe terminology and scorecard used in this study. Attribute inten-sities were rated on unstructured 15-cm lines anchored 1 cm fromeach end. Panelists were given samples during training to corre-spond to the extremes (anchors) for each attribute to be evaluated(Jacobi and Setser 1985). Six samples of the HTD spaghetti con-taining 10, 20, 30% LTR and HTR, respectively, along with thecontrol (100% semolina), were evaluated in triplicate. All sam-ples were dried using the HTD (73°C) cycle described by Deb-bouz (1994).
Samples were cooked in 1,000-ml beakers on a hot plate (type2200, model HPA22 45M, Thermolyne, subsidiary of Sybron,Dubuque, IA) using a 1: 15 ratio of spaghetti to water. For sensoryevaluation, 45 g of spaghetti in 8-cm strands were cooked in rap-idly boiling distilled water to optimum (defined in preliminarycooking tests as the time when the center core in the strands dis-appears). This was =5 g of spaghetti per panelist. Spaghetti wasimmediately assessed for appearance moistness, mouthfeel dry-ness, off-flavor, and firmness. Spaghetti clumping and generalacceptability were assessed =7 min after cooking, the averagetime required for the panelists to complete their assessment of theother attributes (Malcolmson 1991).
Statistical AnalysisInstrumental data were analyzed using analysis of variance
(ANOVA). Degrees of freedom (DF): regrind type (RT) (spaghettiDF2; macaroni DF2); blending level (BL) (spaghetti DF4; maca-roni DF3); drying cycle (DC) (spaghetti DF2; macaroni DF2); RTx BL (spaghetti DF8; macaroni DF6); RT x DC (spaghetti DF4;macaroni DF4); BL x DC (spaghetti DF8; macaroni DF6); RT xBL x DC (spaghetti DF16; macaroni DF12); total (spaghettiDF44; macaroni DF35).
Sensory data were analyzed for spaghetti using ANOVA. DF:replications (DF2); treatments (DF6); judges (DF8); total (DF16).
RESULTS AND DISCUSSION
Physicochemical Properties of RegrindsParticle-size distribution for each regrind sample and control
semolina are presented in Table I. HTR, UTR, and especially
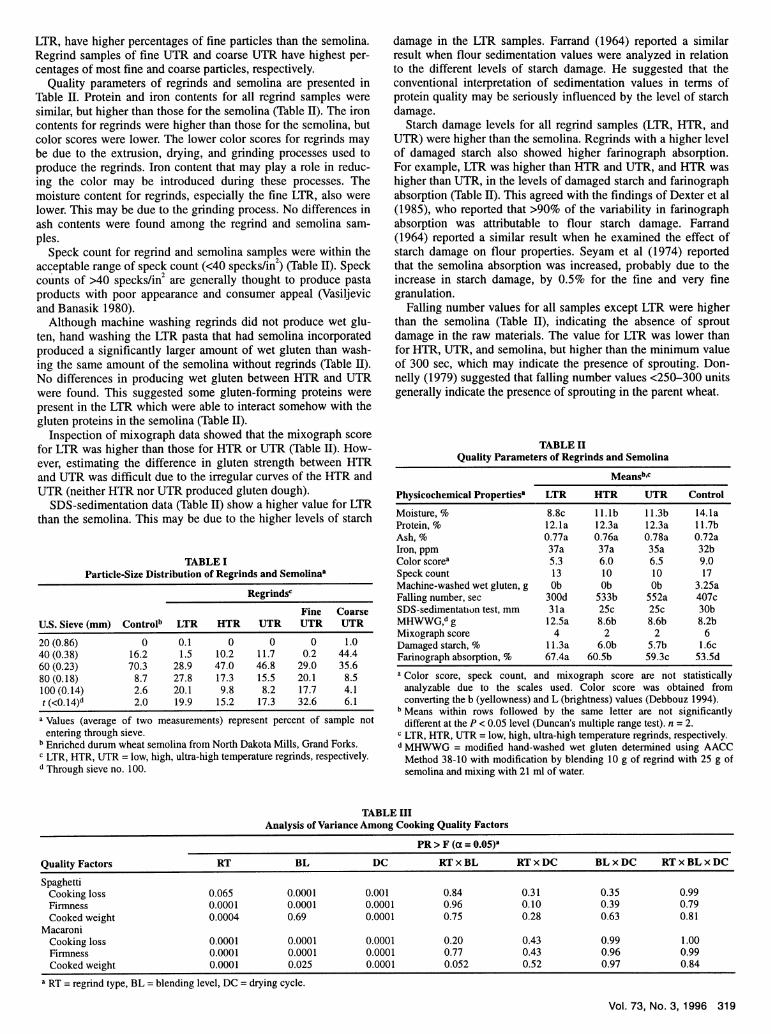
LTR, have higher percentages of fine particles than the semolina.Regrind samples of fine UTR and coarse UTR have highest per-centages of most fine and coarse particles, respectively.
Quality parameters of regrinds and semolina are presented inTable II. Protein and iron contents for all regrind samples weresimilar, but higher than those for the semolina (Table II). The ironcontents for regrinds were higher than those for the semolina, butcolor scores were lower. The lower color scores for regrinds maybe due to the extrusion, drying, and grinding processes used toproduce the regrinds. Iron content that may play a role in reduc-ing the color may be introduced during these processes. Themoisture content for regrinds, especially the fine LTR, also werelower. This may be due to the grinding process. No differences inash contents were found among the regrind and semolina sam-ples.
Speck count for regrind and semolina samples were within theacceptable range of speck count (<40 specks/in2 ) (Table II). Speck
2counts of >40 specks/in are generally thought to produce pastaproducts with poor appearance and consumer appeal (Vasiljevicand Banasik 1980).
Although machine washing regrinds did not produce wet glu-ten, hand washing the LTR pasta that had semolina incorporatedproduced a significantly larger amount of wet gluten than wash-ing the same amount of the semolina without regrinds (Table II).No differences in producing wet gluten between HTR and UTRwere found. This suggested some gluten-forming proteins werepresent in the LTR which were able to interact somehow with thegluten proteins in the semolina (Table II).
Inspection of mixograph data showed that the mixograph scorefor LTR was higher than those for HTR or UTR (Table II). How-ever, estimating the difference in gluten strength between HTRand UTR was difficult due to the irregular curves of the HTR andUTR (neither HTR nor UTR produced gluten dough).
SDS-sedimentation data (Table II) show a higher value for LTRthan the semolina. This may be due to the higher levels of starch
TABLE IParticle-Size Distribution of Regrinds and Semolinaa
Regrindsc
Fine CoarseU.S. Sieve (mm) Controlb LTR HTR UTR UTR UTR
20 (0.86) 0 0.1 0 0 0 1.040 (0.38) 16.2 1.5 10.2 11.7 0.2 44.460 (0.23) 70.3 28.9 47.0 46.8 29.0 35.680 (0.18) 8.7 27.8 17.3 15.5 20.1 8.5100 (0.14) 2.6 20.1 9.8 8.2 17.7 4.1t (<0.14)d 2.0 19.9 15.2 17.3 32.6 6.1
a Values (average of two measurements) represent percent of sample notentering through sieve.
b Enriched durum wheat semolina from North Dakota Mills, Grand Forks.c LTR, HTR, UTR = low, high, ultra-high temperature regrinds, respectively.d Through sieve no. 100.
damage in the LTR samples. Farrand (1964) reported a similarresult when flour sedimentation values were analyzed in relationto the different levels of starch damage. He suggested that theconventional interpretation of sedimentation values in terms ofprotein quality may be seriously influenced by the level of starchdamage.
Starch damage levels for all regrind samples (LTR, HTR, andUTR) were higher than the semolina. Regrinds with a higher levelof damaged starch also showed higher farinograph absorption.For example, LTR was higher than HTR and UTR, and HTR washigher than UTR, in the levels of damaged starch and farinographabsorption (Table II). This agreed with the findings of Dexter et al(1985), who reported that >90% of the variability in farinographabsorption was attributable to flour starch damage. Farrand(1964) reported a similar result when he examined the effect ofstarch damage on flour properties. Seyam et al (1974) reportedthat the semolina absorption was increased, probably due to theincrease in starch damage, by 0.5% for the fine and very finegranulation.
Falling number values for all samples except LTR were higherthan the semolina (Table II), indicating the absence of sproutdamage in the raw materials. The value for LTR was lower thanfor HTR, UTR, and semolina, but higher than the minimum valueof 300 sec, which may indicate the presence of sprouting. Don-nelly (1979) suggested that falling number values <250-300 unitsgenerally indicate the presence of sprouting in the parent wheat.
TABLE IIQuality Parameters of Regrinds and Semolina
Meansbc
Physicochemical Properties" LTR HTR UTR Control
Moisture, % 8.8c li.b 11.3b 14.1aProtein, % 12.1a 12.3a 12.3a 11.7bAsh, % 0.77a 0.76a 0.78a 0.72aIron, ppm 37a 37a 35a 32bColor scorea 5.3 6.0 6.5 9.0Speck count 13 10 10 17Machine-washed wet gluten, g Ob Ob Ob 3.25aFalling number, sec 300d 533b 552a 407cSDS-sedimentation test, mm 31a 25c 25c 30bMHWWG,d g 12.5a 8.6b 8.6b 8.2bMixograph score 4 2 2 6Damaged starch, % 11.3a 6.Ob 5.7b 1.6cFarinograph absorption, % 67.4a 60.5b 59.3c 53.5d
a Color score, speck count, and mixograph score are not statisticallyanalyzable due to the scales used. Color score was obtained fromconverting the b (yellowness) and L (brightness) values (Debbouz 1994).
b Means within rows followed by the same letter are not significantlydifferent at the P < 0.05 level (Duncan's multiple range test). n = 2.
c LTR, HTR, UTR = low, high, ultra-high temperature regrinds, respectively.d MHWWG = modified hand-washed wet gluten determined using AACC
Method 38-10 with modification by blending 10 g of regrind with 25 g ofsemolina and mixing with 21 ml of water.
TABLE IIIAnalysis of Variance Among Cooking Quality Factors
PR > F (a = 0.05)2
Quality Factors RT BL DC RT x BL RT x DC BL x DC RT x BL x DC
SpaghettiCooking loss 0.065 0.0001 0.001 0.84 0.31 0.35 0.99Firmness 0.0001 0.0001 0.0001 0.96 0.10 0.39 0.79Cooked weight 0.0004 0.69 0.0001 0.75 0.28 0.63 0.81
MacaroniCooking loss 0.0001 0.0001 0.0001 0.20 0.43 0.99 1.00Firmness 0.0001 0.0001 0.0001 0.77 0.43 0.96 0.99Cooked weight 0.0001 0.025 0.0001 0.052 0.52 0.97 0.84
a RT = regrind type, BL = blending level, DC = drying cycle.
Vol. 73, No. 3,1996 319
Instrumental Evaluation of Spaghetti and Elbow MacaroniANOVA (Table III) showed lack of significant interactions
among regrind types, blending levels, or drying cycles for cook-ing loss, firmness or cooked weight at the P < 0.05 level.
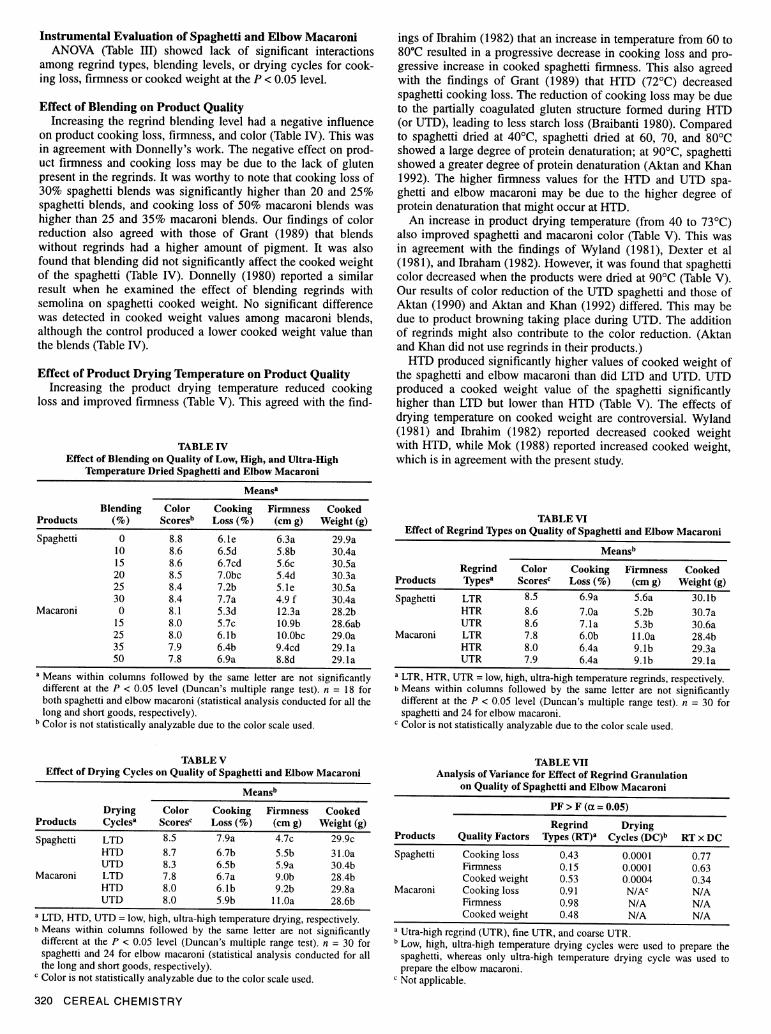
Effect of Blending on Product QualityIncreasing the regrind blending level had a negative influence
on product cooking loss, firmness, and color (Table IV). This wasin agreement with Donnelly's work. The negative effect on prod-uct firmness and cooking loss may be due to the lack of glutenpresent in the regrinds. It was worthy to note that cooking loss of30% spaghetti blends was significantly higher than 20 and 25%spaghetti blends, and cooking loss of 50% macaroni blends washigher than 25 and 35% macaroni blends. Our findings of colorreduction also agreed with those of Grant (1989) that blendswithout regrinds had a higher amount of pigment. It was alsofound that blending did not significantly affect the cooked weightof the spaghetti (Table IV). Donnelly (1980) reported a similarresult when he examined the effect of blending regrinds withsemolina on spaghetti cooked weight. No significant differencewas detected in cooked weight values among macaroni blends,although the control produced a lower cooked weight value thanthe blends (Table IV).
Effect of Product Drying Temperature on Product QualityIncreasing the product drying temperature reduced cooking
loss and improved firmness (Table V). This agreed with the find-
TABLE IVEffect of Blending on Quality of Low, High, and Ultra-High
Temperature Dried Spaghetti and Elbow Macaroni
Means"
Blending Color Cooking Firmness CookedProducts (%) Scoresb Loss (%) (cm g) Weight (g)
Spaghetti 0 8.8 6.le 6.3a 29.9a10 8.6 6.5d 5.8b 30.4a15 8.6 6.7cd 5.6c 30.5a20 8.5 7.Obc 5.4d 30.3a25 8.4 7.2b 5.le 30.5a30 8.4 7.7a 4.9 f 30.4a
Macaroni 0 8.1 5.3d 12.3a 28.2b15 8.0 5.7c 10.9b 28.6ab25 8.0 6.1b 1O.Obc 29.Oa35 7.9 6.4b 9.4cd 29.1a50 7.8 6.9a 8.8d 29.1 a
a Means within columns followed by the same letter are not significantlydifferent at the P < 0.05 level (Duncan's multiple range test). n = 18 forboth spaghetti and elbow macaroni (statistical analysis conducted for all thelong and short goods, respectively).
b Color is not statistically analyzable due to the color scale used.
TABLE VEffect of Drying Cycles on Quality of Spaghetti and Elbow Macaroni
Meansb
Drying Color Cooking Firmness CookedProducts Cyclesa Scoresc Loss (%) (cm g) Weight (g)
Spaghetti LTD 8.5 7.9a 4.7c 29.9cHTD 8.7 6.7b 5.5b 31.OaUTD 8.3 6.5b 5.9a 30.4b
Macaroni LTD 7.8 6.7a 9.Ob 28.4bHTD 8.0 6.1b 9.2b 29.8aUTD 8.0 5.9b I1l.Oa 28.6b
a LTD, HTD, UTD = low, high, ultra-high temperature drying, respectively.b Means within columns followed by the same letter are not significantly
different at the P < 0.05 level (Duncan's multiple range test). n = 30 forspaghetti and 24 for elbow macaroni (statistical analysis conducted for allthe long and short goods, respectively).
c Color is not statistically analyzable due to the color scale used.
320 CEREAL CHEMISTRY
ings of Ibrahim (1982) that an increase in temperature from 60 to80°C resulted in a progressive decrease in cooking loss and pro-gressive increase in cooked spaghetti firmness. This also agreedwith the findings of Grant (1989) that HTD (72°C) decreasedspaghetti cooking loss. The reduction of cooking loss may be dueto the partially coagulated gluten structure formed during HTD(or UTD), leading to less starch loss (Braibanti 1980). Comparedto spaghetti dried at 40°C, spaghetti dried at 60, 70, and 80°Cshowed a large degree of protein denaturation; at 90°C, spaghettishowed a greater degree of protein denaturation (Aktan and Khan1992). The higher firmness values for the HTD and UTD spa-ghetti and elbow macaroni may be due to the higher degree ofprotein denaturation that might occur at HTD.
An increase in product drying temperature (from 40 to 73°C)also improved spaghetti and macaroni color (Table V). This wasin agreement with the findings of Wyland (1981), Dexter et al(1981), and Ibraham (1982). However, it was found that spaghetticolor decreased when the products were dried at 90°C (Table V).Our results of color reduction of the UTD spaghetti and those ofAktan (1990) and Aktan and Khan (1992) differed. This may bedue to product browning taking place during UTD. The additionof regrinds might also contribute to the color reduction. (Aktanand Khan did not use regrinds in their products.)
HTD produced significantly higher values of cooked weight ofthe spaghetti and elbow macaroni than did LTD and UTD. UTDproduced a cooked weight value of the spaghetti significantlyhigher than LTD but lower than HTD (Table V). The effects ofdrying temperature on cooked weight are controversial. Wyland(1981) and Ibrahim (1982) reported decreased cooked weightwith HTD, while Mok (1988) reported increased cooked weight,which is in agreement with the present study.
TABLE VIEffect of Regrind Types on Quality of Spaghetti and Elbow Macaroni
Meansb
Regrind Color Cooking Firmness CookedProducts Typesa Scoresc Loss (%) (cm g) Weight (g)
Spaghetti LTR 8.5 6.9a 5.6a 30.1bHTR 8.6 7.Oa 5.2b 30.7aUTR 8.6 7.1a 5.3b 30.6a
Macaroni LTR 7.8 6.Ob 11 .Oa 28.4bHTR 8.0 6.4a 9.1b 2
9.3a
UTR 7.9 6.4a 9.1b 29.1a
a LTR, HTR, UTR = low, high, ultra-high temperature regrinds, respectively.b Means within columns followed by the same letter are not significantly
different at the P < 0.05 level (Duncan's multiple range test). n = 30 forspaghetti and 24 for elbow macaroni.
c Color is not statistically analyzable due to the color scale used.
TABLE VIIAnalysis of Variance for Effect of Regrind Granulation
on Quality of Spaghetti and Elbow Macaroni
PF > F (a = 0.05)
Regrind DryingProducts Quality Factors Types (RT)M Cycles (DC)b RT x DC
Spaghetti Cooking loss 0.43 0.0001 0.77Firmness 0.15 0.0001 0.63Cooked weight 0.53 0.0004 0.34
Macaroni Cooking loss 0.91 N/AC N/AFirmness 0.98 N/A N/ACooked weight 0.48 N/A N/A
a Utra-high regrind (UTR), fine UTR, and coarse UTR.b Low, high, ultra-high temperature drying cycles were used to prepare the
spaghetti, whereas only ultra-high temperature drying cycle was used toprepare the elbow macaroni.
c Not applicable.
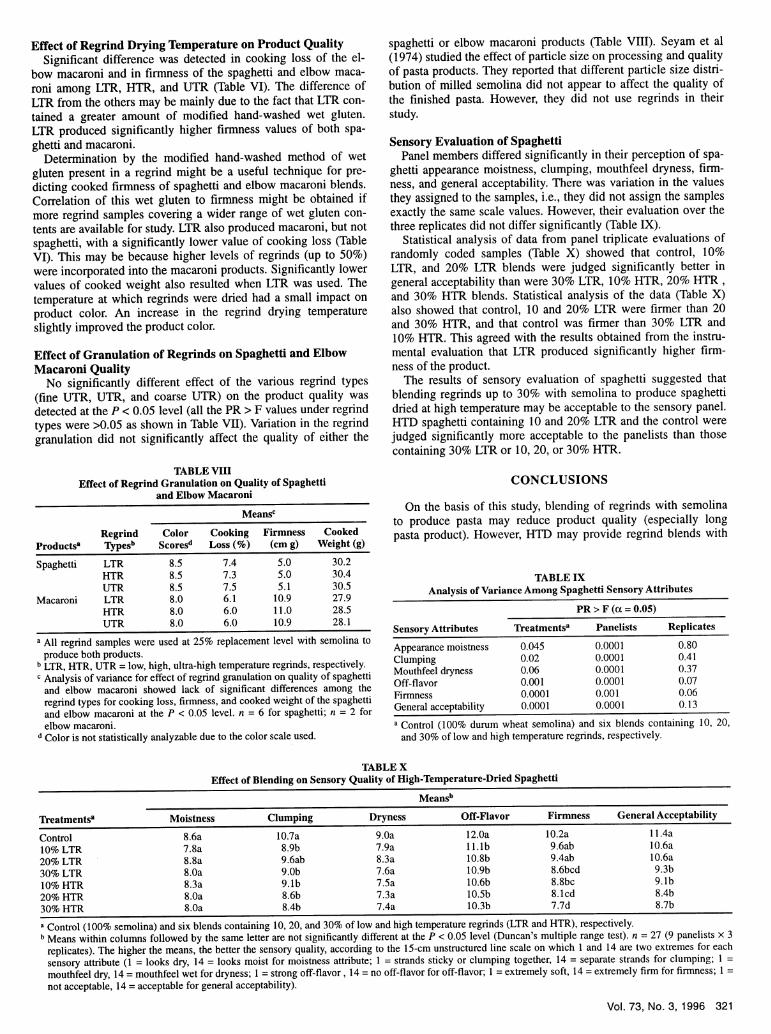
Effect of Regrind Drying Temperature on Product QualitySignificant difference was detected in cooking loss of the el-
bow macaroni and in firmness of the spaghetti and elbow maca-roni among LTR, HTR, and UTR (Table VI). The difference ofLTR from the others may be mainly due to the fact that LTR con-tained a greater amount of modified hand-washed wet gluten.LTR produced significantly higher firmness values of both spa-ghetti and macaroni.
Determination by the modified hand-washed method of wetgluten present in a regrind might be a useful technique for pre-dicting cooked firmness of spaghetti and elbow macaroni blends.Correlation of this wet gluten to firmness might be obtained ifmore regrind samples covering a wider range of wet gluten con-tents are available for study. LTR also produced macaroni, but notspaghetti, with a significantly lower value of cooking loss (TableVI). This may be because higher levels of regrinds (up to 50%)were incorporated into the macaroni products. Significantly lowervalues of cooked weight also resulted when LTR was used. Thetemperature at which regrinds were dried had a small impact onproduct color. An increase in the regrind drying temperatureslightly improved the product color.
Effect of Granulation of Regrinds on Spaghetti and ElbowMacaroni Quality
No significantly different effect of the various regrind types(fine UTR, UTR, and coarse UTR) on the product quality wasdetected at the P < 0.05 level (all the PR > F values under regrindtypes were >0.05 as shown in Table VII). Variation in the regrindgranulation did not significantly affect the quality of either the
TABLE VIIIEffect of Regrind Granulation on Quality of Spaghetti
and Elbow Macaroni
Meansc
Regrind Color Cooking Firmness CookedProductsa Typesb Scoresd Loss (%) (cm g) Weight (g)
Spaghetti LTR 8.5 7.4 5.0 30.2HTR 8.5 7.3 5.0 30.4UTR 8.5 7.5 5.1 30.5
Macaroni LTR 8.0 6.1 10.9 27.9HTR 8.0 6.0 11.0 28.5UTR 8.0 6.0 10.9 28.1
a All regrind samples were used at 25% replacement level with semolina toproduce both products.
b LTR, HTR, UTR = low, high, ultra-high temperature regrinds, respectively.c Analysis of variance for effect of regrind granulation on quality of spaghetti
and elbow macaroni showed lack of significant differences among theregrind types for cooking loss, firmness, and cooked weight of the spaghettiand elbow macaroni at the P < 0.05 level. n = 6 for spaghetti; n = 2 forelbow macaroni.
d Color is not statistically analyzable due to the color scale used.
spaghetti or elbow macaroni products (Table VIII). Seyam et al(1974) studied the effect of particle size on processing and qualityof pasta products. They reported that different particle size distri-bution of milled semolina did not appear to affect the quality ofthe finished pasta. However, they did not use regrinds in theirstudy.
Sensory Evaluation of SpaghettiPanel members differed significantly in their perception of spa-
ghetti appearance moistness, clumping, mouthfeel dryness, firm-ness, and general acceptability. There was variation in the valuesthey assigned to the samples, i.e., they did not assign the samplesexactly the same scale values. However, their evaluation over thethree replicates did not differ significantly (Table IX).
Statistical analysis of data from panel triplicate evaluations ofrandomly coded samples (Table X) showed that control, 10%LTR, and 20% LTR blends were judged significantly better ingeneral acceptability than were 30% LTR, 10% HTR, 20% HTR,and 30% HTR blends. Statistical analysis of the data (Table X)also showed that control, 10 and 20% LTR were firmer than 20and 30% HTR, and that control was firmer than 30% LTR and10% HTR. This agreed with the results obtained from the instru-mental evaluation that LTR produced significantly higher firm-ness of the product.
The results of sensory evaluation of spaghetti suggested thatblending regrinds up to 30% with semolina to produce spaghettidried at high temperature may be acceptable to the sensory panel.HTD spaghetti containing 10 and 20% LTR and the control werejudged significantly more acceptable to the panelists than thosecontaining 30% LTR or 10, 20, or 30% HTR.
CONCLUSIONS
On the basis of this study, blending of regrinds with semolinato produce pasta may reduce product quality (especially longpasta product). However, HTD may provide regrind blends with
TABLE IXAnalysis of Variance Among Spaghetti Sensory Attributes
PR > F (ax = 0.05)
Sensory Attributes Treatmentsa Panelists Replicates
Appearance moistness 0.045 0.0001 0.80Clumping 0.02 0.0001 0.41Mouthfeel dryness 0.06 0.0001 0.37Off-flavor 0.001 0.0001 0.07Firmness 0.0001 0.001 0.06General acceptability 0.0001 0.0001 0.13
a Control (100% durum wheat semolina) and six blends containing 10, 20,and 30% of low and high temperature regrinds, respectively.
TABLE X
Effect of Blending on Sensory Quality of High-Temperature-Dried Spaghetti
Meansb
Treatmentsa Moistness Clumping Dryness Off-Flavor Firmness General Acceptability
Control 8.6a 10.7a 9.Oa 12.Oa 10.2a 11.4a
10% LTR 7.8a 8.9b 7.9a IlI.lb 9.6ab 10.6a
20% LTR 8.8a 9.6ab 8.3a 10.8b 9.4ab 10.6a
30% LTR 8.Oa 9.Ob 7.6a 10.9b 8.6bcd 9.3b
10% HTR 8.3a 9.1b 7.5a 10.6b 8.8bc 9.1b
20% HTR 8.Oa 8.6b 7.3a 10.5b 8.lcd 8.4b
30% HTR 8.Oa 8.4b 7.4a 10.3b 7.7d 8.7b
a Control (100% semolina) and six blends containing 10, 20, and 30% of low and high temperature regrinds (LTR and HTR), respectively.
b Means within columns followed by the same letter are not significantly different at the P < 0.05 level (Duncan's multiple range test). n = 27 (9 panelists x 3
replicates). The higher the means, the better the sensory quality, according to the 15-cm unstructured line scale on which 1 and 14 are two extremes for each
sensory attribute (1 = looks dry, 14 = looks moist for moistness attribute; 1 = strands sticky or clumping together, 14 = separate strands for clumping; 1 =
mouthfeel dry, 14 = mouthfeel wet for dryness; 1 = strong off-flavor, 14 = no off-flavor for off-flavor; 1 = extremely soft, 14 = extremely firm for firmness; 1 =
not acceptable, 14 = acceptable for general acceptability).
Vol. 73, No. 3, 1996 321
significantly improved color and cooking quality. UTD may offeralmost the same advantages as HTD for short goods, but not forlong goods because of its adverse effect on spaghetti color. In-creasing the regrind drying temperature may have a negativeinfluence on spaghetti and elbow macaroni firmness and elbowmacaroni cooking loss, and perhaps slightly improve productcolor. Variation in granulation of regrinds may not appear toaffect the quality of blends. HTD spaghetti containing from 10 to30% of regrinds may be acceptable to the sensory panelists. The10 or 20% LTR, which were blended with semolina, would pro-duce more acceptable spaghetti dried at high temperature than30% LTR or 10, 20, or 30% HTD pasta regrinds.
ACKNOWLEDGMENTS
Financial assistance from the National Pasta Association, the NorthDakota Wheat Commission, and the Minnesota Wheat Research andPromotion Council is gratefully acknowledged.
LITERATURE CITED
AKTAN, B. 1990. The effects of high and very high temperature dryingof pasta on quality and biochemical constituents. MS thesis. Depart-ment of Cereal Science. North Dakota State University: Fargo.
AKTAN, B., and KHAN, K. 1992. Effect of high-temperature drying ofpasta on quality parameters and on solubility, gel electrophoresis, andreverse-phase high-performance chromatography of protein compo-nents. Cereal Chem. 69:288.
AMERICAN ASSOCIATION OF CEREAL CHEMISTS. 1983.Approved Methods of the AACC, 8th ed. Methods of 08-01, 46-70,38-10, 38-11, 54-21, 46-11, 44-15, 54-40A, 16-50, and 56-81B. TheAssociation: St. Paul, MN.
AOAC. 1990. Official Methods of Analysis. Methods of 923.03 and965.09. The Association: Arlington, VA.
BRAIBANTI and C. S. p. A. 1980. New developments in pasta dryingtechnology. Macaroni J. 61(12):48.
DEBBOUZ, A 1994. What's new in pasta color. Pasta J. 76 (6): 31.DEXTER, J. E., MATSUO, R. R., and MORGAN, B. C. 1981. High
temperature drying: Effect of spaghetti properties. J. Food Sci.46:1741.
DEXTER, J. E., PRESTON, K. R., TWEED, A. R., KILBORN, R. H.,and TIPPLES, K. H. 1985. Relationship of flour starch damage andflour protein to the quality of Brazilian-style hearth bread and remixpan bread produced from hard red spring wheat. Cereal Foods World30:5 11.
DICK, J. W. and QUICK, J. S. 1983. A modified screening test for rapid
estimation of gluten strength in early-generation durum wheat breed-ing lines. Cereal Chem. 60:315.
DONNELLY, B. J. 1979. Pasta products: Raw material, technology,evaluation. Macaroni J. 61(1):6.
DONNELLY, B. J. 1980. Pasta regrinds: Effect on spaghetti quality. J.Agric. Food Chem. 28:806.
FARRAND, E. A. 1964. Flour properties in relation to the modern breadprocesses in the United Kingdom, with special reference to es-amylaseand starch damage. Cereal Chem. 41:98.
GIBSON, T. S., KALDOR, C. J., and McCLEARY, B. V. 1993. Collabo-rative evaluation of an enzymatic starch damage assay kit and com-parison with other methods. Cereal Chem. 70:47.
GRANT, L. A. 1989. The effects of various pasta conditions and ma-nipulated starch damage levels on pasta stickiness. PhD dissertation.Department of Cereal Science. North Dakota State University: Fargo.
IBRAHIM, R. H. R. 1982. High temperature drying of pasta: Effect onquality and biochemical components. PhD dissertation. North DakotaState University: Fargo.
JACOBI, G. M., and SETSER, C. 1988. Effect of holding time and tem-perature on sensory quality and thiamin content of spaghetti withsauce using food service and household preparation methods. SchoolFood Serv. Res. Rev. 9:25.
MALCOLMSON, L. J. 1991. Sensory and Instron methods for assessingcooked spaghetti texture. PhD dissertation. Department of Foods andNutrition. University of Manitoba: Winnipeg.
MOK, C. 1988. Moisture sorption and cracking of spaghetti. PhD disser-tation. Department of Cereal Science. North Dakota State University:Fargo.
NATIONAL PASTA ASSOCIATION. 1992. Pasta consumption, produc-tion, import statistics. Pasta J. 74:14.
SAS. 1989. SAS/STAT User's Guide, Ver. 6, 4th ed, Vol. 2. SAS Insti-tute: Cary, NC.
SEYAM, A., SHUEY, W. C., MANEVAL, R. D., and WALSH, D. E.1974. Effect of particle size on processing and quality of pasta prod-ucts. Assoc. Oper. Millers Tech. Bull. December:3497.
VASILJEVIC, S., and BANASIK, 0. J. 1980. Quality testing methodsfor durum wheat and its products. Department of Cereal Science.North Dakota State University: Fargo.
WALSH, D. E. 1970. Measurement of spaghetti color. Macaroni J.52(4):20.
WALSH, D. E., EBELING, K. A., and DICK, J. W. 1971. A linear pro-gramming approach to spaghetti processing. Cereal Science Today16:385.
WYLAND, A. R. 1981. Influence of drying temperature and farinablending on spaghetti quality. MS thesis. Department of Cereal Sci-ence. North Dakota State University: Fargo.
[Received May 24, 1995. Accepted January 5, 1996.]
322 CEREAL CHEMISTRY