Embed Size (px)
Citation preview
Past, Present and Future Maintenance Practices: Monitoring of Electrical Equipment Failure Indicators and Alarming
Author: Gabe Paoletti, P.E. Eaton Corporation Senior Member, IEEE [email protected] Cell # 609-970-0338
2
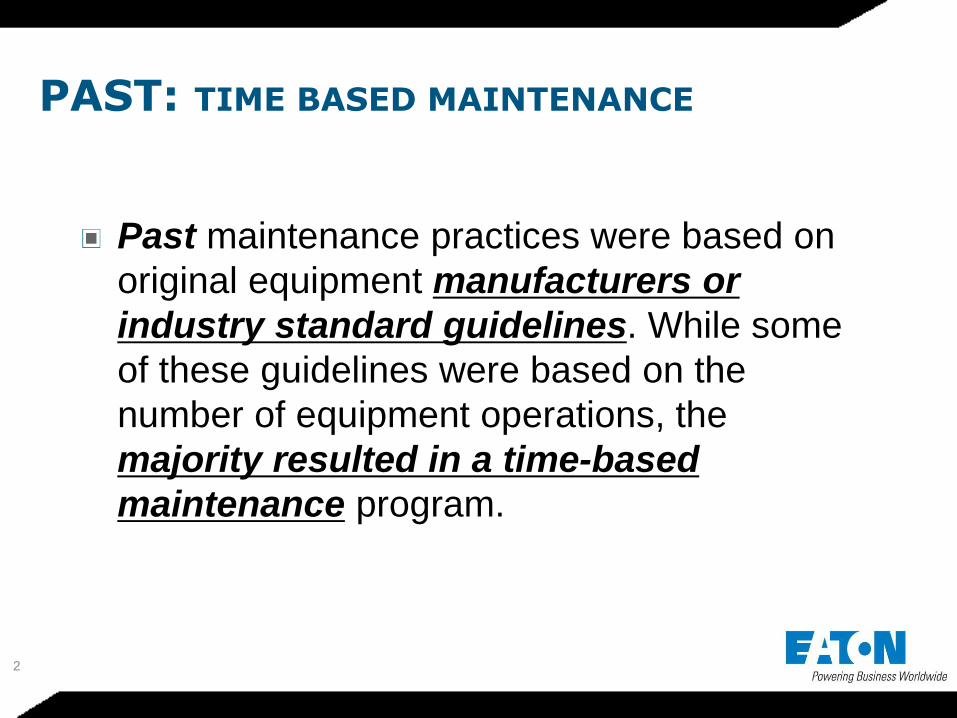
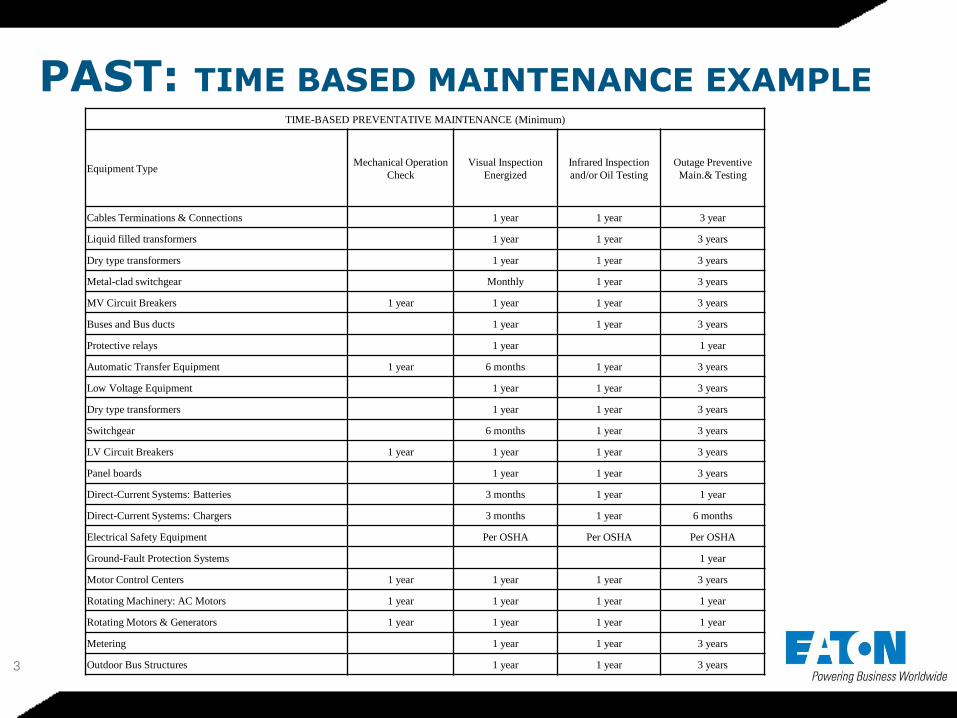
Past maintenance practices were based on
original equipment manufacturers or
industry standard guidelines. While some
of these guidelines were based on the
number of equipment operations, the
majority resulted in a time-based
maintenance program.
PAST: TIME BASED MAINTENANCE
3
TIME-BASED PREVENTATIVE MAINTENANCE (Minimum)
Equipment Type Mechanical Operation
Check
Visual Inspection
Energized
Infrared Inspection
and/or Oil Testing
Outage Preventive
Main.& Testing
Cables Terminations & Connections 1 year 1 year 3 year
Liquid filled transformers 1 year 1 year 3 years
Dry type transformers 1 year 1 year 3 years
Metal-clad switchgear Monthly 1 year 3 years
MV Circuit Breakers 1 year 1 year 1 year 3 years
Buses and Bus ducts 1 year 1 year 3 years
Protective relays 1 year 1 year
Automatic Transfer Equipment 1 year 6 months 1 year 3 years
Low Voltage Equipment 1 year 1 year 3 years
Dry type transformers 1 year 1 year 3 years
Switchgear 6 months 1 year 3 years
LV Circuit Breakers 1 year 1 year 1 year 3 years
Panel boards 1 year 1 year 3 years
Direct-Current Systems: Batteries 3 months 1 year 1 year
Direct-Current Systems: Chargers 3 months 1 year 6 months
Electrical Safety Equipment Per OSHA Per OSHA Per OSHA
Ground-Fault Protection Systems 1 year
Motor Control Centers 1 year 1 year 1 year 3 years
Rotating Machinery: AC Motors 1 year 1 year 1 year 1 year
Rotating Motors & Generators 1 year 1 year 1 year 1 year
Metering 1 year 1 year 3 years
Outdoor Bus Structures 1 year 1 year 3 years
PAST: TIME BASED MAINTENANCE EXAMPLE
4
Circuit breaker guidelines would recommend
detailed inspections following a fault
interruption, but when a fault occurs most of
the resources are diverted to identifying
and correcting the down steam fault, and
restoring power as soon as possible,
therefore the circuit breaker was usually
neglected…
Past “Time-Based Maintenance” is
VERY DIFFICULT to properly implement
PAST: TIME BASED MAINTENANCE ISSUES
5
Present maintenance has been driven by a
reduction in maintenance budgets, while the
need for electrical uptime has become even
more critical.
Resources reduced, expectations the same
When the equipment is available for
maintenance, there is no funding to perform
the maintenance, and when the funding is
available, the equipment is not accessible to
perform the required maintenance.
PRESENT: MAINTENANCE NEEDS
6
PRESENT: MAINTENANCE ISSUES
1 2 3 4 5 6 7 8 9 10 11
0%
20%
40%
60%
80%
100%
Catastrophic
Risk
Resources
Uptime
Expectations
1 2 3 4 5 6 7 8 9 10 11
0%
20%
40%
60%
80%
100%Expectations
Uptime
Resources
Catastrophic
Risk
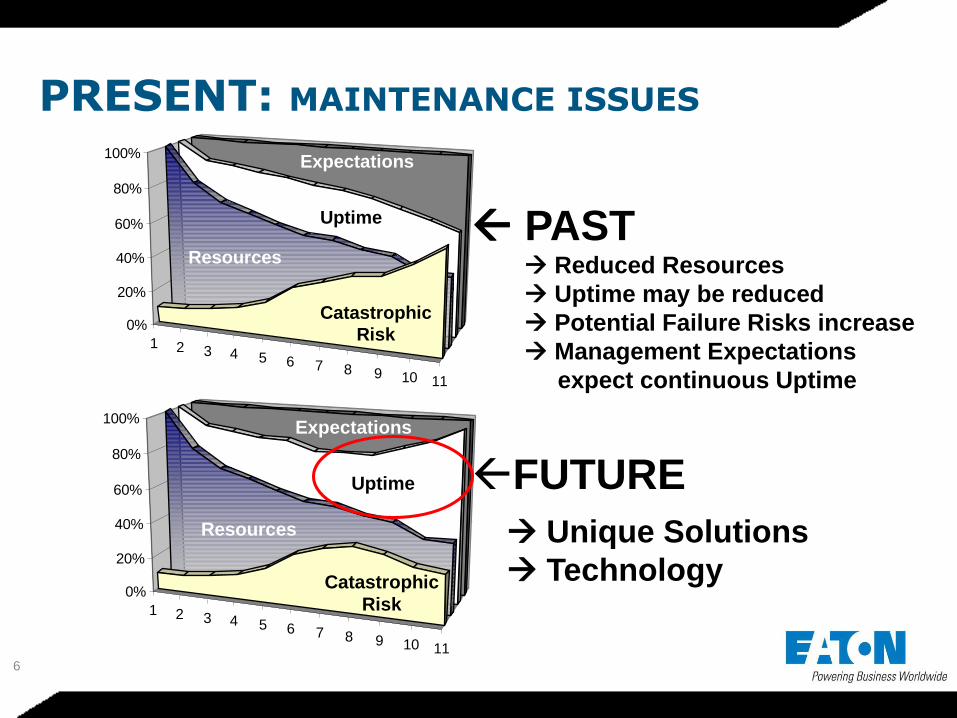
PAST Reduced Resources
Uptime may be reduced
Potential Failure Risks increase
Management Expectations
expect continuous Uptime
FUTURE
Unique Solutions
Technology
7
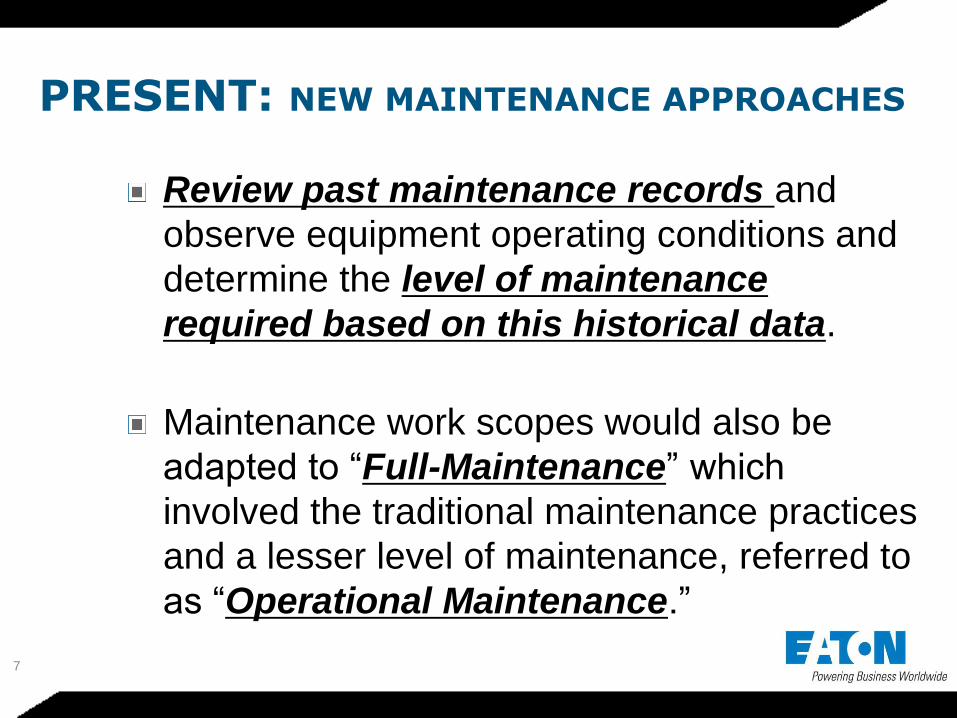
Review past maintenance records and
observe equipment operating conditions and
determine the level of maintenance
required based on this historical data.
Maintenance work scopes would also be
adapted to “Full-Maintenance” which
involved the traditional maintenance practices
and a lesser level of maintenance, referred to
as “Operational Maintenance.”
PRESENT: NEW MAINTENANCE APPROACHES
8
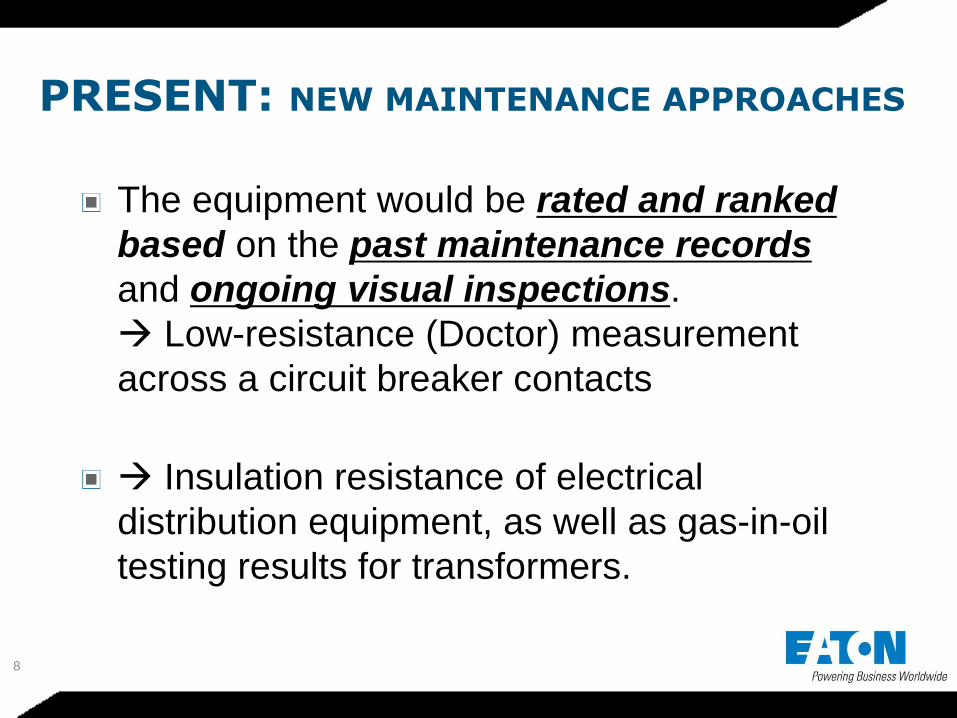
The equipment would be rated and ranked
based on the past maintenance records
and ongoing visual inspections.
Low-resistance (Doctor) measurement
across a circuit breaker contacts
Insulation resistance of electrical
distribution equipment, as well as gas-in-oil
testing results for transformers.
PRESENT: NEW MAINTENANCE APPROACHES
9
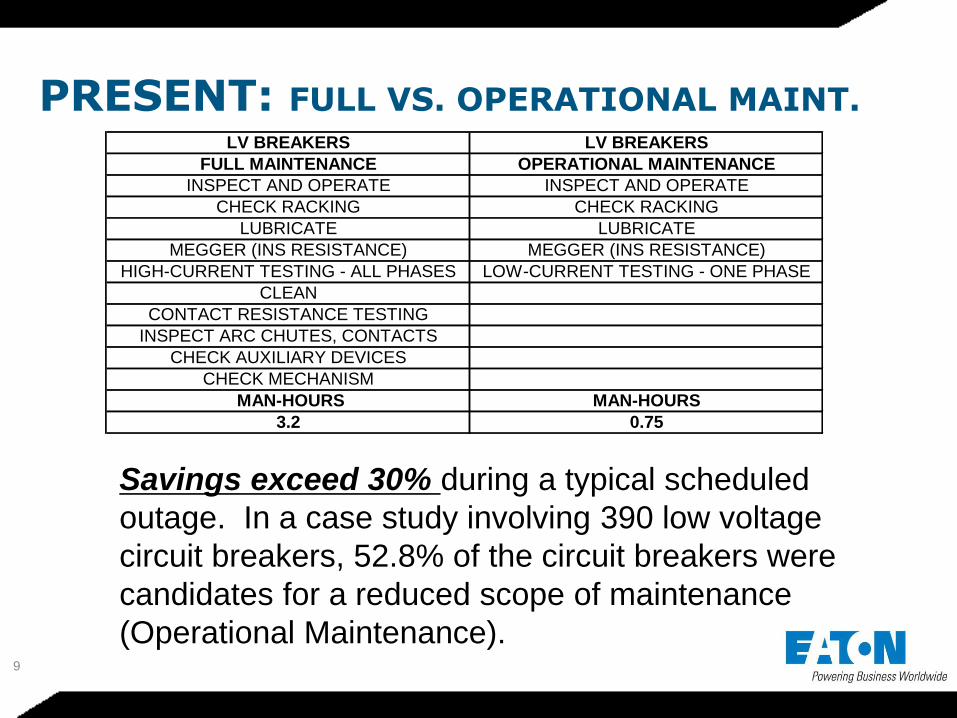
PRESENT: FULL VS. OPERATIONAL MAINT. LV BREAKERS LV BREAKERS
FULL MAINTENANCE OPERATIONAL MAINTENANCE
INSPECT AND OPERATE INSPECT AND OPERATE
CHECK RACKING CHECK RACKING
LUBRICATE LUBRICATE
MEGGER (INS RESISTANCE) MEGGER (INS RESISTANCE)
HIGH-CURRENT TESTING - ALL PHASES LOW-CURRENT TESTING - ONE PHASE
CLEAN
CONTACT RESISTANCE TESTING
INSPECT ARC CHUTES, CONTACTS
CHECK AUXILIARY DEVICES
CHECK MECHANISM
MAN-HOURS MAN-HOURS
3.2 0.75
Savings exceed 30% during a typical scheduled
outage. In a case study involving 390 low voltage
circuit breakers, 52.8% of the circuit breakers were
candidates for a reduced scope of maintenance
(Operational Maintenance).
10
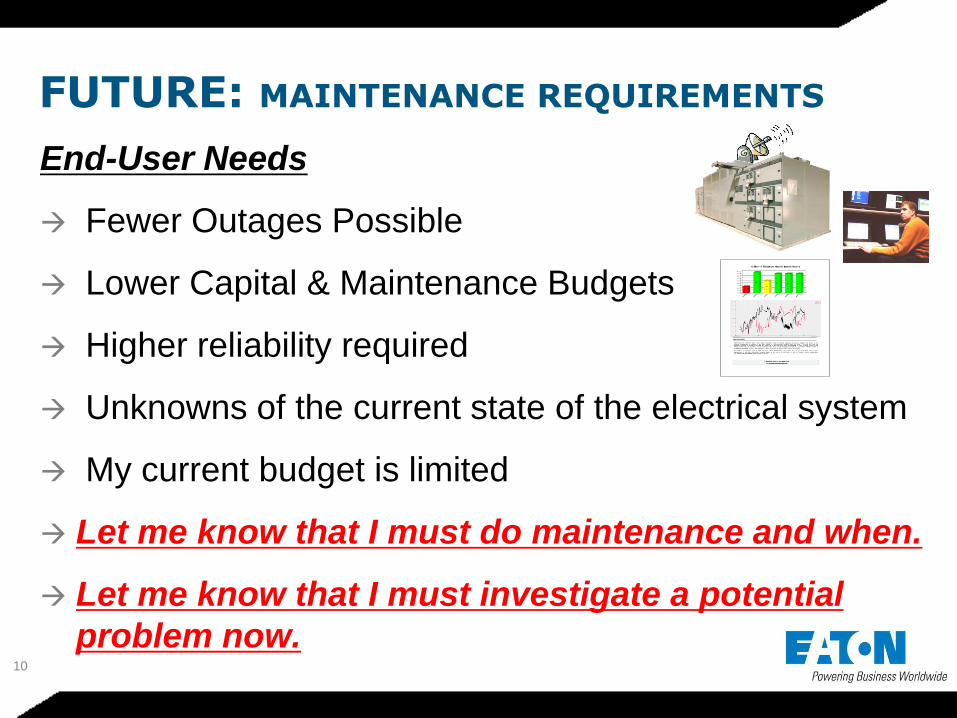
End-User Needs
Fewer Outages Possible
Lower Capital & Maintenance Budgets
Higher reliability required
Unknowns of the current state of the electrical system
My current budget is limited
Let me know that I must do maintenance and when.
Let me know that I must investigate a potential
problem now.
FUTURE: MAINTENANCE REQUIREMENTS
11
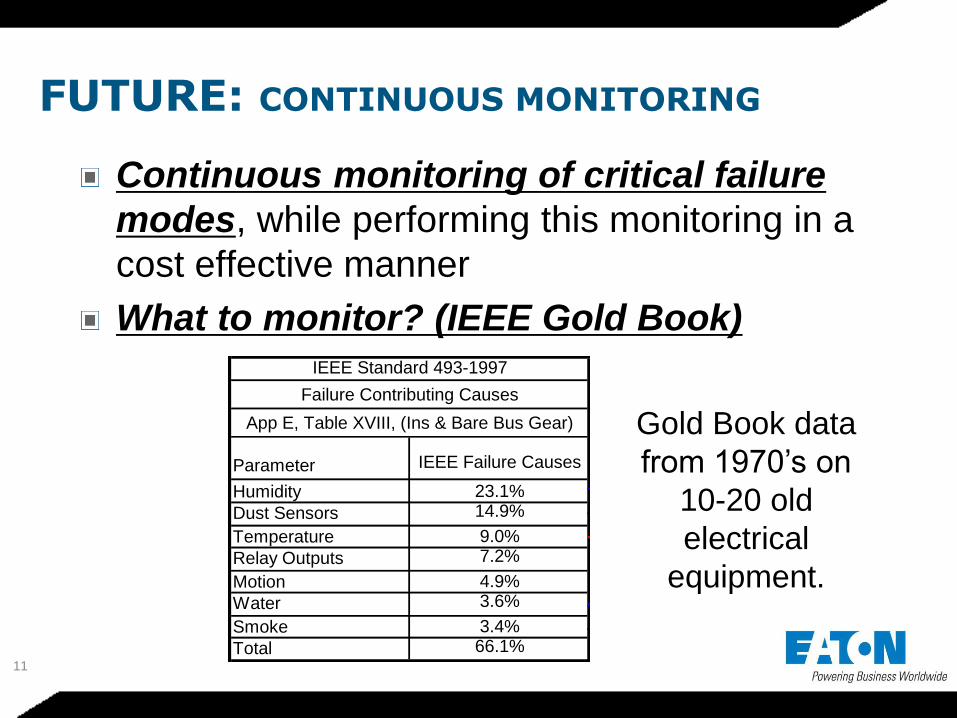
Continuous monitoring of critical failure
modes, while performing this monitoring in a
cost effective manner
What to monitor? (IEEE Gold Book)
FUTURE: CONTINUOUS MONITORING
Parameter IEEE Failure Causes
Humidity 23.1%
Dust Sensors 14.9%
Temperature 9.0%
Relay Outputs 7.2%
Motion 4.9%
Water 3.6%
Smoke 3.4%
Total 66.1%
App E, Table XVIII, (Ins & Bare Bus Gear)
IEEE Standard 493-1997
Failure Contributing Causes
Gold Book data
from 1970’s on
10-20 old
electrical
equipment.
12
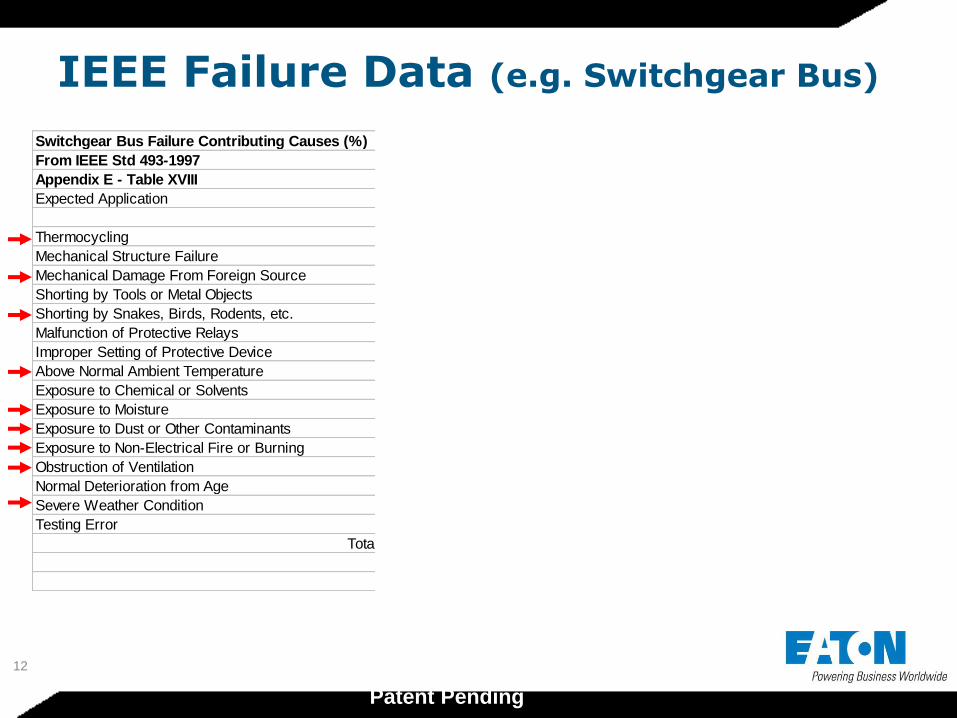
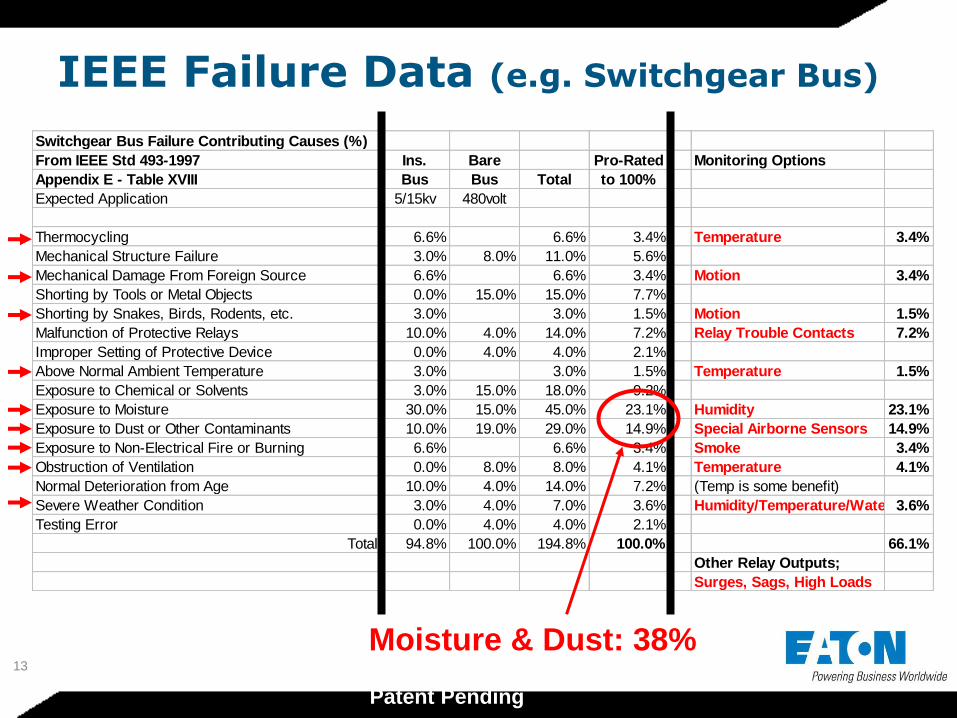
IEEE Failure Data (e.g. Switchgear Bus)
Switchgear Bus Failure Contributing Causes (%)
From IEEE Std 493-1997 Ins. Bare Pro-Rated Monitoring Options
Appendix E - Table XVIII Bus Bus Total to 100%
Expected Application 5/15kv 480volt
Thermocycling 6.6% 6.6% 3.4% Temperature 3.4%
Mechanical Structure Failure 3.0% 8.0% 11.0% 5.6%
Mechanical Damage From Foreign Source 6.6% 6.6% 3.4% Motion 3.4%
Shorting by Tools or Metal Objects 0.0% 15.0% 15.0% 7.7%
Shorting by Snakes, Birds, Rodents, etc. 3.0% 3.0% 1.5% Motion 1.5%
Malfunction of Protective Relays 10.0% 4.0% 14.0% 7.2% Relay Trouble Contacts 7.2%
Improper Setting of Protective Device 0.0% 4.0% 4.0% 2.1%
Above Normal Ambient Temperature 3.0% 3.0% 1.5% Temperature 1.5%
Exposure to Chemical or Solvents 3.0% 15.0% 18.0% 9.2%
Exposure to Moisture 30.0% 15.0% 45.0% 23.1% Humidity 23.1%
Exposure to Dust or Other Contaminants 10.0% 19.0% 29.0% 14.9% Special Airborne Sensors 14.9%
Exposure to Non-Electrical Fire or Burning 6.6% 6.6% 3.4% Smoke 3.4%
Obstruction of Ventilation 0.0% 8.0% 8.0% 4.1% Temperature 4.1%
Normal Deterioration from Age 10.0% 4.0% 14.0% 7.2% (Temp is some benefit)
Severe Weather Condition 3.0% 4.0% 7.0% 3.6% Humidity/Temperature/Water 3.6%
Testing Error 0.0% 4.0% 4.0% 2.1%
Total 94.8% 100.0% 194.8% 100.0% 66.1%
Other Relay Outputs;
Surges, Sags, High Loads
Patent Pending
13
Switchgear Bus Failure Contributing Causes (%)
From IEEE Std 493-1997 Ins. Bare Pro-Rated Monitoring Options
Appendix E - Table XVIII Bus Bus Total to 100%
Expected Application 5/15kv 480volt
Thermocycling 6.6% 6.6% 3.4% Temperature 3.4%
Mechanical Structure Failure 3.0% 8.0% 11.0% 5.6%
Mechanical Damage From Foreign Source 6.6% 6.6% 3.4% Motion 3.4%
Shorting by Tools or Metal Objects 0.0% 15.0% 15.0% 7.7%
Shorting by Snakes, Birds, Rodents, etc. 3.0% 3.0% 1.5% Motion 1.5%
Malfunction of Protective Relays 10.0% 4.0% 14.0% 7.2% Relay Trouble Contacts 7.2%
Improper Setting of Protective Device 0.0% 4.0% 4.0% 2.1%
Above Normal Ambient Temperature 3.0% 3.0% 1.5% Temperature 1.5%
Exposure to Chemical or Solvents 3.0% 15.0% 18.0% 9.2%
Exposure to Moisture 30.0% 15.0% 45.0% 23.1% Humidity 23.1%
Exposure to Dust or Other Contaminants 10.0% 19.0% 29.0% 14.9% Special Airborne Sensors 14.9%
Exposure to Non-Electrical Fire or Burning 6.6% 6.6% 3.4% Smoke 3.4%
Obstruction of Ventilation 0.0% 8.0% 8.0% 4.1% Temperature 4.1%
Normal Deterioration from Age 10.0% 4.0% 14.0% 7.2% (Temp is some benefit)
Severe Weather Condition 3.0% 4.0% 7.0% 3.6% Humidity/Temperature/Water 3.6%
Testing Error 0.0% 4.0% 4.0% 2.1%
Total 94.8% 100.0% 194.8% 100.0% 66.1%
Other Relay Outputs;
Surges, Sags, High Loads
Patent Pending
Moisture & Dust: 38%
IEEE Failure Data (e.g. Switchgear Bus)
14
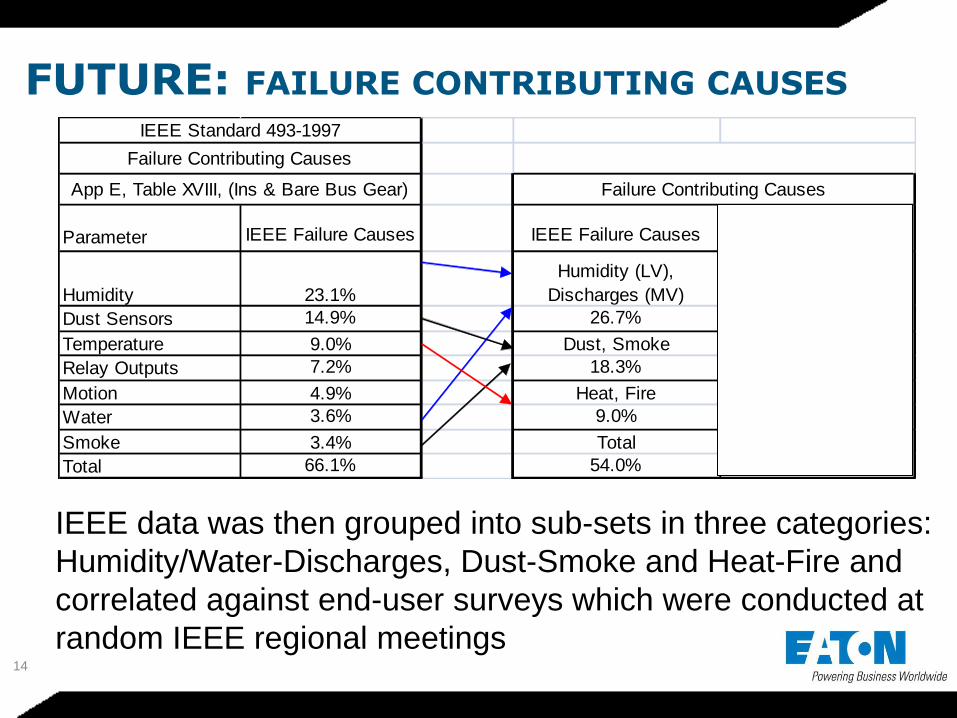
FUTURE: FAILURE CONTRIBUTING CAUSES
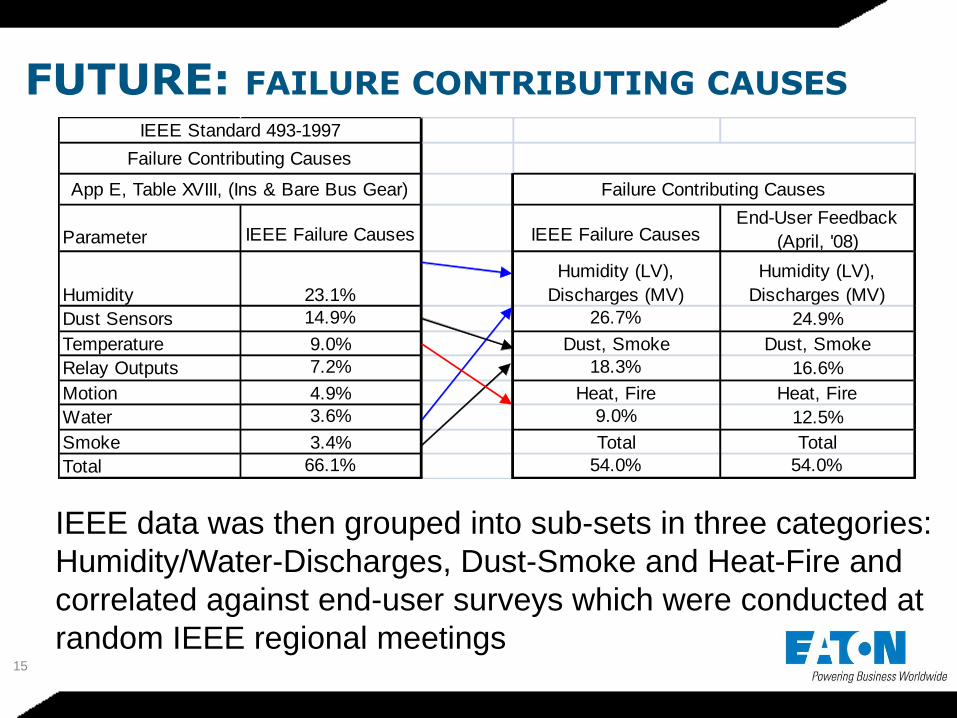
IEEE data was then grouped into sub-sets in three categories:
Humidity/Water-Discharges, Dust-Smoke and Heat-Fire and
correlated against end-user surveys which were conducted at
random IEEE regional meetings
Parameter IEEE Failure Causes IEEE Failure CausesEnd-User Feedback
(April, '08)
Humidity 23.1%
Humidity (LV),
Discharges (MV)
Humidity (LV),
Discharges (MV)
Dust Sensors 14.9% 26.7% 24.9%
Temperature 9.0% Dust, Smoke Dust, Smoke
Relay Outputs 7.2% 18.3% 16.6%
Motion 4.9% Heat, Fire Heat, Fire
Water 3.6% 9.0% 12.5%
Smoke 3.4% Total Total
Total 66.1% 54.0% 54.0%
Failure Contributing Causes
App E, Table XVIII, (Ins & Bare Bus Gear)
IEEE Standard 493-1997
Failure Contributing Causes
15
FUTURE: FAILURE CONTRIBUTING CAUSES
IEEE data was then grouped into sub-sets in three categories:
Humidity/Water-Discharges, Dust-Smoke and Heat-Fire and
correlated against end-user surveys which were conducted at
random IEEE regional meetings
Parameter IEEE Failure Causes IEEE Failure CausesEnd-User Feedback
(April, '08)
Humidity 23.1%
Humidity (LV),
Discharges (MV)
Humidity (LV),
Discharges (MV)
Dust Sensors 14.9% 26.7% 24.9%
Temperature 9.0% Dust, Smoke Dust, Smoke
Relay Outputs 7.2% 18.3% 16.6%
Motion 4.9% Heat, Fire Heat, Fire
Water 3.6% 9.0% 12.5%
Smoke 3.4% Total Total
Total 66.1% 54.0% 54.0%
Failure Contributing Causes
App E, Table XVIII, (Ins & Bare Bus Gear)
IEEE Standard 493-1997
Failure Contributing Causes
16
FUTURE: MONITORING REQUIREMENTS
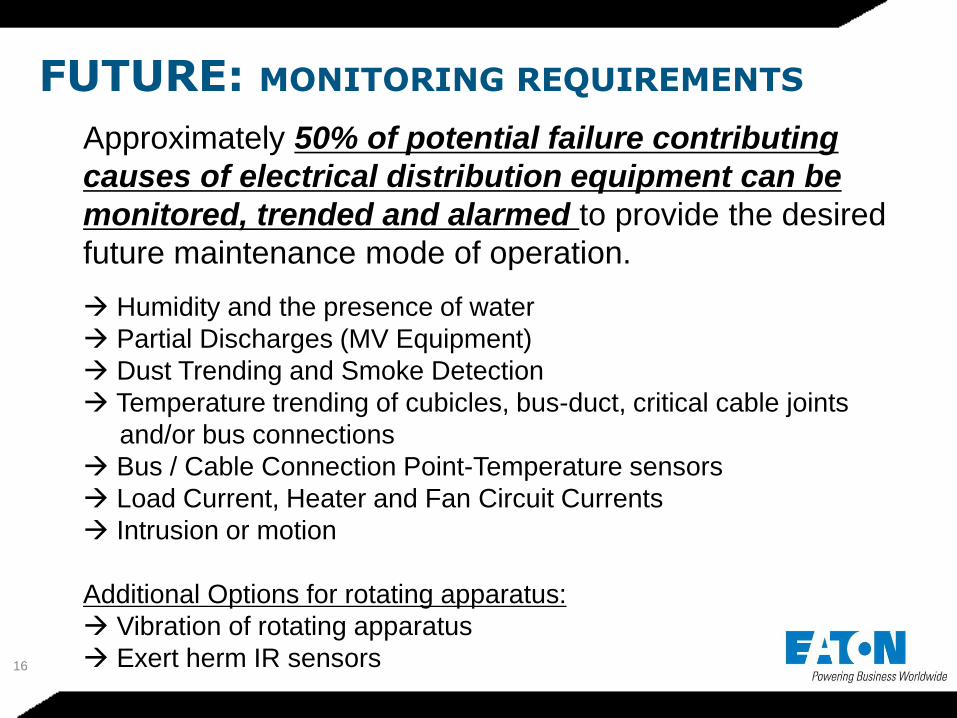
Approximately 50% of potential failure contributing
causes of electrical distribution equipment can be
monitored, trended and alarmed to provide the desired
future maintenance mode of operation.
Humidity and the presence of water
Partial Discharges (MV Equipment)
Dust Trending and Smoke Detection
Temperature trending of cubicles, bus-duct, critical cable joints
and/or bus connections
Bus / Cable Connection Point-Temperature sensors
Load Current, Heater and Fan Circuit Currents
Intrusion or motion
Additional Options for rotating apparatus:
Vibration of rotating apparatus
Exert herm IR sensors
17
FUTURE: MAINTENANCE REQUIREMENTS
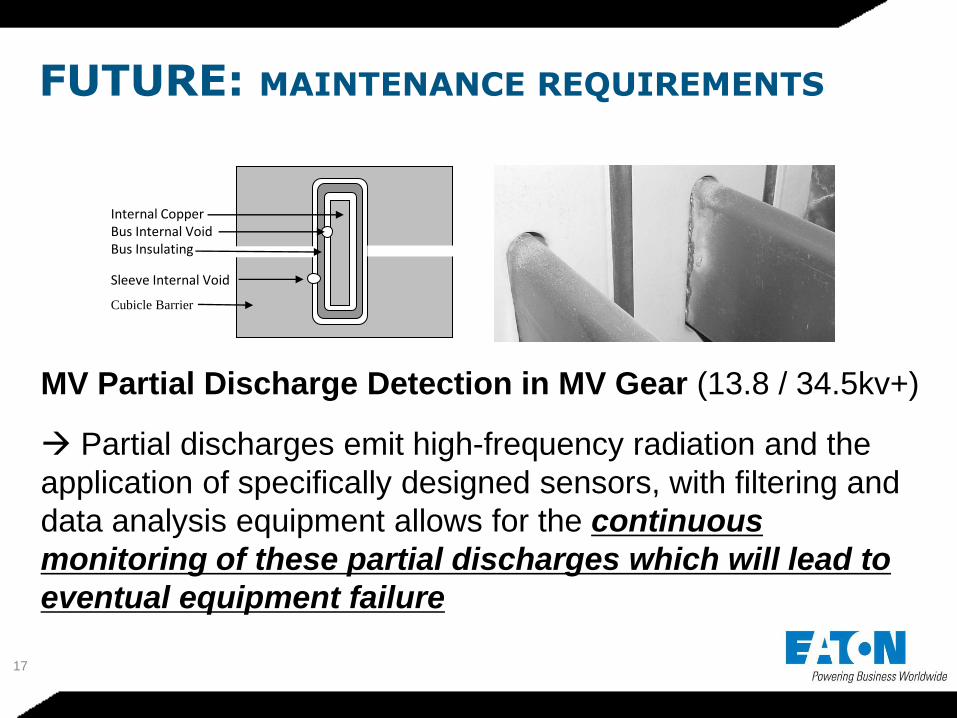
Internal Copper Bus Internal Void Bus Insulating
Sleeve Internal Void
Cubicle Barrier
MV Partial Discharge Detection in MV Gear (13.8 / 34.5kv+)
Partial discharges emit high-frequency radiation and the
application of specifically designed sensors, with filtering and
data analysis equipment allows for the continuous
monitoring of these partial discharges which will lead to
eventual equipment failure
18
Partial discharge detection and temperature sensors, when
combined with sensing options such as humidity, floor
water, dust, smoke, load/heater/fan currents, cubicle or
bus-duct temperatures provides a robust predictive
monitoring package for both low voltage and medium
voltage equipment. By adding available vibration sensors
to the above, this is adapted to rotating equipment.
Patented Algorithms, based on historical and designed-
based operating conditions, which will alarm when a
parameter is considered out of the normal
operating range and provide maintenance
recommendations.
FUTURE: MONITORING REQUIREMENTS
19
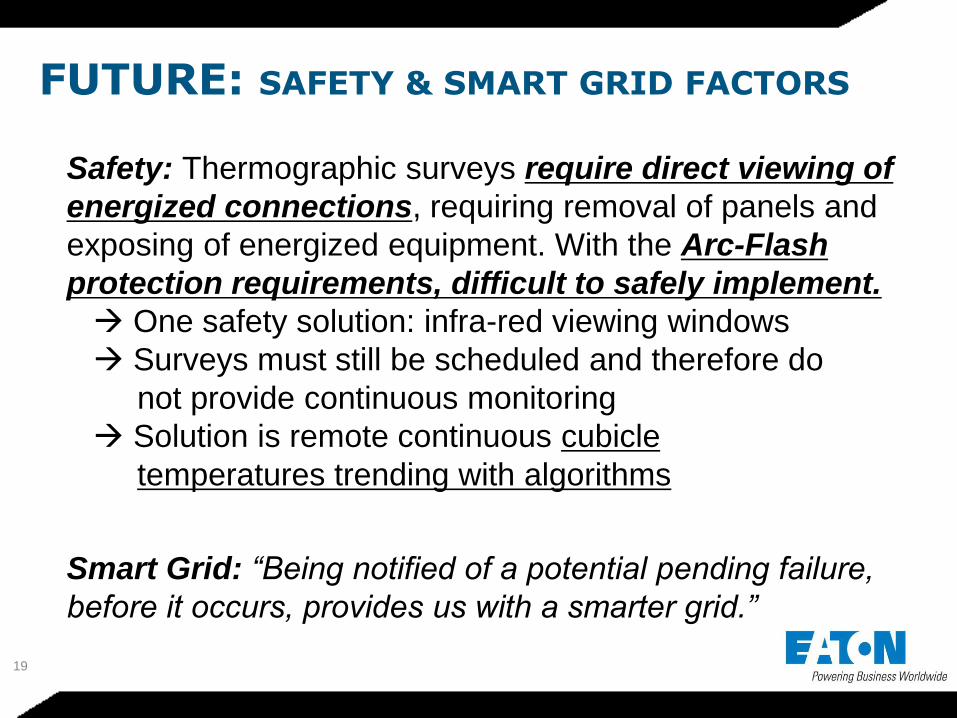
FUTURE: SAFETY & SMART GRID FACTORS
Smart Grid: “Being notified of a potential pending failure,
before it occurs, provides us with a smarter grid.”
Safety: Thermographic surveys require direct viewing of
energized connections, requiring removal of panels and
exposing of energized equipment. With the Arc-Flash
protection requirements, difficult to safely implement.
One safety solution: infra-red viewing windows
Surveys must still be scheduled and therefore do
not provide continuous monitoring
Solution is remote continuous cubicle
temperatures trending with algorithms
20
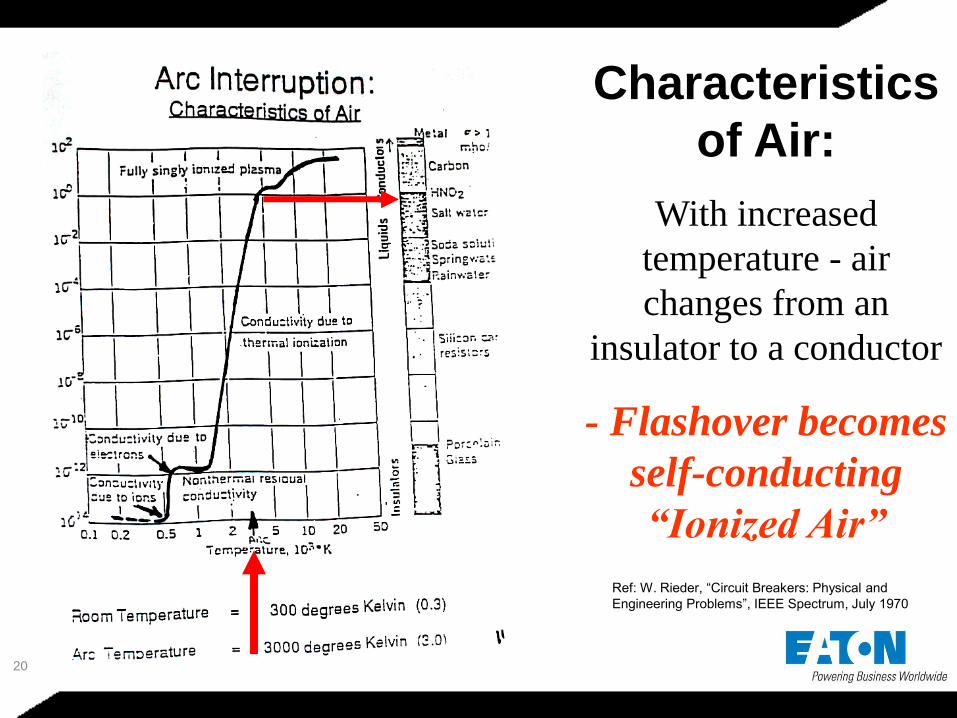
Characteristics
of Air:
With increased
temperature - air
changes from an
insulator to a conductor
- Flashover becomes
self-conducting
“Ionized Air”
Ref: W. Rieder, “Circuit Breakers: Physical and
Engineering Problems”, IEEE Spectrum, July 1970
21
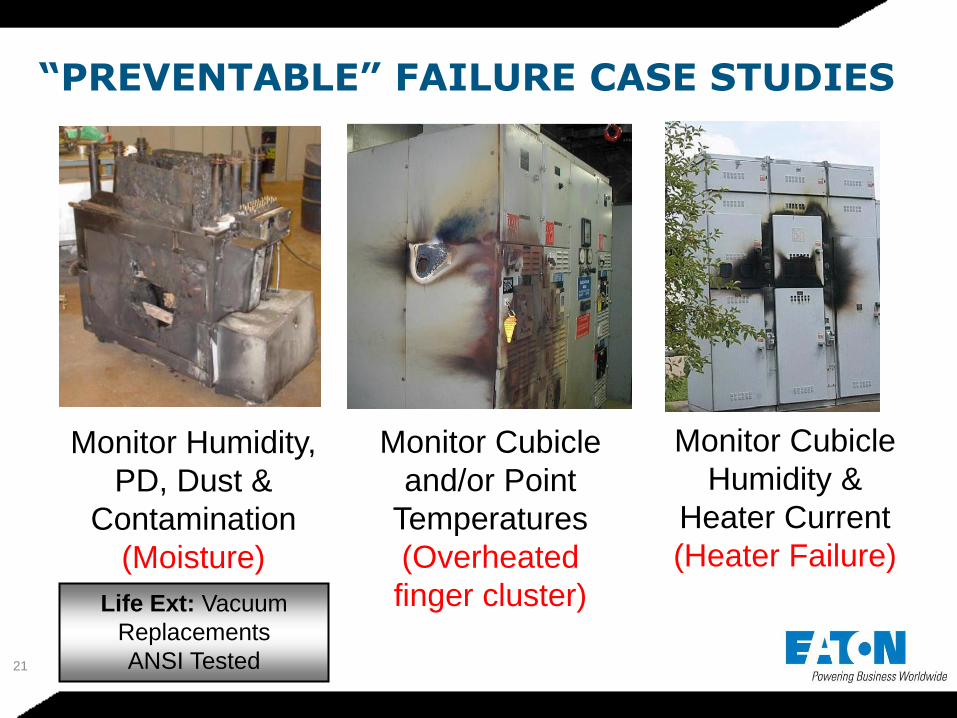
“PREVENTABLE” FAILURE CASE STUDIES
Monitor Humidity,
PD, Dust &
Contamination
(Moisture)
Monitor Cubicle
and/or Point
Temperatures
(Overheated
finger cluster)
Monitor Cubicle
Humidity &
Heater Current
(Heater Failure)
Life Ext: Vacuum
Replacements
ANSI Tested
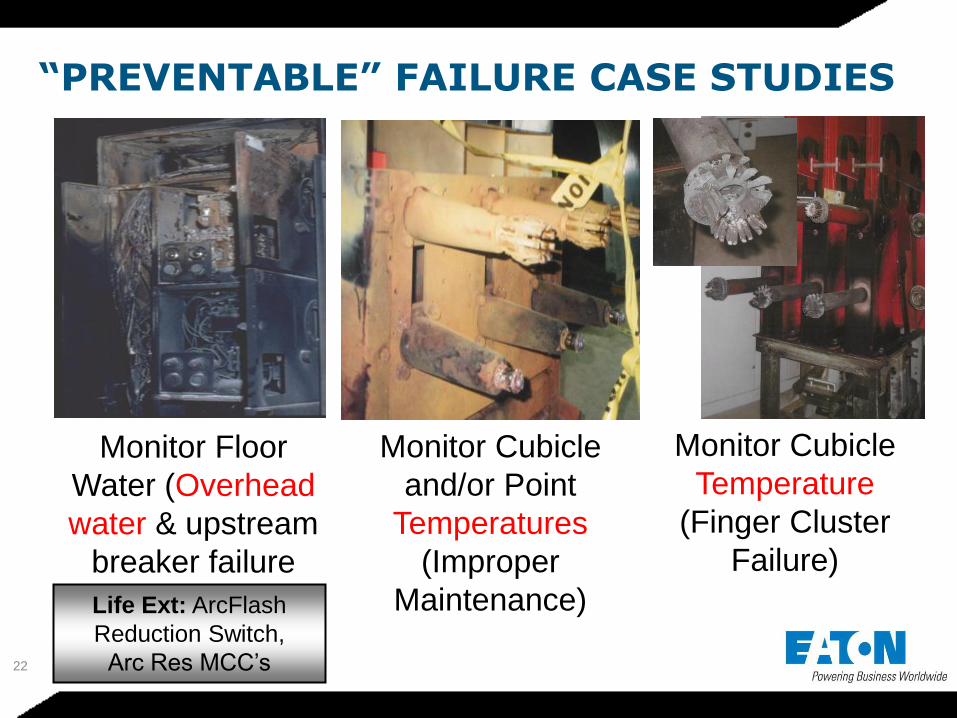
22
Monitor Floor
Water (Overhead
water & upstream
breaker failure
Monitor Cubicle
and/or Point
Temperatures
(Improper
Maintenance)
Monitor Cubicle
Temperature
(Finger Cluster
Failure)
Life Ext: ArcFlash
Reduction Switch,
Arc Res MCC’s
“PREVENTABLE” FAILURE CASE STUDIES
23
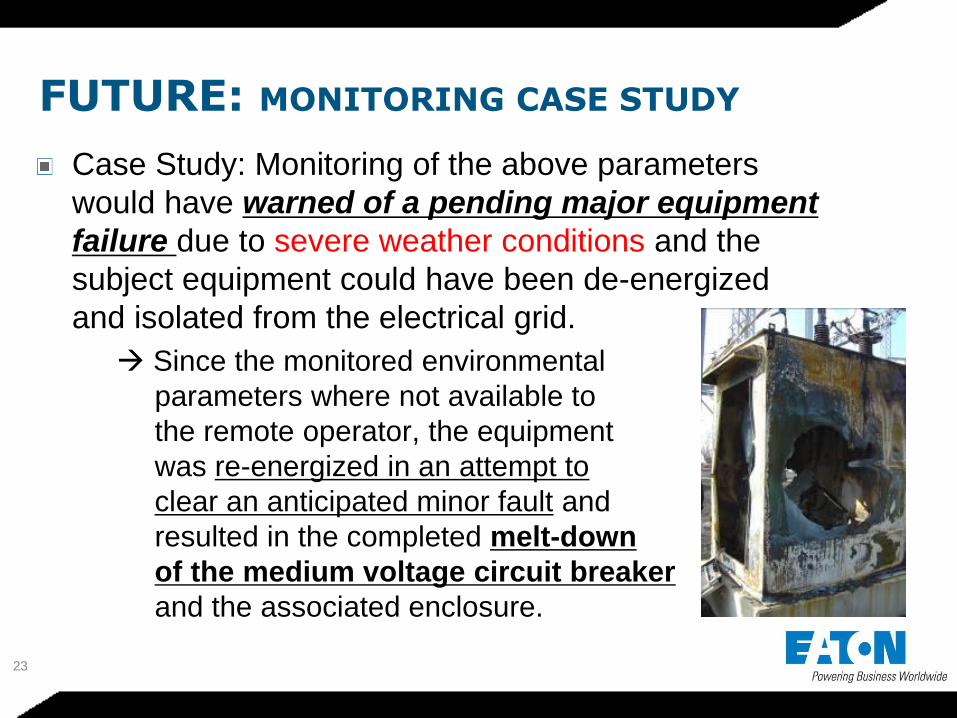
Case Study: Monitoring of the above parameters
would have warned of a pending major equipment
failure due to severe weather conditions and the
subject equipment could have been de-energized
and isolated from the electrical grid.
Since the monitored environmental
parameters where not available to
the remote operator, the equipment
was re-energized in an attempt to
clear an anticipated minor fault and
resulted in the completed melt-down
of the medium voltage circuit breaker
and the associated enclosure.
FUTURE: MONITORING CASE STUDY
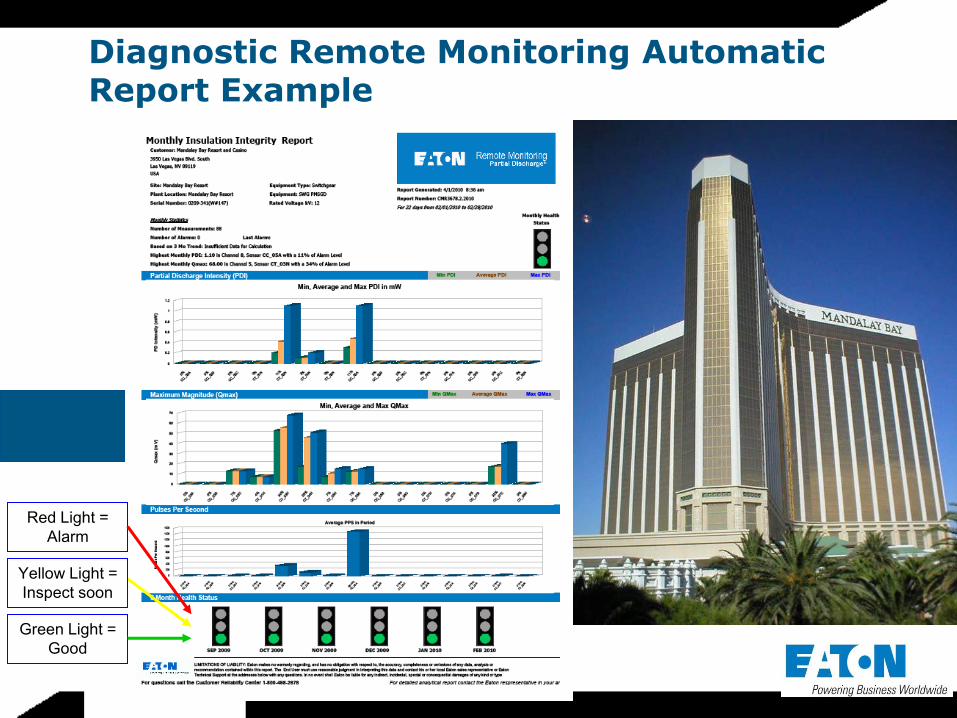
Diagnostic Remote Monitoring Automatic Report Example
Yellow Light =
Inspect soon
Red Light =
Alarm
Green Light =
Good
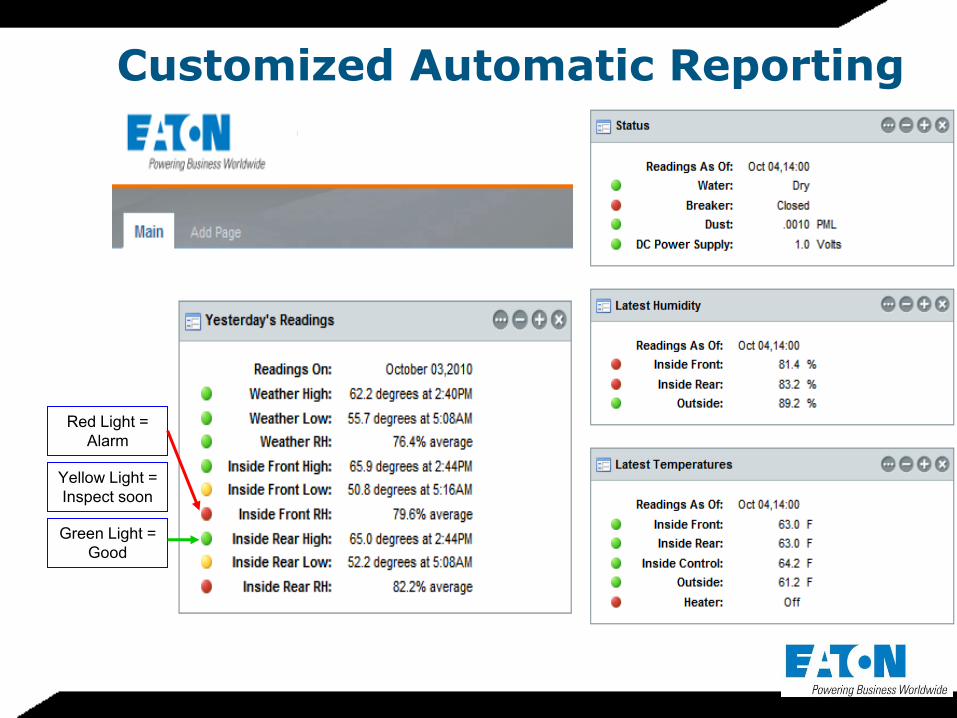
Customized Automatic Reporting
Yellow Light =
Inspect soon
Red Light =
Alarm
Green Light =
Good
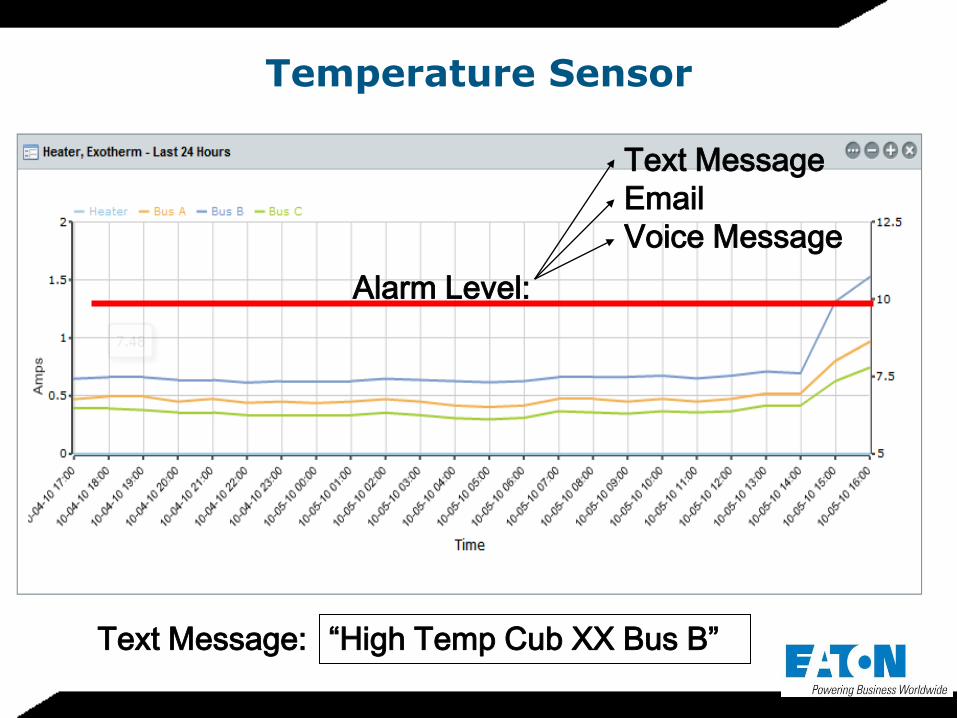
Temperature Sensor
Alarm Level:
Text Message
Voice Message
Text Message: “High Temp Cub XX Bus B”
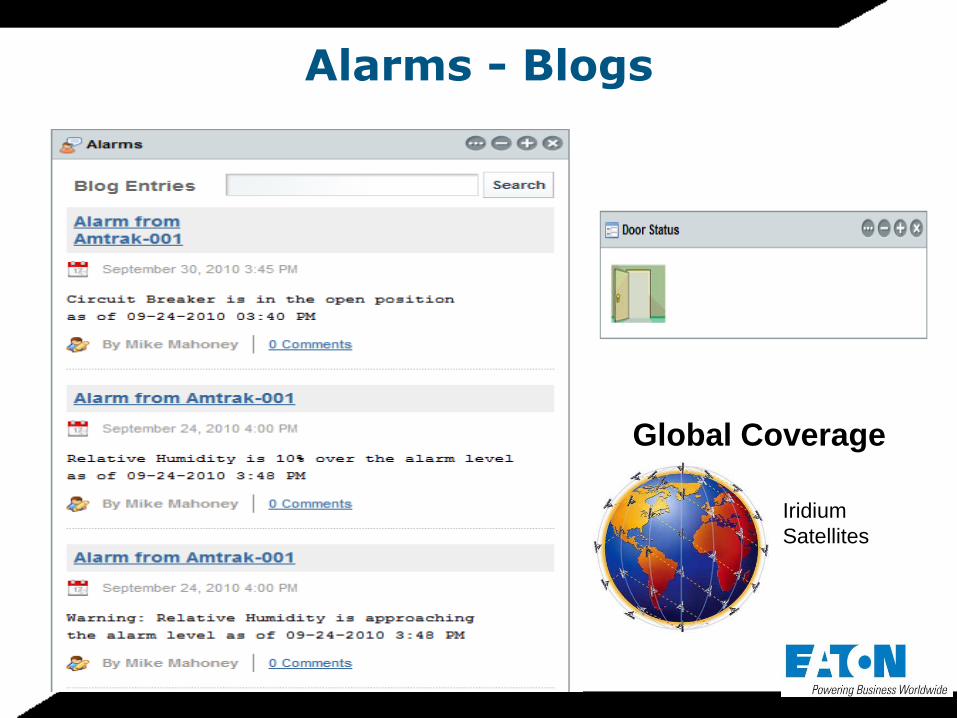
Alarms - Blogs
Global Coverage
Iridium
Satellites
28
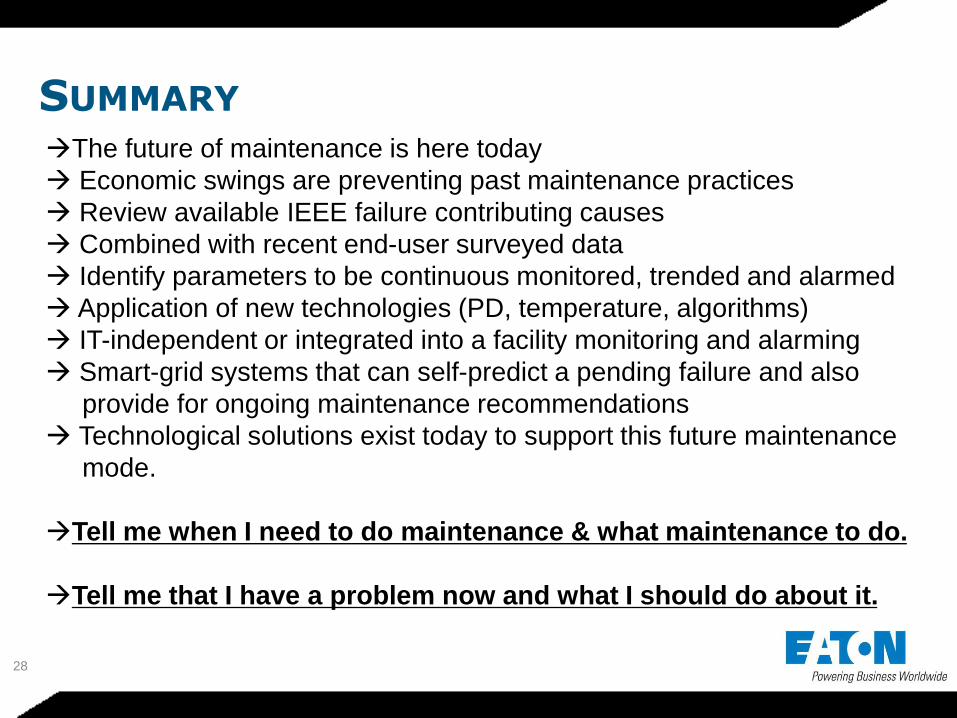
SUMMARY The future of maintenance is here today
Economic swings are preventing past maintenance practices
Review available IEEE failure contributing causes
Combined with recent end-user surveyed data
Identify parameters to be continuous monitored, trended and alarmed
Application of new technologies (PD, temperature, algorithms)
IT-independent or integrated into a facility monitoring and alarming
Smart-grid systems that can self-predict a pending failure and also
provide for ongoing maintenance recommendations
Technological solutions exist today to support this future maintenance
mode.
Tell me when I need to do maintenance & what maintenance to do.
Tell me that I have a problem now and what I should do about it.
Past, Present and Future Maintenance Practices: Monitoring of Electrical Equipment Failure Indicators and Alarming
Author: Gabe Paoletti, P.E. Eaton Corporation Senior Member, IEEE [email protected] Cell # 609-970-0338
Questions?


![[sscpot.com] Paramount maths practice.pdf](https://img.pdfslide.us/doc/110x75/56d6bdb81a28ab30168f116c/sscpotcom-paramount-maths-practicepdf.jpg)