Embed Size (px)
Citation preview
© Yann Arthus-Bertrand / Altitude
Past, current and projected changes of
global GHG emissions and concentrations
Corinne Le Quéré, University of East Anglia
lead author, WGI Chapter 6
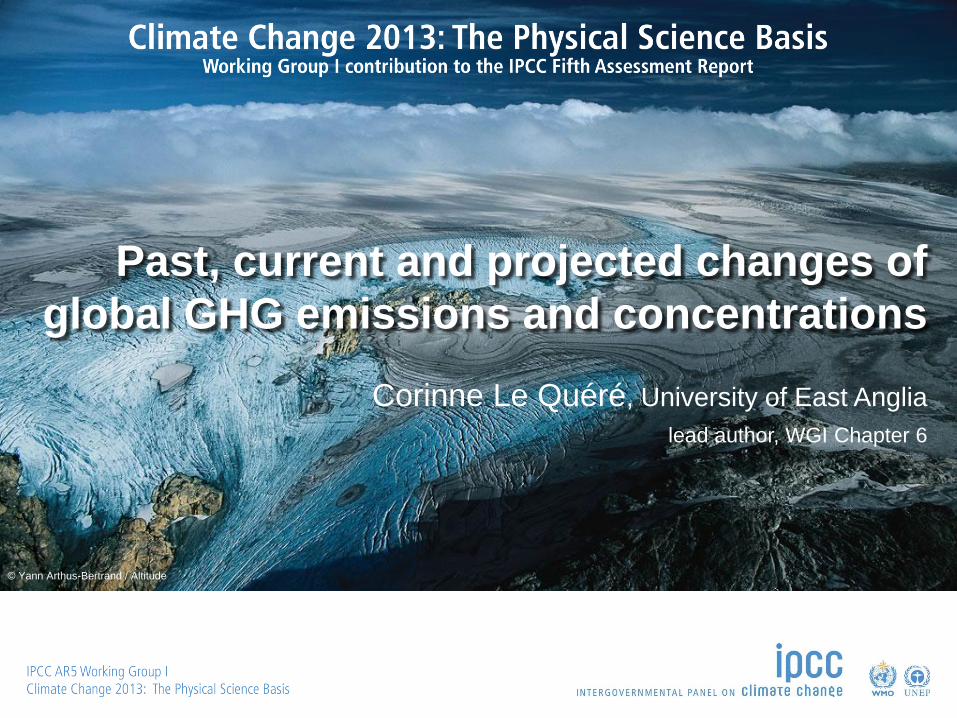
Change in greenhouse gas concentrations
CO2 278 ppm 390.5 ppm (+40%)
CH4 722 ppb 1803 ppb (+150%)
N2O 271 ppb 324.2 ppb (+20%)
1750
The largest contribution to total radiative forcing since 1750 is from CO2
The increase in CO2 is responsible for most of the increase in radiative
forcing since AR4
2011
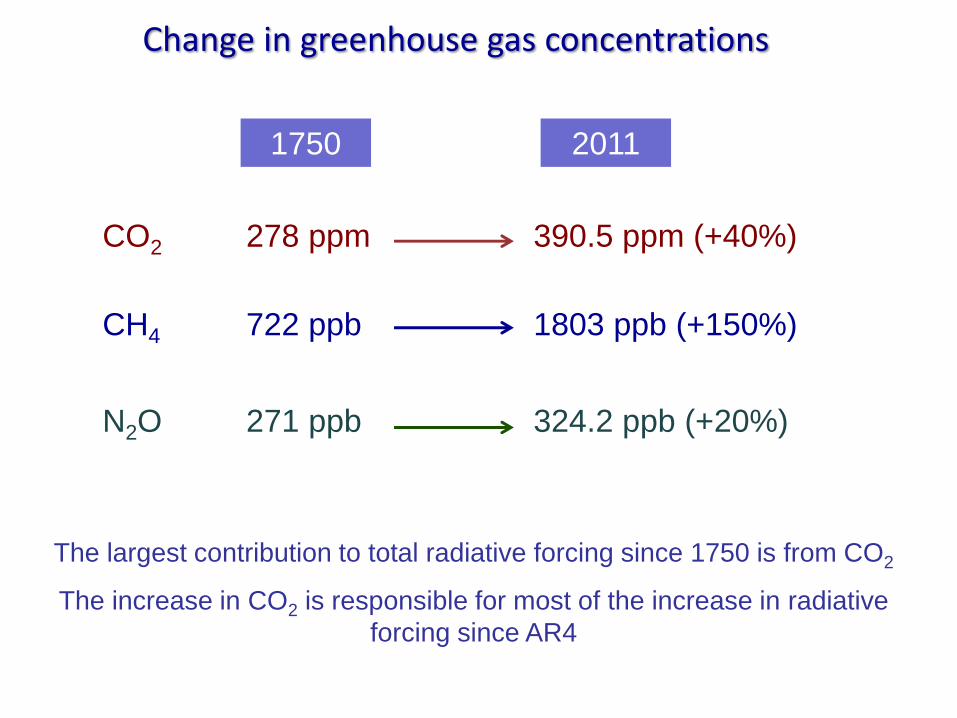
land-use change uncertainty of ±0.8
emissions
CO
2 flu
x (
GtC
y-1
)
year
1750 1800 1850 1900 1950 2000
10
5
0
5
10
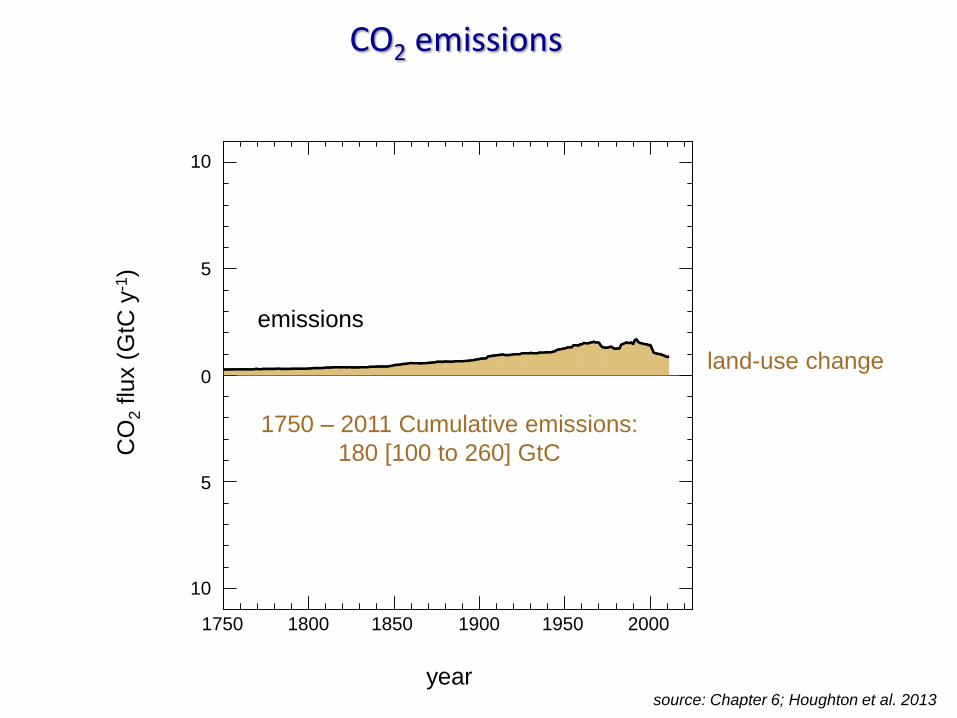
CO2 emissions
source: Chapter 6; Houghton et al. Biogeosciences 2013
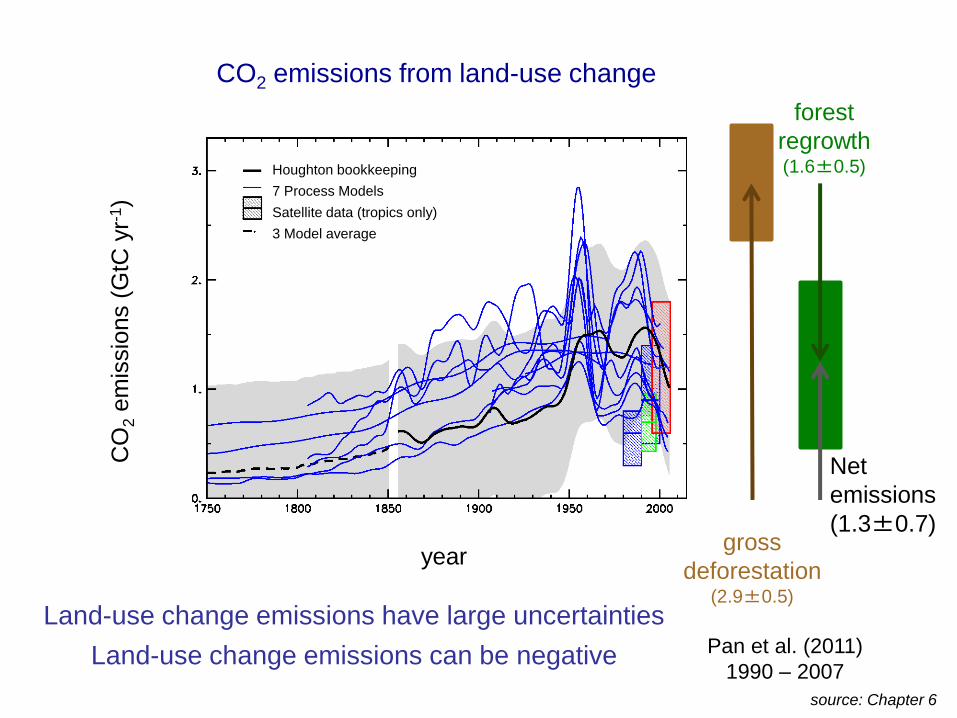
Houghton bookkeeping
7 Process Models
Satellite data (tropics only)
3 Model average
CO2 emissions from land-use change
CO
2 e
mis
sio
ns (
GtC
yr-
1)
year
forest
regrowth (1.6±0.5)
gross
deforestation (2.9±0.5)
Pan et al. (2011)
1990 – 2007
Net
emissions
(1.3±0.7)
source: Chapter 6
Land-use change emissions have large uncertainties
Land-use change emissions can be negative
emissions
CO
2 flu
x (
GtC
y-1
)
year
1750 1800 1850 1900 1950 2000
10
5
0
5
10
source: Chapter 6; Houghton et al. 2013
land-use change
CO2 emissions
1750 – 2011 Cumulative emissions:
180 [100 to 260] GtC
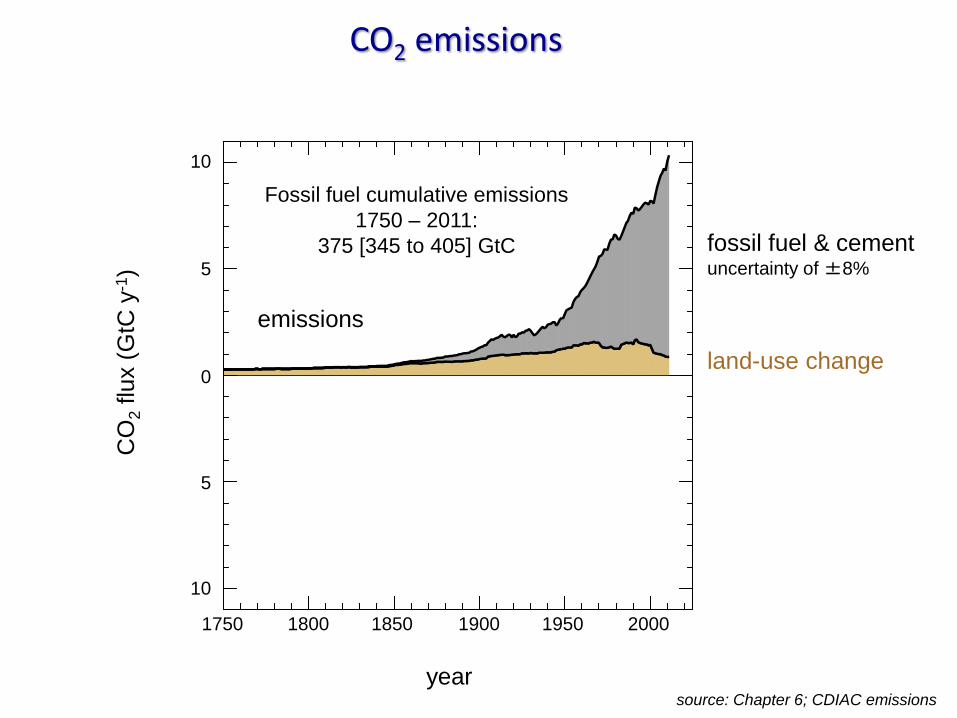
fossil fuel & cement uncertainty of ±8%
land-use change
emissions
CO
2 flu
x (
GtC
y-1
)
year
1750 1800 1850 1900 1950 2000
10
5
0
5
10
source: Chapter 6; CDIAC emissions
Fossil fuel cumulative emissions
1750 – 2011:
375 [345 to 405] GtC
CO2 emissions
source: Chapter 6; CDIAC emissions
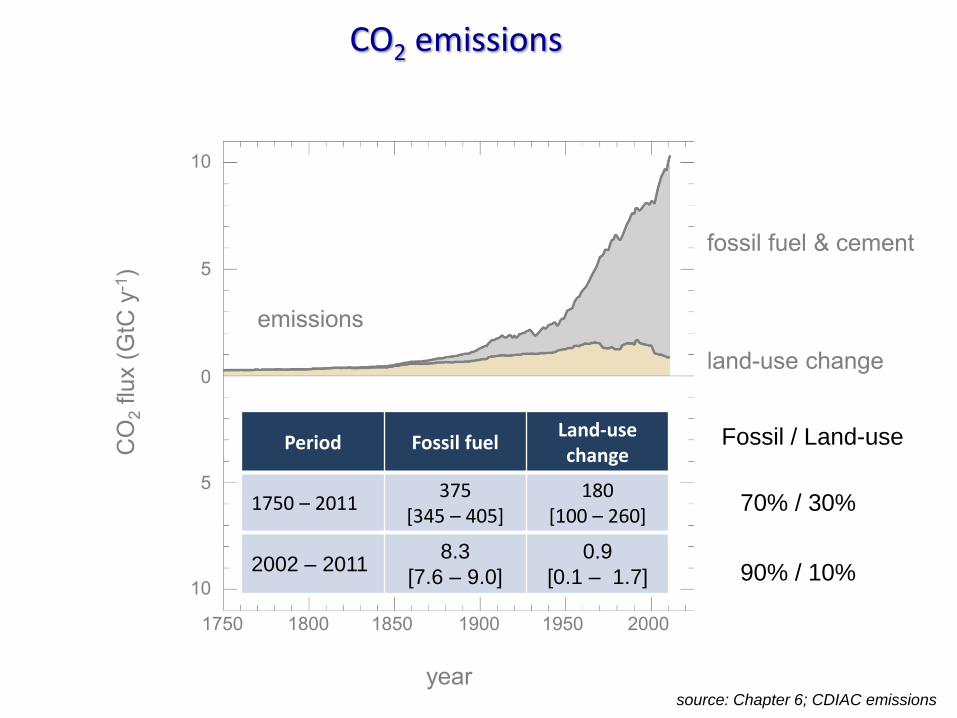
Period Fossil fuel Land-use change
1750 – 2011 375
[345 – 405] 180
[100 – 260]
2002 – 2011 8.3
[7.6 – 9.0]
0.9
[0.1 – 1.7]
CO2 emissions
70% / 30%
90% / 10%
Fossil / Land-use
source: IPCC AR5
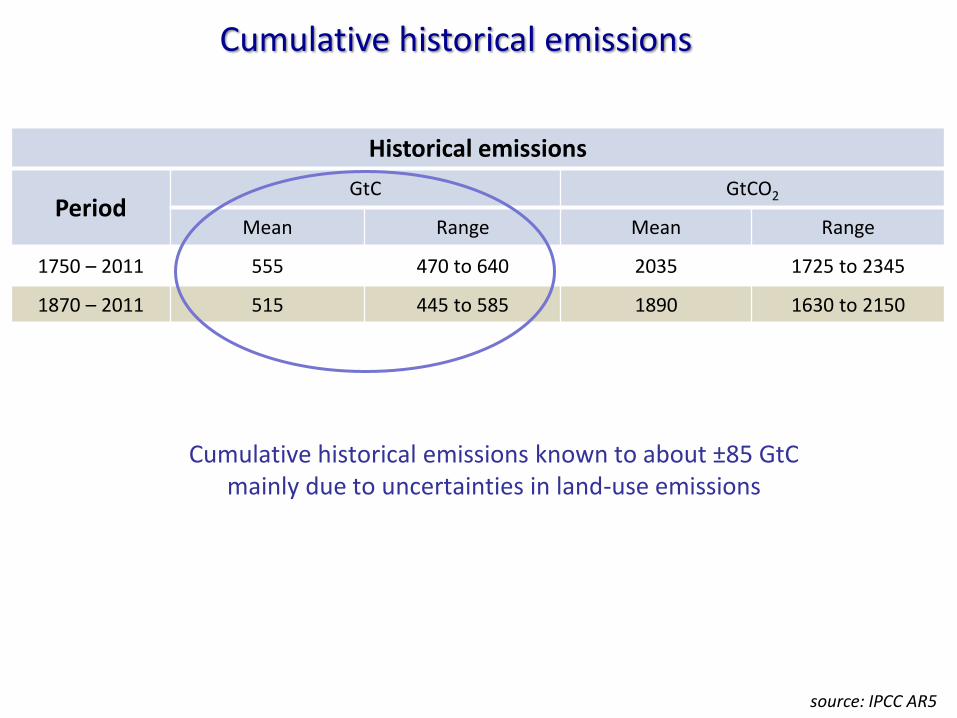
Historical emissions
Period GtC GtCO2
Mean Range Mean Range
1750 – 2011 555 470 to 640 2035 1725 to 2345
1870 – 2011 515 445 to 585 1890 1630 to 2150
Cumulative historical emissions
Cumulative historical emissions known to about ±85 GtC mainly due to uncertainties in land-use emissions
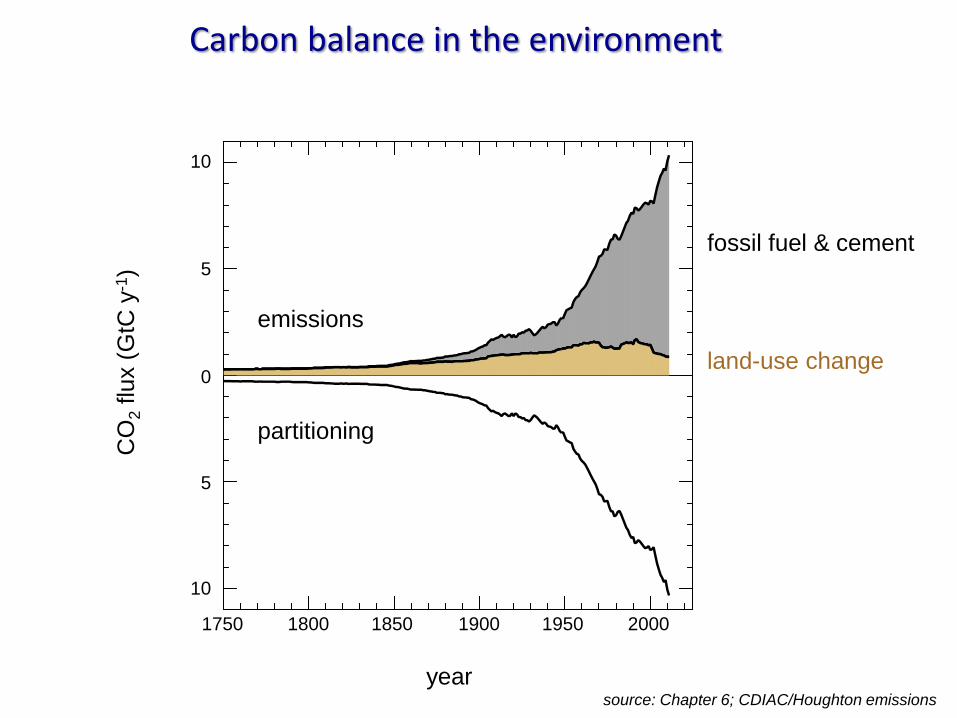
fossil fuel & cement
land-use change
emissions
partitioning
CO
2 flu
x (
GtC
y-1
)
year
1750 1800 1850 1900 1950 2000
10
5
0
5
10
Carbon balance in the environment
source: Chapter 6; CDIAC/Houghton emissions
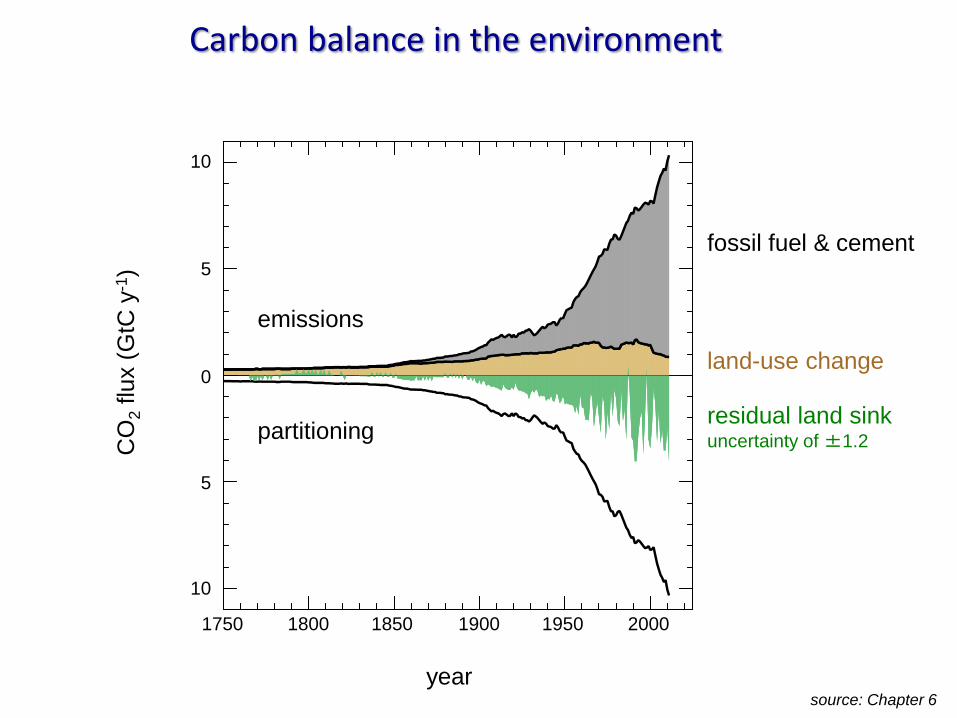
fossil fuel & cement
land-use change
residual land sink uncertainty of ±1.2
emissions
partitioning
CO
2 flu
x (
GtC
y-1
)
year
1750 1800 1850 1900 1950 2000
10
5
0
5
10
Carbon balance in the environment
source: Chapter 6
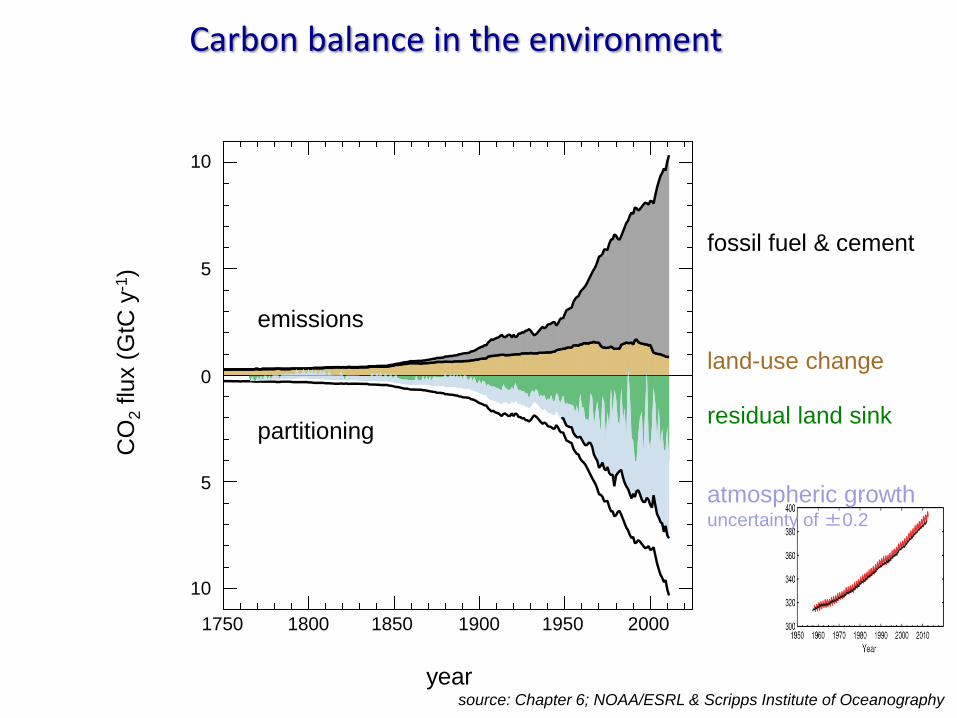
fossil fuel & cement
land-use change
residual land sink
atmospheric growth uncertainty of ±0.2
emissions
partitioning
CO
2 flu
x (
GtC
y-1
)
year
1750 1800 1850 1900 1950 2000
10
5
0
5
10
Carbon balance in the environment
source: Chapter 6; NOAA/ESRL & Scripps Institute of Oceanography
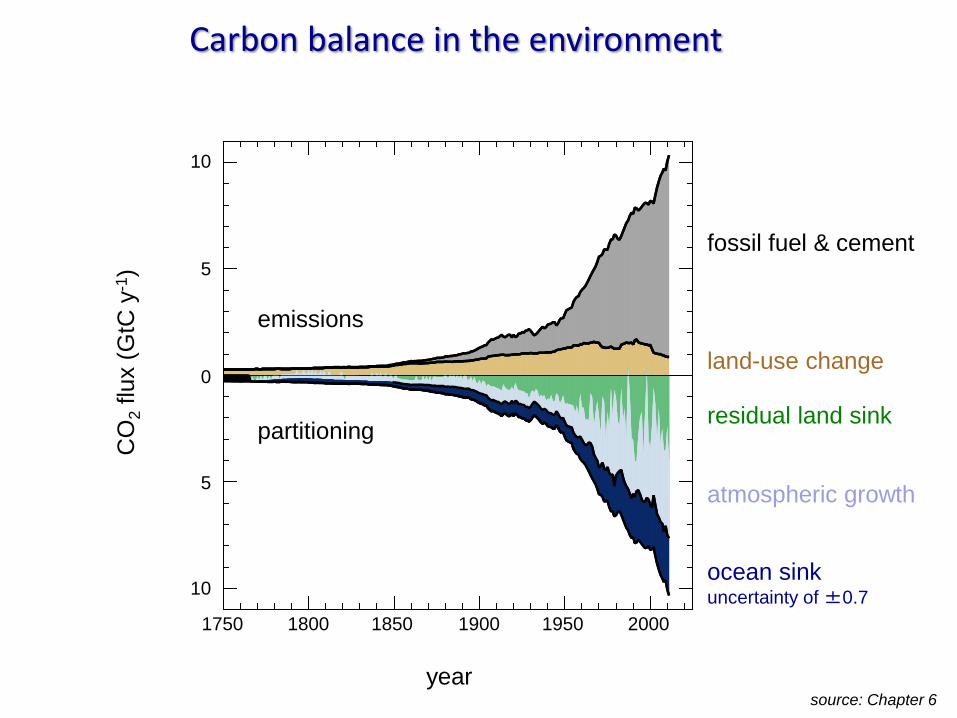
fossil fuel & cement
land-use change
residual land sink
atmospheric growth
ocean sink uncertainty of ±0.7
emissions
partitioning
CO
2 flu
x (
GtC
y-1
)
year
1750 1800 1850 1900 1950 2000
10
5
0
5
10
Carbon balance in the environment
source: Chapter 6
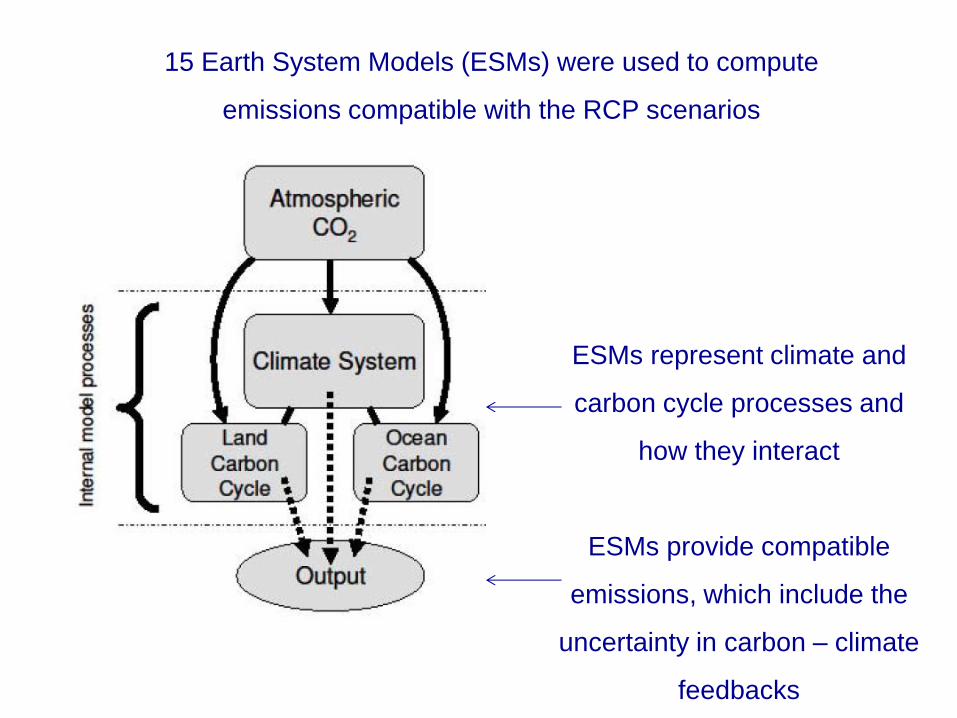
15 Earth System Models (ESMs) were used to compute
emissions compatible with the RCP scenarios
ESMs represent climate and
carbon cycle processes and
how they interact
ESMs provide compatible
emissions, which include the
uncertainty in carbon – climate
feedbacks
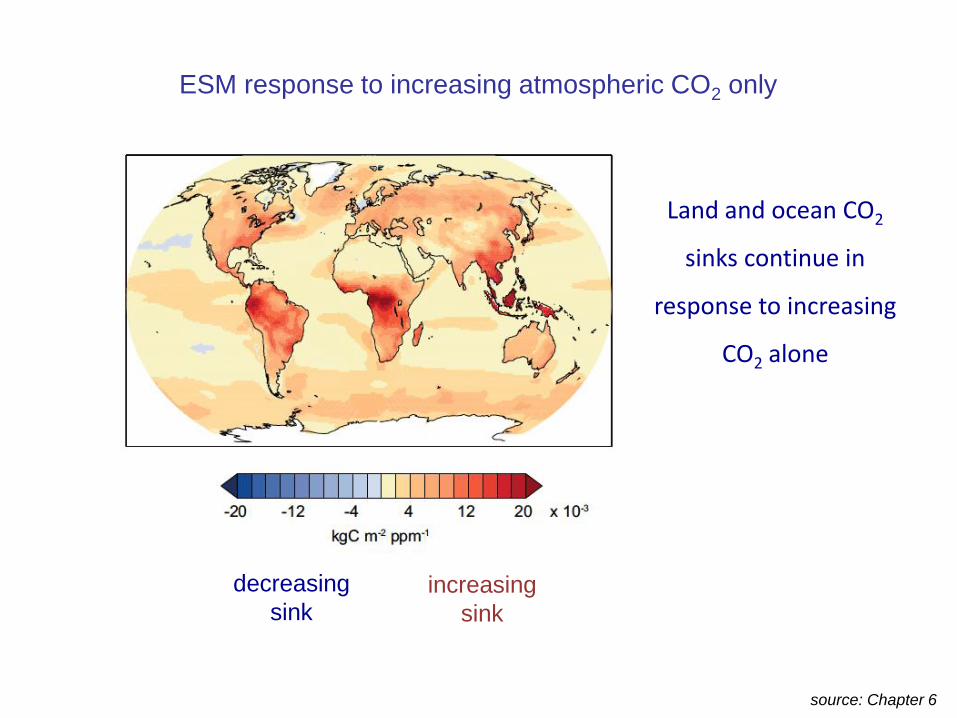
ESM response to increasing atmospheric CO2 only
increasing
sink
decreasing
sink
source: Chapter 6
Land and ocean CO2
sinks continue in
response to increasing
CO2 alone
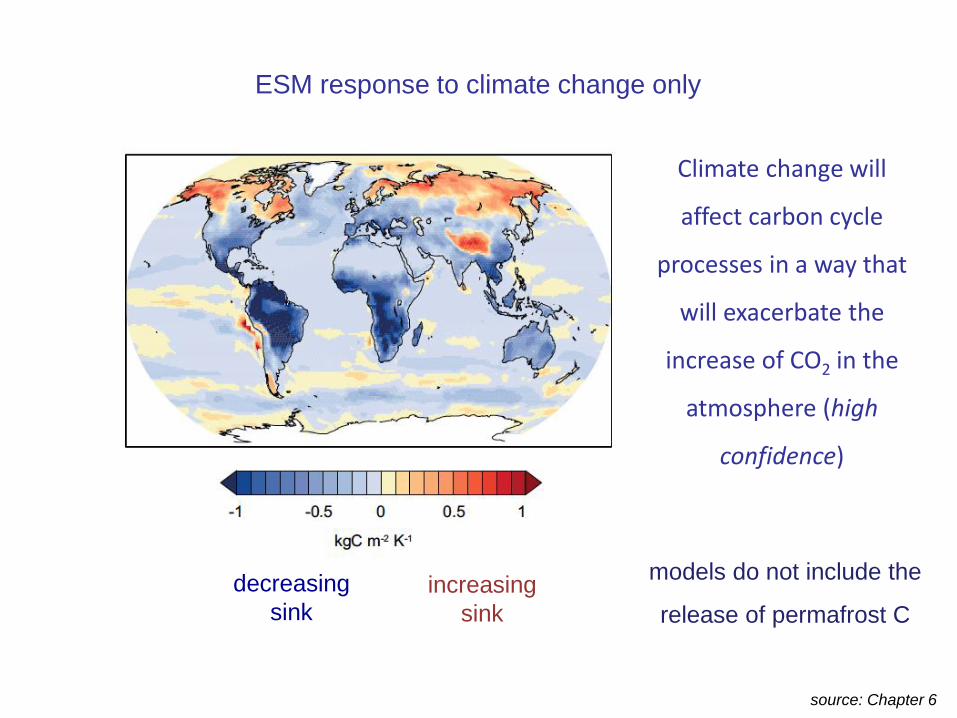
ESM response to climate change only
increasing
sink
decreasing
sink
models do not include the
release of permafrost C
Climate change will
affect carbon cycle
processes in a way that
will exacerbate the
increase of CO2 in the
atmosphere (high
confidence)
source: Chapter 6
source: Chapter 6
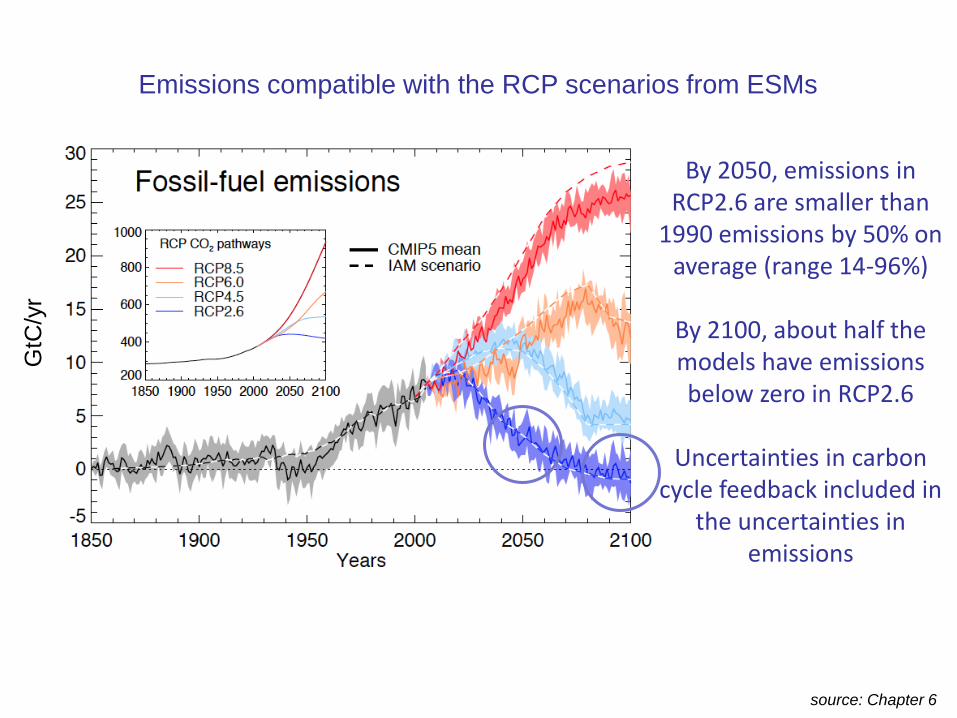
Emissions compatible with the RCP scenarios from ESMs
By 2050, emissions in RCP2.6 are smaller than
1990 emissions by 50% on average (range 14-96%)
By 2100, about half the models have emissions below zero in RCP2.6
Uncertainties in carbon
cycle feedback included in the uncertainties in
emissions
GtC
/yr
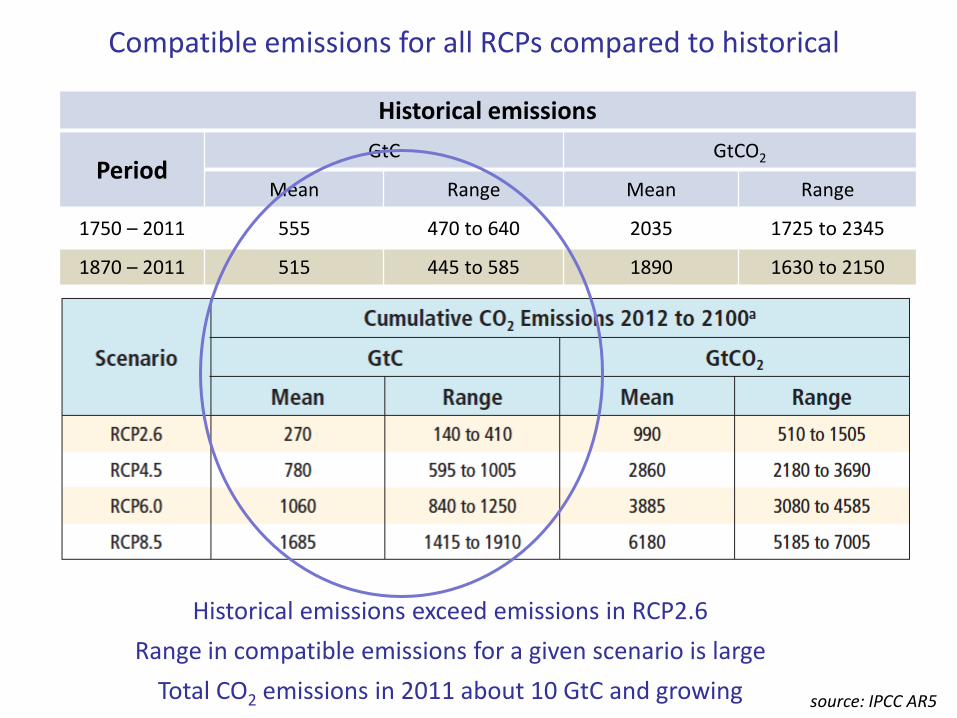
Compatible emissions for all RCPs compared to historical
source: IPCC AR5
Historical emissions
Period GtC GtCO2
Mean Range Mean Range
1750 – 2011 555 470 to 640 2035 1725 to 2345
1870 – 2011 515 445 to 585 1890 1630 to 2150
Historical emissions exceed emissions in RCP2.6
Range in compatible emissions for a given scenario is large
Total CO2 emissions in 2011 about 10 GtC and growing
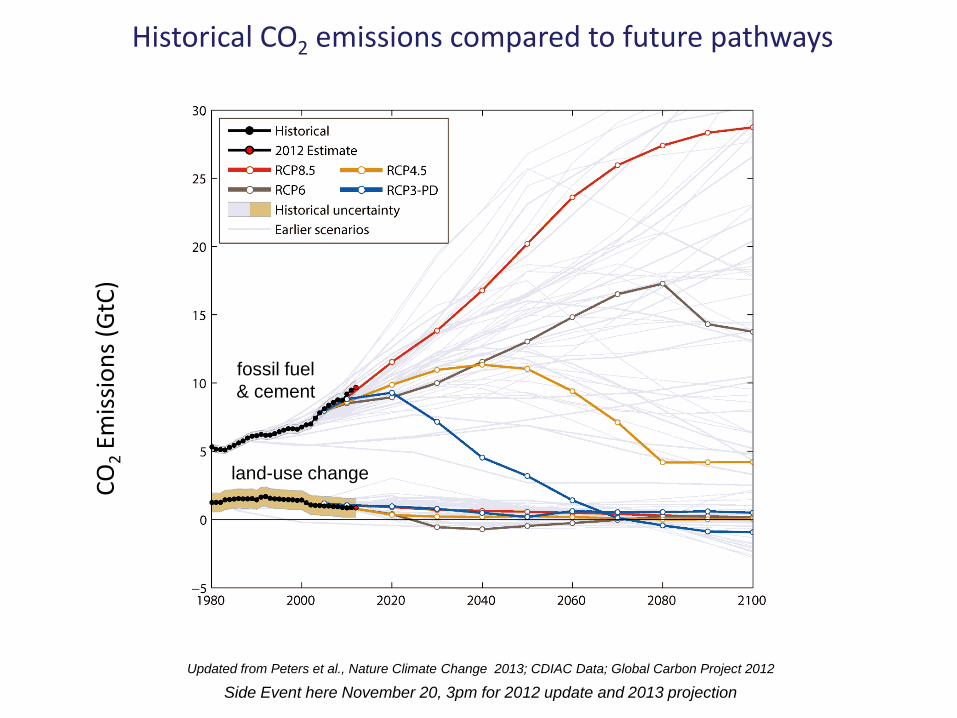
CO
2 E
mis
sio
ns
(GtC
)
Updated from Peters et al., Nature Climate Change 2013; CDIAC Data; Global Carbon Project 2012
Side Event here November 20, 3pm for 2012 update and 2013 projection
Historical CO2 emissions compared to future pathways
fossil fuel
& cement
land-use change
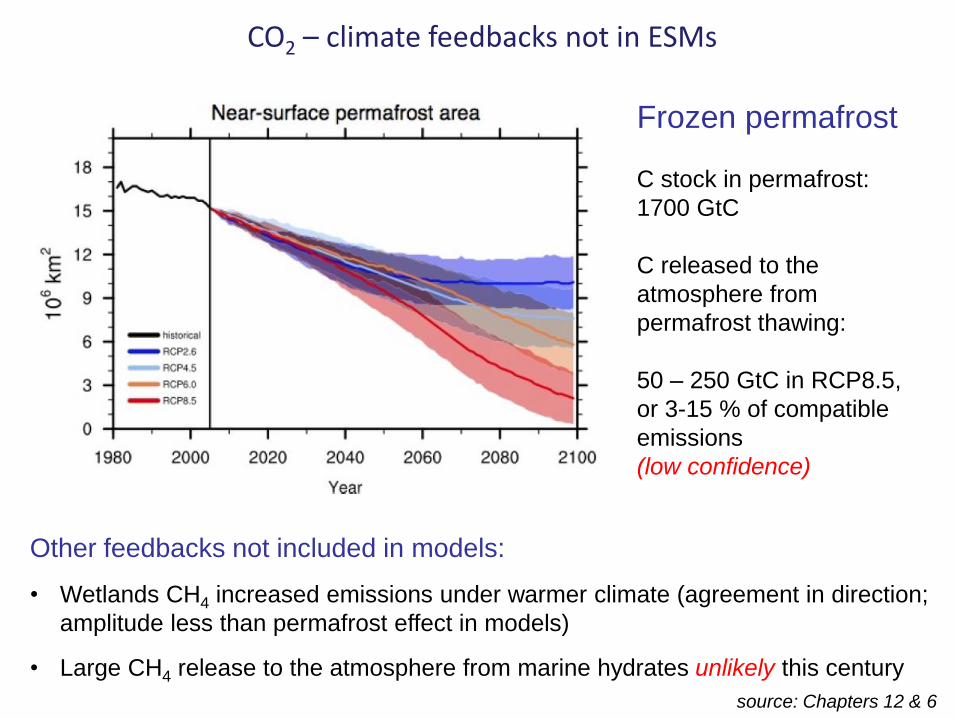
Frozen permafrost
C stock in permafrost:
1700 GtC
C released to the
atmosphere from
permafrost thawing:
50 – 250 GtC in RCP8.5,
or 3-15 % of compatible
emissions
(low confidence)
source: Chapters 12 & 6
CO2 – climate feedbacks not in ESMs
Other feedbacks not included in models:
• Wetlands CH4 increased emissions under warmer climate (agreement in direction;
amplitude less than permafrost effect in models)
• Large CH4 release to the atmosphere from marine hydrates unlikely this century
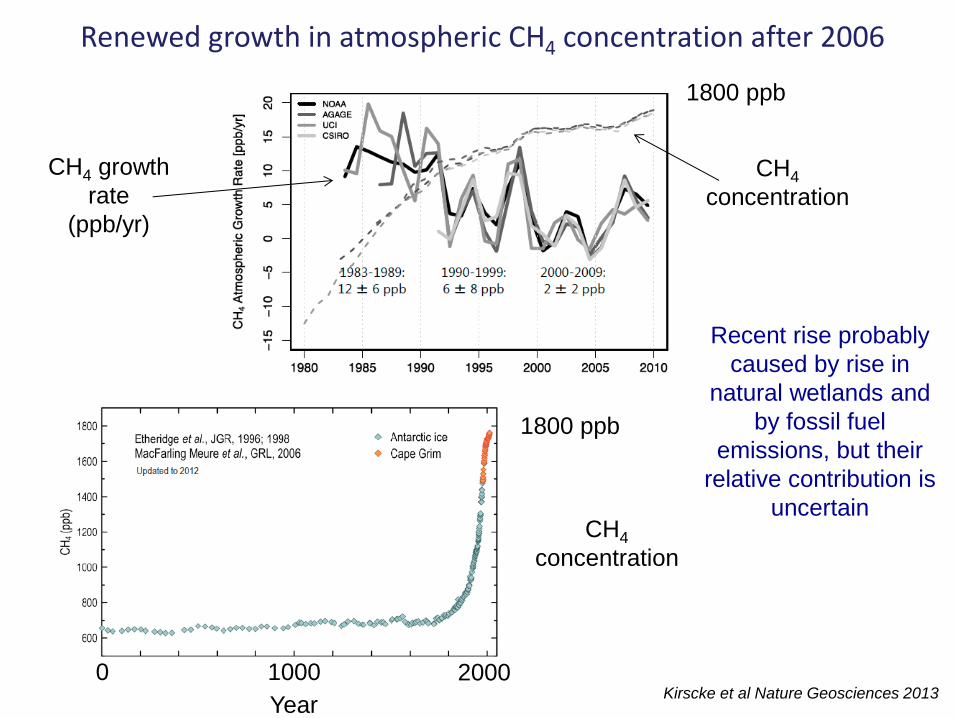
Kirscke et al Nature Geosciences 2013
Renewed growth in atmospheric CH4 concentration after 2006
1800 ppb
CH4
concentration
CH4 growth
rate
(ppb/yr)
1800 ppb
CH4
concentration
0 1000 2000
Year
Recent rise probably
caused by rise in
natural wetlands and
by fossil fuel
emissions, but their
relative contribution is
uncertain
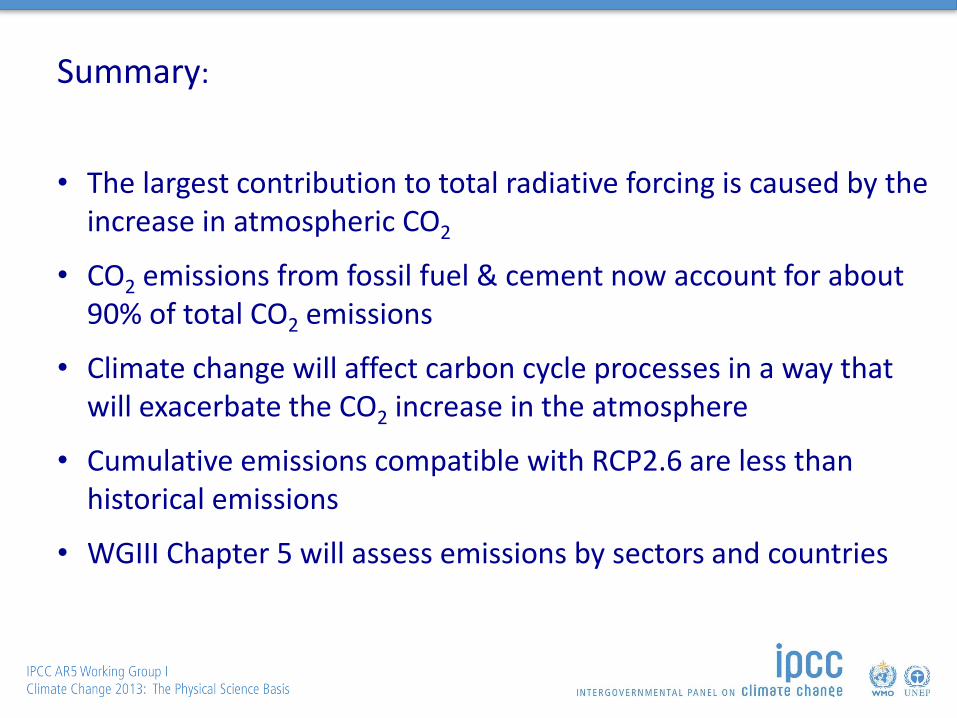
Summary:
• The largest contribution to total radiative forcing is caused by the increase in atmospheric CO2
• CO2 emissions from fossil fuel & cement now account for about 90% of total CO2 emissions
• Climate change will affect carbon cycle processes in a way that will exacerbate the CO2 increase in the atmosphere
• Cumulative emissions compatible with RCP2.6 are less than historical emissions
• WGIII Chapter 5 will assess emissions by sectors and countries
© Yann Arthus-Bertrand / Altitude
www.climatechange2013.org Further Information


![Past, current and projected changes of global GHG emissions and … · 2020. 3. 17. · 180 [100 to 260] GtC . fossil fuel & cement uncertainty of ±8% land-use change emissions CO](https://img.pdfslide.us/doc/110x75/61230b59e9b34120e62f31d3/past-current-and-projected-changes-of-global-ghg-emissions-and-2020-3-17-180.jpg)