Embed Size (px)
Citation preview

IntroductionMeasurementPassthrough
Partial Adjustment
Passthrough from the Secondary to the PrimaryMortgage MarketFrom TBA to YSP
Paul Willen, Federal Reserve Bank of Boston and NBER-
With Andreas Fuster (FRB NY) and Stephanie Lo (Harvard and FRB Boston)
Weimer School, Homer Hoyt InstituteJanuary 18, 2015
Willen (Boston Fed) From TBA to YSP January 18, 2015 1 / 40

IntroductionMeasurementPassthrough
Partial Adjustment
Disclaimer
I am speaking today as a researcher and as a concerned citizen
not as a representative of:
The Boston Fedor the Federal Reserve System
When I say “we”, I don’t mean Janet and me.
Willen (Boston Fed) From TBA to YSP January 18, 2015 2 / 40

IntroductionMeasurementPassthrough
Partial Adjustment
Caveat
This is still very preliminary work
Everything I’m about to say could be wrong:
No one who cannot rejoice in the discovery of hisown mistakes deserves to be called a scholar.
–Donald Foster
Willen (Boston Fed) From TBA to YSP January 18, 2015 3 / 40

IntroductionMeasurementPassthrough
Partial Adjustment
The passthrough problemEconomics of mortgage lendingHow do lenders set prices?This Paper
The passthrough problem
Over the last month,interest rates have comedown.
Two related questions:
What happens toprimary mortgagemarket rates?What happens to lenderprofits?
Do lenders pass on lowrates to borrowers?
Or do they just makemoney on the spread?
12/22 12/29 01/05 01/12
1.6
1.8
2.0
2.2
2.4
2.6
2.8
3.0
3.2
3.4
3.6
3.8
4.0
rate
in%
10-yr Rate↗
Yield on FNMA 3.5↗
WSJ 30-yr FRM Rate↗
Willen (Boston Fed) From TBA to YSP January 18, 2015 4 / 40

IntroductionMeasurementPassthrough
Partial Adjustment
The passthrough problemEconomics of mortgage lendingHow do lenders set prices?This Paper
Why do we care?
Over the last five years,
Mortgage rates have beenthe central instrument ofmonetary policy
Fed has purchased $2trillion dollars of MBS
With the explicit goal ofdriving down rates
Have we just increaseprofits for lenders? 2009 2010 2011 2012 2013 2014
0.0
0.5
1.0
1.5
2.0
intrillionof$
↖SOMA MBS Portfolio
Willen (Boston Fed) From TBA to YSP January 18, 2015 5 / 40

IntroductionMeasurementPassthrough
Partial Adjustment
The passthrough problemEconomics of mortgage lendingHow do lenders set prices?This Paper
Some people think it hasn’t worked
From “Banks reap profits on mortgages after QE3,” Financial Times,October 1, 2012.
“For banks which are mortgage originators this [QE3] was some of the best newsthey could possibly have heard, said Steven Abrahams, mortgage strategist atDeutsche. They will continue originating loans and selling them into the marketat a significant premium.”
“The interest banks pay on mortgage bonds has dropped from 2.36 per cent onSeptember 12, the day before the Fed announced its programme, to as low as1.65 per cent last week. It edged up to 1.85 per cent on Monday.”
“That means the profit, or spread, banks earn from creating new mortgages forhomeowners paying around 3.4 per cent and selling the loans into the secondarymarket has risen to around 1.6 per cent. That is higher than the 1.44 per centspread they pocketed before QE3 and significantly greater than the 0.5 per centthey earned on average in the decade between 2000 and 2010.”
Willen (Boston Fed) From TBA to YSP January 18, 2015 6 / 40

IntroductionMeasurementPassthrough
Partial Adjustment
The passthrough problemEconomics of mortgage lendingHow do lenders set prices?This Paper
Is this right
Profits on a loan are not the one-period spread.
Present discounted value of all expected spreads
How can we value that?
Model of prepayment and defaultAssumptions about how interest rates affect that model
Very hard to do – a lot of assumptions...
But there is a simple way:
Lenders make money by selling loans
Market value of future revenues (mortgage payments)Market value of future costs (payments to bond holders)
In this paper, we use a new dataset that allows us to measureboth of those directly.
Willen (Boston Fed) From TBA to YSP January 18, 2015 7 / 40

IntroductionMeasurementPassthrough
Partial Adjustment
The passthrough problemEconomics of mortgage lendingHow do lenders set prices?This Paper
Findings
“Partial adjustmentmodel”
Compute equilibriumprimary market priceevery dayPrimary market priceadjusts 65% of way toequilibrium every day
Massive variation inequilibrium profits/costsover time.
Refi Index explains 75% ofthe variation in profits.
Capacity very important!
2009 2010 2011 2012 2013
-1.0
-0.5
0.0
0.5
1.0
in%
0
1
2
3
4
5
MBA
Index/1000
↙Estimated Profit
↖MBA Refi Index (12-wk MA)
Controlling for Refi Index
Willen (Boston Fed) From TBA to YSP January 18, 2015 8 / 40

IntroductionMeasurementPassthrough
Partial Adjustment
The passthrough problemEconomics of mortgage lendingHow do lenders set prices?This Paper
Counterfactual: Constant Profits
Assume that lender profitsstayed constant at levelbefore crisis.
Then compute the impliedprimary market price thatwould yield the constantlevel of profit
2009 2010 2011 2012 2013
3.0
3.5
4.0
4.5
5.0
5.5
6.0
6.5
7.0
in%
0
25
50
75
100
in%
↙“Rate101”
Rate101, Constant Profit↗
Difference↘
Willen (Boston Fed) From TBA to YSP January 18, 2015 9 / 40

IntroductionMeasurementPassthrough
Partial Adjustment
The passthrough problemEconomics of mortgage lendingHow do lenders set prices?This Paper
Lender income: The TBA Market
Forward market formortgages
Wells Fargo commits tosell MBS
End of next monthInvestor gets 3.0%couponPlus all principalpayments
WF swaps loans withFNMA for MBS
FNMA guarantees loans
WF delivers MBS for104.69
Willen (Boston Fed) From TBA to YSP January 18, 2015 10 / 40
IntroductionMeasurementPassthrough
Partial Adjustment
The passthrough problemEconomics of mortgage lendingHow do lenders set prices?This Paper
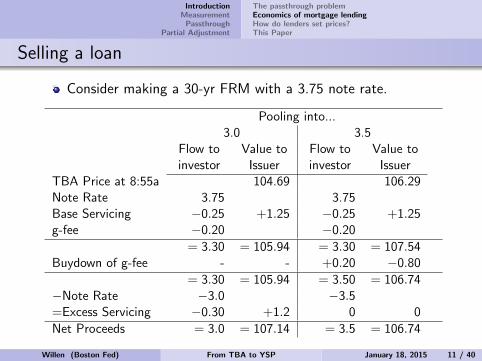
Selling a loan
Consider making a 30-yr FRM with a 3.75 note rate.
Pooling into...3.0 3.5
Flow toinvestor
Value toIssuer
Flow toinvestor
Value toIssuer
TBA Price at 8:55a 104.69 106.29Note Rate 3.75 3.75Base Servicing −0.25 +1.25 −0.25 +1.25g-fee −0.20 −0.20
= 3.30 = 105.94 = 3.30 = 107.54Buydown of g-fee - - +0.20 −0.80
= 3.30 = 105.94 = 3.50 = 106.74−Note Rate −3.0 −3.5=Excess Servicing −0.30 +1.2 0 0
Net Proceeds = 3.0 = 107.14 = 3.5 = 106.74
Willen (Boston Fed) From TBA to YSP January 18, 2015 11 / 40

IntroductionMeasurementPassthrough
Partial Adjustment
The passthrough problemEconomics of mortgage lendingHow do lenders set prices?This Paper
Lender costs: YSP
Loan officer seescombinations
Note RateYSP (or SRP)
Market price of loan= 100 + YSP
Note rate=4.875Investor pays 102.325for 100 dollars ofprincipal
2.325 pays closing costs,commission, etc.
Willen (Boston Fed) From TBA to YSP January 18, 2015 12 / 40
IntroductionMeasurementPassthrough
Partial Adjustment
The passthrough problemEconomics of mortgage lendingHow do lenders set prices?This Paper
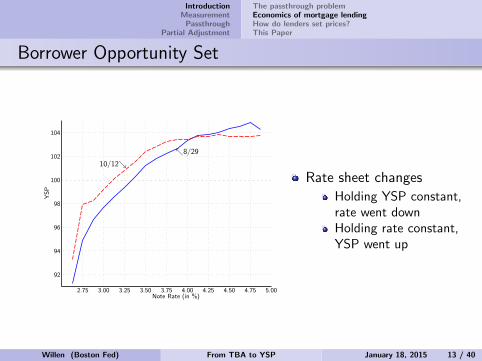
Borrower Opportunity Set
Rate sheet changes
Holding YSP constant,rate went downHolding rate constant,YSP went up
2.75 3.00 3.25 3.50 3.75 4.00 4.25 4.50 4.75 5.00Note Rate (in %)
92
94
96
98
100
102
104
YSP
տ8/29
10/12ց
Willen (Boston Fed) From TBA to YSP January 18, 2015 13 / 40

IntroductionMeasurementPassthrough
Partial Adjustment
The passthrough problemEconomics of mortgage lendingHow do lenders set prices?This Paper
How do lenders set prices?
First ratesheet: between 9-11AM
Reprices if needed
If MBS prices go up, raise YSPs
If MBS prices go down, lower YSPs
“Pipeline control”
When lenders precipitously lower rates by an eighth of a point (especiallywhen moving into the psychologically significant ”high 3’s”), it tends tocreate a lot of lock activity. This can easily become more than thelender can handle in terms of personnel or balance sheet. The solutionfor some lenders is the ”pipeline control” negative reprice to stem theflow of inbound locks.
Willen (Boston Fed) From TBA to YSP January 18, 2015 14 / 40

IntroductionMeasurementPassthrough
Partial Adjustment
The passthrough problemEconomics of mortgage lendingHow do lenders set prices?This Paper
Jobs Friday
Employment reportreleased at 830
Rate sheets reflect initialresponse
Rates went down throughthe day
Lots of positive reprices.
Willen (Boston Fed) From TBA to YSP January 18, 2015 15 / 40

IntroductionMeasurementPassthrough
Partial Adjustment
The passthrough problemEconomics of mortgage lendingHow do lenders set prices?This Paper
Passthrough using yields and rates
Fall in yields on FNMA3.0 MBS.
Fall in rates on 30-yrFRMs (Bankrate average)
Less than 25% of the fallin yields passed on toborrowers...
09/17 09/24 10/01 10/08
-100
-75
-50
-25
0
inbps
0
20
40
in%
տYield on FNMA 3.0
տBankrate 30-yr FRM Rate
Passthroughց
Willen (Boston Fed) From TBA to YSP January 18, 2015 16 / 40

IntroductionMeasurementPassthrough
Partial Adjustment
The passthrough problemEconomics of mortgage lendingHow do lenders set prices?This Paper
Return on sales
Price lender receives from the investors.Price they pay the borrower.Margin.
101
102
103
104
105
106
107
06 13 20 27 03 10 17 24 01 08 15
August September
Price
Price of a FNMA 3.0ց
տMedian price for 3.5 30-yr FRM
Margin
inbps
100
200
300
տMargin
Willen (Boston Fed) From TBA to YSP January 18, 2015 17 / 40

IntroductionMeasurementPassthrough
Partial Adjustment
The passthrough problemEconomics of mortgage lendingHow do lenders set prices?This Paper
Analysis of passthrough
Increase in price lender receives.Increase in price they pay.60-70% Passthrough so far.
150
200
250
29 05 12 19 26 03 10
September October
PriceChangein
bps
FNMA 3.0ց
տ3.5% 30-yr FRM
Passthroughin
%
0
0
25
50
50
75
100
100
ւ Passthrough
Willen (Boston Fed) From TBA to YSP January 18, 2015 18 / 40

IntroductionMeasurementPassthrough
Partial Adjustment
The passthrough problemEconomics of mortgage lendingHow do lenders set prices?This Paper
This Paper
Use LoanSifter/Optimal Blue Data
High frequency dataAllows us to compare rate-YSP combinations in primary marketWith rate-price combinations in secondary market
Measure Passthrough systematically
Compare apples to applesChange in points for a given rate.
Compare Prices with prices
Rather than note rates with yields
Willen (Boston Fed) From TBA to YSP January 18, 2015 19 / 40

IntroductionMeasurementPassthrough
Partial Adjustment
Measuring “Costs”: LoanSifter/Optimal BlueMeasuring Revenues
LoanSifter/Optimal Blue Data
We obtained data from LoanSifter, a search engine throughwhich brokers can get mortgage quotes from lenders
Recently acquired by OptimalBlue.
Relational database based on lender rate sheets
Plug in
Loan amount Loan-to-value ratio (LTV) Cumulative LTV (all liens)FICO Debt-to-income ratio Documentation typeState Loan type (fixed, ARM, balloon) Terms (15 years, 30 years, etc.)Prepayment penalty Lock period Property typePurpose (purchase, refi) Owner-occupied or investment Desired rate or desired points
Daily data going back to 2008
Willen (Boston Fed) From TBA to YSP January 18, 2015 20 / 40

IntroductionMeasurementPassthrough
Partial Adjustment
Measuring “Costs”: LoanSifter/Optimal BlueMeasuring Revenues
LoanSifter data
Characteristics of the loan
Variable Value Alternatives
MSA Los AngelesState CA = StateTerm 30 FRM FRM 15,30 or ARM 1,3,5,7,10Loan Amount $300KLoan Type Conforming FHAFICO 750LTV 80Occupancy Owner Occupied InvestmentPrepay 0=None 1=1 yr, etc..
Roughly 50 offers for the 3.5 – constant through sample.
Willen (Boston Fed) From TBA to YSP January 18, 2015 21 / 40

IntroductionMeasurementPassthrough
Partial Adjustment
Measuring “Costs”: LoanSifter/Optimal BlueMeasuring Revenues
Number of rate sheets
Count varied over time
Some lenders dropped out
Retroactively remove.
Willen (Boston Fed) From TBA to YSP January 18, 2015 22 / 40

IntroductionMeasurementPassthrough
Partial Adjustment
Measuring “Costs”: LoanSifter/Optimal BlueMeasuring Revenues
Rate 101
“Rate 101”
Rate that generates a YSPof 101
Take YSP for each rateInterpolate rate thatgenerates YSP 101For each lenderCalculate median acrossall lenders
2009 2010 2011 2012 2013
3.0
3.5
4.0
4.5
5.0
5.5
6.0
6.5
in%
ւ“Rate101”
Willen (Boston Fed) From TBA to YSP January 18, 2015 23 / 40

IntroductionMeasurementPassthrough
Partial Adjustment
Measuring “Costs”: LoanSifter/Optimal BlueMeasuring Revenues
Rate 101 versus other rates
Difference between rate101 and rate 100 and 102changes over time
Matters a lot
If you want lender to paycosts, need to go to rate102.
Big increase in rate in2009
2009 2010 2011 2012 2013
-1.00
-0.75
-0.50
-0.25
0.00
0.25
0.50
0.75
1.00
in%
←Rate102−Rate101
←Rate100−Rate101
Willen (Boston Fed) From TBA to YSP January 18, 2015 24 / 40
IntroductionMeasurementPassthrough
Partial Adjustment
Measuring “Costs”: LoanSifter/Optimal BlueMeasuring Revenues
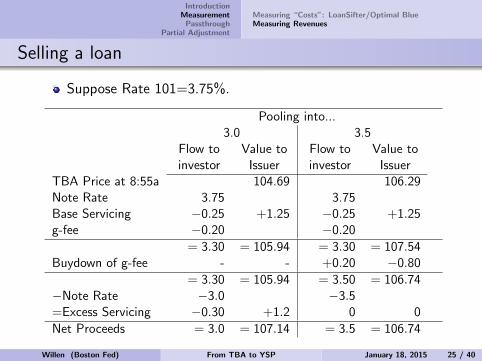
Selling a loan
Suppose Rate 101=3.75%.
Pooling into...3.0 3.5
Flow toinvestor
Value toIssuer
Flow toinvestor
Value toIssuer
TBA Price at 8:55a 104.69 106.29Note Rate 3.75 3.75Base Servicing −0.25 +1.25 −0.25 +1.25g-fee −0.20 −0.20
= 3.30 = 105.94 = 3.30 = 107.54Buydown of g-fee - - +0.20 −0.80
= 3.30 = 105.94 = 3.50 = 106.74−Note Rate −3.0 −3.5=Excess Servicing −0.30 +1.2 0 0
Net Proceeds = 3.0 = 107.14 = 3.5 = 106.74
Willen (Boston Fed) From TBA to YSP January 18, 2015 25 / 40

IntroductionMeasurementPassthrough
Partial Adjustment
Measuring “Costs”: LoanSifter/Optimal BlueMeasuring Revenues
Measuring Revenues
Calculate net note rate
Note rate minusBase servicingg-fees
Assume loan sold into lower coupon security: rcoupon
No buy-ups or buy-downs
PMBS = TBA(rcoupon)
+ base servicing ∗multiple
+ excess servicing ∗multiple
− AMDC − LLPA (1)
Willen (Boston Fed) From TBA to YSP January 18, 2015 26 / 40

IntroductionMeasurementPassthrough
Partial Adjustment
Measuring “Costs”: LoanSifter/Optimal BlueMeasuring Revenues
LLPAs
“Loan Level PriceAdjustments” (FannieMae)
“Post-SettlementDelivery Fees” (FreddieMac)
Changed over time
Determined by FHFA
Perfectly replicated in ratesheets.
© 2014 Fannie Mae. Trademarks of Fannie Mae. 2 08.26.2014 The Matrix is incorporated by reference into the Fannie Mae Selling Guide and supersedes any inconsistent information in the Selling Guide or earlier dated version of the Matrix.
Table 1: Adverse Market Delivery Charge * 0.250%
* Applicable to all mortgages delivered to Fannie Mae, including FHA, VA, RD Section 502 mortgages, HUD Section 184 mortgages, and matured balloon mortgages (refinanced or modified, per Servicing Guide requirements) redelivered as FRMs.
Table 2: All Eligible Mortgages (Excluding MCM) – LLPA by Credit Score/LTV Ratio
Representative
Credit Score
LTV Range Applicable for all mortgages with terms greater than 15 years
< 60.00% 60.01 – 70.00%
70.01 – 75.00%
75.01 – 80.00%
80.01 – 85.00%
85.01 – 90.00%
90.01 – 95.00% SFC
> 740 -0.250% 0.000% 0.000% 0.250% 0.250% 0.250% 0.250% N/A 720 – 739 -0.250% 0.000% 0.250% 0.500% 0.500% 0.500% 0.500% N/A 700 – 719 -0.250% 0.500% 0.750% 1.000% 1.000% 1.000% 1.000% N/A 680 – 699 0.000% 0.500% 1.250% 1.750% 1.500% 1.250% 1.250% N/A 660 – 679 0.000% 1.000% 2.000% 2.500% 2.750% 2.250% 2.250% N/A 640 – 659 0.500% 1.250% 2.500% 3.000% 3.250% 2.750% 2.750% N/A 620 – 639 0.500% 1.500% 3.000% 3.000% 3.250% 3.250% 3.250% N/A < 620 (1) 0.500% 1.500% 3.000% 3.000% 3.250% 3.250% 3.250% N/A
(1) A minimum required credit score of 620 applies to all mortgage loans delivered to Fannie Mae in accordance with the Selling Guide; exceptions to this requirement are limited to loans in which any borrower has nontraditional credit.
Willen (Boston Fed) From TBA to YSP January 18, 2015 27 / 40

IntroductionMeasurementPassthrough
Partial Adjustment
Measuring “Costs”: LoanSifter/Optimal BlueMeasuring Revenues
Rate 101 for lower FICO scores 680
LLPAs meant that FICO680 needs much higherYSP to get Rate 101
Early in the sample, thatmeant much higher rates.
2009 2010 2011 2012 2013
0.00
0.25
0.50
0.75
1.00
in%
ւPremium for 680 versus 750 FICO
Willen (Boston Fed) From TBA to YSP January 18, 2015 28 / 40

IntroductionMeasurementPassthrough
Partial Adjustment
Measuring “Costs”: LoanSifter/Optimal BlueMeasuring Revenues
MBS Prices
JP Morgan Markets.
“Back Month”Closing price
Intraday prices
2009 2010 2011 2012 2013
88
90
92
94
96
98
100
102
104
106
108
inpoints
FNMA 3.0ր
տFNMA 3.5
տFNMA 4.0
FNMA 5.0ց
Willen (Boston Fed) From TBA to YSP January 18, 2015 29 / 40
IntroductionMeasurementPassthrough
Partial Adjustment
Measuring “Costs”: LoanSifter/Optimal BlueMeasuring Revenues
Measuring Multiples
Servicing revenue is an “IO Strip”
Coupon Swaps
Long an FNMA 4.5Short an FNMA 4Security that pays 0.5 with ≈ prepayment properties of 4/4.5
“Industry Standards”
Base Servicing 5× cash flowExcess Servicing 4× cash flow
MIAC multiples
“Market price” of servicing rights.
Willen (Boston Fed) From TBA to YSP January 18, 2015 30 / 40
IntroductionMeasurementPassthrough
Partial Adjustment
Measuring Profits: OPUCFirst Differences
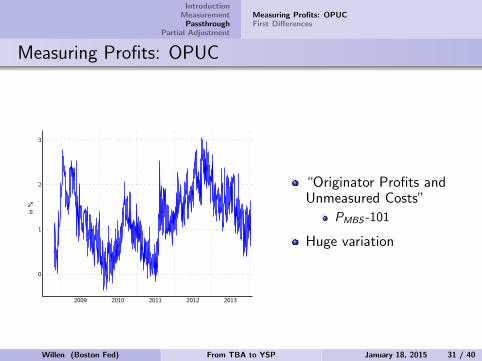
Measuring Profits: OPUC
“Originator Profits andUnmeasured Costs”
PMBS -101
Huge variation
2009 2010 2011 2012 2013
0
1
2
3
in%
Willen (Boston Fed) From TBA to YSP January 18, 2015 31 / 40

IntroductionMeasurementPassthrough
Partial Adjustment
Measuring Profits: OPUCFirst Differences
Scatter plot
y-axis: Change in LoansSifter Price:
PLSt+1 − PLS
x-axis: Change in MBSPrice
PMBSt+1 − PMBS
t
Willen (Boston Fed) From TBA to YSP January 18, 2015 32 / 40

IntroductionMeasurementPassthrough
Partial Adjustment
Measuring Profits: OPUCFirst Differences
First Differences
PLSt+1 − PLS
t − = α+ βxt
+ γ+Zt(PMBSt+1 − PMBS
t )+ + γ−Zt(PMBSt+1 − PMBS
t )− + ε (2)
Coeff. (t-stat) p-val
− FNMA 0.740 (33.4) 0.00× Refi Index -0.037 (-2.1) 0.04× MOVE Vol. Index 0.000 (0.0) 0.99× Indicator for Fed Action 0.322 (6.0) 0.00
+ FNMA 0.587 (32.8) 0.00× Refi Index -0.058 (-3.5) 0.00× MOVE Vol. Index -0.037 (-2.3) 0.02× Indicator for Fed Action -0.141 (-3.1) 0.00
NOBS 1184
Willen (Boston Fed) From TBA to YSP January 18, 2015 33 / 40

IntroductionMeasurementPassthrough
Partial Adjustment
ModelRegressionsCounterfactuals
Partial Adjustment Model
True equilibrium price is PMBS minus profits
PLSt+1 − PLS
t = λ
(PMBSt+1 + γ︸ ︷︷ ︸
EquilibriumPrice
−PLSt
)+ ε
Neumark and Sharpe (1992) for deposit rates.
Compare to:
PLSt+1 − PLS
t − = α+ βxt + γ(PMBSt+1 − PMBS
t ) + ε
Willen (Boston Fed) From TBA to YSP January 18, 2015 34 / 40

IntroductionMeasurementPassthrough
Partial Adjustment
ModelRegressionsCounterfactuals
Baseline regressions
How do speeds of adjustment vary?
Sample λ Interacted with... NRefi Google Move1mIndex Trends
Base 0.523 1141(0.016)
FICO=680 0.444 1129(0.020)
Base 0.627 -0.072 .023 0.154 1141(0.015) (0.023) (0.020) (0.011)
Sample λabove λbelow NBase 0.635 0.459 1141
(15.97 (22.10))
Willen (Boston Fed) From TBA to YSP January 18, 2015 35 / 40

IntroductionMeasurementPassthrough
Partial Adjustment
ModelRegressionsCounterfactuals
Time of day regressions
Closing price
versus intraday
Sample λ N
9am 0.404 1141(0.022)
12pm 0.487 1141(0.019)
3pm 0.524 1141(0.016)
Close 0.533 1141(0.016)
Timestamp 0.178 263(0.028)
Close 0.183 264(0.028)
Willen (Boston Fed) From TBA to YSP January 18, 2015 36 / 40

IntroductionMeasurementPassthrough
Partial Adjustment
ModelRegressionsCounterfactuals
Explaining Equilibrium Profitability
Increases in profits couldreflect
Slow adjustment (stickyprices)Or changing costs orprofitability of origination
If we assume constant profits
implied speed of adjustmentis too slow
Allow profits to move aroundwith cubic spline
High frequency passthroughMost variation in profits dueto volumes
2009 2010 2011 2012 2013
-1.0
-0.5
0.0
0.5
1.0
in%
0
1
2
3
4
5
MBA
Index/1000
ւEstimated Profit
Controlling for Refi Index
տMBA Refi Index (12-wk MA)
Willen (Boston Fed) From TBA to YSP January 18, 2015 37 / 40

IntroductionMeasurementPassthrough
Partial Adjustment
ModelRegressionsCounterfactuals
Passthrough in rates
Full passthrough: 3.59-3.4=19bps
Actual passthrough: 3.59-3.435=15.5bps
2.75 3.00 3.25 3.50 3.75 4.00Note Rate (in %)
98
99
100
101
102
103
104
105
106
YSP
տLS 8/29
FNMA 8/29ց
←Rate 101.65 8/29
3.59
LS 11/15ց
FNMA 11/15ց
Constant Profit 11/15→
3.4
←Rate 101.65 11/15
3.435
Willen (Boston Fed) From TBA to YSP January 18, 2015 38 / 40

IntroductionMeasurementPassthrough
Partial Adjustment
ModelRegressionsCounterfactuals
Counterfactual: Constant Profits
Assume that lender profitsstayed constant at levelbefore crisis.
Then compute the impliedprimary market price thatwould yield the constantlevel of profit
2009 2010 2011 2012 2013
3.0
3.5
4.0
4.5
5.0
5.5
6.0
6.5
7.0
in%
0
25
50
75
100
in%
ւ“Rate101”
Rate101, Constant Profitր
Differenceց
Willen (Boston Fed) From TBA to YSP January 18, 2015 39 / 40

IntroductionMeasurementPassthrough
Partial Adjustment
ModelRegressionsCounterfactuals
The slide you’ve all been waiting for...
The end.
Willen (Boston Fed) From TBA to YSP January 18, 2015 40 / 40