Embed Size (px)
Citation preview

415
Passive solutions for the optimization of the indoor environmental quality: a case study
Fabio Sicurella – Planair SA – [email protected]
Perla Colamesta – Freelance engineer – [email protected]
Abstract An integrated energy concept of a building should
include not only its energy consumption but also the
quality of the indoor environment in terms of thermal,
visual comfort and indoor air quality.
Shadings, window construction materials and ventilation
strategies have a significant impact on the “health” of the
building and of its occupants; they should be studied
carefully during the pre-design phase of the building.
Evaluating thermal, visual comfort or IAQ individually is
quite easy thanks to reference standards and simulation
tools but it can imply non-optimised solutions or even
design errors.
Conversely, an integrated approach should include a
simultaneous analysis of all these aspects of the indoor
environmental comfort in order to propose optimised
technical solutions or design strategies.
Previous studies have proposed statistical indicators to
manage thermal and visual comfort simultaneously. In
the present study further indicators of IAQ (here CO2
was considered) were included in order to achieve a
global environmental quality. This integrated approach
was used for the optimisation of a new large office
building in Switzerland. A parametric multi-objective
analysis was carried out by means of EnergyPlus. This
approach allowed for the optimization of design
strategies (shadings, window materials, ventilation) for
both energy savings and indoor environmental quality of
the building.
1. Introduction
During the concept and the design of a new
building, one of the hardest tasks for a building
physics engineer is probably to fulfil the occupant
wellness. A “healthy building” means a building
where the majority of the occupants feel
comfortable from a thermal, visual and IAQ point
of view. Following a bioclimatic approach without
the use of HVAC systems, the number of the main
physical parameters that govern this “feeling of
comfort” may be reduced to a few: the operative
temperature, the illuminance and the concentration
of pollutants. The ranges of their optimal values
are defined in the literature and in technical
standards (EN 15251, 2007; Nabil et al., 2005).
Actually, in order to understand if the indoor
comfort of a building will be achieved or not, one
should be able to quantify the intensity of
discomfort inside the building and its duration
during occupancy.
This kind of analysis can be carried out by using
statistical indicators as already described in the
literature (Sicurella et al., 2011).
On the basis of such analysis, a building physics
engineer should be able to propose optimised
technical solutions in order to fulfil thermal, visual
and IAQ comfort simultaneously.
In the present work a case study of a real building
design will be presented as well as a method to
find out optimised technical solutions. This
optimisation analysis concerned the choice of
glazing, shadings and ventilation strategies.
2. The methodology
The main goal of this study was to propose
technical solutions in order to fulfil thermal, visual
and IAQ comfort simultaneously.
It is important to state that the shape and
orientation of the building as well as the WWR
were already defined by the architect. Other
Fabio Sicurella, Perla Colamesta
416
constrains were given by the client who did not
want to have mechanical ventilation for the
building but he wanted a “bioclimatic building”
exploiting natural ventilation and daylighting.
As a consequence, our analysis was focused on the
optimisation of glazing, shading devices and
natural ventilation strategies.
Due to the fact that ventilation does not have an
impact on daylighting, the authors decided to
optimise first the windows and the shadings
devices and then the natural ventilation strategies.
For this reason, the present work is divided in two
main phases (Figure 1): the first one, in which the
characteristic of glazing and shading devices were
optimized for thermal (TC) and visual comfort
(VC) purposes; the second one in which the
ventilation strategies were analysed for thermal
and IAQ comfort purposes.
Fig. 1 – Work phases of the optimization process
The analyses were evaluated from June to
September during occupation hours (from 8.00am
to 7.00 pm). All the performances of the office were
simulated on EnergyPlus v.8.1 (EnergyPlus, 2013),
able to analyse simultaneously different
conditions.
Simulations were run in free running mode; the
parametric optimization was made by using the
simulation manager jEPlus.
2.1 Thermal Comfort evaluation
Thermal Comfort was evaluated considering the
adaptive comfort, according to the standard
EN15251, category II: “Normal level of expectation
and should be used for new buildings and
renovations” (EN 15251, 2007).
The objective function was the minimization of the
number of occupation hours in the office room
during which the operative temperature were out
of the range limits defined by the above-mentioned
standards.
2.2 Visual Comfort evaluation
Concerning daylighting, the range of visual
comfort should take into account the actual
working context, the visual task, the luminance all
around, etc. Many studies provide full credit only
to values between 100 lux and 2000 lux by
suggesting that horizontal illumination values
outside of this range are not useful (Nabil A et al.,
2005). Due to the fact that the landscape is often
snowy the authors decided to prudently reduce the
optimal daylight illuminance range from 300 to
1500 lux.
The objective function was the minimization of the
number of occupation hours during which the
workplane illuminance is out of this range. This
value was obtained as an average calculated upon
two points inside the office room at a height of
0.8m (Figure 2).
Fig. 2 – Sensors position inside the office room
I phase
TC+VC
II phase
TC+IAQ
Windows+Shading
materials
Shading
control
Natural
ventilation
1.6 m
1.6 m
1.6 m
1 m
1 m

Passive solutions for the optimizations of indoor environmental quality: a case study
417
The two illuminance sensors were considered to be
at 2.6m and 4.2m from the façade respectively in
order to limit the impact of the boundaries. (Fig. 2)
2.3 Indoor Air Quality evaluation
The calculation model used for simulating the
ventilation airflow rate is a function of wind speed
and thermal stack affect, combined with the
infiltration effect.
The equation used to calculate the ventilation rate
driven by wind is:
Qw = CwAopeningFscheduleV
where:
Qw=Volumetric air flow rate driven by wind [m3s-1]
Cw= Opening effectiveness [dimensionless]
Aopening = Opening area [m2]
Fschedule = Open are fraction [dimensionless]
V = Local wind speed [ms-1]
The equation used to calculate the ventilation rate
due to stack effect is:
Qs=CdAopeningFschedule√ | |
where:
Qs= Volumetric air flow rate driven by wind [m3s-1]
Cd=Discharge coefficient for opening
[dimensionless]
Aopening = Opening area [m2]
Fschedule = Open are fraction [dimensionless]
ΔHNPL= Height from midpoint of lower opening to
the neutral pressure level [m]
Tzone= Zone air dry-bulb temperature [K]
Todb=Local outdoor air dry-bulb temperature [K]
The total ventilation rate is given by:
Ventilation Wind and Stack = √
Concerning IAQ, in literature and technical
standards it is possible to find different values of
suitable ventilation rate (AiCARR, 2009; UNI EN
15251, 2007; ASHRAE 62.1, 2007).
A way to evaluate IAQ is to refer to the actual CO2
concentration inside the building.
Following the ASHRAE Standard 62, 1989, this
limit can be set at 1000 ppm even though the
standard revision (ASHRAE Standard 62, 1999),
suggests 700 ppm above the outdoor concentration
as an upper limit. According to studies of Bern
University, published by the Swiss Federal Office
for the Environment (OFEV,2008) the outdoor CO2
concentration is 400 ppm.
As a consequence the authors decided to choose
the more restrictive of these rate values for CO2
concentration, which in this case study was set at
1000 ppm.
The objective function was to minimize the number
of working hours during which the CO2
concentration is higher than 1000 ppm.
3. The case study
The analysed building is a multifunctional three-
story building of around 14.500 m3 designed by the
Atelier of architecture Manini Pietrini based in
Neuchâtel for the Chocolate Manufacture
enterprise Camille Bloch. It is located in Northern
Switzerland (Courtelary, near Basel) at 800m asl
and includes offices, conference rooms, a
restaurant and exposition halls.
It is a north/south oriented building with large
glazing on the main façades (on average WWR of
43%), (Figure 3).
Fig. 3 – Southern and Northern view of the building with in evidence the analysed office (red circle)
For brevity, the results presented in this work will
refer to a south-oriented office room only. It is 3.65
m wide, 6.80 m long and 2.8 m high (Figure 2 and
3), and it is occupied by two people from 8.00 am
to 7.00 pm. Each office is characterized by 8.8m2 of
window, only 2.2 m2 is an openable area.

Fabio Sicurella, Perla Colamesta
418
On the eastern side of the building there are two
openable bottom hung windows of 2.2 m2 (Fig. 4) (opening area: 25%).
Fig. 4 – Building model: 1: skylight on the stairs; 2: opening window in office room; 3 opening window at the Eastern facade
The doors between the offices and corridor were
considered open all the time; the corridor is
connected to a stairwell which has a 4m2 openable
skylight (Figure 4).
4. Thermal and Visual Comfort
4.1 TC+VC Windows + Shading materials Parameters
The windows are low emissivity triple glazing (Ug-
value of 0.6 Wm-2K-1 filled with Ar) with PVC
frames (Uf-value of 1.1 Wm-2K-1).
Exterior perforated protections placed in front of
the windows are automatically lowered when the
total solar irradiance on the façade exceeds 200
Wm-2.
Infiltrations were taken into account following the
Sherman and Grimsrud model (Sherman et al.,
1980), and by using the coefficient recommended in
ASHRAE HoF 2009, while, only during this first
phase (windows and shadings optimisation), the
hygienic ventilation was set equal to 0.5 ACH.
The reflectivity of interior walls, ceiling and floor
was set at 0.5, 0.7 and 0.3 respectively.
The Solar Transmittance (Gv) and the Visible
Transmittance (Tv) for both glazing and shadings
were varied so obtaining 34 combinations (Table 1).
Similar combinations can be achieved by real
glasses.
Table 1 – Properties of glazing and shadings considered for the parametric analysis
Window
glazing
W_ Gv {0.35,0.45,0.55}
W_ Tv {0.55,0.65,0.75}
Shadings
S_ Gv {0.10,0.15,0.20}
S_ Tv {0.15,0.20,0.25}
4.2 TC+VC Windows + Shadings materials Optimization Results
The results of this first parametric analysis are
shown in Figure 5 and 6.
Fig. 5 – Results of windows and shading materials optimization
Fig. 6 – Comparison between the best and worst case in a typical day
As can be observed in Figure 5, the best results are
obtained by the combination W_ Gv:: 0.35; W_ Tv:
0.55 for the windows glazing, and S_ Gv:: 0.1 S_
Tv: 0.25 for the shadings materials.
As can be seen in Figure 6, during a typical
3
2
1
Passive solutions for the optimizations of indoor environmental quality: a case study
419
summer day, with a high value of visible
transmittance (Case B: W_ Tv: 0.75; S_ Tv: 0.25)
visual discomfort can occur while the lowest solar
transmittance value (Case A) is always preferable
for thermal comfort.
4.3 TC+VC Shading control Parameters
Once the window and shading characteristics were
set, a further optimization was focused on the set
point of solar irradiance for shadings control.
The simulations were run with three different set
point values for the incident total solar radiation
upon the façade (100, 150 and 200Wm-2), and with
a so called “shading control based on the daylight
glare”. This method consists in activating shadings
when the daylight glare index at the first reference
point, calculated with the eq. of Hopkinson,
(Hopkinson, 1970,1972) exceed the value of 22.
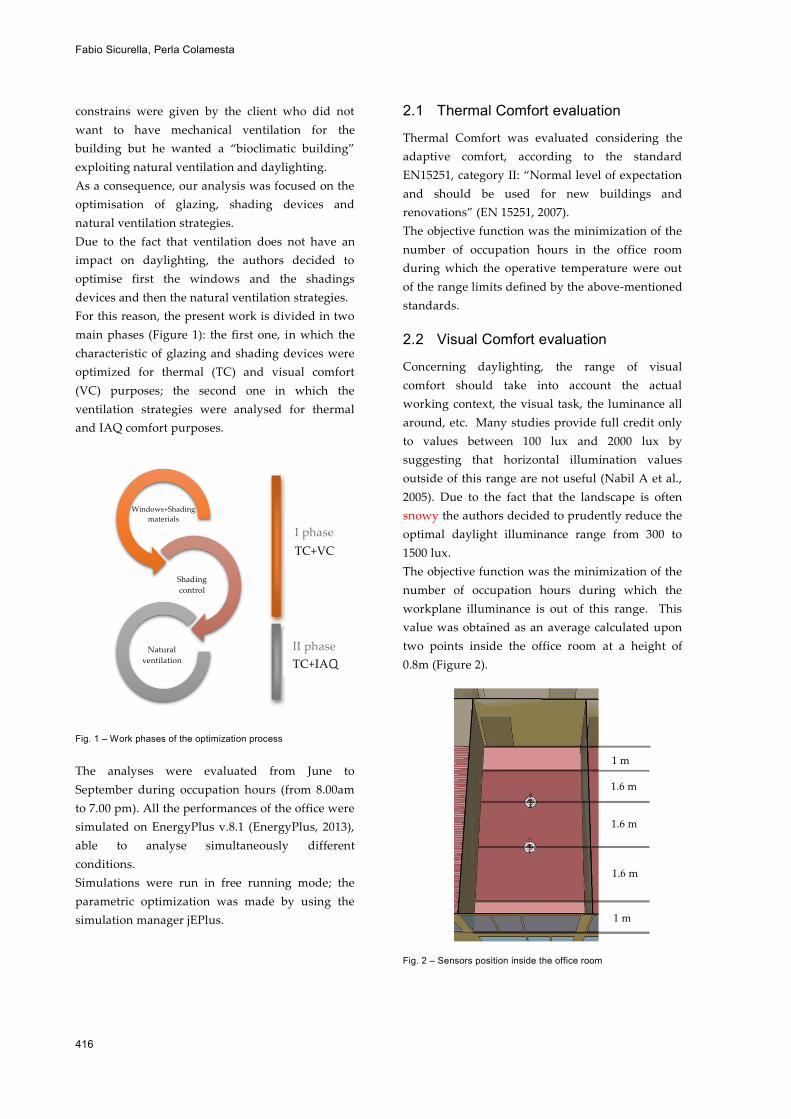
4.4 TC+VC Shading control Optimization Results
The results are shown in Table 2 from 01/06 to
30/09 and in Figure 7 for a typical sunny day.
As can be seen in Table 2 and in Figure 7, the
daylight glare control is not optimized for thermal
purposes. On the other hand, the 800-1600 lux
range seems to be the optimal range for visual
comfort following this control strategy.
Table 2 – Results of shading control evaluation
Type of shading
control
Hours of
thermal
discomfort
Hours of
visual
discomfort
“Daylight glare” 73 194
Total solar irradiance ≥
100Wm-2 12 254
Total solar irradiance ≥
150 Wm-2
12 75
Total solar irradiancev≥
200 Wm-2
17 93
Fig. 7 – Comparison between “daylight glare” and 150 Wm-2 irradiance control for shadings in a typical day
In the authors’ opinion this type of shading control
might empathise daylighting for a long part of the
occupation hours while penalising thermal
comfort.
Due to the fact that the site is often snowy and in a
seasonal optimisation perspective the authors
decided a shading control based on solar
irradiance upon the façade set at 150 Wm-2.
In fact this value reduces both thermal and visual
discomfort (Table 2).
5. Thermal Comfort and Indoor Air Quality
5.1 TC+IAQ Parameters
For the following part of the study the hygienic
mechanical ventilation was removed, while the
shading control previously optimised was
maintained.
This analysis considered a carbon dioxide
generation rate in the office room of 3.82*10 -8 m3s-
1W-1, obtained from ASHRAE Standard 62.1 by
assuming a constant activity level of 1 met.
A constant outdoor CO2 concentration of 400 ppm
was considered according to studies of Bern
University, published by the Swiss Federal Office
for the Environment (OFEV, 2008).
As already introduced in paragraph 3, only 25% of
the glazing is an openable window. This part of the
window can be opened in two different modes:
automatically (by assuming an ideal occupant’s
behaviour) in bottom hung mode and manually in

Fabio Sicurella, Perla Colamesta
420
side hung mode.
Concerning the automatic mode, it is based on
outdoor/indoor temperature gradient and on the
internal temperature. The window is open when
the gradient temperature is higher than 1°C and
when the indoor air temperature is over 22 °C; the
occupants may open the window partially (in
bottom hung mode) or totally (side hung mode).
The simulations were run considering different
opening type mode combined with different time
ranges of possible opening, and with the
opportunity or not to exploit the cross ventilation
by the skylight over the stairs and by the opening
windows at the Eastern facade (Figure 4).
5.2 TC+IAQ Optimization Results
The results are shown in Figure 8 and 10 from
01/06 to 30/09 and in Figure 9 for a typical sunny
day.
In Figure 8, the number of occupation hours from
8.00am to 7.00pm during which the operative
temperature and CO2 concentration surpass the
comfort range are plotted simultaneously.
Figure 9 shows the operative temperature and CO2
concentration profiles for four different cases in a
typical day.
A number of simulations for different ventilation
strategies were run; here, for brevity, only the
following cases are reported:
- Case 0: without natural ventilation, only
infiltration;
- Case A: natural ventilation through the
skylight (100%) all day long;
- Case B: natural ventilation through the
skylight (100%) and through the eastern
windows (in bottom hung mode) all day
long;
- Case C: Case B + office windows in bottom
hung mode (during occupation hours);
- Case D: office windows in side hung
mode from 6.00am to 7.00pm only;
- Case E: office windows in side hung mode
from 8.00am to 7.00pm only;
- Case F: natural ventilation through office
windows in bottom hung mode from
7.00pm to 8.00 am only (night
ventilation).
Fig. 8 – Thermal and IAQ discomfort for different ventilation strategies
Fig. 9 – Comparison between operative temperature and CO2 concentration for four different cases in a typical day
Fig. 10 – Adaptive thermal comfort: comparison between Case 0 and Case C
As can be expected, the worst case for IAQ occurs
without natural ventilation (Case 0).
Night ventilation reduces thermal discomfort but
the IAQ is not good enough (Case F); this strategy
may result in discomfort for excessive CO2 since
people might hesitate to open windows in the early
morning (Figure 9).
Only by exploiting natural cross ventilation (Case A
and B) does the IAQ increase significantly even
without opening the window in the office room.
These strategies can be considered very effective for
those sites where the window is open infrequently
(for example in noisy sites).
Passive solutions for the optimizations of indoor environmental quality: a case study
421
The solutions C, D and E represent the non-
dominated solutions and they are very similar and
excellent solutions for IAQ.
In Figure 10, the operative temperature for Case 0
and Case C is shown from June to September; as can
be seen a good IAQ strategy has a positive effect on
thermal comfort too. This last strategy was retained
for the project since it is relatively easy to apply and
does not significantly depend on occupant
behaviour.
6. Conclusion
In the present study the results of a parametric
analysys for comfort and IAQ design optimisation
were presented.
Simulations run on EnergyPlus for a real case study
allowed us to define the characteristics of glazings
and shading devices as well as natural ventilation
strategies in a “healthy building” design
perspective.
The results show the importance of simulation in
order to find the best compromise for thermal, and
visual comfort and for IAQ by choosing optical
characteristics of materials, shading control and
ventilation strategies.
Solar and visual transmittance of glazings and
shading devices as well as shading control have a
significant impact on thermal and visual comfort
and have to be chosen carefully to fulfil both
perspectives simultaneously.
Cross natural ventilation through skylights when
the openings are correctly sized, can be enough and
is not very influenced by occupant behaviour.
On the basis of the methodology and the statistical
indicators presented in this study, thermal and
visual comfort, as well as IAQ can be managed and
otimised simultaneausly. By following this approach
it is also possible to evaluate the discomfort given by
other polluants (TVOC, Formaldehyde, noise, etc) if
they occur.
These results will be presented in a future work.
References
Standards ASHRAE. 1989. Standard 62. Ventilation for
acceptable Indoor Air Quality
ASHRAE. 1999. Standard 62. Ventilation for
acceptable Indoor Air Quality
ASHRAE. 2007. Standard 62.1 Ventilation for
acceptable Indoor Air Quality
ASHRAE. 2007. Standard 62.1-2007 User’s manual
ASHRAE. 2009. Handbook of Fundamentals
EN Standard 15251. 2007. Indoor environmental
input parameters for design and assessment of
energy performance of building addressing
indoor air quality, thermal environment,
lighting and acoustics.
Books AiCARR. 2009. Manuale d’ausilio alla progettazione
termotecnica.Milano
Apte, M.G., W.J.Fisk, and J.M. Daisey.2000.
Associations between indoor CO2
concentrations and sick building syndrome
symptoms in US office buildings: An analysis of
the 1994-1996 BASE study data.
Energy plus. 2013. Engineering Reference; Input
Output Reference.
Mendell, M.J: 1993. Non-specific symptoms in office
workers: A review and summary of the
epidemiologic literature.
Sherman, M.H. and D.T Grimsrud. 1980. Infiltration-
pressurization correlation: Simplified physical
modelling.
Journal articles Hopkinson, R.G. 1970. Glare from Windows.
Construction Research and Development
Journal 2, 98
Hopkinson, R.G. 1972. Glare from Daylighting in
Buildings. Applied Ergonomics 3, 206
Nabil A, & Mardaljevic J. 2005. Useful Daylight
Illuminance: A New Paradigm to Access
Daylight in Buildings. Lighting Research &
Technology, 37.
Nabil A, & Mardaljevic J. (2005b). Useful Daylight
Factors. Energy and Buildings, 38.
OFEV. 2008. “Ne pas agir maintenant, c’est faire un
preuve d’un négligence grave.” Environnement.
Le défi climatique
Sicurella, F., Evola, G. and Wurtz, E. 2011. A
statistical approach for the evaluation of
thermal and visual comfort in free-running
buildings. Energy and buildings


![Index [] · Spray Slidy 11 TABLETENNISTABLES 12-16 TABLES Basic 13 Training Indoor 13 Progress Indoor 13 Challenge Indoor 13 Advance Indoor 13 Master Indoor 14 Club Indoor 14](https://img.pdfslide.us/doc/110x75/609ea898873dde113652cff3/index-spray-slidy-11-tabletennistables-12-16-tables-basic-13-training-indoor.jpg)