Embed Size (px)
Citation preview

This paper is included in the Proceedings of the 14th USENIX Symposium on Networked Systems
Design and Implementation (NSDI ’17).March 27–29, 2017 • Boston, MA, USA
ISBN 978-1-931971-37-9
Open access to the Proceedings of the 14th USENIX Symposium on Networked
Systems Design and Implementation is sponsored by USENIX.
Passive Realtime Datacenter Fault Detection and Localization
Arjun Roy, University of California, San Diego; Hongyi Zeng and Jasmeet Bagga, Facebook;
Alex C. Snoeren, University of California, San Diego
https://www.usenix.org/conference/nsdi17/technical-sessions/presentation/roy

Passive Realtime Datacenter
Fault Detection and Localization
Arjun Roy, Hongyi Zeng†, Jasmeet Bagga†, and Alex C. Snoeren
UC San Diego and †Facebook, Inc.
ABSTRACTDatacenters are characterized by their large scale,
stringent reliability requirements, and significant appli-
cation diversity. However, the realities of employing
hardware with small but non-zero failure rates mean that
datacenters are subject to significant numbers of failures,
impacting the performance of the services that rely on
them. To make matters worse, these failures are not al-
ways obvious; network switches and links can fail par-
tially, dropping or delaying various subsets of packets
without necessarily delivering a clear signal that they are
faulty. Thus, traditional fault detection techniques in-
volving end-host or router-based statistics can fall short
in their ability to identify these errors.
We describe how to expedite the process of detecting
and localizing partial datacenter faults using an end-host
method generalizable to most datacenter applications. In
particular, we correlate transport-layer flow metrics and
network-I/O system call delay at end hosts with the path
that traffic takes through the datacenter and apply statis-
tical analysis techniques to identify outliers and localize
the faulty link and/or switch(es). We evaluate our ap-
proach in a production Facebook front-end datacenter.
1. INTRODUCTIONModern datacenters continue to increase in scale,
speed, and complexity. As these massive computing
infrastructures expand—to hundreds of thousands of
multi-core servers with 10- and 40-Gbps NICs [35] and
beyond—so too do the sets of applications they support:
Google recently disclosed that their datacenter network
fabrics support literally thousands of distinct applications
and services [37]. Yet the practicality of operating such
multi-purpose datacenters depends on effective manage-
ment. While any given service might employ an army of
support engineers to ensure its efficient operation, these
efforts can be frustrated by the inevitable failures that
arise within the network fabric itself.
Unfortunately, experience indicates that modern dat-
acenters are rife with hardware and software failures—
indeed, they are designed to be robust to large numbers
of such faults. The large scale of deployment both en-
sures a non-trivial fault incidence rate and complicates
the localization of these faults. Recently, authors from
Microsoft described [44] a rogue’s gallery of datacen-
ter faults: dusty fiber-optic connectors leading to cor-
rupted packets, switch software bugs, hardware faults,
incorrect ECMP load balancing, untrustworthy counters,
and more. Confounding the issue is the fact that fail-
ures can be intermittent and partial: rather than failing
completely, a link or switch might only affect a subset of
traffic, complicating detection and diagnosis. Moreover,
these failures can have significant impact on application
performance. For example, the authors of NetPilot [42]
describe how a single link dropping a small percentage
of packets, combined with cut-through routing, resulted
in degraded application performance and a multiple-hour
network goose chase to identify the faulty device.
Existing production methods for detecting and local-
izing datacenter network faults typically involve watch-
ing for anomalous network events (for example, scanning
switch queue drop and link utility/error counters) and/or
monitoring performance metrics at end hosts. Such
methods consider each event independently: “Did a drop
happen at this link? Is application RPC latency unusually
high at this host?” Yet, in isolation, knowledge of these
events is of limited utility. There are many reasons an end
host could observe poor network performance; similarly,
in-network packet drops may be the result of transient
congestion rather than a persistent network fault. Hence,
datacenter operators frequently fall back to active prob-
ing and a certain degree of manual analysis to diagnose
and localize detected performance anomalies [19, 44].
Instead, we propose an alternative approach: rather
than looking at anomalies independently, we consider the
impacts of faults on aggregate application performance.
Modern datacenter fabrics are designed with a plethora
of disjoint paths and operators work hard to load balance
traffic across both paths and servers [9, 37]. Such designs
result in highly regular flow performance regardless of
path—in the absence of network faults [35]. An (un-
mitigated) fault, on the other hand, will manifest itself
as a performance anomaly visible to end hosts. Hence,
to detect faults, we can compare performance end hosts
observe along different paths and hypothesize that out-
liers correspond to faults within the network.
To facilitate such a comparison, we develop a
lightweight packet-marking technique—leveraging only
forwarding rules supported by commodity switching
ASICs—that uniquely identifies the full path that a
packet traverses in a Facebook datacenter. Moreover,
USENIX Association 14th USENIX Symposium on Networked Systems Design and Implementation 595

the topological regularity of Facebook’s datacenter net-
works allows us to use path information to passively
localize the fault as well. Because each end host can
bin flows according to the individual network elements
they traverse, we can contrast flows traversing any given
link (switch) at a particular level in the hierarchy with
flows that traverse alternatives in order to identify the
likely source of detected performance anomalies. Oper-
ators can then use the output of our system—namely the
set of impacted traffic and the network element(s) seem-
ingly responsible—in order to adjust path selection (e.g.,
through OpenFlow rules, ECMP weight adjustment [32],
or tweaking inputs to flow hashes [23]) to mitigate the
performance impact of the fault until they can repair it.
A naive implementation of our approach is unlikely to
succeed given the noisiness of flow-based metrics at indi-
vidual host scale. Furthermore, distinct applications, or
different workloads for the same application, are likely to
be impacted differently by any given fault. Here the mas-
sive scale of modern datacenters aids us: Specifically,
when aggregated across the full set of traffic traversing
any given network link, we find that statistical techniques
are effective at using end-host-based metrics to identify
under-performing links in real time. Our experience sug-
gests this can remain true even when end hosts service
different requests, communicate with disjoint sets of re-
mote servers, or run entirely distinct application services.
To be practical, our approach must not place a heavy
burden on the computational resources of either end
hosts or the network switches, and neither can we re-
quire significant network bandwidth or esoteric features
from the switches themselves. Furthermore, our analy-
sis techniques must avoid false positives despite the di-
versity and scale of production datacenters yet remain
sensitive to the myriad possible impacts of real-word
faults. Our contributions include (1) a general-purpose,
end-host-based performance monitoring scheme that can
robustly identify flows traversing faulty network compo-
nents, (2) a methodology to discover the necessary path
information scalably in Facebook’s datacenters, and (3)
a system that leverages both types of information in ag-
gregate to perform network-wide fault-localization.
At a high level, while network statistics can be noisy
and confusing to interpret in isolation, the regular topol-
ogy and highly engineered traffic present within Face-
book’s datacenters provides an opportunity to leverage
simple statistical methods to rapidly determine where
partial faults occur as they happen. We demonstrate
that our technique is able to identify links and routers
exhibiting low levels (0.25–1.0%) of packet loss within
a Facebook datacenter hosting user-servicing front-end
web and caching servers within 20 seconds of fault oc-
currence with a minimal amount of processing overhead.
We also perform a sensitivity analysis on a testbed to
consider different types of errors—including those that
induce only additional latency and not loss—traffic pat-
terns, application mixes, and other confounding factors.
2. MOTIVATION & RELATED WORK
While fault detection is a classical problem in dis-
tributed systems [7, 11, 13, 14, 18, 33] and networks [12,
24, 29], modern datacenter environments provide both
significant challenges (e.g., volume and diversity of ap-
plication traffic, path diversity, and stringent latency re-
quirements) and benefits (large degree of control, regular
topologies) that impact the task of effectively finding and
responding to network faults. Moreover, recent work has
indicated that the types and impacts of faults common in
modern datacenters [42, 44] differ from those typically
encountered in the wide-area [34, 40] and enterprise [39].
Datacenters are affected by a menagerie of errors, in-
cluding a mix of software errors (ECMP imbalances,
protocol bugs, etc.), hardware errors (packet corruption
due to cables or switches, unreliable packet counters, bit
errors within routing tables, etc.), configuration errors,
and a significant number of errors without an apparent
cause [44]. Errors can be classed into two main cate-
gories: a complete error, in which an entire link or switch
is unable to forward packets, or a partial error, where
only a subset of traffic is affected. In this work, we fo-
cus primarily on the latter. Even a partial error affecting
and corrupting only 1% of packets on two links inside a
datacenter network was noted to have a 4.5× increase in
the 99th-percentile application latency [42], which can
impact revenue generated by the hosted services [21].
Commonly deployed network monitoring approaches
include end-host monitoring (RPC latency, TCP retrans-
mits, etc.) and switch-based monitoring (drop counters,
queue occupancies, etc.). However, such methods can
fall short for troubleshooting datacenter scale networks.
Host monitoring alone lacks specificity in the presence
of large scale multipath; an application suffering from
dropped packets or increased latency does not give any
intuition on where the fault is located, or whether a given
set of performance anomalies are due to the same fault.
Similarly, if a switch drops a packet, the operator is un-
likely to know which application’s traffic was impacted,
or, more importantly, what is to blame. Even if a switch
samples dropped packets the operator might not have a
clear idea of what traffic was impacted. Due to sampling
bias, mouse flows experiencing loss might be missed, de-
spite incurring great impacts to performance. (We ex-
pound upon this issue in Appendix A.) Switch-counter-
based approaches are further confounded by cut-through
forwarding and unreliable hardware [44].
Thus, we propose a system that focuses not on the oc-
currence of network anomalies but rather on their impact
on traffic. In doing so we leverage the high path diver-
596 14th USENIX Symposium on Networked Systems Design and Implementation USENIX Association

sity and regular topologies found in modern datacenters,
as well as the finely tuned load balancing common in
such environments. We also expose to each host, for ev-
ery flow, the path taken through the network. As such,
our approach has several key differences with both past
academic proposals and production systems:
1. Full path information: Past fault-finding sys-
tems have associated performance degradations
with components and logical paths [7, 10, 13, 19]
but a solution that correlates performance anoma-
lies with specific network elements for arbitrary ap-
plications has, to the best of our knowledge, proved
elusive—although solutions exist for carefully cho-
sen subsets of traffic [44].2. Passive monitoring, not active probing: In con-
trast to active probing methods [17, 19], our
method leverages readily available metrics from
production traffic, simultaneously decreasing net-
work overhead, increasing the detection surface,
and decreasing detection and localization time.3. Reduced switch dependencies: While some ap-
proaches require expanded switch ASIC features
for debugging networks [20], we do not require
them. This allows network operators to deploy
our approach on commodity switches, and makes
our approach resilient to bugs that may escape on-
switch monitoring.4. No per-application modeling: Our system lever-
ages the stable and load-balanced traffic patterns
found in some modern datacenters [35]. Thus, it
does not need to model complicated application de-
pendencies [7, 11, 13] or interpose on application
middleware [14]. Since we compare relative per-
formance across network links, we do not require
explicit performance thresholds.5. Rapid online analysis: The regularity inherent in
several academic [8] and production [9, 37] topolo-
gies allow us to simplify our analysis to the point
that we can rapidly (10–20 seconds) detect partial
faults of very small magnitude (≤ 0.5% packet
loss) using an online approach. This contrasts with
prior systems that require offline analysis [7] or
much larger timescales to find faults [11]. Further-
more, localizing faults is possible without resource-
intensive and potentially time consuming graph
analysis [17, 24, 25, 26, 27, 30].
3. SYSTEM OVERVIEWIn this section, we present the high-level design of a
system that implements our proposed approach. To set
the context for our design, we first outline several im-
portant characteristics of Facebook’s datacenter environ-
ment. We then introduce and describe the high-level re-
sponsibilities of the three key components of our system,
deferring implementation details to Section 4.
3.1 Production datacenterFacebook’s datacenters consist of thousands of hosts
and hundreds of switches grouped into a multi-rooted,
multi-level tree topology [9]. The datacenter we con-
sider serves web requests from a multitude of end users,
and is comprised primarily of web servers and cache
servers [35]. While wide-area connections to other in-
stallations exist, we do not focus on those in this work.
3.1.1 Topology
Web and cache hosts are grouped by type into racks,
each housing a few tens of hosts. User requests are
load balanced across all web servers, while cached ob-
jects are spread across all caches. Since any web server
can service any user request, there is a large fan-out of
connections between web servers and caches; in particu-
lar, each web server has thousands of bidirectional flows
spread evenly amongst caches [35]. Prior work notes
both the prevalence of partition-aggregate workloads and
the detrimental impact of packet loss and delay in this
latency sensitive environment—even if they only consti-
tute the long tail of the performance curve [43].
A few tens of racks comprises a pod. Each pod also
contains four aggregation switches (Aggs). Each ToR
has four uplinks, one to each Agg. There are a few tens
of pods within the datacenter, with cross-pod communi-
cation enabled by four disjoint planes of core switches
(each consisting of a few tens of cores). Each Agg is
connected to the cores in exactly one plane in a mesh.
Each host transmits many flows with differing network
paths. Due to the effects of ECMP routing, mesh-like
traffic patterns, and extensive load balancing, links at the
same hierarchical level of the topology end up with a
very even distribution of a large number of flows. More-
over, if we know which path (i.e., set of links) every flow
traverses, it is straightforward to separate the flows into
bins based on the link they traverse at any particular level
of the hierarchy. Hence, we can simultaneously perform
fault identification and localization by considering per-
formance metrics across different subsets of flows.
3.1.2 Operational constraints
The sheer scale of the datacenter environment imposes
some significant challenges on our system. The large
number of links and switches require our system to be ro-
bust to the presence of multiple simultaneous errors, both
unrelated (separate components) and correlated (faults
impacting multiple links). While some errors might be
of larger magnitude than others, we must still be sensi-
tive to the existence and location of the smaller errors. In
addition, we must detect both packet loss and delay.
The variety of applications and workloads within
the datacenter further complicate matters—an improper
choice of metric can risk either masking faults or trigger-
ing false positives (for example, the reasonable sounding
choice of request latency is impacted not only by net-
USENIX Association 14th USENIX Symposium on Networked Systems Design and Implementation 597

Figure 1: High-level system overview (single pod depicted).
work faults but also cache misses, request size and server
loads). Moreover, datacenters supporting multiple ten-
ants clearly require application-agnostic metrics.
Furthermore, we must be able to support measure-
ments from large numbers of end hosts describing the
health of a large number of links, without imposing
large computational or data overheads either on the end
hosts or on the network. This is especially true of net-
work switches, where relatively under-provisioned con-
trol planes are already engaged in critical tasks including
BGP routing. Thus, we are limited to capabilities present
in the data planes of commodity switch ASICs.
3.2 System architectureOur fault detection and localization approach involves
functional components at all end hosts, a subset of
switches, and a centralized controller, depicted in Fig-
ure 1. Switches mark packets to indicate network path
(1). Hosts then independently compare the performance
of their own flows to generate a host-local decision about
the health of all network components (2). These verdicts
are sent (3) to a central controller, which filters false pos-
itives to arrive at a final set of faulty components (4),
which may be further acted upon by other systems (5).
We expand on the role of each element below.
3.2.1 End hosts
Hosts run production application traffic and track var-
ious per-flow metrics detailed in Section 4.2. In addition,
the host is aware of each flow’s path through the network.
Periodically, hosts will use collected performance data to
issue verdicts for whether it considers a given subset of
flows to have degraded performance, or not. By default,
flow metrics are binned by the set of links they traverse.
These bins are then further grouped into what we call
equivalence sets (ESes), i.e., the set of bins that should
perform equivalently, allowing us to pinpoint link-level
faults. In the Facebook datacenter, the set of bins corre-
sponding to the downlinks from the network core into a
pod forms one such ES. Alternative schemes can give us
further resolution into the details of a fault: for example,
comparing traffic by queue or subnet (Section 5.4.4). We
discuss the impact of heterogeneous traffic and topolo-
gies on our ability to form ESes in Section 6.
We define a guilty verdict as an indication that a partic-
ular bin has degraded performance compared to others in
its ES; a not guilty verdict signifies typical performance.
We leverage path diversity and the ability to compare per-
formance across links—if every link in an ES is perform-
ing similarly, then either none of the links are faulty, all
of them are faulty (unlikely in a production network) or
a fault exists but might be masked by some other bot-
tleneck (for which we cannot account). The target case,
though, is that enough links in an ES will be fault-free at
any given moment, such that the subset of links experi-
encing a fault will be readily visible if we can correlate
network performance with link traversed. Even in the
absence of path diversity (e.g., the access link for a host)
we can use our method with alternative binning schemes
and equivalence sets to diagnose certain granular errors.
3.2.2 Switches
A subset of the network switches are responsible for
signaling to the end hosts the network path for each
flow; we describe details in Section 4.1. Once faults are
discovered by the centralized controller, switches could
route flows away from faulty components, relying on the
excess capacity typically found in datacenter networks.
We leave fault mitigation to future work.
3.2.3 Controller
In practice, there will be some number of false posi-
tives within host-generated verdicts for link health (e.g.
hosts flagging a link that performs poorly even in the ab-
sence of an error, possibly due to momentary conges-
tion) confounding the ability to accurately deliver fixes
to the network. Furthermore, there might be errors which
do not affect all traffic equally; for example, only traffic
from a certain subnet might be impacted, or traffic of a
certain class. Hence, we employ a central controller that
aggregates end-host verdicts for links (or other bins) into
a single determination of which links—if any—are suf-
fering a fault. In addition, the controller can drive other
administrative systems, such as those used for data vi-
sualization/logging or rerouting of traffic around faults.
Such systems are outside the scope of this work.
4. IMPLEMENTATIONWe now present a proof-of-concept implementation
that meets the constraints presented above. In order, we
focus on scalable path signalling, our choice of end-host
598 14th USENIX Symposium on Networked Systems Design and Implementation USENIX Association

Figure 2: Determining flow network path.
performance metrics and the required aggregation pro-
cessing, our verdict generator for aggregated flow met-
rics, and the operation of our centralized controller.
4.1 Datacenter flow path discoveryCentral to our approach is the ability to scalably and
feasibly discover flow path information within the dat-
acenter. While switch CPU/dataplane limits complicate
this task, the regularity of the network topology aids us.
4.1.1 Topological constraints
Figure 2 depicts the pathfinding scheme we use in the
Facebook datacenter. To aid discussion, the diagram
shows a restricted subset of an unfolded version of the
topology, with source hosts on the left and destinations
on the right; the topology is symmetric so our approach
works in either direction. Note that cross-pod traffic has
only two ECMP decisions to make: which Agg switch
(and thus, core plane) to transit after the ToR, and which
core switch to use within the core plane. Each core plane
is only connected to one Agg switch per pod, so the des-
tination Agg switch is fixed given the core plane.
The source and destination racks and ToRs are fixed
for any particular host pair, and can be determined by
examining the IP addresses of a flow. Thus, for cross-pod
traffic, the choice of core switch uniquely determines the
flow’s path, as the Agg switches are then constrained on
both sides. For intra-pod traffic it suffices to identify the
Agg switch used to connect the ToRs.
In the presence of a total link error, the network
attempts to forward traffic using an alternative, non-
shortest path advertised as a backup route. While we do
not address this case in our proof of concept, we discuss
the impacts of link failures in Section 6.3.
4.1.2 Packet marking
We assign an ID to each core switch, that is stamped
on all packets traversing the switch. Note that the stamp
need not be inserted by the core switch itself—the Agg
switches on either side are also aware of the core’s iden-
tity and are equally capable of marking the packet. We
use Linux eBPF (Extended Berkeley Packet Filter) [3]
along with bcc (BPF Compiler Collection) [2] instru-
mentation at end hosts to read packet markings and de-
rive flow paths. Our naive implementation imposes less
than 1% CPU overhead (top row of Table 2), but room
for optimization remains.
Several candidate header fields can be used for mark-
ing, and the best choice likely depends on the details of
any given deployment. One possibility is the IPv6 flow
label field; a 20-bit ID could scale to a network with over
a million core switches. However, the ASIC in our Agg
switches does not currently support modifying this field.
Thus, for our proof of concept, we instead mark the IPv6
DSCP field, which is supported at line rate and requires
only a constant number of rules (one per uplink).
While DSCP suffices for a proof of concept, its length
limits the number of discernible paths. Furthermore, dat-
acenter operators often use DSCP to influence queuing,
limiting the available bits. One alternative is to mark the
TTL field1. A packet marked at a downward-facing Agg
traverses exactly two more hops before arriving at the
destination host; a host could recover an ID in the TTL
field as long as the value was in the range 3–255.
4.1.3 General case
More complex topologies might preclude our ability
to compute paths from a single stamp. In the event that
traffic is made up of long-lived flows (as it is, for ex-
ample, for the web and cache servers we tested) we can
leverage the match/mark capability that many switching
ASICs possess to implement a form of marking reminis-
cent of previous proposals for IP traceback [36].
Suppose there are H hops between source and destina-
tion system, and C routing choices per hop. If we want to
determine the path taken by a flow at the first hop where
a routing choice must be made, the operating system can
mark C packets, each with the IPv6 flow label set to the
possible IDs of each switch that the packets could transit
for that hop. Switches would be configured with a sin-
gle rule that would examine the flow label—if it matches
the switch ID, the switch would set a single DSCP bit
to 1. When the end host receiving the packet notes the
DSCP bit set to 1, it could signal the sender with the ID
of the switch that was transited at that hop (that is, the
flow label of the packet when the DSCP bit was set). For
example, it could do this by setting a specific DSCP bit
in the ACK packet while setting the flow label of the re-
turn packet to the switches ID. Thus, if the flow sends
≥ (H ·C) packets in total it can discover the entire path,
at the expense of just a single rule per switch. While we
have not deployed this approach in production, we vali-
dated that our switch hardware can implement it. While
this method finds out path information hop by hop, par-
tial path information can still be useful to our system. We
discuss this further in Section 6.4.
4.2 Aggregating host metrics & path dataGiven the availability of per-flow path information,
we show that both transport-layer and system-call-timing
1Constraints exist on the use of TTL as well, such as in thepresence of traceroute or eBGP session protection [15].
USENIX Association 14th USENIX Symposium on Networked Systems Design and Implementation 599

metrics can be used to find under-performing links in
real-world scenarios. We consider both latency-sensitive,
client/server production applications [35] and bulk-flow,
large-scale computation applications [4, 16, 22]. Mixed
traffic is considered in Section 6.2.
4.2.1 Latency sensitive services
Web servers and caches within the Facebook data-
center service user requests, where low latency is desir-
able [43]. Faults harm performance, where either drops
or queuing delay can result in unacceptable increases in
request latency. Since loss is often a sign of network
congestion, the TCP state machine tracks various related
statistics. These include the number of retransmitted
packets, the congestion window (cwnd) and the slow-
start threshold (sstresh). Latency is also tracked us-
ing smoothed round trip time (srtt). When considered
in isolation, these metrics are limited in usefulness; while
a retransmit signifies diminished performance for a flow,
it does not provide any predictive power for the underly-
ing cause, or whether a given set of flows experiencing
retransmits are doing so for the same underlying reason.
Furthermore, while cwnd and ssthresh decrease with
loss, the specific values depend highly on the application
pattern. For example, bulk flows tend to have a larger
congestion window than mouse flows. Thus, comparing
any given flow against an average can be difficult, since
it is unclear whether ‘worse’ performance than average
is due to a network issue or traffic characteristics.
However, when augmented with path data, these met-
rics can become valuable indicators of faults. To illus-
trate the effectiveness of this approach, we induced a net-
work fault impacting two hosts: one web server, and one
cache server. In each case, the local ToR is connected
to four aggregation switches. Using iptables rules,
each host dropped 0.5% of incoming packets that tran-
sited the link from the first aggregation switch to the ToR
switch. We then measured the TCP metrics for outgoing
flows, grouped by which aggregation switch (and, thus,
rack downlink) was transited on the way to the host.
Rows 1–6 and 9–14 in Table 1 depict the cwnd,
ssthresh, and retransmission count distributions
grouped by inbound downlink for production cache (C)
and web servers (W) respectively. While we aggregate
the values for the non-faulty links into a single series
(the even rows in the table), each individual non-faulty
link follows the same aggregate distribution with little
variation. On the other hand, the faulty-link distribution
for each metric is significantly skewed—towards smaller
numbers for cwnd and ssthresh, and larger for re-
transmits. Rows 17–22 show that cwnd, ssthresh,
and retransmits provide a similarly strong signal when
the link fault impacts traffic in the outbound direction in-
stead. srtt is effective for detecting faults that induce
latency but not loss; we defer details to Section 5.3.1.
4.2.2 Bulk data processing
Next, we consider bulk data processing workloads.
Commonly used frameworks like Hadoop involve read-
ing large volumes of data from various portions of the
network; slowdowns caused by the network can have a
disproportionate impact on job completion times due to
stragglers. While the TCP metrics above work equally
well in the case of Hadoop (not shown), the high-
volume flows in Hadoop allow us to adopt a higher-level,
protocol-independent metric that depends on the buffer
dynamics present in any reliable transport protocol.
Consider the case of an application making a block-
ing system call to send data. Either there will be room
present in the connection’s network buffer, in which case
the data will be buffered immediately, or the buffer does
not have enough space and causes the application to wait.
As packets are transmitted, the buffer is drained. How-
ever, if a fault induces packet drops, packets need to be
retransmitted and thus the goodput of the network buffer
drops. Correspondingly, the buffer stays full more of
the time and the distribution of the latency of send()
and similar blocking system calls skews larger. Delays
caused by packet reordering have similar impacts. Non-
blocking sends exhibit this behavior too; we can instru-
ment either the select() or epoll_ctl() system
calls to get insight into buffer behavior.
To demonstrate this, we consider a synthetic traffic
pattern representative of the published flow-size distribu-
tions for Hadoop workloads present in Facebook’s data-
centers [35]. Specifically, we designate one server in our
testbed (see Section 5.1 for details) as a sink and the re-
mainder as sources. In addition, we induce a random
packet drop impacting 1 of 9 testbed core switches. For
a fixed period of time, each server in a loop creates a
fixed number of simultaneous sender processes. Each
sender starts a new flow to the sink, picks a flow size from
the Facebook flow-size distribution for Hadoop servers
and transmits the flow to completion, while recording the
wait times for each select() system call.
Rows 23–24 in Table 1 show the distributions of
select() latencies for flows grouped by core switch
transited in our private testbed—again, the non-faulty
distributions are aggregated. Faulty links on the im-
pacted core yield a dramatically shifted distribution. Ad-
ditionally, the distributions for non-faulty cores show lit-
tle variation (omitted for space). This allows us to differ-
entiate between faulty and normal links and devices. We
found the metric to be sensitive to drop rates as low as
0.5%. Moreover, this signal can also be used for caches,
due to the long-lived nature of their flows. Rows 7–8 and
15–16 in Table 1 show the distribution of epoll() and
select() latencies for flows on faulty and non-faulty
links in production and on the testbed, respectively; in
both cases, the faulty link distribution skews larger.
600 14th USENIX Symposium on Networked Systems Design and Implementation USENIX Association
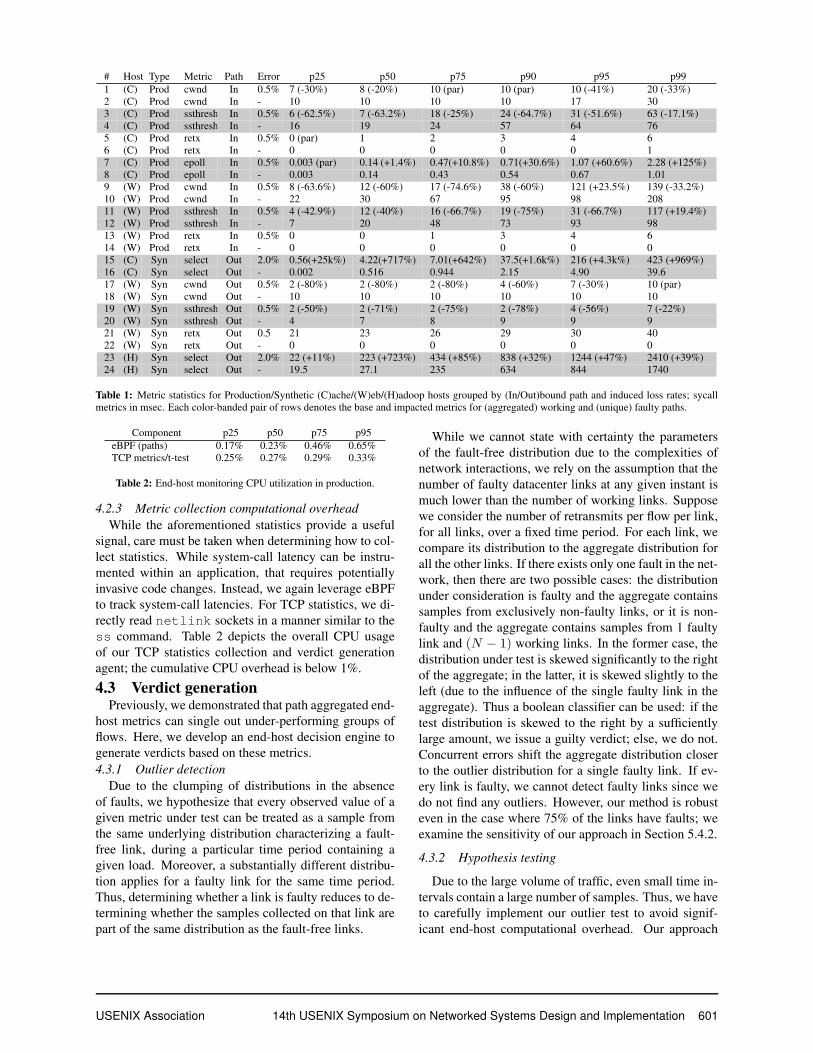
# Host Type Metric Path Error p25 p50 p75 p90 p95 p99
1 (C) Prod cwnd In 0.5% 7 (-30%) 8 (-20%) 10 (par) 10 (par) 10 (-41%) 20 (-33%)
2 (C) Prod cwnd In - 10 10 10 10 17 30
3 (C) Prod ssthresh In 0.5% 6 (-62.5%) 7 (-63.2%) 18 (-25%) 24 (-64.7%) 31 (-51.6%) 63 (-17.1%)
4 (C) Prod ssthresh In - 16 19 24 57 64 76
5 (C) Prod retx In 0.5% 0 (par) 1 2 3 4 6
6 (C) Prod retx In - 0 0 0 0 0 1
7 (C) Prod epoll In 0.5% 0.003 (par) 0.14 (+1.4%) 0.47(+10.8%) 0.71(+30.6%) 1.07 (+60.6%) 2.28 (+125%)
8 (C) Prod epoll In - 0.003 0.14 0.43 0.54 0.67 1.01
9 (W) Prod cwnd In 0.5% 8 (-63.6%) 12 (-60%) 17 (-74.6%) 38 (-60%) 121 (+23.5%) 139 (-33.2%)
10 (W) Prod cwnd In - 22 30 67 95 98 208
11 (W) Prod ssthresh In 0.5% 4 (-42.9%) 12 (-40%) 16 (-66.7%) 19 (-75%) 31 (-66.7%) 117 (+19.4%)
12 (W) Prod ssthresh In - 7 20 48 73 93 98
13 (W) Prod retx In 0.5% 0 0 1 3 4 6
14 (W) Prod retx In - 0 0 0 0 0 0
15 (C) Syn select Out 2.0% 0.56(+25k%) 4.22(+717%) 7.01(+642%) 37.5(+1.6k%) 216 (+4.3k%) 423 (+969%)
16 (C) Syn select Out - 0.002 0.516 0.944 2.15 4.90 39.6
17 (W) Syn cwnd Out 0.5% 2 (-80%) 2 (-80%) 2 (-80%) 4 (-60%) 7 (-30%) 10 (par)
18 (W) Syn cwnd Out - 10 10 10 10 10 10
19 (W) Syn ssthresh Out 0.5% 2 (-50%) 2 (-71%) 2 (-75%) 2 (-78%) 4 (-56%) 7 (-22%)
20 (W) Syn ssthresh Out - 4 7 8 9 9 9
21 (W) Syn retx Out 0.5 21 23 26 29 30 40
22 (W) Syn retx Out - 0 0 0 0 0 0
23 (H) Syn select Out 2.0% 22 (+11%) 223 (+723%) 434 (+85%) 838 (+32%) 1244 (+47%) 2410 (+39%)
24 (H) Syn select Out - 19.5 27.1 235 634 844 1740
Table 1: Metric statistics for Production/Synthetic (C)ache/(W)eb/(H)adoop hosts grouped by (In/Out)bound path and induced loss rates; sycall
metrics in msec. Each color-banded pair of rows denotes the base and impacted metrics for (aggregated) working and (unique) faulty paths.
Component p25 p50 p75 p95
eBPF (paths) 0.17% 0.23% 0.46% 0.65%
TCP metrics/t-test 0.25% 0.27% 0.29% 0.33%
Table 2: End-host monitoring CPU utilization in production.
4.2.3 Metric collection computational overhead
While the aforementioned statistics provide a useful
signal, care must be taken when determining how to col-
lect statistics. While system-call latency can be instru-
mented within an application, that requires potentially
invasive code changes. Instead, we again leverage eBPF
to track system-call latencies. For TCP statistics, we di-
rectly read netlink sockets in a manner similar to the
ss command. Table 2 depicts the overall CPU usage
of our TCP statistics collection and verdict generation
agent; the cumulative CPU overhead is below 1%.
4.3 Verdict generationPreviously, we demonstrated that path aggregated end-
host metrics can single out under-performing groups of
flows. Here, we develop an end-host decision engine to
generate verdicts based on these metrics.
4.3.1 Outlier detection
Due to the clumping of distributions in the absence
of faults, we hypothesize that every observed value of a
given metric under test can be treated as a sample from
the same underlying distribution characterizing a fault-
free link, during a particular time period containing a
given load. Moreover, a substantially different distribu-
tion applies for a faulty link for the same time period.
Thus, determining whether a link is faulty reduces to de-
termining whether the samples collected on that link are
part of the same distribution as the fault-free links.
While we cannot state with certainty the parameters
of the fault-free distribution due to the complexities of
network interactions, we rely on the assumption that the
number of faulty datacenter links at any given instant is
much lower than the number of working links. Suppose
we consider the number of retransmits per flow per link,
for all links, over a fixed time period. For each link, we
compare its distribution to the aggregate distribution for
all the other links. If there exists only one fault in the net-
work, then there are two possible cases: the distribution
under consideration is faulty and the aggregate contains
samples from exclusively non-faulty links, or it is non-
faulty and the aggregate contains samples from 1 faulty
link and (N − 1) working links. In the former case, the
distribution under test is skewed significantly to the right
of the aggregate; in the latter, it is skewed slightly to the
left (due to the influence of the single faulty link in the
aggregate). Thus a boolean classifier can be used: if the
test distribution is skewed to the right by a sufficiently
large amount, we issue a guilty verdict; else, we do not.
Concurrent errors shift the aggregate distribution closer
to the outlier distribution for a single faulty link. If ev-
ery link is faulty, we cannot detect faulty links since we
do not find any outliers. However, our method is robust
even in the case where 75% of the links have faults; we
examine the sensitivity of our approach in Section 5.4.2.
4.3.2 Hypothesis testing
Due to the large volume of traffic, even small time in-
tervals contain a large number of samples. Thus, we have
to carefully implement our outlier test to avoid signif-
icant end-host computational overhead. Our approach
USENIX Association 14th USENIX Symposium on Networked Systems Design and Implementation 601

computes a lightweight statistic for each metric under
consideration, for each link, over successive fixed-length
(10 seconds by default) sampling periods. Each end
host generates verdicts for links associated with its own
pod. Thus, for each flow, there are a few tens of pos-
sible core-to-aggregation downlinks, and four possible
aggregation-to-ToR downlinks. Having acquired TCP
metrics and path information for all flows via our col-
lection agent, we bucket each sample for the considered
metrics into per-link, per-direction buckets. Thus, each
metric is bucketed four times: into the inbound and out-
bound rack and aggregation (up/down)links traversed.
For TCP retransmit and system-call latency met-
rics, we compute the t-statistic from the single-tailed
1-sample Student’s t-test using a low-overhead and
constant-space streaming algorithm. To do so we need
the average and standard deviation per distribution, and
the aggregate average—all of which are amenable to
streaming computation via accumulators, including stan-
dard deviation via Welford’s Algorithm [41]. We then in-
put the t-statistic to the test. The t-test compares a sample
mean to a population mean, rejecting the null hypothesis
if the sample mean is larger—in our case, if the tested
link has more retransmits or higher system-call latency
than the other links in aggregate. In every time period,
each host checks if the t-statistic is greater than 0 and
the p-value ≤ 0.05. If so, we reject the null hypothesis,
considering the link to be faulty.
This approach limits the computational overhead at
any individual host since it only needs to track statistics
for its own select()/epoll() calls and TCP statis-
tics. The bottom row of Table 2 depicts the CPU utiliza-
tion at a single production web server for this approach
over 12 hours. The t-test computation and netlink
TCP statistics reader uses roughly 0.25% of CPU usage.
This result is roughly independent of how often the ver-
dict is computed; the majority of the CPU usage is incre-
menting the various accumulators that track the compo-
nents of the t-statistic. The bcc/eBPF portion, however,
has periods of relatively high CPU usage approaching
1% overall, due to the need to periodically flush fixed-
sized kernel structures that track flow data.
For cwnd, ssthresh and srtt TCP statistics, we
find the student’s t-test to be too sensitive in our envi-
ronment. However, a modified 2-sample Kolmogorov-
Smirnov (KS-2) test provides an effective alternative.
Specifically, we compare two down-sampled distribu-
tions: the 99-point {p1, p2, . . . , p99} empirical distri-
bution for the link under consideration, and a similarly
defined distribution for the other links in aggregate.
4.4 Centralized fault localizationWhile individual hosts can issue verdicts regarding
link health, doing so admits significant false positives.
Instead, we collate host verdicts at a centralized con-
troller that attempts to filter out individual false positives
to arrive at a network-wide consensus on faulty links.
4.4.1 Controller processing
Assuming a reliable but noisy end-host-level signal,
we hypothesize that false positives should be evenly dis-
tributed amongst links in the absence of faults. Note that
while some networks might contain hotspots that skew
flow metrics and violate this assumption, traffic in the
Facebook datacenter is evenly distributed on the consid-
ered timescales, with considerable capacity headroom.
We use a centralized controller to determine if all
links have approximately the same number of guilty (or
not guilty) verdicts, corresponding to the no-faulty-links
case. Hosts write link verdicts—generated once per
link every ten seconds—to an existing publish-subscribe
(pub-sub) framework used for aggregating log data. The
controller reads from the pub-sub feed and counts the
number of guilty verdicts per link from all the hosts, over
a fixed accumulation period (10 seconds by default). The
controller flags a link as faulty if it is a sufficiently large
outlier. We use a chi-squared test with the null hypothe-
sis that, in the absence of faults, all links will have rela-
tively similar numbers of hosts that flag it not-guilty. The
chi-square test outputs a p-value; if it is ≤ 0.05, we flag
the link with the least not-guilty verdicts as faulty. We
iteratively run the test on the remaining links to uncover
additional faults until there are no more outliers.
4.4.2 Computational overhead
The controller has low CPU overhead: a Python im-
plementation computes 10,000 rounds for tens of links
in <1 second on a Xeon E5-2660, and scales linearly
in the number of links. Each host generates two ver-
dicts per link (inbound/outbound) every 10 seconds, with
O(1000s) hosts per pod. Each verdict consists of two 64-
bit doubles (t-stat and p-value) and a link ID. In total, this
yields a streaming overhead of < 10 Mbps per pod, well
within the capabilities of the pub-sub framework.
5. EVALUATIONWe now evaluate our approach within two environ-
ments: the Facebook datacenter described in Section 3.1,
and a small private testbed. First, we describe our test
scenario in each network, and provide a motivating ex-
ample for real-world fault detection. We then consider
the speed, sensitivity, precision, and accuracy of our ap-
proach, and conclude with experiences from a small-
scale, limited-period deployment at Facebook.
5.1 Test environmentWithin one of Facebook’s datacenters, we instru-
mented 86 web servers spread across three racks with the
monitoring infrastructure described in Section 4. Path
markings are provided by a single Agg switch, which
sets DSCP bits based on the core switch from which the
packet arrived. (Hence, all experiments are restricted to
602 14th USENIX Symposium on Networked Systems Design and Implementation USENIX Association

0.0
0.2
0.4
0.6
0.8
1.0
t-te
st p-v
alu
e Link A
Link B
Link C
Non-faulty links
0 100 200 300 400 500 600 700 800 900
Time (seconds)
0.0
0.2
0.4
0.6
0.8
1.0
chi-square
p-v
alu
e
All links
All - {A}
All - {A,B}
All - {A,B,C}
Figure 3: Single host t-test output (top) and controller chi-square out-
put (bottom) for three separate link faults.
the subset of traffic that transits the instrumented Agg
switch, and ignores the remainder.) To inject faults, we
use iptables rules installed at end hosts to selectively
drop inbound packets that traversed specific links (ac-
cording to DSCP markings). For example, we can con-
figure an end host to drop 0.5% of all inbound packets
that transited a particular core-to-Agg link. This has the
effect of injecting faults at an arbitrary network location,
yet impacting only the systems that we monitor.2
Our private testbed is a half-populated k = 6 fat tree,
consisting of 3 (of 6) pods of 9 hosts each, connected
via 9 core switches. Each core has three links, one to
each pod. To inject faults, we use a ‘bump in the wire’ to
perturb packets on a link. For example, consider a faulty
core that drops (or delays) a random subset of packets
traversing a link to an Agg. Thus, to inject a fault at that
link, we replace the link connecting the core to the Agg
with a link connecting it to a network bridge, which is in
turn connected to the Agg. The bridge is a Linux host
that forwards packets, randomly dropping (or delaying)
a subset of packets in a given direction. We implement
ECMP using source routing; the 5-tuple therefore allows
us to determine the paths packets traverse in our testbed.
5.2 Motivating exampleOver a five-minute interval in the Facebook datacen-
ter, we induced faults on links from three different core
switches to the instrumented Agg, denoted A, B and C.
In particular, we induce faults in the order A, B, C, with
a one-minute gap; we then removed the faults in reverse
order with the same gap. Each fault is a random 0.5%
packet drop (1 in 200 packets). In aggregate, this corre-
sponds to an overall packet loss rate of < 0.02%.
The top portion of Figure 3 depicts the t-test output
for a single host. Flows are grouped according to incom-
ing core downlink, and TCP retransmission statistics are
2Note that while all monitored hosts will see the same loss rateacross the link, the actual packets dropped may vary becauseiptables functions independently at each host.
aggregated into ten-second intervals. For a single host,
for every non-faulty link (every series in black, and the
faulty links before/after their respective faults) the t-test
output is noisy, with p-values ranging from 0.15 to 1.0.
However, during a fault event the p-value drops down to
near 0. Close to 100% of the hosts flag the faulty links as
guilty, with few false positives.
These guilty verdicts are sent to our controller. The
controller runs the chi-squared test every 10 seconds us-
ing each core downlink as a category; it counts the num-
ber of non-guilty verdicts from the end hosts as metric
and flags an error condition if the output p-value ≤ 0.05.
Note that this flag is binary, indicating that there exists
at least one active fault; the guilty verdict count must be
consulted to identify the actual guilty link. The bottom
portion of Figure 3 depicts the controller output using
this mechanism. We depict the output of the test for all
paths (in red), and for the set of paths excluding faulty
paths {A}, {A,B} and {A,B,C} (in yellow, purple and
black, respectively). These results indicate that the con-
troller will flag the presence of a fault as long as there is
at least one faulty link in the set of paths under consider-
ation, thus supporting an iterative approach.
5.3 Speed and sensitivityFor our mechanism to be useful, it must be able to
rapidly detect faults, even if the impact is slight. More-
over, ideally we could detect faults that result in in-
creased latency, not just those that cause packet loss.
5.3.1 Loss rate sensitivity
We performed a sensitivity analysis on the amount of
packet loss we can detect in the datacenter. While loss
rates ≥ 0.5% are caught by over 90% of hosts, we see
a linear decrease in the number of guilty verdicts as the
loss decreases past that point—at 0.1% drop rate, only
≈ 25% of hosts detect a fault in any given 10-second in-
terval, reducing our controller’s effectiveness. However,
we can account for this by prolonging the interval of the
controller chi-square test. Figure 4a depicts the distribu-
tion of p-values outputted by the controller for a given
loss rate and calculation interval. Each point with error
bars depicts the median, p5 and p95 p-values outputted
by the controller during a fault occurrence; each loss rate
corresponds to a single series. We see that while a 0.25%
loss is reliably caught with a 20-second interval, a 0.15%
loss requires 40 seconds to be reliably captured; lower
loss rates either take an unreasonably large (more than a
minute) period of time to be caught or do not get detected
at all. Note that in the no-fault case, no false positives are
raised despite the increased monitoring interval.
5.3.2 High latency detection
In our private testbed, we induced delays for traf-
fic traversing a particular core switch. To do this, we
used Linux tc-netem on our ‘bump-in-the-wire’ net-
work bridges to add constant delay varying from 100
USENIX Association 14th USENIX Symposium on Networked Systems Design and Implementation 603

10 40 60 120 180
Controller interval (seconds)
0.05
0.20
0.40
0.60
0.80
1.00
Ch
isq
ua
re p
-va
lue
No drops
0.05%
0.1%
0.15%
0.2%
0.25%
(a) Single fault loss rate sensitivity.
10 40 60 120 180
Controller interval (seconds)
0.05
0.20
0.40
0.60
0.80
1.00
Ch
isq
ua
re p
-va
lue
Filtered
0.05%
0.1%
0.15%
0.2%
0.25%
(b) Masked fault sensitivity.
10 40 60 120 180
Controller interval (seconds)
0.05
0.20
0.40
0.60
0.80
1.00
Ch
isq
ua
re p
-va
lue
1/4 linecards error
1/2 linecards error
3/4 linecards error
(c) Linecard faults.
Figure 4: Controller chi-square p-value convergence for various faults vs. controller interval length.
Request
bytes
Latency
msec
p50 p75 p95 p99
100 - 1643 1680 2369 2476
100 0.1 3197 3271 4745 4818
100 1.0 10400 10441 19077 19186
8000 - 4140 4778 619 7424
8000 0.1 6809 7510 9172 11754
8000 0.5 11720 14024 18367 21198
Table 3: srtt_us distribution vs. additional latency and request size.
The no-additional-latency case is aggregated across all non-impacted
links, while the others correspond to a single (faulty) link.
microseconds to 1 millisecond (a typical 4-MB switch
buffer at 10 Gbps can incur a maximum packet latency
of roughly 3 milliseconds before overflowing). We then
ran client/server traffic with a single pod of 9 HHVM [5]
servers serving static pages, and two pods (18 hosts) con-
figured as web clients running Apache Benchmark [1].
Each server handled 180 simultaneous clients and served
either small (100-B) or medium (8-KB) requests.
Table 3 depicts the distributions for TCP srtt_us
TCP at a particular end host as a function of induced la-
tency and request size. As in previous experiments, the
distributions of non-impacted links are very close to each
other, while the distribution of the latency heavy link is
clearly differentiable. No drops were detected in the 100-
B case; due to our use of 1-Gbps links, a handful of drops
comparable to the no-fault case were detected in the 8-
KB case. The modified KS-2 test operating over a 10-
second interval correctly flags all intervals experiencing
a latency increase, while avoiding false positives.
5.4 Precision and accuracyNext, we demonstrate the precision and accuracy of
the system in the presence of concurrent and correlated
faults, as well as the absence of false positives.
5.4.1 Concurrent unequal faults
A large network will likely suffer concurrent faults of
unequal magnitude, where the largest fault may mask the
presence of others. While we surmise that the most vis-
ible fault will be easily diagnosable, ideally it would be
possible to parallelize fault identification in this case.
We consider a scenario in the Facebook datacenter
with two concurrent faults on distinct core-to-Agg switch
links: one causing a packet loss rate of 0.5%, and one
with a rate that varies from 0.25% to 0.15% (which we
can easily identify in isolation). Using TCP retransmit
statistics, the high-loss fault was flagged by almost all
the hosts the entire time, while the flagging rate for the
lower-impact fault depends roughly linearly on its mag-
nitude. However, the drop-off in guilty verdicts is steeper
in the presence of a masking, higher-impact fault. As a
result, the 10- and 20-second controller intervals that flag
the low-loss-rate faults in isolation no longer suffice.
Figure 4b depicts the controller chi-square p-value
outputs for the set of paths excluding the one suffering
from the readily identified larger fault; each series corre-
sponds to a different loss rate for the smaller fault. The
interval needed to detect such “masked” faults is longer;
a 0.25% loss rate requires a 40-second interval to reliably
be captured vs. 20 seconds in the unmasked case (Fig-
ure 4a), while a 0.15% rate requires over three minutes.
5.4.2 Large correlated faults
So far, we have considered faults impacting a small
number of uncorrelated links. However, a single hard-
ware fault can affect multiple links. For example, each
Agg switch contains several core-facing linecards, each
providing a subset of the switch’s cross-pod capacity.
A linecard-level fault would thus affect several uplinks.
Similarly, a ToR-to-Agg switch link might be impacted,
affecting a full quarter of the uplinks for that rack’s hosts.
Our approach relies on the student’s t-test picking out-
liers from a given average, with the assumption that the
average represents a non-broken link. However, certain
faults might impact a vast swath of links, driving the av-
erage performance closer to that of the impacted links’.
To test this scenario, we induce linecard-level faults
on 25%, 50%, 75% and 100% of the uplinks on the in-
strumented Agg switch in the Facebook datacenter. The
per-link loss rate in each case was 0.25%. With 100%
faulty links, our method finds no faults since no link is an
outlier—a natural consequence of our approach. How-
604 14th USENIX Symposium on Networked Systems Design and Implementation USENIX Association

MetricError p50 p90 p95 p99
retx - 0 0 1 2
retx 0.5% 1 3 4 5
cwnd - 10 18 26 39
cwnd 0.5% 9 10 16 28
Table 4: TCP congestion window and retransmit distributions when
binning by remote rack with a faulty rack inducing a 0.5% drop rate.
ever, in all other cases our approach works if the hosts
declare paths faulty when the p-value ≤ 0.1. Figure 4c
shows the controller performance for various linecard-
level faults as a function of interval length. A 10-second
interval captures the case where 25% of uplinks experi-
ence correlated issues, but intervals of 20 and 40 seconds,
respectively are required in the 50% and 75% cases.
5.4.3 False positives
The longer our controller interval, the more sensitive
we are to catching low-impact faults but the more likely
we are to be subject to false positives. We ran our system
in production in the absence of any (known) faults with
intervals ranging from 10 seconds to an hour. Even with
30-minute intervals, the lowest p-value over 42 hours of
data is 0.84; only one-hour intervals generated any false
positives (p ≤ 0.05) in our data. We note, however, that
we need not support arbitrarily large intervals. Recall
that an interval of roughly three minutes is enough to get
at least an intermittent fault signal for a 0.1% loss rate.
5.4.4 Granular faults and alternative binnings
By default, our approach bins flow metrics by path. In
certain cases, however, a fault may only impact a specific
subset of traffic. For example, traffic from a particular
subnet might exhibit microburst characteristics, periodi-
cally overflowing switch buffers and losing packets.
Alternative binnings can be employed to identify such
“granular” faults. To illustrate, we induced a fault at a
single cache server, in which packets from exactly one
remote rack are dropped at a rate of 0.5%. We then
binned traffic by remote rack. Table 4 depicts the distri-
bution of congestion window and retransmit by remote
rack; as before, the distributions for non-impacted bins
are all close to each other. The KS-2 test and t-test suc-
cessfully pick out the fault without false positives using
the cwnd and retransmissions metrics respectively. Note
such alternative binning can help diagnose faults even if
there is no path diversity—in this case, the alternatives
are provided by application load balancing.
5.5 Small-scale deployment experienceWhile our experiments focus on injected failures, we
are obviously interested in determining whether our sys-
tem can successfully detect and localize network anoma-
lies “in the wild”. Thus, we examine the performance
of our system over a relatively long time period (in the
absence of any induced failures) to answer the following
questions: “Does our system detect performance anoma-
−300 −200 −100 0 100 200 300
Seconds since linecard fault
0
5
10
15
20
25
Meancongestionwindow
Faulty linecard links average
Regular linecard links average
Figure 5: Mean cwnd per (host,link) during linecard fault.
lies?” “Do non-issues trigger false positives?” “Do
we notice anomalies before or after Facebook’s existing
fault-detection services catch it?”
To answer these questions, we deployed our system
on 30 hosts for a two-week period in early 2017. As
an experimental system, deployment was necessarily re-
stricted; our limited detection surface thus impacted our
chance of detecting partial faults. An operator of another
large-scale datacenter suggests that, in their experience,
partial failures occur at a rate of roughly 10 per day in a
network containing O(1M) hosts [28]. It is not surpris-
ing, then, that our two-week trial on only 30 hosts did
not uncover any partial faults. We were, however, able to
derive useful operational experience that we relate below.
5.5.1 Response to organic failure
On January 25th, 2017, the software agent managing
a switch linecard that our system was monitoring failed.
The failure had no immediate impact on traffic; the data-
plane continued to forward traffic according to the most
recent ruleset installed by the agent. Thus, the initial fail-
ure is invisible to and explicitly outside the scope of our
tool, which focuses only on faults that impact traffic.
Roughly a minute later, however, as the BGP peer-
ings between the linecard and its neighbors began to
time out, traffic was preemptively routed away from the
impacted linecard. Thus, applications saw no disrup-
tion in service despite the unresponsive linecard control
plane. Yet, we observe that as traffic was routed away
from the failed linecard, the distributions of TCP’s cwnd
and ssthresh metrics for the traffic remaining on the
linecard’s links rapidly diverged from the values on other
links in the equivalence set. Figure 5 depicts the per-
link mean congestion window measured by every host,
aggregated per-linecard and averaged across every corre-
sponding host, with the afflicted linecard colored red.
The deviations are immediate and significant, with the
mean cwnd dropping over 10% in the first interval after
USENIX Association 14th USENIX Symposium on Networked Systems Design and Implementation 605

the majority of traffic is routed away, and continually di-
verging from the working links thereafter. Furthermore,
the volume of measured flows at each host traversing the
afflicted linecard rapidly drops from O(1000s) to O(10s)
per link. By contrast, one of Facebook’s monitoring sys-
tems, NetNORAD [6], took several minutes to detect the
unresponsive linecard control plane and raise an alert.
It is important to note that in this case, we did not catch
the underlying software fault ourselves; that honor goes
to BGP timeouts. However, we do observe a sudden shift
in TCP statistics in real time as traffic is routed away,
as our system was designed to do. With respect to our
stated goal—to pinpoint the links responsible for delete-
rious traffic impact—our system performs as expected.
Thus, this anecdote shows that our system can compli-
ment existing fault-detection systems, and provide rapid
notification of significant changes in network conditions
on a per-link or per-device basis.
5.5.2 Filtering normal congestion events
During the monitoring period, no other faults were de-
tected by the system. While a small number of false pos-
itives were generated in every interval, the controller fil-
ters out these indications since the noise is spread across
the monitored links. However, we noticed that the num-
ber of false positives had periodic local maxima around
1200 and 1700 GMT. Furthermore, these were correlated
with the raw (i.e., independent of flow/path) TCP retrans-
mit counts tracked by the end hosts. Given that they oc-
curred at similar times each day and were evenly spread
across all the monitored hosts, we surmise that these re-
transmits were not due to network faults, but organically
occurring congestion. This experience provides some
confidence that our system effectively distinguishes be-
tween transient congestion and partial faults.
6. APPLICABILITYHere, we consider the applicability of our approach in
various challenging scenarios, e.g., datacenters with het-
erogeneous traffic patterns, topologies less amenable to
single-marking path discovery (either by design or due
to failed links re-routing traffic), virtualized multi-tenant
environments, and more. We first list some conditions to
which our approach is resilient. Subsequently, we clar-
ify the extent to which traffic homogeneity, link failures
and topology impact the suitability of our approach. We
conclude with a discussion on known limitations.
6.1 Surmountable issuesWhile we have access to only one production envi-
ronment, we have conducted sensitivity analyses in our
testbed to consider alternative deployments. Due to
space limits, we summarize our findings here, but pro-
vide more extensive discussion in Appendix B.
1. VMs and high CPU utilization: Our datacenter
tests were on bare metal; we find the approach
works equally well in a hypervisor-based environ-
ment, even when the hardware CPU is fully taxed.2. Mixed, over-subscribed and uneven traffic: The
Facebook datacenter lacks saturated links and un-
even load. We consider a mixed workload with
latency sensitive and core-saturating bulk traffic,
where server load ranges from 1×—16×.3. TCP settings: Datacenter hosts employ NIC of-
fload features such as TSO. Turning these opti-
mizations off does not obscure TCP or timing-
based signals; neither does varying buffer sizes
across three orders of magnitude (16 MB—16 KB).
6.2 Traffic homogeneityFacebook traffic is highly load balanced [35], aiding
our outlier-based detection approach. We are optimistic,
however, that our method is also applicable to datacen-
ters with more heterogeneous and variable workloads.
That said, outlier analysis is unlikely to succeed in the
presence of heterogeneous traffic if we do not carefully
pick the links or switches that we compare against each
other—specifically, if we fail to form a valid ES.
In the case of our experiments at Facebook, the ES we
used was the set of downlinks from the network core into
a pod. ECMP routing ensured that these links did form an
ES; all cross-pod flows had an equal chance of mapping
to any of these links, and the path from these links down
to the hosts were equal cost. This characteristic notably
holds true regardless of the specific mix of traffic present.
Thus, we hypothesize that on any network where such an
ES can be formed, our approach works regardless of traf-
fic homogeneity. To demonstrate this, we ran our fat-tree
testbed with a worst case scenario of heterogeneous traf-
fic: running synthetic bulk transfer and latency sensitive
RPC traffic, with heavy traffic skew (with per host-load
ranging from 1–16× the minimum load). Furthermore,
we overloaded the network core by artificially reducing
the number of links. Even in this case, our t-test classifier
operating on the select() latency metric was able to
successfully differentiate the outlier link.
6.3 Link failuresIn addition to being able to detect and localize partial
faults, our system must be able to account for total link
failures, which can confound our ability to determine a
flow’s path through the network due to re-routing. Con-
sider the outcome of a total link failure on the fate of
traffic routed via that link. There are three possible out-
comes for such traffic: (1) traffic is redirected at a prior
hop to a working alternative path, (2) traffic is re-routed
by the switch containing the dead-end link to a backup
non-shortest path, and (3) traffic is black holed and the
flow stops (the application layer might restart the flow).
Cases (1) and (3) do not affect our approach. ECMP
routing will ensure that flows are evenly distributed
among the surviving links, which still form an ES (al-
606 14th USENIX Symposium on Networked Systems Design and Implementation USENIX Association
beit one smaller in size than before the failure). Case
(2) can impact our approach in two ways. First, traffic
taking a longer path will likely see worse performance
compared to the rest of the traffic that traverses links
on the backup path—harming the average performance
on that path. Moreover, backup path performance might
drop due to unfair loading as more flows join. Presum-
ing rerouting is not silent (e.g., because it is effected by
BGP), the former effect can be accounted for; traffic us-
ing backup routes can be marked by switches and ignored
in the end-host t-test computation. The latter can be mit-
igated by careful design: rather than loading a single
backup path unfairly, the load can be evenly distributed
in the rest of the pod. Even if an imbalance cannot be
avoided, two smaller ESes can yet be formed: one with
links handling rerouted traffic, and one without.
6.4 Topologies
Our system leverages the details of Facebook’s dat-
acenter topology to obtain full path info with a single
marking identifying the transited core switch. The topol-
ogy also allows us to form equivalence sets for each
pod by considering the core-to-pod downlinks. Other
networks might provide more challenging environments
(e.g. middleboxes or software load balancers [31] might
redirect some traffic; different pods might have vary-
ing internal layouts; links might fail) that confound the
ability to form equivalence sets. In an extreme case, a
Jellyfish-like topology [38] might make it extremely dif-
ficult to both extract path information and form ESes.
In certain cases, though, even networks with unruly
layouts and routing can be analyzed by our approach.
Consider a hybrid network consisting of a Jellyfish-like
subset. For example, suppose a single switch in the Jel-
lyfish sub-network is connected to every core switch in a
multi-rooted tree, with identical link bandwidths. While
we cannot reason about traffic internal to the Jellyfish, we
can still form an ES for the links from the single switch
connecting to the regular topology, for all traffic flowing
into the regular sub-network. No matter how chaotic the
situation inside the Jellyfish network, the traffic should
be evenly distributed across core switches in the regular
sub-network, and from then on the paths are equivalent.
Note that here, we only consider the subset of the path
that lies within the regular topology. As long as an ES
can be formed, the path behind it can be considered as a
black box. Thus, we argue that even on topologies where
we can’t find the full path, or where inequalities in path
cost exist, we can run our approach on subsets of the
topology where our requirements do hold.
6.5 Limitations
On the other hand, there are certain cases where our
current approach falls short. To begin, we presume
we are able to collect end-host metrics that reflect net-
work performance. While we believe our current metrics
cover the vast majority of existing deployments, we have
not yet explored RDMA-based applications or datacen-
ter fabrics. Our current metrics also have limits to their
precision; while we can detect 0.1% drop rates in the dat-
acenter we studied, past a certain point we are unable to
discern faults from noise. Moreover, the production dat-
acenter is well provisioned, so fault-free performance is
stable, even in the tail. Hence, we do not consider the in-
ability to detect minor impairments to be a critical flaw:
If the impacts of a fault are statistically indistinguishable
from background network behavior, then the severity of
the error might not be critical enough to warrant imme-
diate response. Datacenters operating closer to capacity,
however, may both exhibit less stable fault-free behavior,
as well as require greater fault-detection sensitivity.
Despite extensive use of ECMP and application load-
balancing techniques, datacenter networks with mixed
workloads may include links that see more traffic and
congestion than others. That said, we have not encoun-
tered enough variability in load in the network core and
aggregation layers to trigger enough false positives to
confound the accuracy of our method in either produc-
tion or under our testbed, and thus cannot yet quantify
under what circumstances this degradation in detection
performance would occur. Furthermore, for links lack-
ing alternatives—such as an end host to top-of-rack ac-
cess link in the absence of multihoming—we cannot pick
out an outlier by definition since there is only one link to
analyze. We can, however, still perform our analysis on
different groupings within traffic for that link; for exam-
ple, when traffic to a particular subnet is impacted.
7. SUMMARYWe have demonstrated a method to use the regular-
ity inherent in a real-world deployment to help rapidly
detect and localize the effects of failures in a production
datacenter network. In particular, we have shown that we
can do it with reasonable computational overhead and
ease of deployment. We believe improvements in net-
work core visibility, together with coordinating end-host
performance monitoring with centralized network con-
trol, can aid the task of managing network reliability.
ACKNOWLEDGMENTSThis work is supported in part by the National Sci-
ence Foundation through grants CNS-1422240 and CNS-
1564185. We are indebted to Aaron Schulman, Ariana
Mirian, Danny Huang, Sunjay Cauligi, our shepherd,
Dave Maltz, and the anonymous reviewers for their feed-
back. Alex Eckert, Alexei Starovoitov, Daniel Neiter,
Hany Morsy, Jimmy Williams, Nick Davies, Petr La-
pukhov and Yuliy Pisetsky provided invaluable insight
into the inner workings of Facebook services. Finally,
we thank Omar Baldonado for his continuing support.
USENIX Association 14th USENIX Symposium on Networked Systems Design and Implementation 607

8. REFERENCES
[1] ab - Apache HTTP server benchmarking tool.
https://httpd.apache.org/docs/2.4/
programs/ab.html.
[2] BPF Compiler Collection (BCC).
https://github.com/iovisor/bcc/.
[3] Extending extended BPF.
https://lwn.net/Articles/603983/.
[4] Hadoop. http://hadoop.apache.org/.
[5] HHVM. http://hhvm.com.
[6] A. Adams, P. Lapukhov, and H. Zeng.
https://code.facebook.com/posts/
1534350660228025/netnorad-
troubleshooting-networks-via-end-
to-end-probing/.
[7] M. Aguilera, J. Mogul, J. Wiener, P. Reynolds, and
A. Muthitacharoen. Performance Debugging for
Distributed Systems of Black Boxes. SOSP, Bolton
Landing, NY, USA, 2003. ACM.
[8] M. Al-Fares, A. Loukissas, and A. Vahdat. A
Scalable, Commodity Data Center Network
Architecture. SIGCOMM, Seattle, WA, USA,
2008. ACM.
[9] A. Andreyev. Introducing data center fabric, the
next-generation Facebook data center network.
https://code.facebook.com/posts/
360346274145943, 2014.
[10] B. Arzani, S. Ciraci, B. T. Loo, A. Schuster, and
G. Outhred. Taking the Blame Game out of Data
Centers Operations with NetPoirot. SIGCOMM,
Florianopolis, Brazil, 2016. ACM.
[11] P. Bahl, R. Chandra, A. Greenberg, S. Kandula,
D. A. Maltz, and M. Zhang. Towards Highly
Reliable Enterprise Network Services via
Inference of Multi-level Dependencies.
SIGCOMM, Kyoto, Japan, 2007. ACM.
[12] D. Banerjee, V. Madduri, and M. Srivatsa. A
Framework for Distributed Monitoring and Root
Cause Analysis for Large IP Networks. SRDS,
Niagara Falls, NY, USA, 2009. IEEE Computer
Society.
[13] M. Y. Chen, A. Accardi, E. Kiciman, J. Lloyd,
D. Patterson, A. Fox, and E. Brewer. Path-based
Faliure and Evolution Management. NSDI, San
Francisco, California, 2004. USENIX Association.
[14] M. Y. Chen, E. Kiciman, E. Fratkin, A. Fox, and
E. Brewer. Pinpoint: Problem Determination in
Large, Dynamic Internet Services. DSN, Bethesda,
MD, USA, 2002. IEEE Computer Society.
[15] Cisco. BGP Support for TTL Security Check.
http://www.cisco.com/c/en/us/td/
docs/ios/12_2s/feature/guide/fs_
btsh.html.
[16] J. Dean and S. Ghemawat. MapReduce: Simplified
Data Processing on Large Clusters. OSDI, San
Francisco, CA, 2004. USENIX Association.
[17] N. Duffield, F. L. Presti, V. Paxson, and
D. Towsley. Network Loss Tomography Using
Striped Unicast Probes. ACM Transactions on
Networking, 14(4), Aug. 2006.
[18] G. Forman, M. Jain, M. Mansouri-Samani,
J. Martinka, and A. C. Snoeren. Automated
Whole-System Diagnosis of Distributed Services
Using Model-Based Reasoning. DSOM, Newark,
DE, Oct. 1998.
[19] C. Guo, L. Yuan, D. Xiang, Y. Dang, R. Huang,
D. Maltz, Z. Liu, V. Wang, B. Pang, H. Chen,
Z.-W. Lin, and V. Kurien. Pingmesh: A
Large-Scale System for Data Center Network
Latency Measurement and Analysis. SIGCOMM,
London, United Kingdom, 2015. ACM.
[20] N. Handigol, B. Heller, V. Jeyakumar,
D. Mazières, and N. McKeown. I Know What
Your Packet Did Last Hop: Using Packet Histories
to Troubleshoot Networks. NSDI, Seattle, WA,
2014. USENIX Association.
[21] T. Hoff. Latency Is Everywhere And It Costs You
Sales - How To Crush It.
http://highscalability.com/
latency-everywhere-and-it-costs-
you-sales-how-crush-it.
[22] M. Isard, M. Budiu, Y. Yu, A. Birrell, and
D. Fetterly. Dryad: Distributed Data-parallel
Programs from Sequential Building Blocks.
EuroSys, Lisbon, Portugal, 2007. ACM.
[23] A. Kabbani, B. Vamanan, J. Hasan, and
F. Duchene. FlowBender: Flow-level Adaptive
Routing for Improved Latency and Throughput in
Datacenter Networks. CoNEXT, Sydney,
Australia, 2014. ACM.
[24] S. Kandula, D. Katabi, and J.-P. Vasseur. Shrink: A
Tool for Failure Diagnosis in IP Networks.
MineNet, Philadelphia, Pennsylvania, USA, 2005.
ACM.
[25] R. R. Kompella, J. Yates, A. Greenberg, and A. C.
Snoeren. IP Fault Localization via Risk Modeling.
NSDI, Boston, MA, USA, 2005. USENIX
Association.
[26] R. R. Kompella, J. Yates, A. Greenberg, and A. C.
Snoeren. Detection and Localization of Network
Black Holes. INFOCOM, Anchorage, AK, USA,
2007. IEEE Computer Society.
[27] R. R. Kompella, J. Yates, A. Greenberg, and A. C.
Snoeren. Fault Localization via Risk Modeling.
IEEE Trans. Dependable Secur. Comput., 7(4),
Oct. 2010.
[28] D. Maltz. Private communication, Feb. 2017.
608 14th USENIX Symposium on Networked Systems Design and Implementation USENIX Association
[29] V. Mann, A. Vishnoi, and S. Bidkar. Living on the
edge: Monitoring network flows at the edge in
cloud data centers. COMSNETS, Bangalore, India,
2013. IEEE.
[30] R. N. Mysore, R. Mahajan, A. Vahdat, and
G. Varghese. Gestalt: Fast, Unified Fault
Localization for Networked Systems. USENIX
ATC, Philadelphia, PA, 2014. USENIX
Association.
[31] P. Patel, D. Bansal, L. Yuan, A. Murthy,
A. Greenberg, D. A. Maltz, R. Kern, H. Kumar,
M. Zikos, H. Wu, C. Kim, and N. Karri. Ananta:
Cloud Scale Load Balancing. SIGCOMM, Hong
Kong, China, 2013. ACM.
[32] S. Radhakrishnan, M. Tewari, R. Kapoor,
G. Porter, and A. Vahdat. Dahu: Commodity
Switches for Direct Connect Data Center
Networks. ANCS, San Jose, California, USA,
2013. IEEE Press.
[33] P. Reynolds, J. L. Wiener, J. C. Mogul, M. K.
Aguilera, and A. Vahdat. WAP5: Black-box
Performance Debugging for Wide-area Systems.
WWW, Edinburgh, Scotland, 2006. ACM.
[34] M. Roughan, T. Griffin, Z. M. Mao, A. Greenberg,
and B. Freeman. IP Forwarding Anomalies and
Improving Their Detection Using Multiple Data
Sources. NetT, Portland, Oregon, USA, 2004.
ACM.
[35] A. Roy, H. Zeng, J. Bagga, G. Porter, and A. C.
Snoeren. Inside the Social Network’s (Datacenter)
Network. SIGCOMM, London, United Kingdom,
2015. ACM.
[36] S. Savage, D. Wetherall, A. Karlin, and
T. Anderson. Practical Network Support for IP
Traceback. SIGCOMM, Stockholm, Sweden,
2000. ACM.
[37] A. Singh, J. Ong, A. Agarwal, G. Anderson,
A. Armistead, R. Bannon, S. Boving, G. Desai,
B. Felderman, P. Germano, A. Kanagala,
J. Provost, J. Simmons, E. Tanda, J. Wanderer,
U. Hölzle, S. Stuart, and A. Vahdat. Jupiter Rising:
A Decade of Clos Topologies and Centralized
Control in Google’s Datacenter Network.
SIGCOMM, London, United Kingdom, 2015.
ACM.
[38] A. Singla, C.-Y. Hong, L. Popa, and P. B. Godfrey.
Jellyfish: Networking Data Centers Randomly.
NSDI, San Jose, CA, 2012. USENIX Association.
[39] D. Turner, K. Levchenko, J. C. Mogul, S. Savage,
and A. C. Snoeren. On Failure in Managed
Enterprise Networks. Technical report,
Hewlett-Packard Labs, May 2012.
[40] D. Turner, K. Levchenko, A. C. Snoeren, and
S. Savage. California Fault Lines: Understanding
the Causes and Impact of Network Failures.
SIGCOMM, New Delhi, India, 2010. ACM.
[41] B. P. Welford. Note on a Method for Calculating
Corrected Sums of Squares and Products.
Technometrics, 4(3), 1962.
[42] X. Wu, D. Turner, C.-C. Chen, D. A. Maltz,
X. Yang, L. Yuan, and M. Zhang. NetPilot:
Automating Datacenter Network Failure
Mitigation. SIGCOMM, Helsinki, Finland, 2012.
ACM.
[43] D. Zats, T. Das, P. Mohan, D. Borthakur, and
R. Katz. DeTail: Reducing the Flow Completion
Time Tail in Datacenter Networks. SIGCOMM,
Helsinki, Finland, 2012. ACM.
[44] Y. Zhu, N. Kang, J. Cao, A. Greenberg, G. Lu,
R. Mahajan, D. Maltz, L. Yuan, M. Zhang, B. Y.
Zhao, and H. Zheng. Packet-Level Telemetry in
Large Datacenter Networks. SIGCOMM, London,
United Kingdom, 2015. ACM.
A. ALTERNATIVE METHODS
Alternative methods abound for investigating datacen-
ter faults. One appealing option is to couple switch coun-
ters with programmable switches. For example, sup-
pose a switch is configured such that when a packet is
dropped, either due to error or queuing pressure, it is
probabilistically sampled to the switch CPU (note that
with switches shifting millions of packets a second, ex-
amining all packets leads to unacceptable CPU over-
head). Additionally, some switches can be configured
to sample packets from high occupancy queues. Thus,
counters could indicate a fault, while sampled packets
could be used to build a picture of which traffic is im-
pacted.
While this method can alert network operators to
faulty links, it is slow in determining which traffic is
impacted. Suppose a link carrying 2,000,000 packets
per second develops a 0.5% drop rate, leading to 10,000
drops per second. Such a link might be carrying tens
of thousands of flows, however. With a relatively high
1 in 100 sampling rate (and thus, 100 sampled packets
per second), and with just 10,000 flows carried (a large
underestimation) it would take around 100 seconds to
determine all the flows if the sampling was perfect and
captured a different 5-tuple each time. Furthermore, this
would be subject to sampling bias; a lightweight flow
carrying control traffic might lose packets but fly un-
der the radar of sampled dropped packets. One heavy
handed potential approach could be to disable the entire
link; however, consider the case of a partial fault only af-
fecting a subset of traffic (for example, a misconfigured
routing rule). In such a case, disabling the entire link
would penalize all traffic routed through that link with-
out providing any insight to the underlying problem.
USENIX Association 14th USENIX Symposium on Networked Systems Design and Implementation 609

1(Faulty)
2 3 4 5 6 7 8 9
Core switch
104
105
106
107
108S
yscall
late
ncy (
nsec)
Figure 6: select() latency distribution per core switch for the two-
VM CPU stress test.
For contrast, our proposed system can quickly iden-
tify all the flows impacted by a link error in a less than
a minute in several tested cases. In the case of gran-
ular errors affecting only a subset of traffic (by source
or destination subnet, application port, queuing policy,
etc.) our mechanism can still detect outliers, enabling
end hosts to reroute around damaged links for afflicted
traffic as a stopgap measure. Note that switch counters
can be used in conjunction with our methods; features of
sampled dropped or latency enduring packets could be
used to guide our system’s binning of flows in order to
converge on which traffic is affected by link faults even
quicker. Furthermore, our proposed system is ASIC ag-
nostic since we do not rely on the features of any given
chipset. Finally, it is robust to unreliable reporting by
switches, as well as the uncertainty of counters that might
arise within environments using cut-through routing.
B. METRIC ROBUSTNESSHere, we demonstrate the effectiveness of our ap-
proach in the presence of pathological confounding fac-
tors. These experiments are performed on our private
testbed, since we could not induce harmful configuration
changes in production traffic. We focus on syscall la-
tency metrics, which are less obviously robust to many
of thse factors. To save space, we omit similarly strong
results using TCP statistics.
B.1 CPU utilizationDatacenter networks run a variety of applications, fre-
quently with stringent CPU requirements and high uti-
lization. To be general, our approach needs to cope with
high utilization figures. Furthermore, while some data-
centers run applications on bare metal hardware, a sig-
nificant number of installations use virtual machines.
In order to ascertain the impact of virtual machine
hardware and high cpu utilization on our approach, we
set up an experiment where each host in our private
testbed runs two virtual machines, cpuvm and netvm.
Each instance of cpuvm runs a variety of simultane-
ous CPU intensive tasks: specifically, a fully loaded
mysql server instance (with multiple local clients), a
scheduler-intensive multithreading benchmark, and an
ALU-operation-intensive math benchmark. This causes
the CPU utilization of the bare metal host to go to 100%.
Meanwhile, each instance of netvm runs a bidirectional
client-server communication pattern using flow size dis-
tributions prevalent in certain datacenters [35]. This sit-
uation is analogous to the case where one VM is shuf-
fling data for a map-reduce job, while another is actively
processing information, for example. Figure 6 depicts
the distribution of select() latencies across each core
switch in the presence of this extreme CPU stress. The
distribution corresponding with paths through the faulty
switch are clearly distinguishable, with a median value
over three orders of magnitude greater than the no-error
case. This corresponds to a 100% accuracy rate of flag-
ging the faulty link using our chi-squared test over 1-
minute intervals for a 5-minute long test.
B.2 Oversubscription and uneven loadThus far, all our experiments have networks without
saturated core links. While this is a desirable quality
in real deployments, it might not be feasible depend-
ing on the amount of oversubscription built into the net-
work. Furthermore, in heterogeneous environments such
as multi-tenant datacenters, it is conceivable that not ev-
ery end-host is participating in monitoring traffic metrics.
Finally, not every system that is being monitored is sub-
ject the same load.
To determine how our approach deals with these chal-
lenges, we devised an experiment in our private testbed
where 1/3rd of our 27 hosts are no longer participating
in monitoring. Instead, these hosts suffuse the network
with a large amount of background traffic, with each so-
called ‘background host’ communicating with all other
background hosts. Each background host sends a large
amount of bulk traffic; either rate limited to a fraction of
access link capacity, or unbound and limited only by link
capacity. In conjunction with this, our network core is re-
duced to 1/3rd of normal capacity: from 9 core switches
to 3. Thus, the background hosts can, by themselves, sat-
urate core capacity. Our remaining 18 servers continue to
run the bidirectional client-server network pattern, with
one important difference: rather than all servers having
the same amount of load, they are partitioned into three
classes. The first class chooses flow sizes from the Face-
book cache server flow size distribution [35]; the other
two classes choose flow sizes from larger 4× and 16×multiples of the Facebook distribution. In other words,
the 4× distribution is simply the normal distribution, ex-
cept every value for flow size being multiplied by 4.
610 14th USENIX Symposium on Networked Systems Design and Implementation USENIX Association

1(Faulty)
2 3
Core switch
104
105
106
107
108S
yscall
late
ncy (
nsec)
Figure 7: select() latency distribution per core switch for the over-
subscribed background traffic uneven server test.
Thus, the link utilizations of the 4× and 16× distribu-
tions are correspondingly higher than normal. While the
normal distribution has a link utilization of roughly 100
Mbps in this case, the 4× case and 16× cases bring us to
roughly 40% and 100% link utilization respectively.
Figure 7 depicts the select() latency distribution
for this scenario as a multi-series CDF. Each series rep-
resents the distribution for a single network path; there
is one faulty path and two working paths in this case.
The x-axis depicts latency in nanoseconds. Despite the
combination of confounding factors, the distribution for
the faulty path remains significantly higher (shifted to
the right in the figure) than the non-faulty paths (which
possess roughly equivalent distributions). Correspond-
ingly, the signal derived from the select() latencies re-
mains useful. Using 1-minute intervals, we note that the
chi-squared test hovered at close to 0 when we consid-
ered all paths, and close to 1 when the faulty path was
removed from the set of candidate paths. This indicates
that we remain successful at finding the faulty link even
under these circumstances.
B.3 Sensitivity to TCP send buffer sizeOur system call latency approach uses the latency of
select()/epoll() calls by hosts that are sending
data over the network as a signal. As a reminder, when
an application calls select()/epoll() (or send())
on a socket, the call returns (or successfully sends data)
when there is enough room in the per-flow socket buffer
to store the data being sent. Thus, the distribution of
results is fundamentally impacted by the size of the per-
flow socket buffer. Note that with the advent of send-
side autotuning in modern operating systems, the size of
this buffer is not static. In Linux, the kernel is config-
ured with a minimum size, a default (initial) size and a
maximum size, with the size growing and shrinking as
necessary.
1(Faulty)
2 3 4 5 6 7 8 9
Core switch
104
105
106
107
Syscall
late
ncy (
nsec)
Figure 8: select() latency distribution per core switch for the 10-
Gbps 16-KB socket send buffer test.
By default, our private testbed systems are configured
with a maximum send buffer size of 4 MB. Values for the
median buffer size vary from 1.5–2.5 MB for our server
hosts and 0.8–1.2 MB for our client hosts in our bidirec-
tional traffic pattern. To determine the sensitivity of our
approach to buffer size, we first increased the buffer size
to values of 8 and 16 MB. Then, we decreased the buffer
size significantly, to values of 52, 26 and 16 KB (note
that 16 KB is the default initial size). We noticed that
TCP autotune prevents the buffer from growing too large
even if the maximum is set significantly higher than de-
fault; accordingly, raising the maximum had little to no
impact.
Reducing the maximum buffer size, however, is ex-
pected to have a larger impact on our metrics. Intu-
itively, a smaller buffer should correspond with higher
overall buffer occupancy; thus, a larger percentage of
select() and send() calls would need to wait until
the buffer is drained. This should have the two-fold ef-
fect of shifting the select() latency distributions to the
right—since more calls to select() wait for longer—
and decreasing the distance between a faulty-path distri-
bution and the normal case.
To test this out, we ran our bidirectional client-server
traffic pattern using 1-Gbps NICs on our k = 6 testbed,
and using 10-Gbps NICs on our three system setup. We
ran a low-intensity test (roughly 50 and 300 Mbps link
utilization per client and server host, respectively) and a
high-intensity test (roughly 1–2 and 5–7 Gbps for client
and server hosts respectively in the 10-Gbps case, and
saturated links for servers in the 1-Gbps case). We noted
that in all the low-intensity test cases, and in the 1-Gbps
high-intensity cases, we were still able to derive a clear
signal and successfully pick out the faulty link using 1-
minute intervals. In our worst-case scenario of 10-Gbps
links and a 16-KB send buffer size, we note a significant
USENIX Association 14th USENIX Symposium on Networked Systems Design and Implementation 611

1(Faulty)
2 3 4 5 6 7 8 9
Core switch
103
104
105
106
107
Syscall
late
ncy (
nsec)
Figure 9: select() latency distribution per core switch for the no-
offload test with CPU stress.
shifting of the distribution to the right by roughly three
orders of magnitude, as predicted, as depicted in Fig-
ure 8. While the faulty-path distribution is closer to the
non-faulty distributions, there is still enough divergence
to clearly differentiate it from the pack, albeit requiring
our statistical tests to run over longer time intervals. We
note, however, that such small send socket buffer sizes
are unlikely in real-world deployments.
B.4 The effect of NIC offloadsContemporary NICs have a variety of processing of-
fload features designed to cut down on end host CPU uti-
lization (which we’ve already discussed can be heavily
utilized in a datacenter environment). For example, TCP
discretizes a continuous stream into individual packets
determined by end to end path MTU; a feature called
"TCP Segmentation Offload" allows the NIC to perform
this discretization, saving the CPU the effort.
NICs typically implement three common offload fea-
tures: TCP Segmentation Offload, Generic Segmentation
Offload and Generic Receive Offload. All our previous
experiments had these features turned on in every end
host. To test the sensitivity of our approach to the avail-
ability and state of these features, we re-ran the bidirec-
tional client-server traffic pattern with all three offload
features turned off. Figure 9 depicts the select() la-
tency distribution for two client hosts and one server host
within our private testbed with all offloads turned off and
a CPU utilization of 100% using the combination of pro-
grams described in the CPU stress test earlier. This sce-
nario represents a sort of worst case for our approach
due to the high CPU utilization required to push mul-
tiple gigabits of traffic without offload; despite this, our
approach is still able to correctly flag the faulty path over
a 30-second interval.
C. GENERAL-CASE TOPOLOGIES
The characteristics of the production datacenter we
examined in this work lends itself to relatively simple
diagnosis of which link is faulty based on per-link per-
formance metric binning; however, alternative scenarios
may exist where either traffic is not as evenly load bal-
anced, or a different topology complicates the ability to
subdivide link by hierarchy for the purposes of compari-
son (for example, different pods in a network might have
different tree depths).
Our method fundamentally depends on finding
roughly equivalent binnings for flow metrics, such that
outliers can be found. In the case of a network with
hotspots or complicated topologies, which can confound
this process, we can still make headway by considering
links at every multipath decision point as a single equiv-
alency group. If one of these links exhibits outlier per-
formance, the flows traversing the link can be marked
individually as faulty rather than the link as a whole, and
the flow and the traversed path can be submitted as in-
put to a graph-based fault localization algorithm such as
SCORE [25] or Gestalt [30]. We leave the evaluation of
such a scenario to future work.
612 14th USENIX Symposium on Networked Systems Design and Implementation USENIX Association