Embed Size (px)
Citation preview
Passive Flow Control to Mitigate Attitude Control
Motor Jet Interaction Effects
Reece Neel∗ and William D. McGrory†
Aerosoft Inc., Blacksburg, VA, 24060, United States
Joseph Schetz‡
Virginia Polytechnic Institute and State University, Blacksburg, Virginia, 24060, United States
Kevin Langone§ and Luis Bermudez¶
Orbital Sciences Corporation, Dulles, VA, 20166, United States
An attitude control motor situated near the nose of a launch vehicle is used to steer thevehicle in pitch and yaw. Interaction of the motor’s exhaust plumes with the free streamsignificantly alters the flowfield around the vehicle. In particular, low pressure regions formdownstream of firing jets which tends to counteract the efficiency of the motor by causinga net force in the opposite direction of the jet thrust. This study numerically investigatespotential changes to passively alter the flowfield in an attempt to mitigate these controlattenuation effects. A jet diverter, a fairing, vortex generators, and mass addition werechosen for examination. Several of the concepts showed potential to partially negate theadverse jet interaction effects, but further study is needed to optimize their design.
Nomenclature
ACMAttitude Control MotorCA Axial Force CoefficientCN Normal Force CoefficientCY Side Force CoefficientCm Pitch Moment CoefficientCn Yaw Moment CoefficientR Gas ConstantCp Specific Heat Capacityaj Gordon/McBride Coefficientsρ Densityµ0 Sutherland Equation ConstantT0 Sutherland Equation ConstantS Sutherland Equation Constantε Pitch Moment Efficiency
I. Introduction
Recent studies of a slender launch vehicle with the attitude control motor (ACM) firing have raisedconcerns about pitching moment attenuation. When the ACM jets are on, jet interaction with the free-stream flow causes large low-pressure regions to form downstream of the ACM nozzles. Since this low∗Sr. Research Scientist.†President and Chief Research Scientist. Sr. Member AIAA.‡Professor, Department of Aerospace Engineering. Fellow AIAA.§Sr. Aerosciences Engineer, Space Systems Group, Member AIAA¶Sr. Principal Aerosciences Engineer, Space Systems Group, Member AIAA.
1 of 16
American Institute of Aeronautics and Astronautics
39th AIAA Fluid Dynamics Conference22 - 25 June 2009, San Antonio, Texas
AIAA 2009-4179
Copyright © 2009 by Orbital Sciences Corporation. Published by the American Institute of Aeronautics and Astronautics, Inc., with permission.

pressure acts over a large surface area, the resulting force can be significant and can actually work to counterthe thrust of the motors. If the moment attenuation was large enough, the vehicle could undergo controlreversal when the motors were on.
Prior to major structural and control redesign, passive flow control devices are explored with the intent offinding a simpler way to control the flow. The concepts to be considered are a jet diverter, a fairing/splitterplate combination, and mass addition via wall blowing. A fourth concept is also considered in which vortexgenerators would be used to counter the vortices formed from the jet interaction effects. This concept isruled out due to other structural and controllability impacts.
A number of past studies have been performed concerning the modification of flow around both rigidcylinders and exhaust jets in a transverse crossflow. Note that when the jet is firing it forms a cylinder shapenormal to the incoming flow. Attaching a rigid plate behind a cylinder was originally shown to reduce totaldrag and weaken shed vortices by Roshko.1 Additional studies on the use of splitter plates, both fixed andfreely rotatable, have been performed examining the effect on forces, vortex shedding frequency, and plateequilibrium angle,2,3.4 A number of techniques for modification of exhaust jets have been studied as well,which typically concentrate on the mixing rate. Marzouk and Ghoniem examine a delta-tab on the nozzlewindward edge and microactuators to perturb the azimuthal or wall-normal components of the jet vorticityand the resulting vortical effects,5.6 Further studies have focused on the use of controlled pulsing of the jetsto optimize the jet penetration into the crossflow and produce distinctly rolled-up vortical structures,7,8,9.10
A total of nine simulations were performed. The first two simulations consisted of the current designwith control motors on and off. These cases represent the baseline. The net thrust of the ACM was 3,000 lbswith an off-axis thruster configuration. Each of the three concepts was also simulated with control motorson and off. An additional simulation was performed with motors on and with a porous wall condition. Thiswas a variation of the mass addition case.
II. ACM Description
The attitude control motor is positioned immediately aft of the nosecone. It consists of eight nozzlesdistributed at 45 degree intervals around the circumference, divided into a forward and an aft row. Thepropellant burns constantly, such that at least some of the nozzles are firing at any time. The flow througheach nozzle is independently controlled such that the correct combination of nozzle firings determines thenet thrust magnitude and direction.
Figure 1. ACM nozzles exits.
III. Simulation Parameters
Previous studies of ACM jet interaction have shown that mid-thrust cases typically exhibit the highestcontrol attenuation. Thus this scenario was chosen as the focal point for this study. All simulations wereperformed based on a nominal thrust value of 3000 lbs vectored between two of the motor’s nozzles (Figure 2).This scenario is considered an ”off-axis” case as the firing direction is clocked 22.5 degrees from the vehiclebody axes.
Freestream conditions are given in Table 1. The input conditions are based on an expected flight condition.Note that the incoming flow is aligned with the net thrust vector.
All CFD simulations are performed using GASP, which is a finite-volume, multi-block, Reynolds AveragedNavier-Stokes (RANS) flow solver. GASP Version 4.3.1 was used in the current work. The flow is assumedturbulent and both boundary layer and shear layer mixing are simulated using a two-equation turbulence
2 of 16
American Institute of Aeronautics and Astronautics
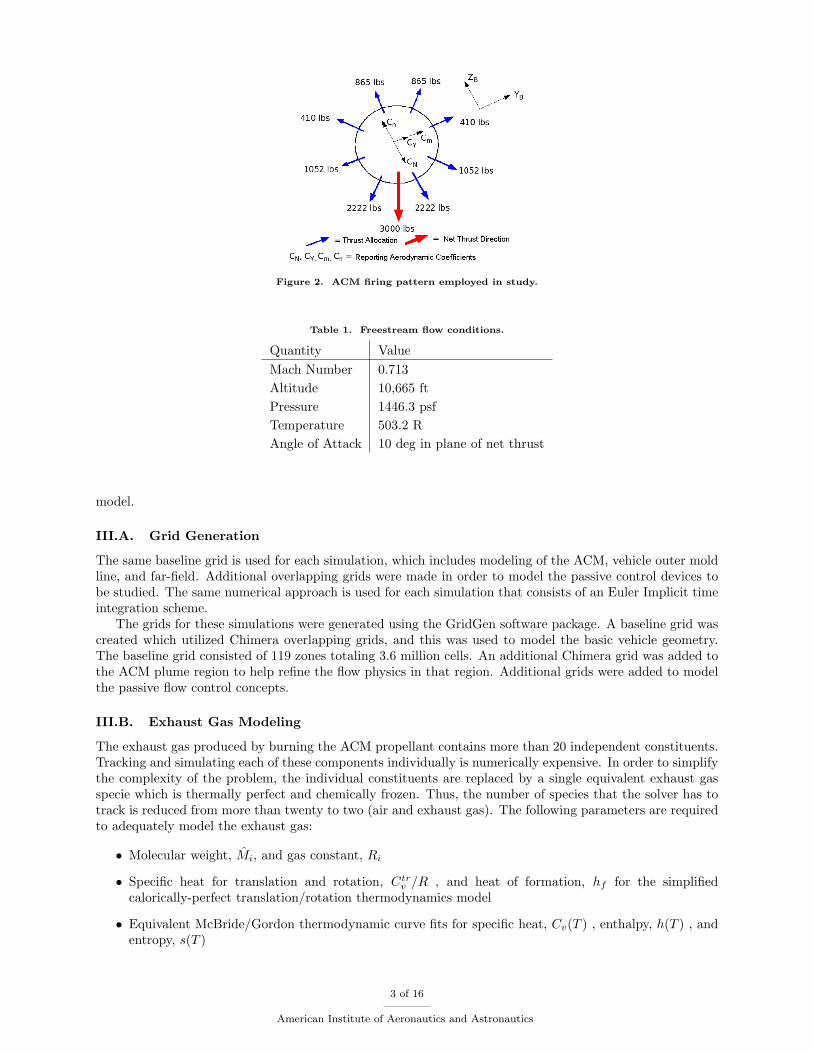
Figure 2. ACM firing pattern employed in study.
Table 1. Freestream flow conditions.
Quantity ValueMach Number 0.713Altitude 10,665 ftPressure 1446.3 psfTemperature 503.2 RAngle of Attack 10 deg in plane of net thrust
model.
III.A. Grid Generation
The same baseline grid is used for each simulation, which includes modeling of the ACM, vehicle outer moldline, and far-field. Additional overlapping grids were made in order to model the passive control devices tobe studied. The same numerical approach is used for each simulation that consists of an Euler Implicit timeintegration scheme.
The grids for these simulations were generated using the GridGen software package. A baseline grid wascreated which utilized Chimera overlapping grids, and this was used to model the basic vehicle geometry.The baseline grid consisted of 119 zones totaling 3.6 million cells. An additional Chimera grid was added tothe ACM plume region to help refine the flow physics in that region. Additional grids were added to modelthe passive flow control concepts.
III.B. Exhaust Gas Modeling
The exhaust gas produced by burning the ACM propellant contains more than 20 independent constituents.Tracking and simulating each of these components individually is numerically expensive. In order to simplifythe complexity of the problem, the individual constituents are replaced by a single equivalent exhaust gasspecie which is thermally perfect and chemically frozen. Thus, the number of species that the solver has totrack is reduced from more than twenty to two (air and exhaust gas). The following parameters are requiredto adequately model the exhaust gas:
• Molecular weight, Mi, and gas constant, Ri
• Specific heat for translation and rotation, Ctrv /R , and heat of formation, hf for the simplified
calorically-perfect translation/rotation thermodynamics model
• Equivalent McBride/Gordon thermodynamic curve fits for specific heat, Cv(T ) , enthalpy, h(T ) , andentropy, s(T )
3 of 16
American Institute of Aeronautics and Astronautics
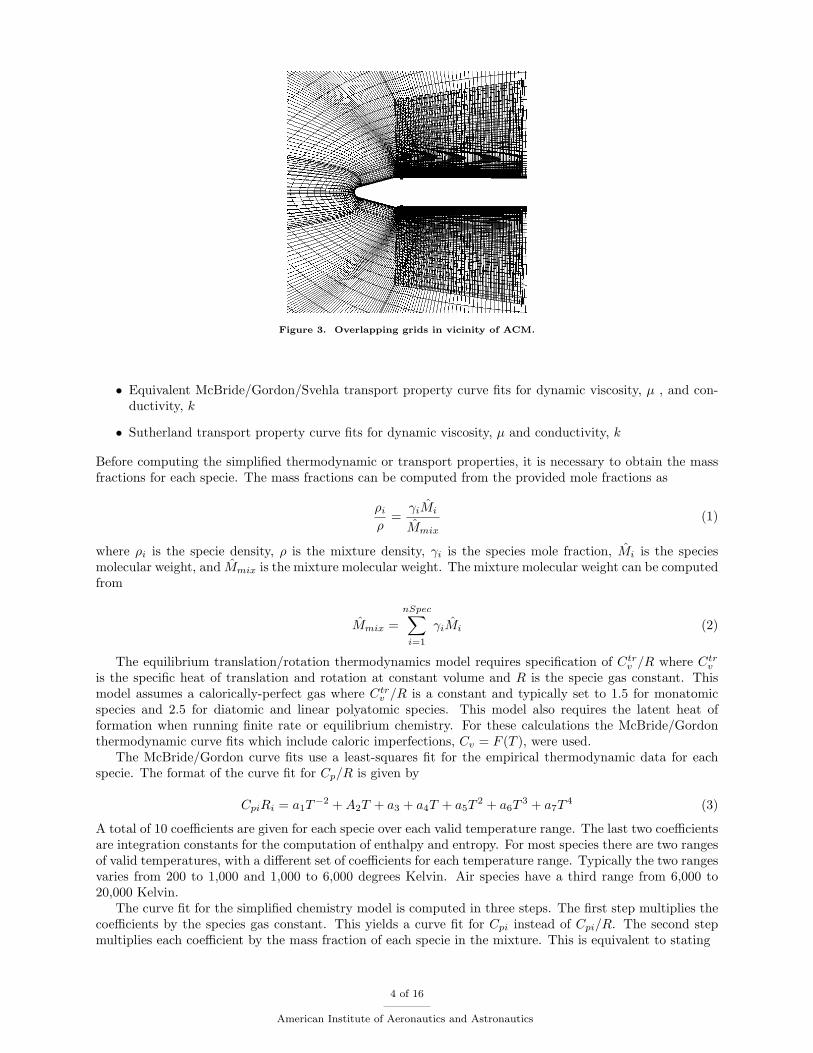
Figure 3. Overlapping grids in vicinity of ACM.
• Equivalent McBride/Gordon/Svehla transport property curve fits for dynamic viscosity, µ , and con-ductivity, k
• Sutherland transport property curve fits for dynamic viscosity, µ and conductivity, k
Before computing the simplified thermodynamic or transport properties, it is necessary to obtain the massfractions for each specie. The mass fractions can be computed from the provided mole fractions as
ρi
ρ=
γiMi
Mmix
(1)
where ρi is the specie density, ρ is the mixture density, γi is the species mole fraction, Mi is the speciesmolecular weight, and Mmix is the mixture molecular weight. The mixture molecular weight can be computedfrom
Mmix =nSpec∑i=1
γiMi (2)
The equilibrium translation/rotation thermodynamics model requires specification of Ctrv /R where Ctr
v
is the specific heat of translation and rotation at constant volume and R is the specie gas constant. Thismodel assumes a calorically-perfect gas where Ctr
v /R is a constant and typically set to 1.5 for monatomicspecies and 2.5 for diatomic and linear polyatomic species. This model also requires the latent heat offormation when running finite rate or equilibrium chemistry. For these calculations the McBride/Gordonthermodynamic curve fits which include caloric imperfections, Cv = F (T ), were used.
The McBride/Gordon curve fits use a least-squares fit for the empirical thermodynamic data for eachspecie. The format of the curve fit for Cp/R is given by
CpiRi = a1T−2 +A2T + a3 + a4T + a5T
2 + a6T3 + a7T
4 (3)
A total of 10 coefficients are given for each specie over each valid temperature range. The last two coefficientsare integration constants for the computation of enthalpy and entropy. For most species there are two rangesof valid temperatures, with a different set of coefficients for each temperature range. Typically the two rangesvaries from 200 to 1,000 and 1,000 to 6,000 degrees Kelvin. Air species have a third range from 6,000 to20,000 Kelvin.
The curve fit for the simplified chemistry model is computed in three steps. The first step multiplies thecoefficients by the species gas constant. This yields a curve fit for Cpi instead of Cpi/R. The second stepmultiplies each coefficient by the mass fraction of each specie in the mixture. This is equivalent to stating
4 of 16
American Institute of Aeronautics and Astronautics

Cp =nSpec∑i=1
ρiρCpi (4)
where Cp is the mixture Cp . The last step divides the coefficients by the mixture gas constant, yielding thenew coefficients in Cp/R form. The entire process can be represented by
aj =1
Rmix
nSpec∑i=1
ρi
ρRiaji (5)
where aj are the polynomial coefficients a1 through a10.The McBride/Gordon/Svehla transport property curve fits are least square fits for the laminar viscosity
and thermal conductivity. In their format, the species viscosity is computed as
lnµi = AlnT +BT + CT 2 +D (6)
The equation for thermal conductivity is functionally identical.The method applied to the thermodynamic curve fits is not valid for the transport properties. The
mixing rule for transport properties does not lend itself well to a similar approach. Fortunately, the transportproperty equation only has 4 unknown coefficients instead of 10. To compute simplified curve fits, four datapoints were determined within each valid temperature range. This gives a system of linear equations for thefour unknowns in each temperature range.
GASP allows the user to compute the laminar viscosity and thermal conductivity using Sutherland’srelations. The format of the Sutherland viscosity equation is
µi = µ0
(T
T0
) 32 T0 + S
T + S(7)
where µ0, T0, and S are constants. The Sutherland thermal conductivity equation is functionally identicalto the above equation.
The method used here is identical to the method used to arrive at McBride/Gordon/Svehla curve fitsexcept three data points are used. Also, the Sutherland formulation does not allow for different coefficientsfor different temperature ranges. Thus, the selection of the three data points is entirely arbitrary. For thecases considered here, it was determined that 200 K to 1,000 K would represent a sufficient temperaturerange. The third point used was the midpoint of the temperature range (600 K).
III.C. Exit Conditions
Flow conditions were provided at several stations inside the nozzle. These conditions include Mach number,pressure, density, temperature, and specific heat ratio as a function of radial coordinate. A station setinside the nozzle was chosen as a boundary condition. Using the profile data, a program was written whichinterpolated the data onto the nozzle inflow grid at this station. A pointwise data profile was therefore usedto set the boundary condition for each ACM motor inlet.
III.D. Solver Settings
The settings used in the GASP CFD solver are now discussed, including boundary conditions, fluxes, tur-bulence models, thermodynamic settings, and time integration.
For the far-field boundary, a non-reflective inflow/outflow boundary condition was imposed. This con-dition helps reduce non-physical, reflective signatures. For the solid walls, the no-slip adiabatic boundarycondition is used. For the ACM nozzles, the flow is supersonic and therefore fixed to the profiles providedfor each jet.
The selected turbulence model for the simulations is the Wilcox 1998 k-ω model. The selection for thismodel came from research by Viti et al.11 The k-ω turbulence model by Wilcox tends to be more accuratefor boundary layers with adverse pressure gradients when compared to other one and two-equation models.The k-ω model does not require wall functions and does an adequate job for various types of free shear flows.
5 of 16
American Institute of Aeronautics and Astronautics
With the k-ω model, eddy viscosity limiting was applied. This is intended to add stability to the systemof equations during the time integration process. While the solution evolves with time toward a steady (orunsteady) state, the values of TKE and omega may result in large, nonphysical values for the eddy viscosity.By limiting the eddy viscosity value, the solution can get past the transient stage and reach the final solutionwhere limiting may not be needed.
For the convective fluxes, the Van Leer flux vector splitting scheme is used. On each face, a third orderspatial reconstruction is performed. Due to the transonic nature of the flow, a modified ENO limiter isapplied to maintain numerical stability.
For the time integration, the Euler Implicit scheme is used. This is a first order time integration methodand for the current simulations a time step of 4x10⁻⁵ seconds was used.
IV. Passive Flow Control Concepts
As mentioned above, three passive flow control designs were initially planned for study, with a fourthheld as a reserve. These concepts are discussed below.
IV.A. Jet Diverter
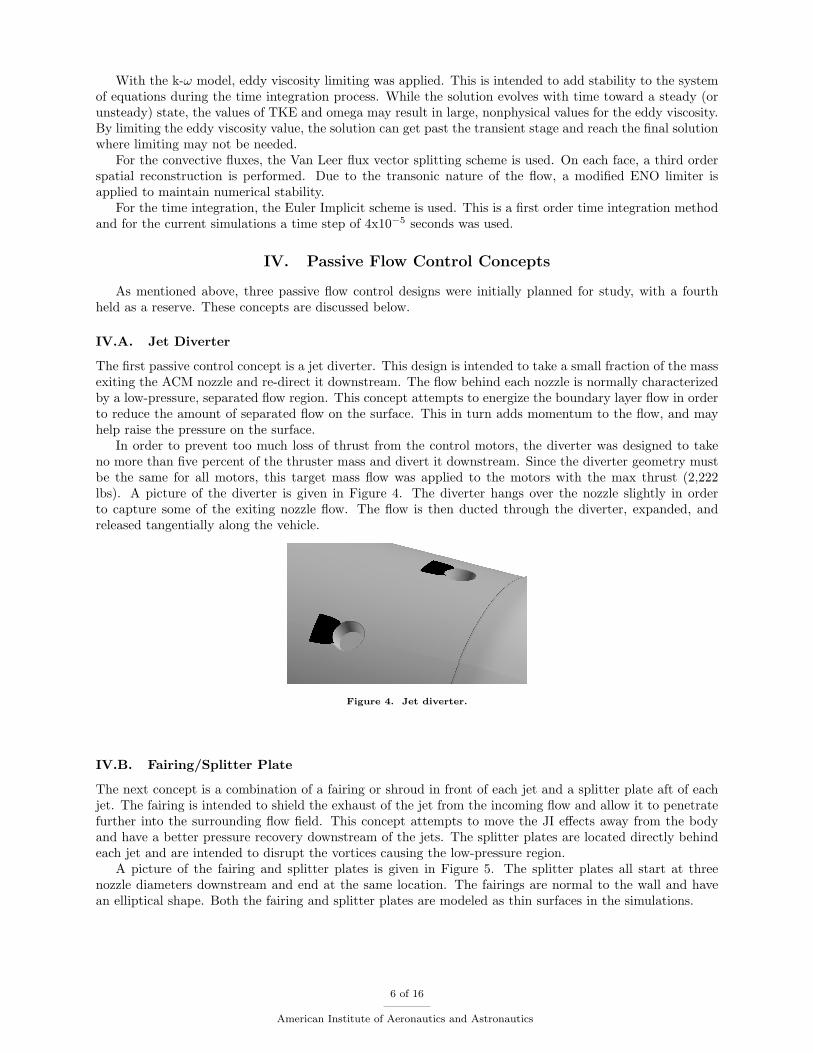
The first passive control concept is a jet diverter. This design is intended to take a small fraction of the massexiting the ACM nozzle and re-direct it downstream. The flow behind each nozzle is normally characterizedby a low-pressure, separated flow region. This concept attempts to energize the boundary layer flow in orderto reduce the amount of separated flow on the surface. This in turn adds momentum to the flow, and mayhelp raise the pressure on the surface.
In order to prevent too much loss of thrust from the control motors, the diverter was designed to takeno more than five percent of the thruster mass and divert it downstream. Since the diverter geometry mustbe the same for all motors, this target mass flow was applied to the motors with the max thrust (2,222lbs). A picture of the diverter is given in Figure 4. The diverter hangs over the nozzle slightly in orderto capture some of the exiting nozzle flow. The flow is then ducted through the diverter, expanded, andreleased tangentially along the vehicle.
Figure 4. Jet diverter.
IV.B. Fairing/Splitter Plate
The next concept is a combination of a fairing or shroud in front of each jet and a splitter plate aft of eachjet. The fairing is intended to shield the exhaust of the jet from the incoming flow and allow it to penetratefurther into the surrounding flow field. This concept attempts to move the JI effects away from the bodyand have a better pressure recovery downstream of the jets. The splitter plates are located directly behindeach jet and are intended to disrupt the vortices causing the low-pressure region.
A picture of the fairing and splitter plates is given in Figure 5. The splitter plates all start at threenozzle diameters downstream and end at the same location. The fairings are normal to the wall and havean elliptical shape. Both the fairing and splitter plates are modeled as thin surfaces in the simulations.
6 of 16
American Institute of Aeronautics and Astronautics
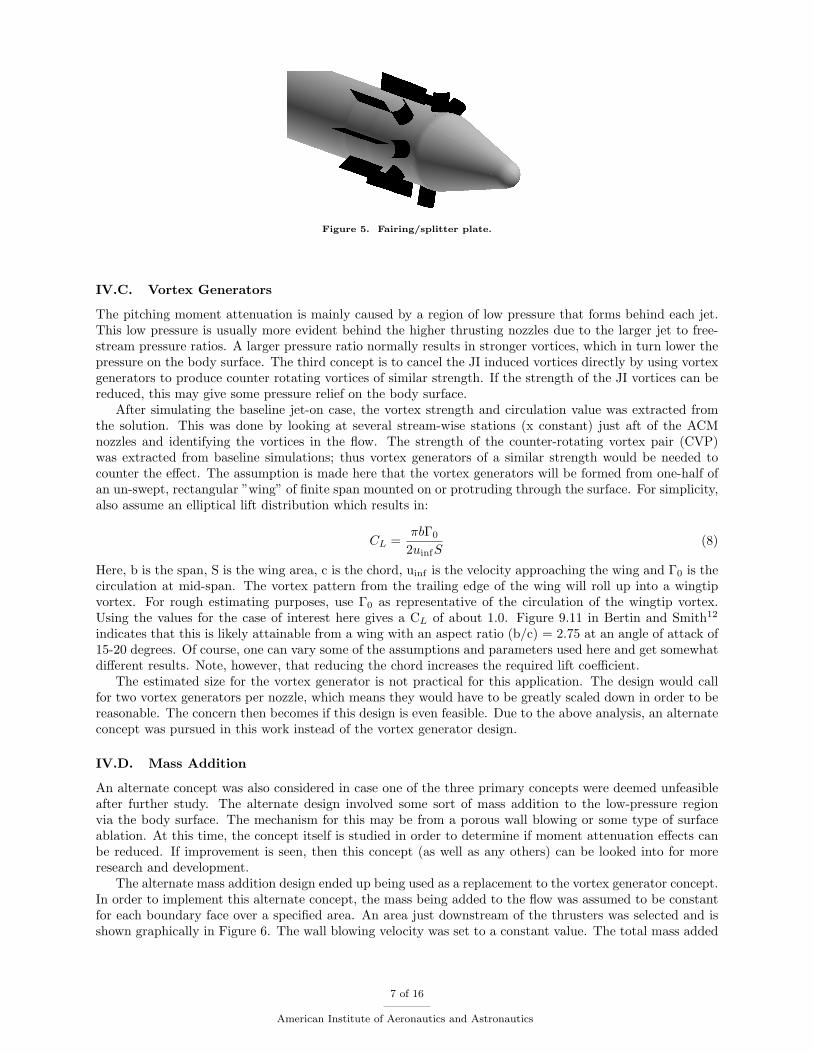
Figure 5. Fairing/splitter plate.
IV.C. Vortex Generators
The pitching moment attenuation is mainly caused by a region of low pressure that forms behind each jet.This low pressure is usually more evident behind the higher thrusting nozzles due to the larger jet to free-stream pressure ratios. A larger pressure ratio normally results in stronger vortices, which in turn lower thepressure on the body surface. The third concept is to cancel the JI induced vortices directly by using vortexgenerators to produce counter rotating vortices of similar strength. If the strength of the JI vortices can bereduced, this may give some pressure relief on the body surface.
After simulating the baseline jet-on case, the vortex strength and circulation value was extracted fromthe solution. This was done by looking at several stream-wise stations (x constant) just aft of the ACMnozzles and identifying the vortices in the flow. The strength of the counter-rotating vortex pair (CVP)was extracted from baseline simulations; thus vortex generators of a similar strength would be needed tocounter the effect. The assumption is made here that the vortex generators will be formed from one-half ofan un-swept, rectangular ”wing” of finite span mounted on or protruding through the surface. For simplicity,also assume an elliptical lift distribution which results in:
CL =πbΓ0
2uinfS(8)
Here, b is the span, S is the wing area, c is the chord, uinf is the velocity approaching the wing and Γ0 is thecirculation at mid-span. The vortex pattern from the trailing edge of the wing will roll up into a wingtipvortex. For rough estimating purposes, use Γ0 as representative of the circulation of the wingtip vortex.Using the values for the case of interest here gives a CL of about 1.0. Figure 9.11 in Bertin and Smith12
indicates that this is likely attainable from a wing with an aspect ratio (b/c) = 2.75 at an angle of attack of15-20 degrees. Of course, one can vary some of the assumptions and parameters used here and get somewhatdifferent results. Note, however, that reducing the chord increases the required lift coefficient.
The estimated size for the vortex generator is not practical for this application. The design would callfor two vortex generators per nozzle, which means they would have to be greatly scaled down in order to bereasonable. The concern then becomes if this design is even feasible. Due to the above analysis, an alternateconcept was pursued in this work instead of the vortex generator design.
IV.D. Mass Addition
An alternate concept was also considered in case one of the three primary concepts were deemed unfeasibleafter further study. The alternate design involved some sort of mass addition to the low-pressure regionvia the body surface. The mechanism for this may be from a porous wall blowing or some type of surfaceablation. At this time, the concept itself is studied in order to determine if moment attenuation effects canbe reduced. If improvement is seen, then this concept (as well as any others) can be looked into for moreresearch and development.
The alternate mass addition design ended up being used as a replacement to the vortex generator concept.In order to implement this alternate concept, the mass being added to the flow was assumed to be constantfor each boundary face over a specified area. An area just downstream of the thrusters was selected and isshown graphically in Figure 6. The wall blowing velocity was set to a constant value. The total mass added
7 of 16
American Institute of Aeronautics and Astronautics

to the flow is approximately ten percent of the thruster mass flow. This amount may be larger than what ispractical, but it should help reveal if this concept will work or not.
Figure 6. Mass addition area.
IV.E. Porous Wall
An additional simulation was done in which a passive porous wall boundary condition was applied. This is avariation of the blowing case discussed above. Here, a porous wall boundary condition is used to determinethe wall velocity, which will be unique for each boundary face. The assumptions of the porous wall conditionare as follows:
• Homogeneous pressure and temperature in the cavity region.
• Homogeneous distribution of holes.
• Turbulence is treated as a no-slip wall.
• Poll’s law is used to governing the flow velocity passing through the holes and is valid for cases inwhich the ratio of hole diameters to plate thickness is small.
• A velocity is applied at each boundary face and represents the porous wall physics. Mass in the cavityregion is not preserved such that an outside source feeds or extracts mass as needed.
The boundary condition will result in either blowing or suction at a boundary face depending on thelocal pressure. For the current simulation, the following parameters were set:
• Porosity (ratio of total hole area to porous surface area) = 0.20
• Non-cylindrical hole correction factor = 1.0
V. Results
For each passive flow control concept, plus the baseline with no modifications, two simulations were run:jets on and jets off. The cases with jets off serve as a reference to compute the relative attenuation.
Due to the unsteady nature of the flow, the forces and moments have an oscillatory behavior. This isseen in Figure 7 where the body normal force (CN ) is shown in coefficient form. Recall that the normalbody force is rotated 22.5 degrees off the direction of the net total force. The normal force appears to bedominated by the underlying geometry, and not by the ACM motors or the added passive control system.The shedding from the external abort motors is the primary driver for the oscillations. The abort motorsare symmetric about the direction of CN . The fairing/splitter plate concept had a slightly larger normalforce than the other concepts and baseline case. This is likely due to the additional surfaces which helpedto increase the force.
The side body force (CY ) is shown in Figure 8. Here, the force magnitudes are much smaller, but someoscillatory behavior can still be observed. This force is much more influenced by what is happening aroundthe ACM. The larger oscillations are seen for the jet on cases, especially for the fairing/plate concept. Recallthat this configuration has the net thrust off-axis. Due to the staggering of the motors, this produces anasymmetry in the flow-field leading to stronger oscillations in the side force when the jets are on.
8 of 16
American Institute of Aeronautics and Astronautics
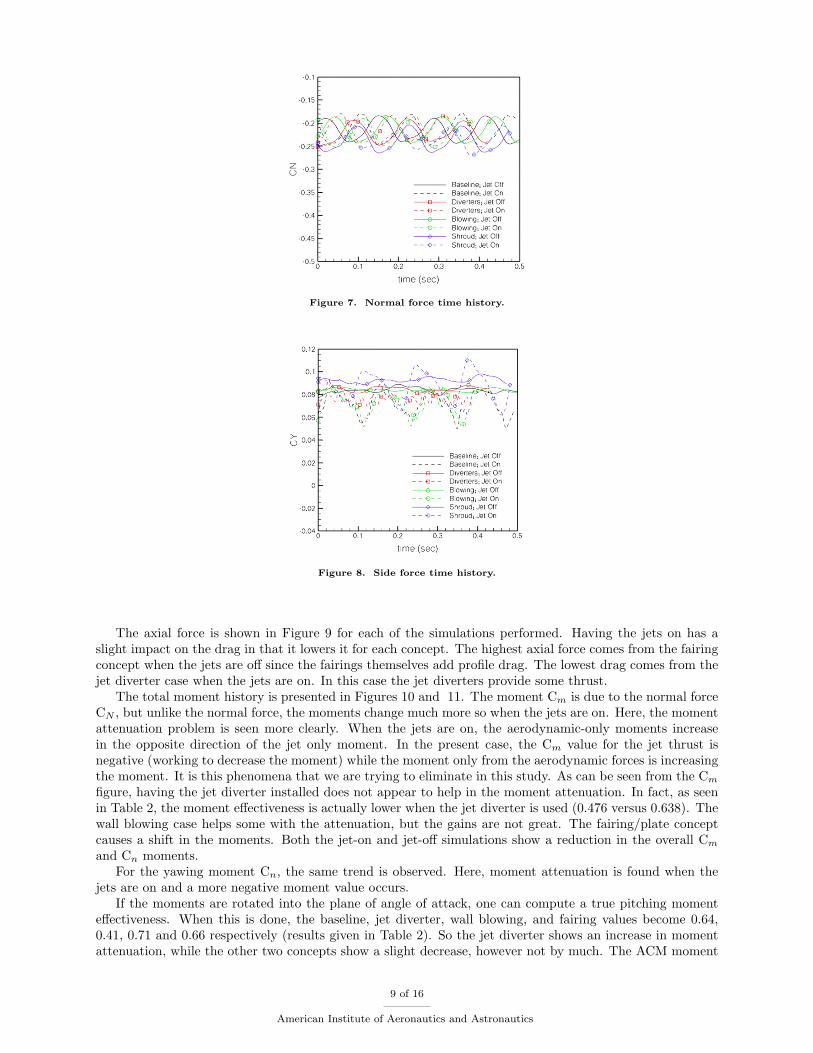
Figure 7. Normal force time history.
Figure 8. Side force time history.
The axial force is shown in Figure 9 for each of the simulations performed. Having the jets on has aslight impact on the drag in that it lowers it for each concept. The highest axial force comes from the fairingconcept when the jets are off since the fairings themselves add profile drag. The lowest drag comes from thejet diverter case when the jets are on. In this case the jet diverters provide some thrust.
The total moment history is presented in Figures 10 and 11. The moment Cm is due to the normal forceCN , but unlike the normal force, the moments change much more so when the jets are on. Here, the momentattenuation problem is seen more clearly. When the jets are on, the aerodynamic-only moments increasein the opposite direction of the jet only moment. In the present case, the Cm value for the jet thrust isnegative (working to decrease the moment) while the moment only from the aerodynamic forces is increasingthe moment. It is this phenomena that we are trying to eliminate in this study. As can be seen from the Cm
figure, having the jet diverter installed does not appear to help in the moment attenuation. In fact, as seenin Table 2, the moment effectiveness is actually lower when the jet diverter is used (0.476 versus 0.638). Thewall blowing case helps some with the attenuation, but the gains are not great. The fairing/plate conceptcauses a shift in the moments. Both the jet-on and jet-off simulations show a reduction in the overall Cm
and Cn moments.For the yawing moment Cn, the same trend is observed. Here, moment attenuation is found when the
jets are on and a more negative moment value occurs.If the moments are rotated into the plane of angle of attack, one can compute a true pitching moment
effectiveness. When this is done, the baseline, jet diverter, wall blowing, and fairing values become 0.64,0.41, 0.71 and 0.66 respectively (results given in Table 2). So the jet diverter shows an increase in momentattenuation, while the other two concepts show a slight decrease, however not by much. The ACM moment
9 of 16
American Institute of Aeronautics and Astronautics

Figure 9. Axial force time history.
Figure 10. Pitching moment time history.
effectiveness is defined by:
ACMeff = 1− Cm−jets−off − Cm−jets−on
Cm−jets−only(9)
The rotated pitching moment (Cm’) is obtained by the following transformation:
C ′m = Cm cos(22.5◦)− Cn sin(22.5◦) (10)
V.A. Stream-wise Pressure Plots
The coefficient of pressure (Cp) is plotted in Figure 12 along a stream-wise line going through ACM nozzle 1.Recall that nozzle 1 has the max thrust (2,222 lbf) and is in the aft row of jets. It is downstream of nozzles1 and 2 where we are trying to raise the pressure. The corresponding line of pressure for the opposite side(line going through ACM nozzle 8) is also shown in Figure 12. In both plots the ACM nozzle is in the regionx/Sref of 0.29-0.31 where x begins at the nose and Sref is the reference length of 198 inches. The plots showthe pressure from the nose to the external abort motors for the jet on cases.
The concept which had the best pressure rise compared to the baseline case is the fairing/splitter plate.For this concept, the placement of the fairing upstream of each nozzle does not seem to have much impacton the surface pressure in that region. Just after the jet, a low-pressure region is observed which is largerthan the other cases. But this quickly transitions to a larger region of high pressure which is desirable forthis problem. The Cp line in this high pressure region corresponds to the location of the splitter plate, which
10 of 16
American Institute of Aeronautics and Astronautics
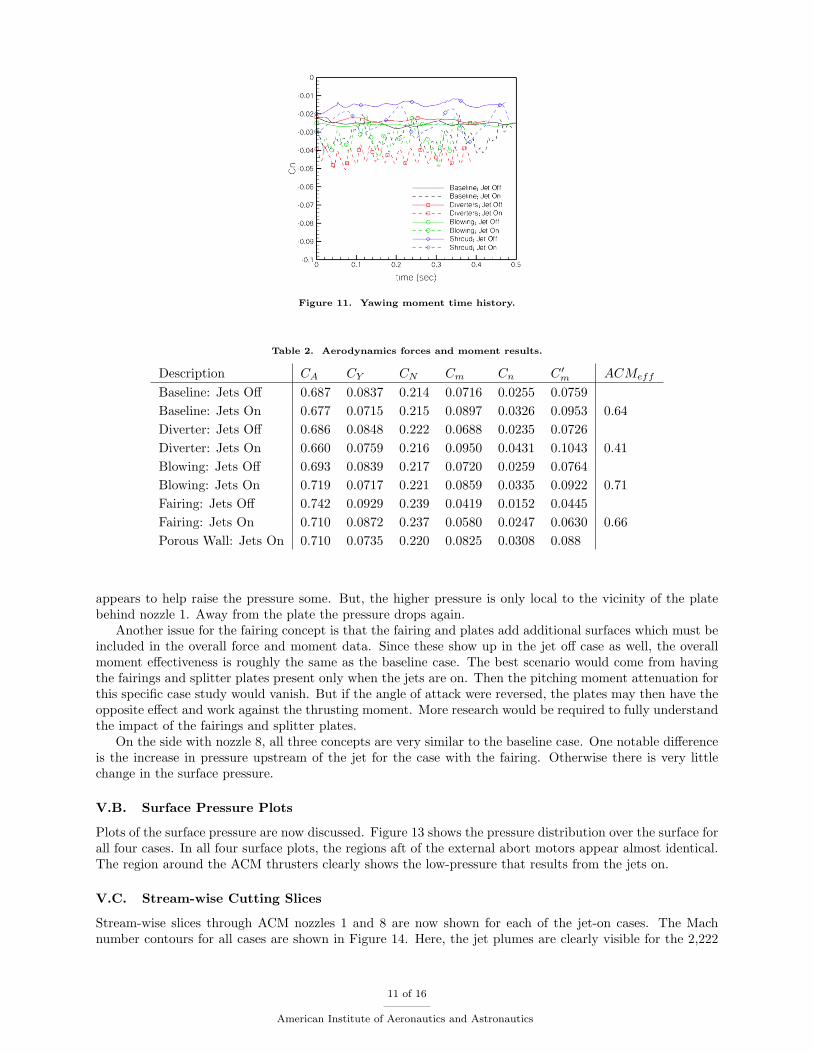
Figure 11. Yawing moment time history.
Table 2. Aerodynamics forces and moment results.
Description CA CY CN Cm Cn C ′m ACMeff
Baseline: Jets Off 0.687 0.0837 0.214 0.0716 0.0255 0.0759Baseline: Jets On 0.677 0.0715 0.215 0.0897 0.0326 0.0953 0.64Diverter: Jets Off 0.686 0.0848 0.222 0.0688 0.0235 0.0726Diverter: Jets On 0.660 0.0759 0.216 0.0950 0.0431 0.1043 0.41Blowing: Jets Off 0.693 0.0839 0.217 0.0720 0.0259 0.0764Blowing: Jets On 0.719 0.0717 0.221 0.0859 0.0335 0.0922 0.71Fairing: Jets Off 0.742 0.0929 0.239 0.0419 0.0152 0.0445Fairing: Jets On 0.710 0.0872 0.237 0.0580 0.0247 0.0630 0.66Porous Wall: Jets On 0.710 0.0735 0.220 0.0825 0.0308 0.088
appears to help raise the pressure some. But, the higher pressure is only local to the vicinity of the platebehind nozzle 1. Away from the plate the pressure drops again.
Another issue for the fairing concept is that the fairing and plates add additional surfaces which must beincluded in the overall force and moment data. Since these show up in the jet off case as well, the overallmoment effectiveness is roughly the same as the baseline case. The best scenario would come from havingthe fairings and splitter plates present only when the jets are on. Then the pitching moment attenuation forthis specific case study would vanish. But if the angle of attack were reversed, the plates may then have theopposite effect and work against the thrusting moment. More research would be required to fully understandthe impact of the fairings and splitter plates.
On the side with nozzle 8, all three concepts are very similar to the baseline case. One notable differenceis the increase in pressure upstream of the jet for the case with the fairing. Otherwise there is very littlechange in the surface pressure.
V.B. Surface Pressure Plots
Plots of the surface pressure are now discussed. Figure 13 shows the pressure distribution over the surface forall four cases. In all four surface plots, the regions aft of the external abort motors appear almost identical.The region around the ACM thrusters clearly shows the low-pressure that results from the jets on.
V.C. Stream-wise Cutting Slices
Stream-wise slices through ACM nozzles 1 and 8 are now shown for each of the jet-on cases. The Machnumber contours for all cases are shown in Figure 14. Here, the jet plumes are clearly visible for the 2,222
11 of 16
American Institute of Aeronautics and Astronautics

Figure 12. Pressure line plots.
Figure 13. Surface pressure on body.
lbf nozzle (shown on bottom) and the 865 lbf nozzle (shown on top). The higher thrusting nozzle has strongerJI effects which cause a much larger low-velocity region. The corresponding pressure contours are shown inFigure 15 which more clearly shows the low-pressure region aft of the nozzles.
For the jet diverter case, an increase in Mach number is observed just aft of the nozzles. But furtherdownstream, a lower Mach number region reappears for the diverter case compared to the baseline case forthe bottom jet. So the jet diverters appear to be adding momentum to the flow near the surface, but notover the entire low-pressure region. The extent of the low-pressure region appears to be reduced for thediverter case compared to the baseline, but it is not enough to reduce any of the moment attenuation asdiscussed earlier.
The wall blowing case appears to expand the bottom low-speed region in the direction of the blowing.As for the surface pressure, it still appears very similar to the baseline case.
The fairing concept, on the other hand, has a large impact on the flow structure. The splitter plates helpreduce the extent of the separated region near the surface. This is also evident in the pressure contour plotshown in Figure 15. The surface pressure is much higher downstream of the plates compared to the baselinecase, but there is a much larger low-pressure region in the flow directly behind the exiting nozzle gas.
V.D. Particle Trace Plots
Particle traces colored with Mach number were seeded inside the two 2,222 lbf nozzles. The plots showingthe particles for each case are given in Figure 16. In this figure, the particles travel out and away from thebody and into the plume region. For the jet diverter case, some of the particles travel through the diverter.The particles quickly turn away from the surface and head out into the plume region. A portion of theparticles coming from the rearward nozzle are entrained into a separated flow region.
For the wall blowing case, the particle paths are very similar to those of the baseline case. Of all the
12 of 16
American Institute of Aeronautics and Astronautics
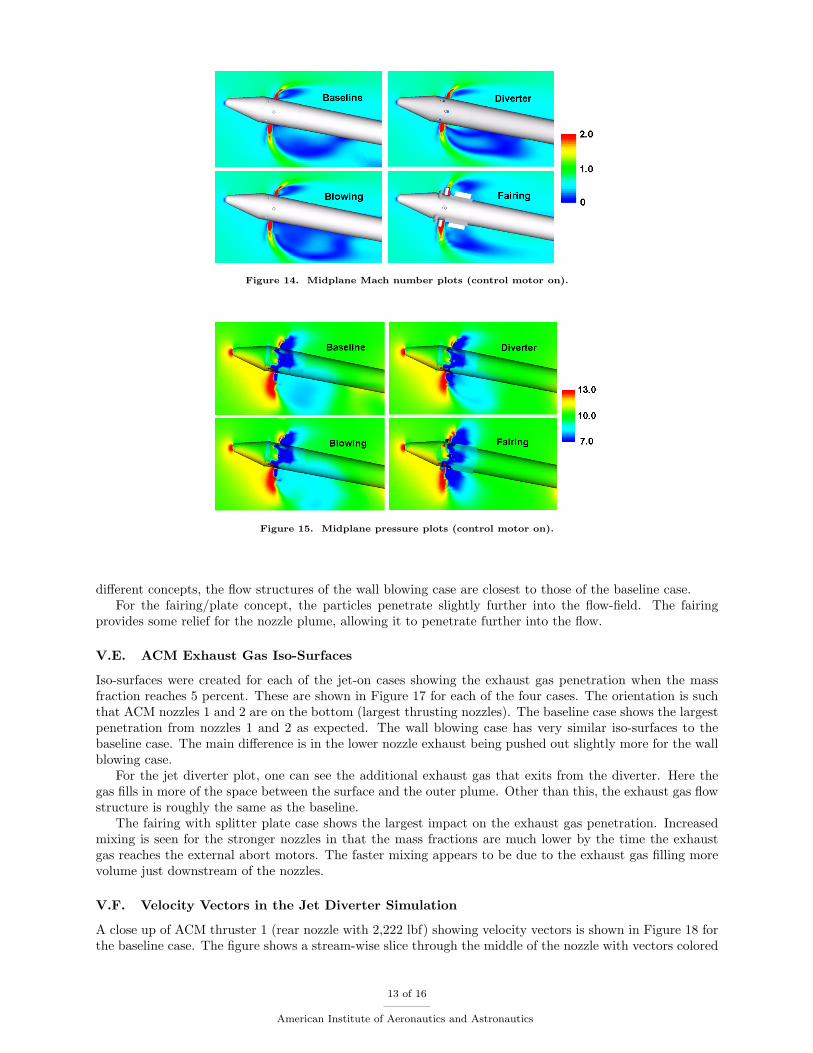
Figure 14. Midplane Mach number plots (control motor on).
Figure 15. Midplane pressure plots (control motor on).
different concepts, the flow structures of the wall blowing case are closest to those of the baseline case.For the fairing/plate concept, the particles penetrate slightly further into the flow-field. The fairing
provides some relief for the nozzle plume, allowing it to penetrate further into the flow.
V.E. ACM Exhaust Gas Iso-Surfaces
Iso-surfaces were created for each of the jet-on cases showing the exhaust gas penetration when the massfraction reaches 5 percent. These are shown in Figure 17 for each of the four cases. The orientation is suchthat ACM nozzles 1 and 2 are on the bottom (largest thrusting nozzles). The baseline case shows the largestpenetration from nozzles 1 and 2 as expected. The wall blowing case has very similar iso-surfaces to thebaseline case. The main difference is in the lower nozzle exhaust being pushed out slightly more for the wallblowing case.
For the jet diverter plot, one can see the additional exhaust gas that exits from the diverter. Here thegas fills in more of the space between the surface and the outer plume. Other than this, the exhaust gas flowstructure is roughly the same as the baseline.
The fairing with splitter plate case shows the largest impact on the exhaust gas penetration. Increasedmixing is seen for the stronger nozzles in that the mass fractions are much lower by the time the exhaustgas reaches the external abort motors. The faster mixing appears to be due to the exhaust gas filling morevolume just downstream of the nozzles.
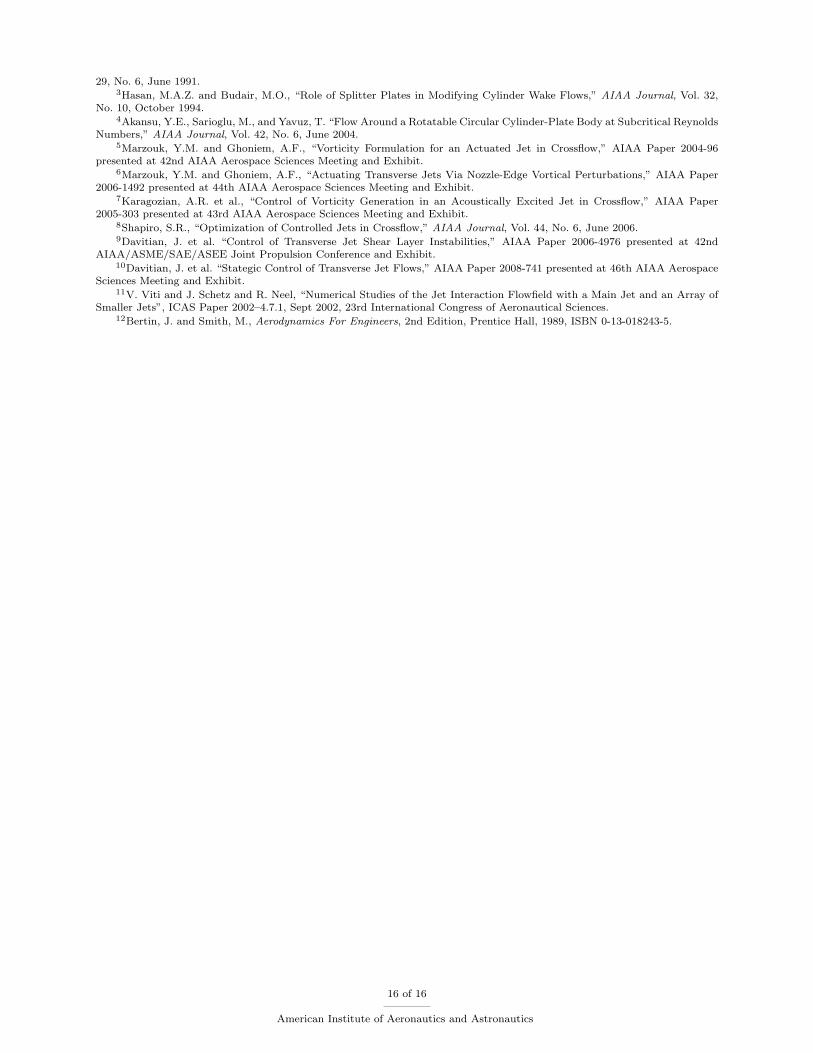
V.F. Velocity Vectors in the Jet Diverter Simulation
A close up of ACM thruster 1 (rear nozzle with 2,222 lbf) showing velocity vectors is shown in Figure 18 forthe baseline case. The figure shows a stream-wise slice through the middle of the nozzle with vectors colored
13 of 16
American Institute of Aeronautics and Astronautics
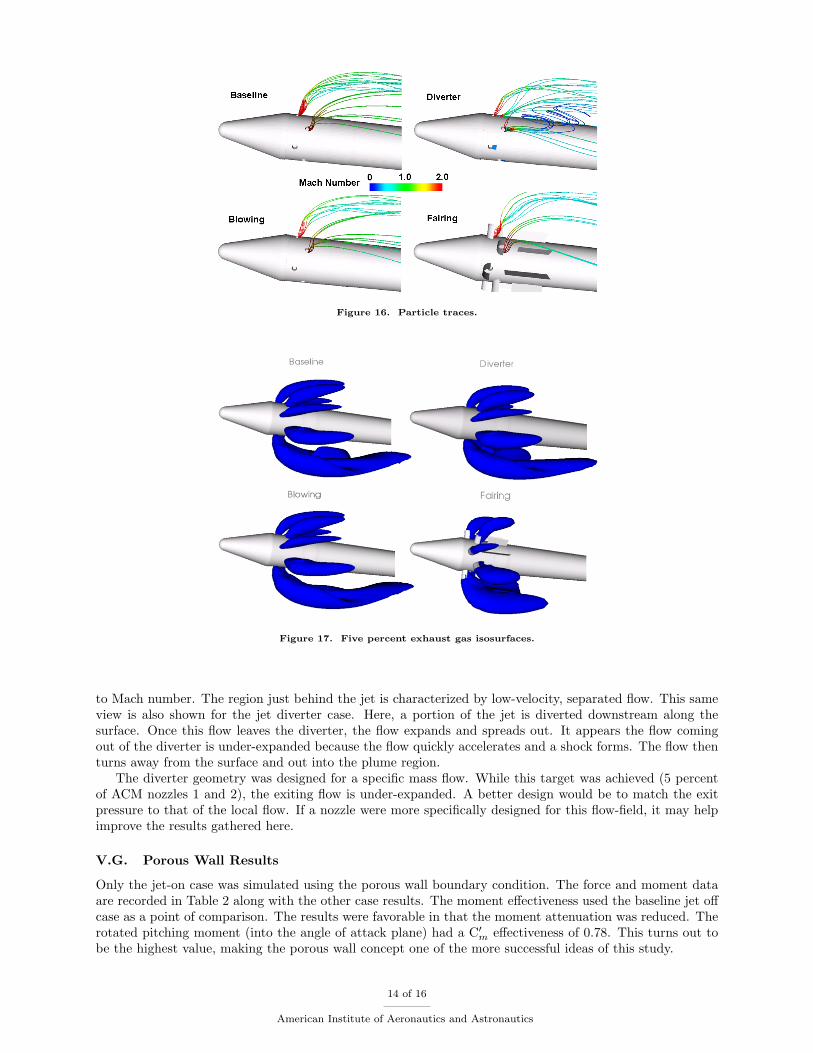
Figure 16. Particle traces.
Figure 17. Five percent exhaust gas isosurfaces.
to Mach number. The region just behind the jet is characterized by low-velocity, separated flow. This sameview is also shown for the jet diverter case. Here, a portion of the jet is diverted downstream along thesurface. Once this flow leaves the diverter, the flow expands and spreads out. It appears the flow comingout of the diverter is under-expanded because the flow quickly accelerates and a shock forms. The flow thenturns away from the surface and out into the plume region.
The diverter geometry was designed for a specific mass flow. While this target was achieved (5 percentof ACM nozzles 1 and 2), the exiting flow is under-expanded. A better design would be to match the exitpressure to that of the local flow. If a nozzle were more specifically designed for this flow-field, it may helpimprove the results gathered here.
V.G. Porous Wall Results
Only the jet-on case was simulated using the porous wall boundary condition. The force and moment dataare recorded in Table 2 along with the other case results. The moment effectiveness used the baseline jet offcase as a point of comparison. The results were favorable in that the moment attenuation was reduced. Therotated pitching moment (into the angle of attack plane) had a C′m effectiveness of 0.78. This turns out tobe the highest value, making the porous wall concept one of the more successful ideas of this study.
14 of 16
American Institute of Aeronautics and Astronautics
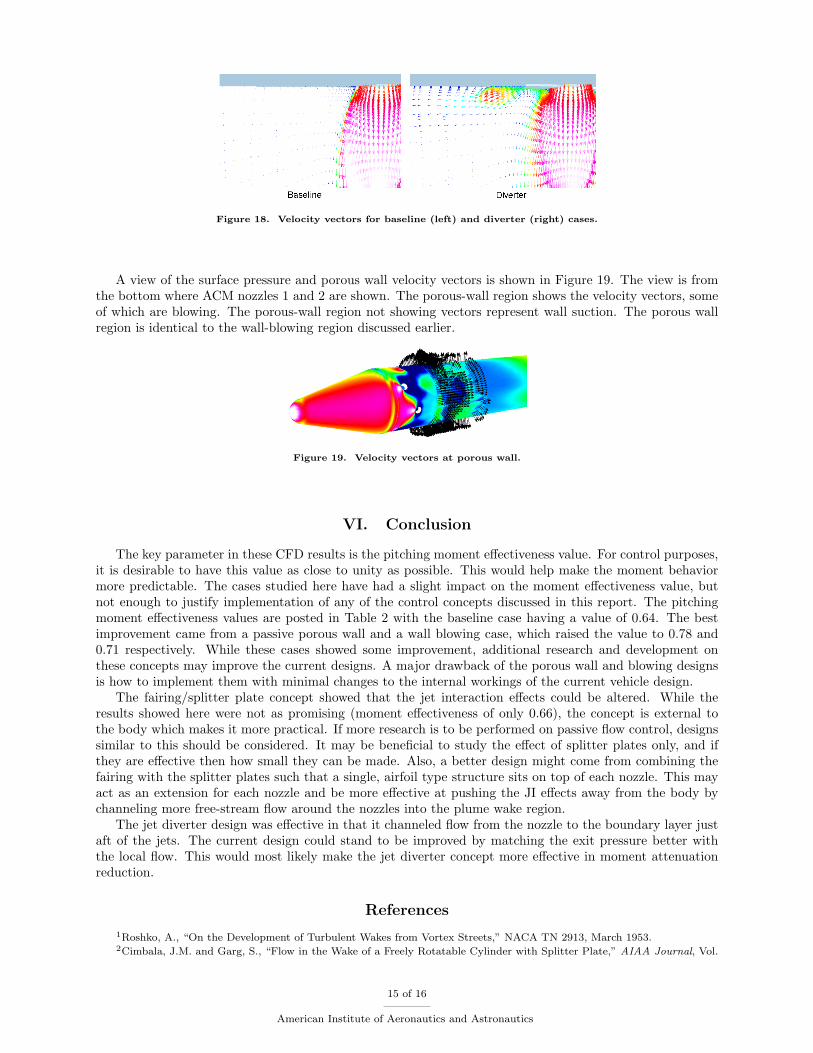
Figure 18. Velocity vectors for baseline (left) and diverter (right) cases.
A view of the surface pressure and porous wall velocity vectors is shown in Figure 19. The view is fromthe bottom where ACM nozzles 1 and 2 are shown. The porous-wall region shows the velocity vectors, someof which are blowing. The porous-wall region not showing vectors represent wall suction. The porous wallregion is identical to the wall-blowing region discussed earlier.
Figure 19. Velocity vectors at porous wall.
VI. Conclusion
The key parameter in these CFD results is the pitching moment effectiveness value. For control purposes,it is desirable to have this value as close to unity as possible. This would help make the moment behaviormore predictable. The cases studied here have had a slight impact on the moment effectiveness value, butnot enough to justify implementation of any of the control concepts discussed in this report. The pitchingmoment effectiveness values are posted in Table 2 with the baseline case having a value of 0.64. The bestimprovement came from a passive porous wall and a wall blowing case, which raised the value to 0.78 and0.71 respectively. While these cases showed some improvement, additional research and development onthese concepts may improve the current designs. A major drawback of the porous wall and blowing designsis how to implement them with minimal changes to the internal workings of the current vehicle design.
The fairing/splitter plate concept showed that the jet interaction effects could be altered. While theresults showed here were not as promising (moment effectiveness of only 0.66), the concept is external tothe body which makes it more practical. If more research is to be performed on passive flow control, designssimilar to this should be considered. It may be beneficial to study the effect of splitter plates only, and ifthey are effective then how small they can be made. Also, a better design might come from combining thefairing with the splitter plates such that a single, airfoil type structure sits on top of each nozzle. This mayact as an extension for each nozzle and be more effective at pushing the JI effects away from the body bychanneling more free-stream flow around the nozzles into the plume wake region.
The jet diverter design was effective in that it channeled flow from the nozzle to the boundary layer justaft of the jets. The current design could stand to be improved by matching the exit pressure better withthe local flow. This would most likely make the jet diverter concept more effective in moment attenuationreduction.
References
1Roshko, A., “On the Development of Turbulent Wakes from Vortex Streets,” NACA TN 2913, March 1953.2Cimbala, J.M. and Garg, S., “Flow in the Wake of a Freely Rotatable Cylinder with Splitter Plate,” AIAA Journal, Vol.
15 of 16
American Institute of Aeronautics and Astronautics
29, No. 6, June 1991.3Hasan, M.A.Z. and Budair, M.O., “Role of Splitter Plates in Modifying Cylinder Wake Flows,” AIAA Journal, Vol. 32,
No. 10, October 1994.4Akansu, Y.E., Sarioglu, M., and Yavuz, T. “Flow Around a Rotatable Circular Cylinder-Plate Body at Subcritical Reynolds
Numbers,” AIAA Journal, Vol. 42, No. 6, June 2004.5Marzouk, Y.M. and Ghoniem, A.F., “Vorticity Formulation for an Actuated Jet in Crossflow,” AIAA Paper 2004-96
presented at 42nd AIAA Aerospace Sciences Meeting and Exhibit.6Marzouk, Y.M. and Ghoniem, A.F., “Actuating Transverse Jets Via Nozzle-Edge Vortical Perturbations,” AIAA Paper
2006-1492 presented at 44th AIAA Aerospace Sciences Meeting and Exhibit.7Karagozian, A.R. et al., “Control of Vorticity Generation in an Acoustically Excited Jet in Crossflow,” AIAA Paper
2005-303 presented at 43rd AIAA Aerospace Sciences Meeting and Exhibit.8Shapiro, S.R., “Optimization of Controlled Jets in Crossflow,” AIAA Journal, Vol. 44, No. 6, June 2006.9Davitian, J. et al. “Control of Transverse Jet Shear Layer Instabilities,” AIAA Paper 2006-4976 presented at 42nd
AIAA/ASME/SAE/ASEE Joint Propulsion Conference and Exhibit.10Davitian, J. et al. “Stategic Control of Transverse Jet Flows,” AIAA Paper 2008-741 presented at 46th AIAA Aerospace
Sciences Meeting and Exhibit.11V. Viti and J. Schetz and R. Neel, “Numerical Studies of the Jet Interaction Flowfield with a Main Jet and an Array of
Smaller Jets”, ICAS Paper 2002–4.7.1, Sept 2002, 23rd International Congress of Aeronautical Sciences.12Bertin, J. and Smith, M., Aerodynamics For Engineers, 2nd Edition, Prentice Hall, 1989, ISBN 0-13-018243-5.
16 of 16
American Institute of Aeronautics and Astronautics


![Constrained Geometric Attitude Control on SO 3 · 2017. 11. 28. · attitude stabilization using continuous time-invariant feedback [3]. Attitude control is typically studied using](https://img.pdfslide.us/doc/110x75/60a4eb0ae410a9227605d582/constrained-geometric-attitude-control-on-so-3-2017-11-28-attitude-stabilization.jpg)