Embed Size (px)
Citation preview
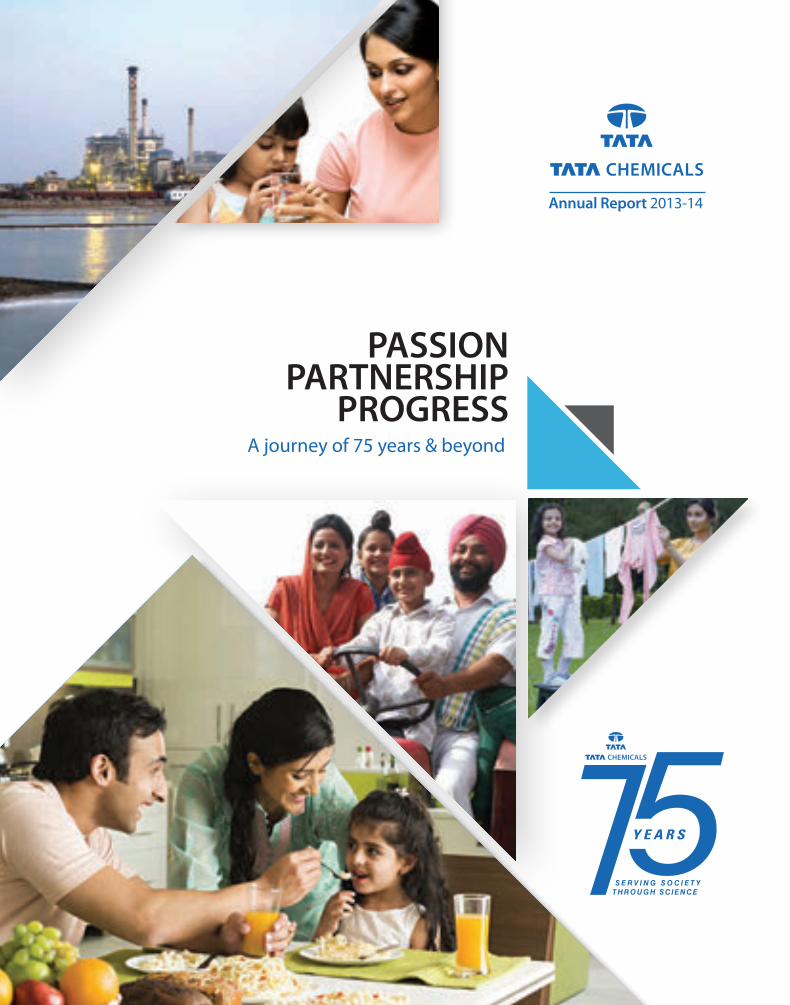
PASSIONPARTNERSHIP
PROGRESS
Annual Report 2013-14
A journey of 75 years & beyond
AGMThursday, 21st August, 2014Time: 3:00 p.m.
VenueBirla Matushri Sabhagar, 19, Sir Vithaldas Thackersey Marg, Mumbai – 400 020.
Book closure dates 12th August, 2014 to 21st August, 2014
Contents
87 FINANCIAL STATEMENTSStandalone Financial Statements87 Independent Auditors’ Report90 Balance Sheet91 Statement of Profit and Loss92 Cash Flow Statement94 Notes forming part of the Financial Statements126 Summary of Financial Information of
Subsidiary Companies
Consolidated Financial Statements128 Independent Auditors’ Report130 Consolidated Balance Sheet131 Consolidated Statement of Profit and Loss132 Consolidated Cash Flow Statement134 Notes forming part of the
Consolidated Financial Statements163 Financial Statistics
Proxy/Attendance Slip
STATUTORY REPORTS25 Notice42 Directors' Report55 Management Discussion and Analysis72 Corporate Governance Report86 Business Responsibility Report - Summary
25
02 Tata Chemicals at a Glance04 Key Milestones06 The Formative Years (1939-1953)08 Expansion & Consolidation (1954-1968)10 Building Social Capital (1969-1983)12 Expanding Verticals (1984-1998)14 Growth & Globalisation (1999-2013)16 Forging Ahead (2014 & beyond)20 Board of Directors21 Senior Management22 Financial Highlights24 Awards and Accolades
CORPORATE OVERVIEW
02
1
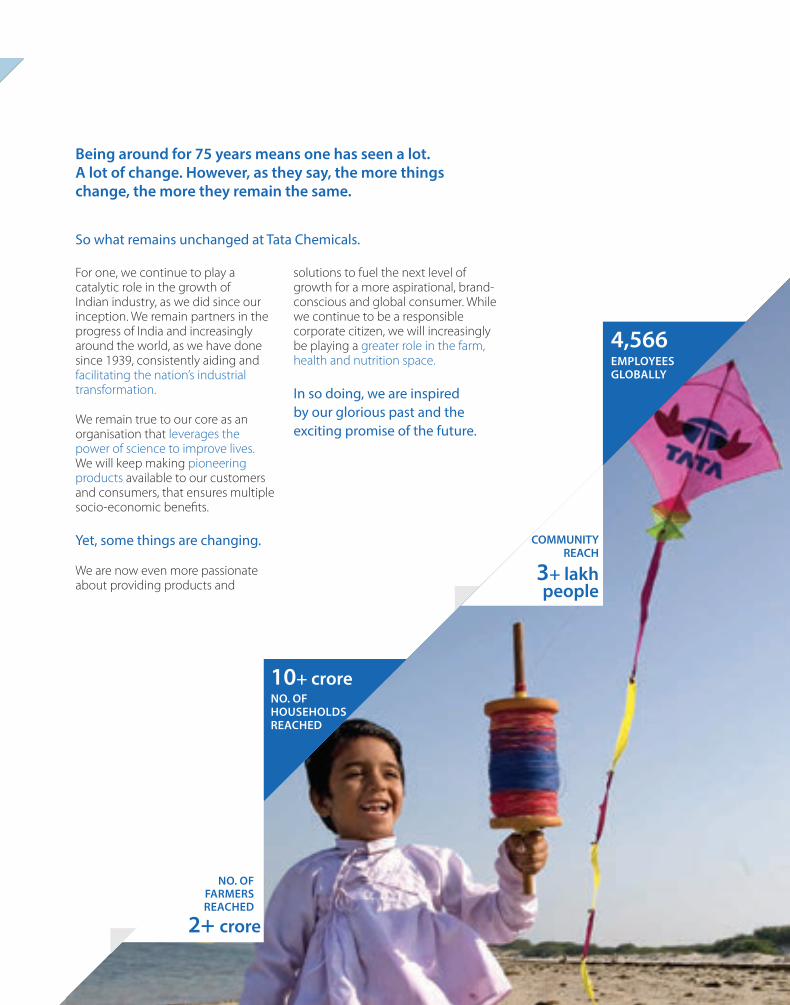
3+ lakhpeople
COMMUNITYREACH
4,566EMPLOYEES GLOBALLY
10+ croreNO. OF HOUSEHOLDS REACHED
Being around for 75 years means one has seen a lot. A lot of change. However, as they say, the more things change, the more they remain the same.
For one, we continue to play a catalytic role in the growth of Indian industry, as we did since our inception. We remain partners in the progress of India and increasingly around the world, as we have done since 1939, consistently aiding and facilitating the nation’s industrial transformation.
We remain true to our core as an organisation that leverages the power of science to improve lives. We will keep making pioneering products available to our customers and consumers, that ensures multiple socio-economic benefits.
Yet, some things are changing.
We are now even more passionate about providing products and
solutions to fuel the next level of growth for a more aspirational, brand-conscious and global consumer. While we continue to be a responsible corporate citizen, we will increasingly be playing a greater role in the farm, health and nutrition space.
In so doing, we are inspired by our glorious past and the exciting promise of the future.
So what remains unchanged at Tata Chemicals.
2+ crore
NO. OF FARMERS REACHED
75th ANNUAL REPORT 2013-14
TATA CHEMICALS LIMITED22 TATA CHEMICALS LIMITED
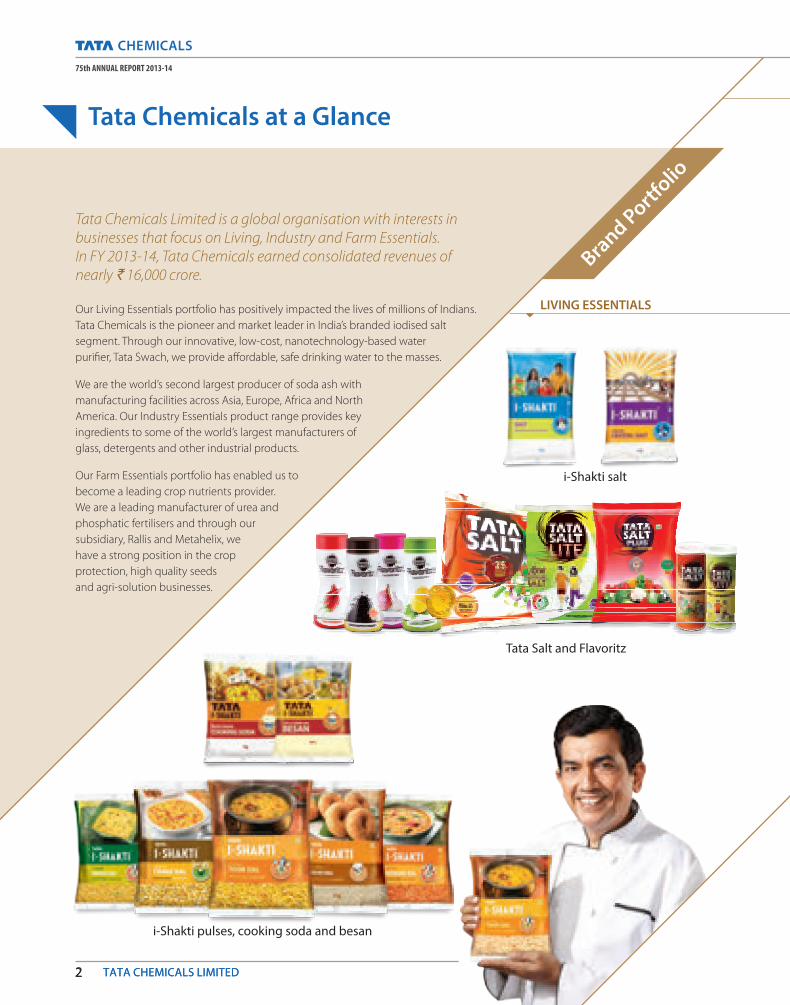
Tata Chemicals at a Glance
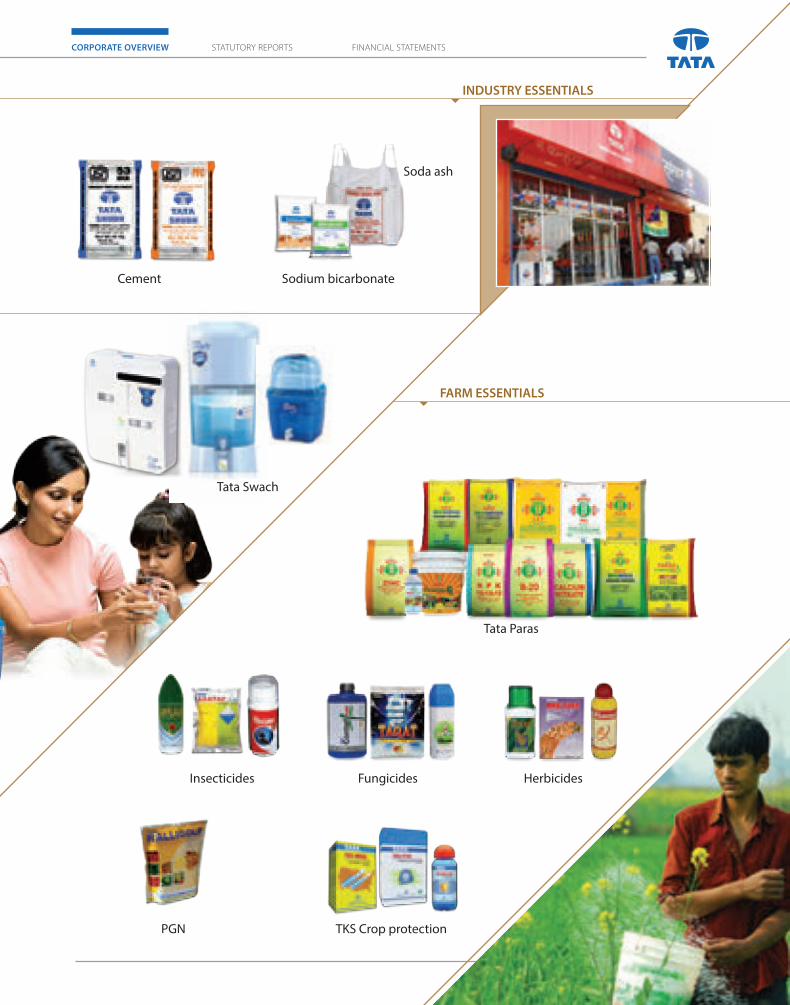
Tata Chemicals Limited is a global organisation with interests in businesses that focus on Living, Industry and Farm Essentials. In FY 2013-14, Tata Chemicals earned consolidated revenues of nearly ` 16,000 crore.
Our Living Essentials portfolio has positively impacted the lives of millions of Indians. Tata Chemicals is the pioneer and market leader in India’s branded iodised salt segment. Through our innovative, low-cost, nanotechnology-based water purifier, Tata Swach, we provide affordable, safe drinking water to the masses.
We are the world’s second largest producer of soda ash with manufacturing facilities across Asia, Europe, Africa and North America. Our Industry Essentials product range provides key ingredients to some of the world’s largest manufacturers of glass, detergents and other industrial products.
Our Farm Essentials portfolio has enabled us to become a leading crop nutrients provider. We are a leading manufacturer of urea and phosphatic fertilisers and through our subsidiary, Rallis and Metahelix, we have a strong position in the crop protection, high quality seeds and agri-solution businesses.
i-Shakti salt
Tata Salt and Flavoritz
i-Shakti pulses, cooking soda and besan
LIVING ESSENTIALS
Brand Portfolio
CORPORATE OVERVIEW FINANCIAL STATEMENTSSTATUTORY REPORTS
33
Insecticides Herbicides
TKS Crop protection PGN
Fungicides
Tata Swach
Cement Sodium bicarbonate
Soda ash
Tata Paras
INDUSTRY ESSENTIALS
FARM ESSENTIALS
75th ANNUAL REPORT 2013-14
TATA CHEMICALS LIMITED4
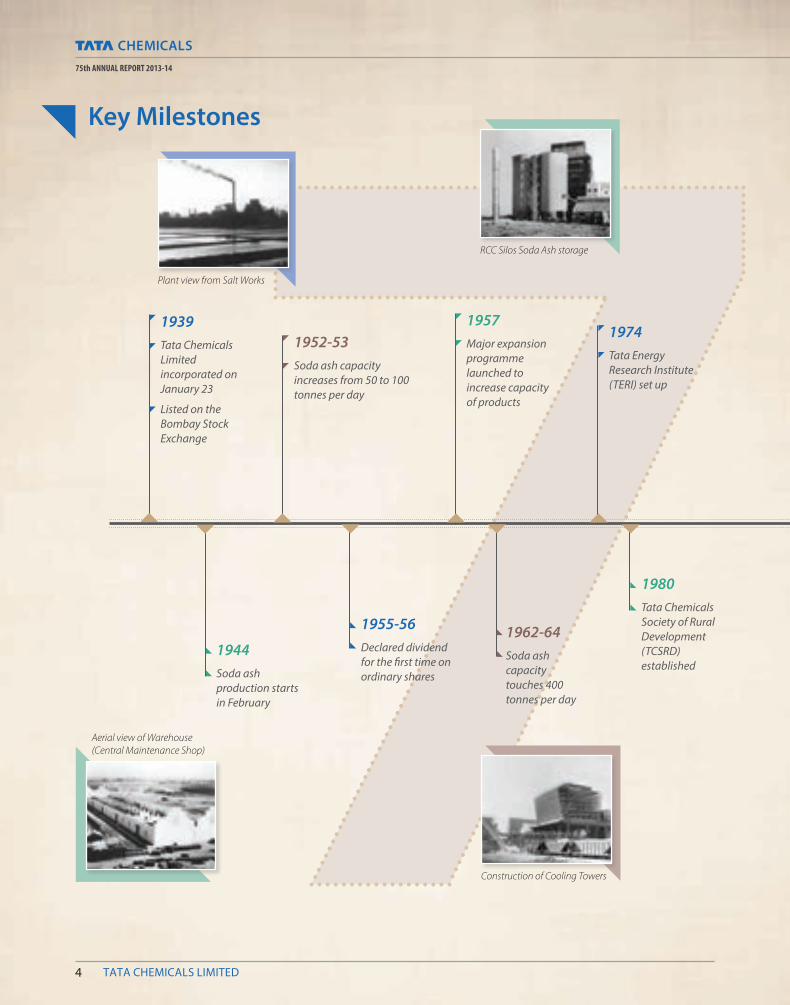
1939Tata Chemicals Limited incorporated on January 23
Listed on the Bombay Stock Exchange
1944Soda ash production starts in February
1952-53Soda ash capacity increases from 50 to 100 tonnes per day
1955-56Declared dividend for the first time on ordinary shares
1980Tata Chemicals Society of Rural Development (TCSRD) established
1957Major expansion programme launched to increase capacity of products
1962-64Soda ash capacity touches 400 tonnes per day
1974Tata Energy Research Institute (TERI) set up
Key Milestones
Plant view from Salt Works
Construction of Cooling Towers
RCC Silos Soda Ash storage
Aerial view of Warehouse (Central Maintenance Shop)
75th ANNUAL REPORT 2013-14
4 TATA CHEMICALS LIMITED
CORPORATE OVERVIEW FINANCIAL STATEMENTSSTATUTORY REPORTS
5
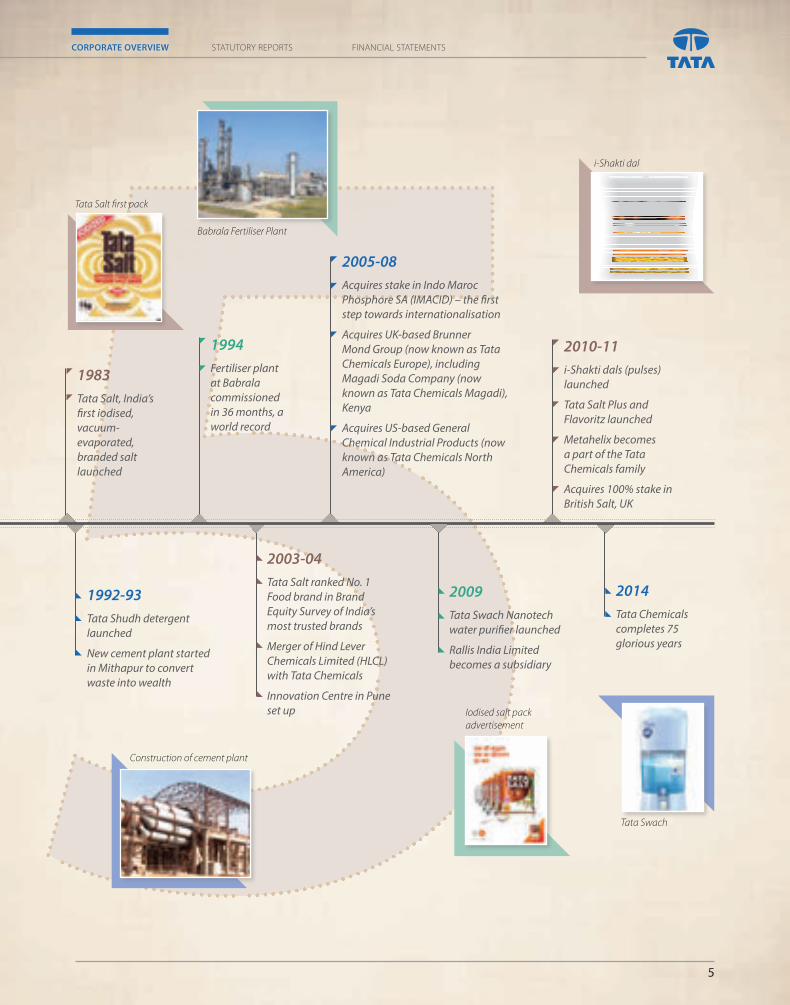
1992-93Tata Shudh detergent launched
New cement plant started in Mithapur to convert waste into wealth
1983Tata Salt, India’s first iodised, vacuum-evaporated, branded salt launched
Babrala Fertiliser Plant
Tata Swach
Tata Salt first pack
CORPORATE OVERVIEW FINANCIAL STATEMENTSSTATUTORY REPORTS
2003-04Tata Salt ranked No. 1 Food brand in Brand Equity Survey of India’s most trusted brands
Merger of Hind Lever Chemicals Limited (HLCL) with Tata Chemicals
Innovation Centre in Pune set up
1994Fertiliser plant at Babrala commissioned in 36 months, a world record
2005-08Acquires stake in Indo Maroc Phosphore SA (IMACID) – the first step towards internationalisation
Acquires UK-based Brunner Mond Group (now known as Tata Chemicals Europe), including Magadi Soda Company (now known as Tata Chemicals Magadi), Kenya
Acquires US-based General Chemical Industrial Products (now known as Tata Chemicals North America)
2010-11i-Shakti dals (pulses) launched
Tata Salt Plus and Flavoritz launched
Metahelix becomes a part of the Tata Chemicals family
Acquires 100% stake in British Salt, UK
5
2009Tata Swach Nanotech water purifier launched
Rallis India Limited becomes a subsidiary
2014Tata Chemicals completes 75 glorious years
Construction of cement plant
Iodised salt pack advertisement
i-Shakti dal
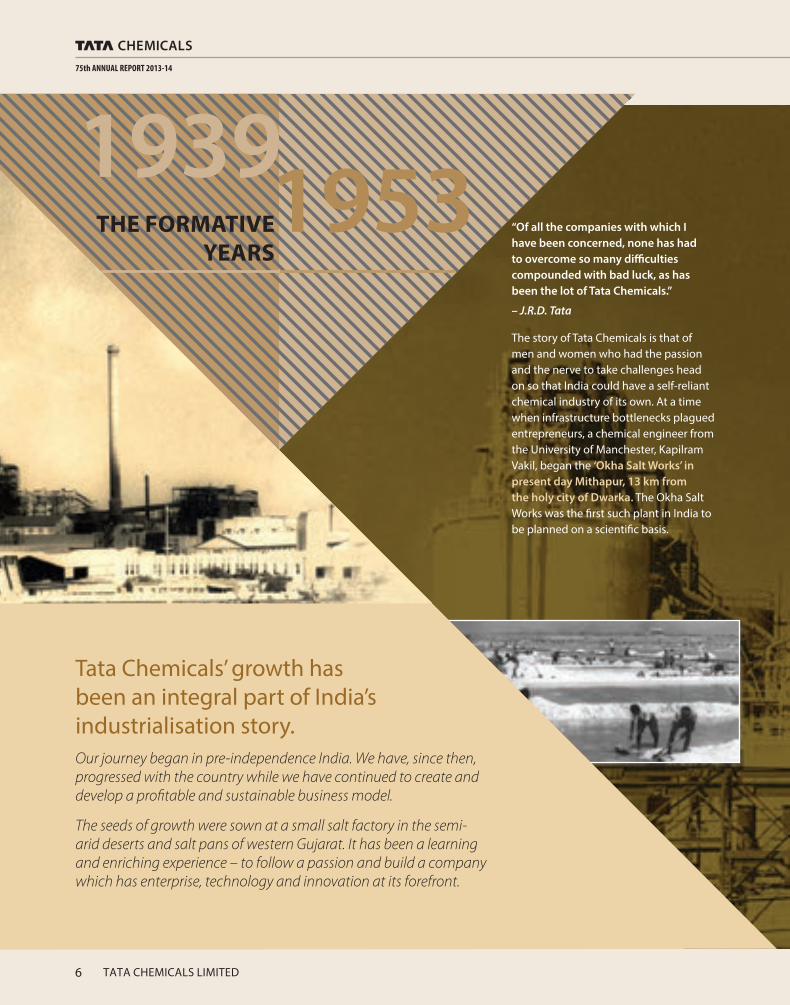
“Of all the companies with which I have been concerned, none has had to overcome so many difficulties compounded with bad luck, as has been the lot of Tata Chemicals.”
– J.R.D. Tata
The story of Tata Chemicals is that of men and women who had the passion and the nerve to take challenges head on so that India could have a self-reliant chemical industry of its own. At a time when infrastructure bottlenecks plagued entrepreneurs, a chemical engineer from the University of Manchester, Kapilram Vakil, began the ‘Okha Salt Works’ in present day Mithapur, 13 km from the holy city of Dwarka. The Okha Salt Works was the first such plant in India to be planned on a scientific basis.
Tata Chemicals’ growth has been an integral part of India’s history.
THE FORMATIVEYEARS
19531939
Our journey began in pre-independence India. We have, since then, progressed with the country while we have continued to create and develop a profitable and sustainable business model.
The seeds of growth were sown at a small salt factory in the semi-arid deserts and salt pans of western Gujarat. It has been a learning and enriching experience – to follow a passion and build a company which has enterprise, technology and innovation at its forefront.
Tata Chemicals’ growth has been an integral part of India’s industrialisation story.
75th ANNUAL REPORT 2013-14
6 TATA CHEMICALS LIMITED
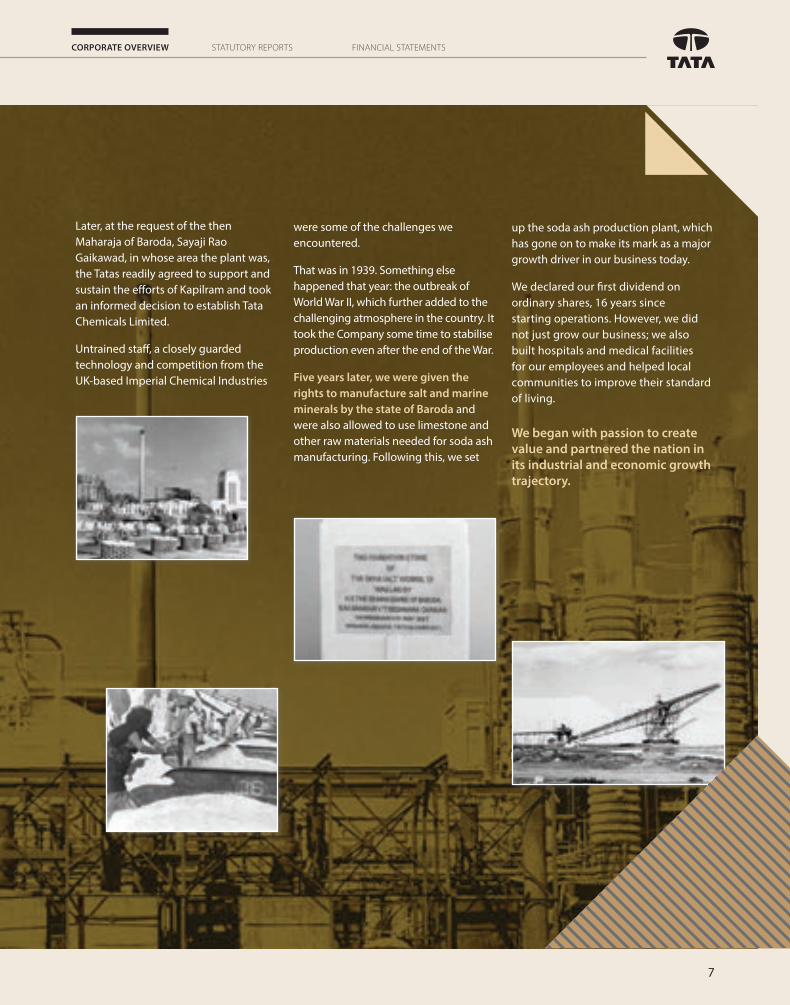
Later, at the request of the then Maharaja of Baroda, Sayaji Rao Gaikawad, in whose area the plant was, the Tatas readily agreed to support and sustain the efforts of Kapilram and took an informed decision to establish Tata Chemicals Limited.
Untrained staff, a closely guarded technology and competition from the UK-based Imperial Chemical Industries
were some of the challenges we encountered.
That was in 1939. Something else happened that year: the outbreak of World War II, which further added to the challenging atmosphere in the country. It took the Company some time to stabilise production even after the end of the War.
Five years later, we were given the rights to manufacture salt and marine minerals by the state of Baroda and were also allowed to use limestone and other raw materials needed for soda ash manufacturing. Following this, we set
up the soda ash production plant, which has gone on to make its mark as a major growth driver in our business today.
We declared our first dividend on ordinary shares, 16 years since starting operations. However, we did not just grow our business; we also built hospitals and medical facilities for our employees and helped local communities to improve their standard of living.
We began with passion to create value and partnered the nation in its industrial and economic growth trajectory.
Rotary Drum - Soda Ash
CORPORATE OVERVIEW FINANCIAL STATEMENTSSTATUTORY REPORTS
7
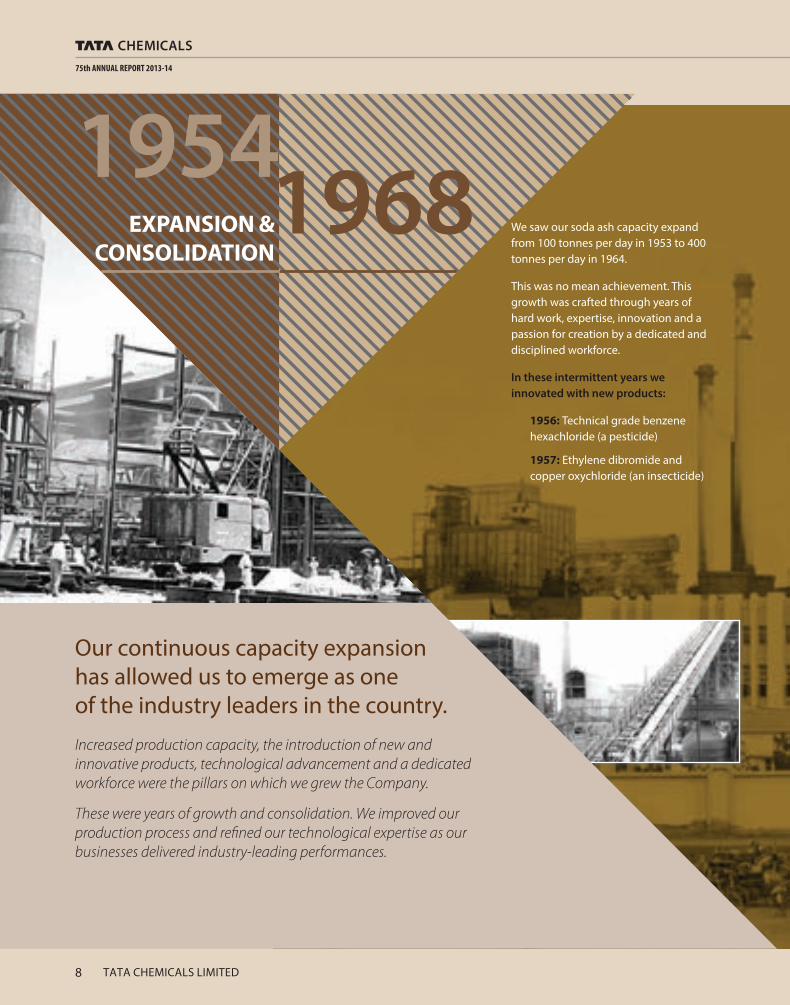
We saw our soda ash capacity expand from 100 tonnes per day in 1953 to 400 tonnes per day in 1964.
This was no mean achievement. This growth was crafted through years of hard work, expertise, innovation and a passion for creation by a dedicated and disciplined workforce.
In these intermittent years we innovated with new products:
1956: Technical grade benzene hexachloride (a pesticide)
1957: Ethylene dibromide and copper oxychloride (an insecticide)
19541968
Increased production capacity, the introduction of new and innovative products, technological advancement and a dedicated workforce were the pillars on which we grew the Company.
These were years of growth and consolidation. We improved our production process and refined our technological expertise as our businesses delivered industry-leading performances.
Our continuous capacity expansion has allowed us to emerge as one of the industry leaders in the country.
EXPANSION & CONSOLIDATION
75th ANNUAL REPORT 2013-14
8 TATA CHEMICALS LIMITED
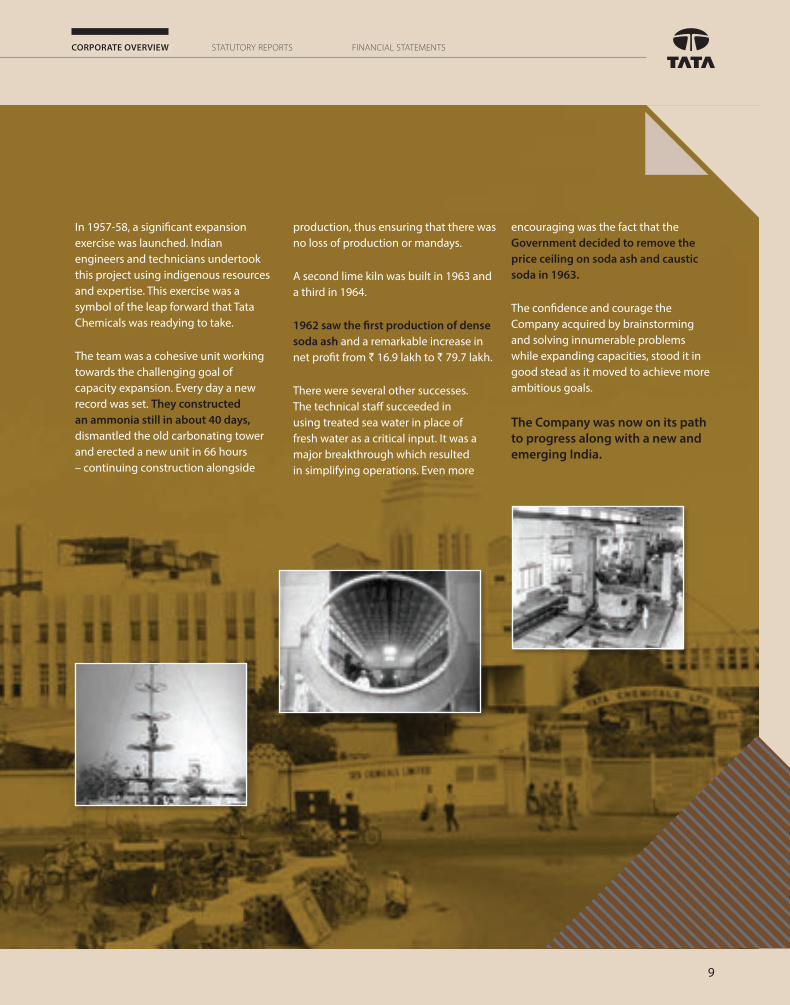
In 1957-58, a significant expansion exercise was launched. Indian engineers and technicians undertook this project using indigenous resources and expertise. This exercise was a symbol of the leap forward that Tata Chemicals was readying to take.
The team was a cohesive unit working towards the challenging goal of capacity expansion. Every day a new record was set. They constructed an ammonia still in about 40 days, dismantled the old carbonating tower and erected a new unit in 66 hours – continuing construction alongside
production, thus ensuring that there was no loss of production or mandays.
A second lime kiln was built in 1963 and a third in 1964.
1962 saw the first production of dense soda ash and a remarkable increase in net profit from ` 16.9 lakh to ` 79.7 lakh.
There were several other successes. The technical staff succeeded in using treated sea water in place of fresh water as a critical input. It was a major breakthrough which resulted in simplifying operations. Even more
encouraging was the fact that the Government decided to remove the price ceiling on soda ash and caustic soda in 1963.
The confidence and courage the Company acquired by brainstorming and solving innumerable problems while expanding capacities, stood it in good stead as it moved to achieve more ambitious goals.
The Company was now on its path to progress along with a new and emerging India.
CORPORATE OVERVIEW FINANCIAL STATEMENTSSTATUTORY REPORTS
9
19691983
Caption will go here
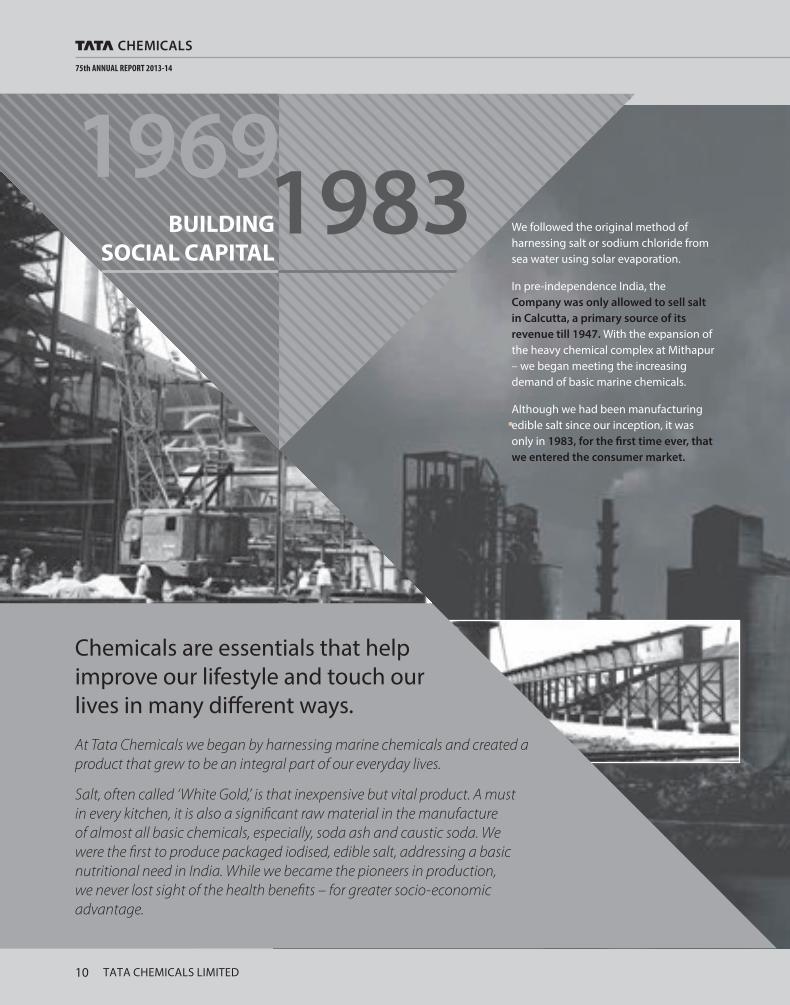
We followed the original method of harnessing salt or sodium chloride from sea water using solar evaporation.
In pre-independence India, the Company was only allowed to sell salt in Calcutta, a primary source of its revenue till 1947. With the expansion of the heavy chemical complex at Mithapur – we began meeting the increasing demand of basic marine chemicals.
Although we had been manufacturing edible salt since our inception, it was only in 1983, for the first time ever, that we entered the consumer market.
Tata Chemicals’ growth has been an integral part of India’s history.
At Tata Chemicals we began by harnessing marine chemicals and created a product that grew to be an integral part of our everyday lives.
Salt, often called ‘White Gold,’ is that inexpensive but vital product. A must in every kitchen, it is also a significant raw material in the manufacture of almost all basic chemicals, especially, soda ash and caustic soda. But we were the first to produce packaged iodised salt, a basic nutritional need. While we became the pioneers in production, we never lost sight of the health benefits – for greater socio-economic benefit.
Chemicals are essentials that help improve our lifestyle and touch our lives in many different ways.
At Tata Chemicals we began by harnessing marine chemicals and created a product that grew to be an integral part of our everyday lives.
Salt, often called ‘White Gold,’ is that inexpensive but vital product. A must in every kitchen, it is also a significant raw material in the manufacture of almost all basic chemicals, especially, soda ash and caustic soda. We were the first to produce packaged iodised, edible salt, addressing a basic nutritional need in India. While we became the pioneers in production, we never lost sight of the health benefits – for greater socio-economic advantage.
Chemicals are essentials that help improve our lifestyle and touch our lives in many different ways.
BUILDING SOCIAL CAPITAL
75th ANNUAL REPORT 2013-14
10 TATA CHEMICALS LIMITED
We pioneered iodised, packaged, vacuum-evaporated edible salt in India and marketed it under the brand name ‘Tata Salt’. This is a landmark in the history of the Company.
A major percentage of vacuum and pure salt produced is also used as raw material in the manufacture of various chemicals, pharmaceuticals, textiles, papers and detergents.
Within India, we currently own and operate the largest salt works, spread across approximately 150 sq. km in Gujarat comprising Aramda, Padli,
Samlasar, Mithapur, Charakla and Okhamandi salt works.
Our salt gained in popularity due to its quality; its brightness and colour, the correct saltiness, uniform crystals, pleasant flavour, absence of foreign matter like mud or clay, even before formal launched of the Tata Salt brand.
While we focused on this essential product, we never stopped our pursuit of progress, expansion and care for the community. We set up the Tata Energy Research Institute (TERI) to address the country’s need for research and
development in energy. Additionally, the Tata Chemicals Society for Rural Development (TCSRD) was set up in 1980 to improve the quality of life of rural communities in Okhamandal villages.
With the building blocks firmly in place, we geared ourselves to take the next step in our journey – to partner the development of the Indian agriculture sector.
CORPORATE OVERVIEW FINANCIAL STATEMENTSSTATUTORY REPORTS
11
Our foray into Farm Essentials has helped us carve a niche as a crop nutrient provider. Products like fertilisers, pesticides, specialty nutrients, seeds and agri-services help farmers enhance their farm productivity leading to better lifestyles.
Our journey into the agriculture sector was through Tata-Fison Private Limited in 1957, a joint venture company of Tata Chemicals and Fisons Pest Control Limited of Cambridge, England.
Today, an established position in the fertilisers business and a focus on health essentials ensures that we remain relevant in contributing to India’s nutritional needs – from the farm to the table.
The high quality of chemicals and ingredients made at Tata Chemicals goes a long way in improving the lives of its consumers and that of all its stakeholders.
A strategic shift from chemicals into farm essentials was the first step Tata Chemicals took in order to diversify its business interests.
19841998EXPANDING VERTICALS
75th ANNUAL REPORT 2013-14
12 TATA CHEMICALS LIMITED
Tata-Fison provided the farmers and public health authorities with the widest, most effective range of insecticides and fungicides and was a leading producer of pesticide in the 1960s, in India.
In 1973, Tata-Fison merged with Rallis, thereby becoming a part of Rallis India.
While we were looking for ways to help the farmer, Mithapur grew and through the mid-80s and the 90s we systematically increased our strength by:
1992: Launching Tata Shudh detergent
1993: Commissioning a new 1,000 TPD cement plant, in an effort to convert waste into wealth
In 1994, we expanded our business verticals by setting up a fertiliser plant in Babrala, Uttar Pradesh. Commissioned on a greenfield site, the plant, capable of producing ammonia and urea, was set up in 36 months, a world record.
It was the country’s first dual-feed plant, with an ability to run on naphtha and
gas. It is currently among India’s most energy efficient urea plants.
In 1996, an important innovation, Effluent Solids Filtration (ESF), was implemented at Mithapur. A unique process across global soda ash plants, ESF helps filter solids from the soda ash effluent, which can then be reused as a raw material to produce cement.
Success was sweet! With our dream of setting up a world-class fertiliser plant realised, we set our sights on identifying opportunities beyond borders.
CORPORATE OVERVIEW FINANCIAL STATEMENTSSTATUTORY REPORTS
13
We have partnered the nation in its growth, helped in its effort at industrialisation and stood by it in times of disaster and destruction.
It is time now to change and adapt, to expand our horizons and cater to the brand-conscious customer with a global outlook.
Tata Chemicals was now ready to partner the next level of growth – catering to the changing needs of an evolving nation.
19992013 We started preparing ourselves to be global. In this journey we equipped ourselves with ISO 9001:2000, ISO 14001 and OHSAS 18001 certifications. The Mithapur township became one of the first townships to be awarded an ISO 14001 certification. We adopted world class processes including registration with the British Safety Council and becoming a signatory to the UN Global Compact. We were recognised for our commitment to quality and processes and in 2003, Tata Salt ranked as the No. 1 food brand in Brand Equity Survey of India’s Most Trusted Brands.
Aligned with our focus on consistent innovation, we set up the Innovation Centre in Pune to develop world-class R&D capability in the emerging areas of nanotechnology and biotechnology. Years of hard work and innovations paid off. Our product portfolio expanded, catering to the changing needs of 21st century India.
GROWTH & GLOBALISATION
75th ANNUAL REPORT 2013-14
14 TATA CHEMICALS LIMITED
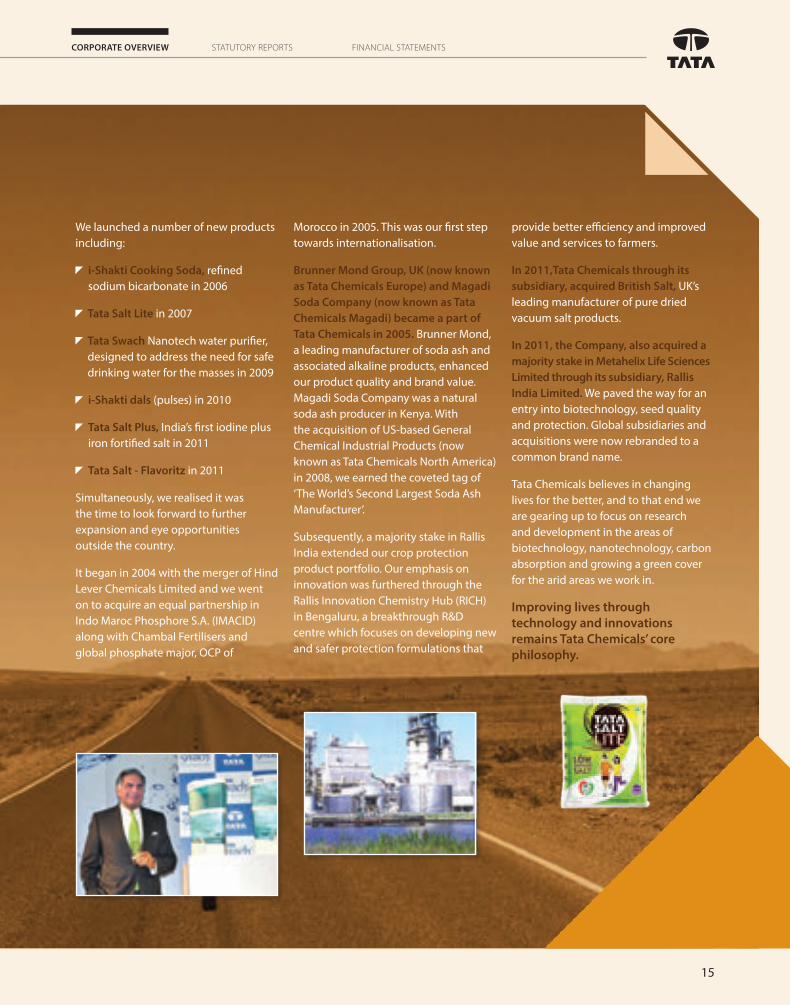
We launched a number of new products including:
i-Shakti Cooking Soda, refined sodium bicarbonate in 2006
Tata Salt Lite in 2007
Tata Swach Nanotech water purifier, designed to address the need for safe drinking water for the masses in 2009
i-Shakti dals (pulses) in 2010
Tata Salt Plus, India’s first iodine plus iron fortified salt in 2011
Tata Salt - Flavoritz in 2011
Simultaneously, we realised it was the time to look forward to further expansion and eye opportunities outside the country.
It began in 2004 with the merger of Hind Lever Chemicals Limited and we went on to acquire an equal partnership in Indo Maroc Phosphore S.A. (IMACID) along with Chambal Fertilisers and global phosphate major, OCP of
Morocco in 2005. This was our first step towards internationalisation.
Brunner Mond Group, UK (now known as Tata Chemicals Europe) and Magadi Soda Company (now known as Tata Chemicals Magadi) became a part of Tata Chemicals in 2005. Brunner Mond, a leading manufacturer of soda ash and associated alkaline products, enhanced our product quality and brand value. Magadi Soda Company was a natural soda ash producer in Kenya. With the acquisition of US-based General Chemical Industrial Products (now known as Tata Chemicals North America) in 2008, we earned the coveted tag of ‘The World’s Second Largest Soda Ash Manufacturer’.
Subsequently, a majority stake in Rallis India extended our crop protection product portfolio. Our emphasis on innovation was furthered through the Rallis Innovation Chemistry Hub (RICH) in Bengaluru, a breakthrough R&D centre which focuses on developing new and safer protection formulations that
provide better efficiency and improved value and services to farmers.
In 2011,Tata Chemicals through its subsidiary, acquired British Salt, UK’s leading manufacturer of pure dried vacuum salt products.
In 2011, the Company, also acquired a majority stake in Metahelix Life Sciences Limited through its subsidiary, Rallis India Limited. We paved the way for an entry into biotechnology, seed quality and protection. Global subsidiaries and acquisitions were now rebranded to a common brand name.
Tata Chemicals believes in changing lives for the better, and to that end we are gearing up to focus on research and development in the areas of biotechnology, nanotechnology, carbon absorption and growing a green cover for the arid areas we work in.
Improving lives through technology and innovations remains Tata Chemicals’ core philosophy.
CORPORATE OVERVIEW FINANCIAL STATEMENTSSTATUTORY REPORTS
15
75th ANNUAL REPORT 2013-14
TATA CHEMICALS LIMITED16
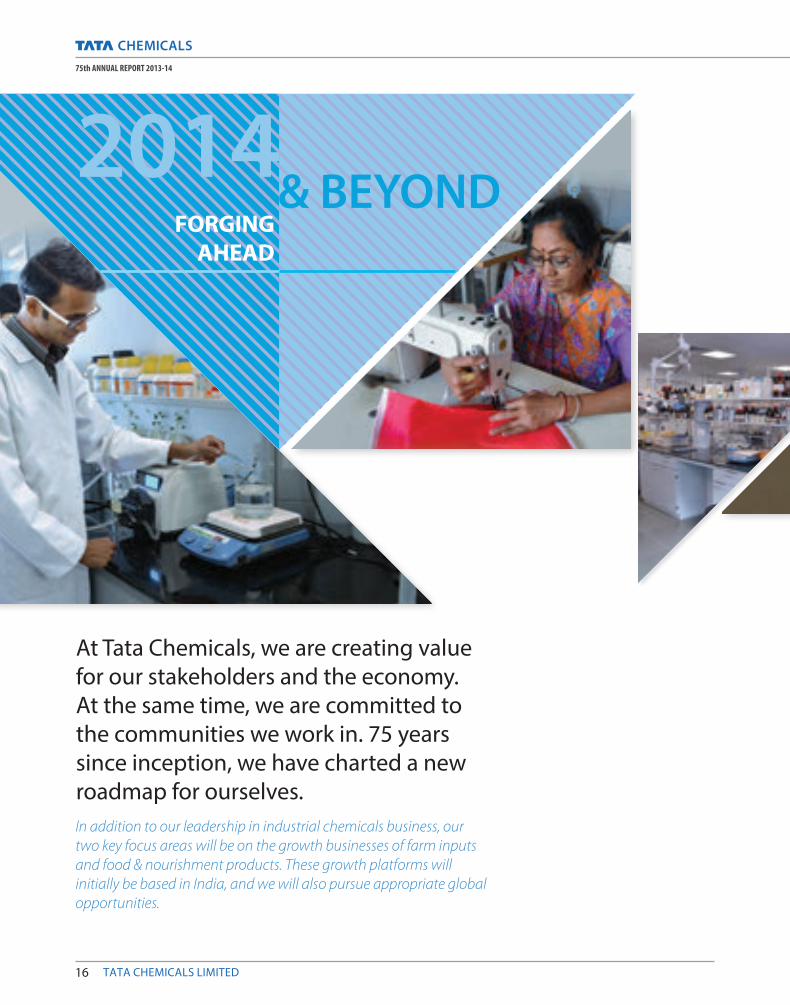
At Tata Chemicals, we are creating value for our stakeholders and the economy. At the same time, we are committed to the communities we work in. 75 years since inception, we have charted a new roadmap for ourselves.In addition to our leadership in industrial chemicals business, our two key focus areas will be on the growth businesses of farm inputs and food & nourishment products. These growth platforms will initially be based in India, and we will also pursue appropriate global opportunities.
2014& BEYOND
FORGING AHEAD
CORPORATE OVERVIEW FINANCIAL STATEMENTSSTATUTORY REPORTS
17
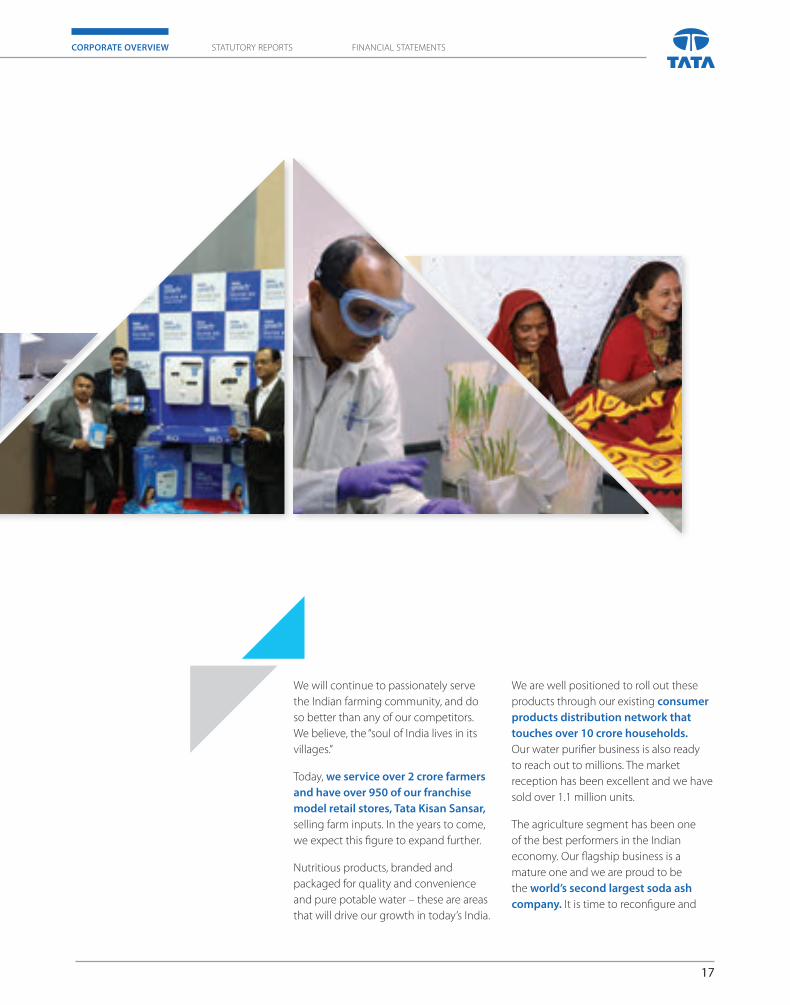
We will continue to passionately serve the Indian farming community, and do so better than any of our competitors. We believe, the “soul of India lives in its villages.”
Today, we service over 2 crore farmers and have over 950 of our franchise model retail stores, Tata Kisan Sansar, selling farm inputs. In the years to come, we expect this figure to expand further.
Nutritious products, branded and packaged for quality and convenience and pure potable water – these are areas that will drive our growth in today’s India.
We are well positioned to roll out these products through our existing consumer products distribution network that touches over 10 crore households. Our water purifier business is also ready to reach out to millions. The market reception has been excellent and we have sold over 1.1 million units.
The agriculture segment has been one of the best performers in the Indian economy. Our flagship business is a mature one and we are proud to be the world’s second largest soda ash company. It is time to reconfigure and
75th ANNUAL REPORT 2013-14
TATA CHEMICALS LIMITED18
chart out a new course for ourselves – one that will touch lives and be integrated with national and international aspirations.
The Company continues to benefit from the shift of the Indian farmer towards higher technology and higher productivity, which implies greater use of high-quality seeds, crop nutrition and crop protection chemicals.
We will now be less of a chemical company and more a holistic provider of products and services based on science.
Our commitment to innovation remains unwavering. We inaugurated a state-of-the-art Innovation Centre in 2014 to incubate and support our growth vectors in wellness foods, agri and chemistry solutions. We also forayed into the fast-growing nutritional solutions with the launch of a prebiotic range of dietary fibres which were developed at
our Innovation Centre. These will allow us to address the growing dietary needs of nutrition-deficient and lifestyle-afflicted consumers by providing innovative, high quality, natural solutions to food manufacturers across the globe.
People remain the cornerstone of all our activities and help us achieve our goals. Our strategy therefore, remains on creating a committed, competent and cohesive team nurtured in a culture of excellence.
FORGING AHEAD
1
2
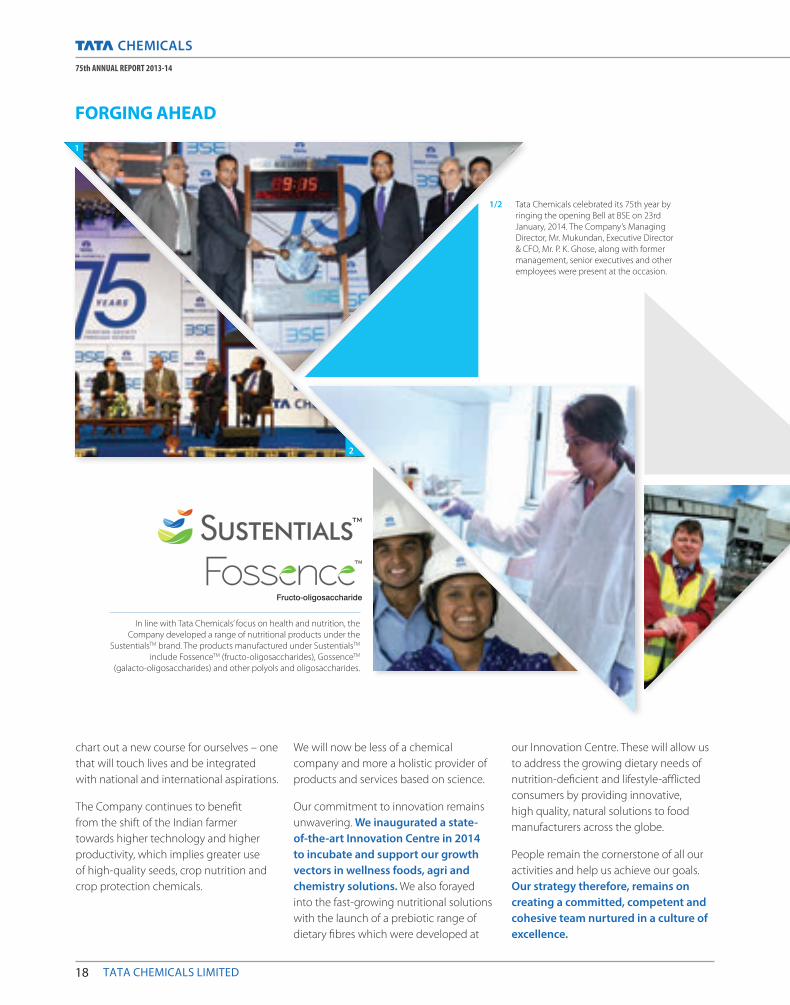
1/2 Tata Chemicals celebrated its 75th year by ringing the opening Bell at BSE on 23rd January, 2014. The Company’s Managing Director, Mr. Mukundan, Executive Director & CFO, Mr. P. K. Ghose, along with former management, senior executives and other employees were present at the occasion.
In line with Tata Chemicals’ focus on health and nutrition, the Company developed a range of nutritional products under the
SustentialsTM brand. The products manufactured under SustentialsTM include FossenceTM (fructo-oligosaccharides), GossenceTM
(galacto-oligosaccharides) and other polyols and oligosaccharides.

CORPORATE OVERVIEW FINANCIAL STATEMENTSSTATUTORY REPORTS
19
It has been a long journey, made more enriching by the people who contributed to our growth andleadership status.
We value their contributions and commit ourselves to the next phase of our journey in ‘Serving Society Through Science’.
Our human resource policies adopt industry-best practices in order to attract, develop and retain high-calibre talent. In order to keep our employees engaged and valued, various customised programmes and initiatives are being implemented. These include employee-friendly administrative policies, meritocracy in performance management and rewards, ample learning opportunities, fun at work, inclusion and transparent communication that sustain a sense of ownership and belonging.
Our associations with communities surrounding our operations are deeply-rooted. We continue to nurture and support them through various initiatives under our CSR programmes guided by our sustainability and CSR policies.
The Tata Group ethos will always be our guiding light and at the core of everything we do.
3
4
3/4 Tata Chemicals inaugurated its new Innovation Centre near Pune in 2014. The state-of-the-art Centre will be the Company’s technology and innovation hub.
We commit ourselves to the next phase of our journey
in ‘Serving Society Through Science’.
75th ANNUAL REPORT 2013-14
TATA CHEMICALS LIMITED20
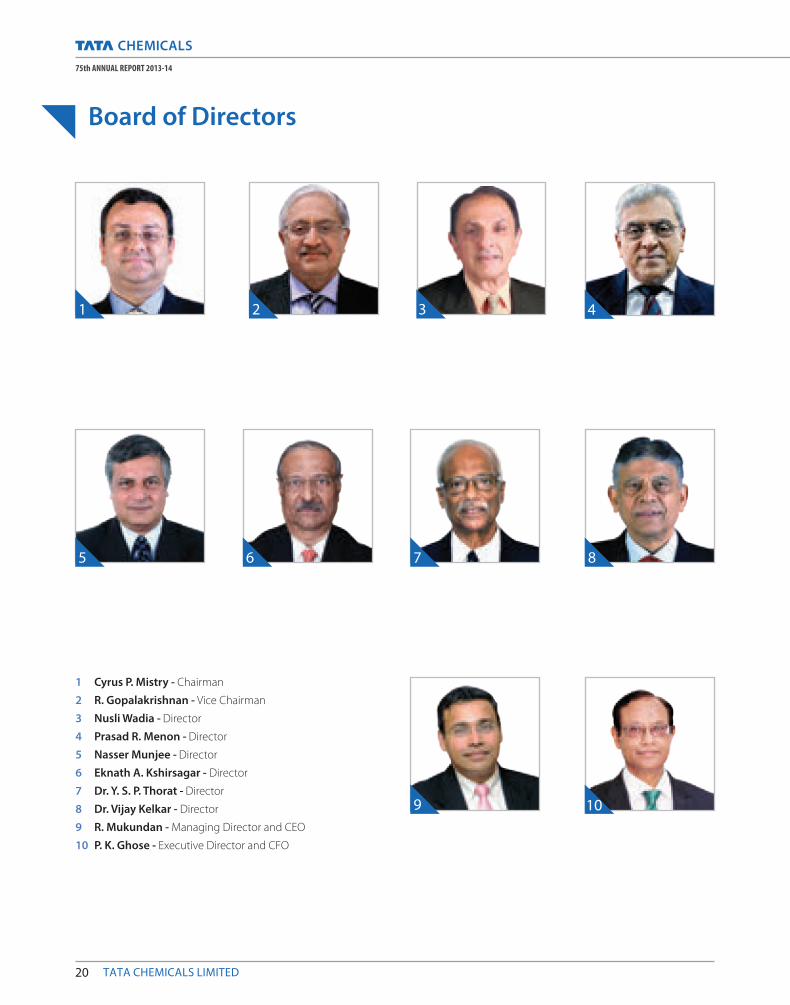
Board of Directors
1 Cyrus P. Mistry - Chairman
2 R. Gopalakrishnan - Vice Chairman
3 Nusli Wadia - Director
4 Prasad R. Menon - Director
5 Nasser Munjee - Director
6 Eknath A. Kshirsagar - Director
7 Dr. Y. S. P. Thorat - Director
8 Dr. Vijay Kelkar - Director
9 R. Mukundan - Managing Director and CEO
10 P. K. Ghose - Executive Director and CFO
1 3 42
9 10
5 6 87
CORPORATE OVERVIEW FINANCIAL STATEMENTSSTATUTORY REPORTS
21
Senior Management
Dr. Arup Basu - President, New Businesses and Innovation Centre
Zarir Langrana - Chief Operating Officer, Chemicals (India)
Vinay K. Bhatia - Chief Operating Officer (Fertilisers)
Richa Arora - Chief Operating Officer, Consumer Products Business
INDIA OPERATIONS
R. Mukundan - Managing Director and CEO
P. K. Ghose - Executive Director and CFO
R. Nanda - Vice President and CHRO
Rajiv Chandan - General Counsel and Company Secretary
CORPORATE
General Counsel and Company SecretaryRajiv Chandan
AuditorsDeloitte Haskins & Sells LLP Chartered Accountants
Solicitors AZB & Partners Mulla & Mulla and Craigie, Blunt & Caroe
Amarchand & Mangaldas & Suresh A. Shroff & Co.
Registrar & Transfer AgentsTSR Darashaw Private Limited 6-10 Haji Moosa Patrawala Industrial Estate, 20, Dr. E. Moses Road, Mahalaxmi, Mumbai 400 011
DeLyle Bloomquist – President, Global Chemicals Business
Martin Keighley – Managing Director, Tata Chemicals North America
Dr. Martin Ashcroft – Managing Director, Tata Chemicals Europe
Jackson Mbui – Managing Director, Tata Chemicals Magadi
INTERNATIONALOPERATIONS
75th ANNUAL REPORT 2013-14
TATA CHEMICALS LIMITED22
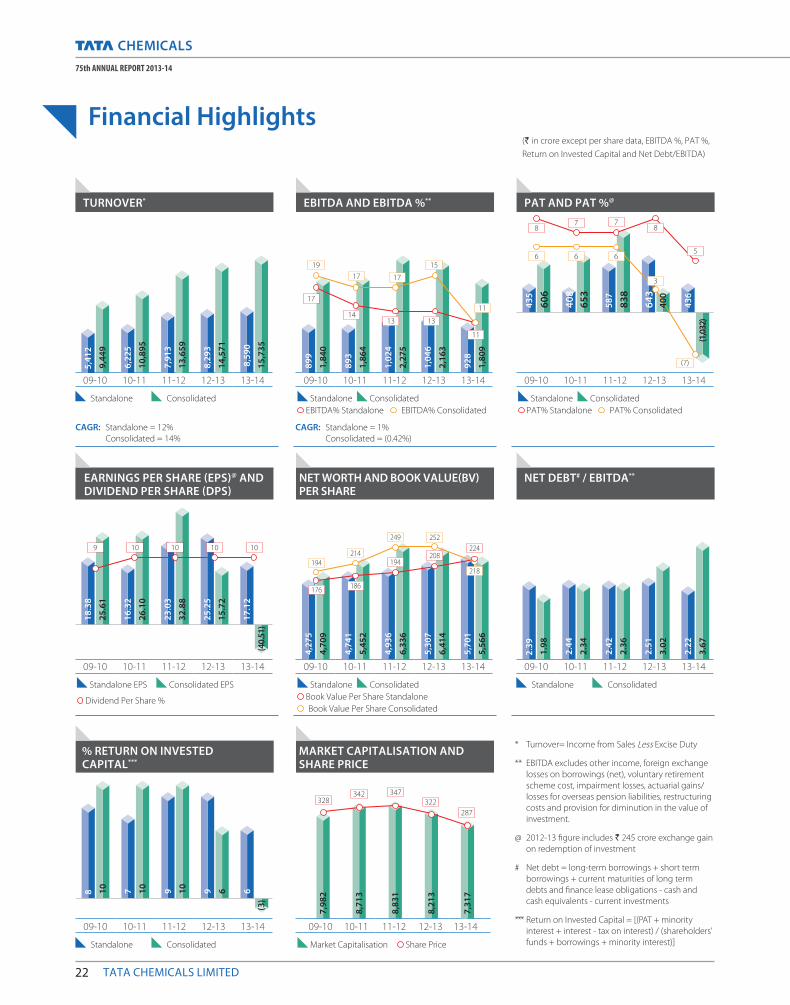
Financial Highlights
Standalone Consolidated
NET DEBT# / EBITDA**
1.98
2.34
2.51
2.22
09-10 10-11 11-12 12-13 13-14
2.39
2.44
2.42
2.36
3.02
3.67
EARNINGS PER SHARE (EPS)@ AND DIVIDEND PER SHARE (DPS)
15.7
2
(40.
51)
32.8
8
Standalone EPS Consolidated EPS
Dividend Per Share %
09-10 10-11 11-12 12-13 13-14
18.3
8
25.6
1
16.3
2
26.1
0
23.0
3
25.2
5
17.1
2
9 10 10 1010
6,41
4
5,56
6
6,33
6
Standalone Consolidated Book Value Per Share Standalone Book Value Per Share Consolidated
NET WORTH AND BOOK VALUE(BV) PER SHARE
09-10 10-11 11-12 12-13 13-14
194
249 252
194208
4,27
5
4,70
9
4,74
1
5,45
2
4,93
6
5,30
7
5,70
1
214
186
224
Standalone Consolidated
% RETURN ON INVESTED CAPITAL***
09-10 10-11 11-12 12-13 13-14
10 10 9 68 7 9 10 6
(3)
8,21
3
8,83
1
7,98
2
8,71
3
328342
322347
Market Capitalisation Share Price
MARKET CAPITALISATION AND SHARE PRICE
09-10 10-11 11-12 12-13 13-14
7,31
7
287
* Turnover= Income from Sales Less Excise Duty
** EBITDA excludes other income, foreign exchange losses on borrowings (net), voluntary retirement scheme cost, impairment losses, actuarial gains/losses for overseas pension liabilities, restructuring costs and provision for diminution in the value of investment.
@ 2012-13 figure includes ` 245 crore exchange gain on redemption of investment
# Net debt = long-term borrowings + short term borrowings + current maturities of long term debts and finance lease obligations - cash and cash equivalents - current investments
*** Return on Invested Capital = [(PAT + minority interest + interest - tax on interest) / (shareholders’ funds + borrowings + minority interest)]
(` in crore except per share data, EBITDA %, PAT %, Return on Invested Capital and Net Debt/EBITDA)
Standalone Consolidated
TURNOVER*
9,44
9
10,8
95
8,29
3
8,5
90
09-10 10-11 11-12 12-13 13-14
5,41
2
6,22
5
7,91
3
13,6
59
14,5
71
15,7
35
CAGR: Standalone = 12% Consolidated = 14%
2,16
3
1,80
9
2,27
5 Standalone Consolidated
EBITDA% Standalone EBITDA% Consolidated
EBITDA AND EBITDA %**
09-10 10-11 11-12 12-13 13-14
899
1,84
0
893
1,86
4
1,02
4
1,04
6
928
19
17
15
1117
1413 13
11
17
CAGR: Standalone = 1% Consolidated = (0.42%)
176
218
(1,0
32)
838
Standalone Consolidated PAT% Standalone PAT% Consolidated
PAT AND PAT %@
09-10 10-11 11-12 12-13 13-14
435
606
408
653
587
643
436
6
(7)
6 6
3
87 7
8
5
400
CORPORATE OVERVIEW FINANCIAL STATEMENTSSTATUTORY REPORTS
23
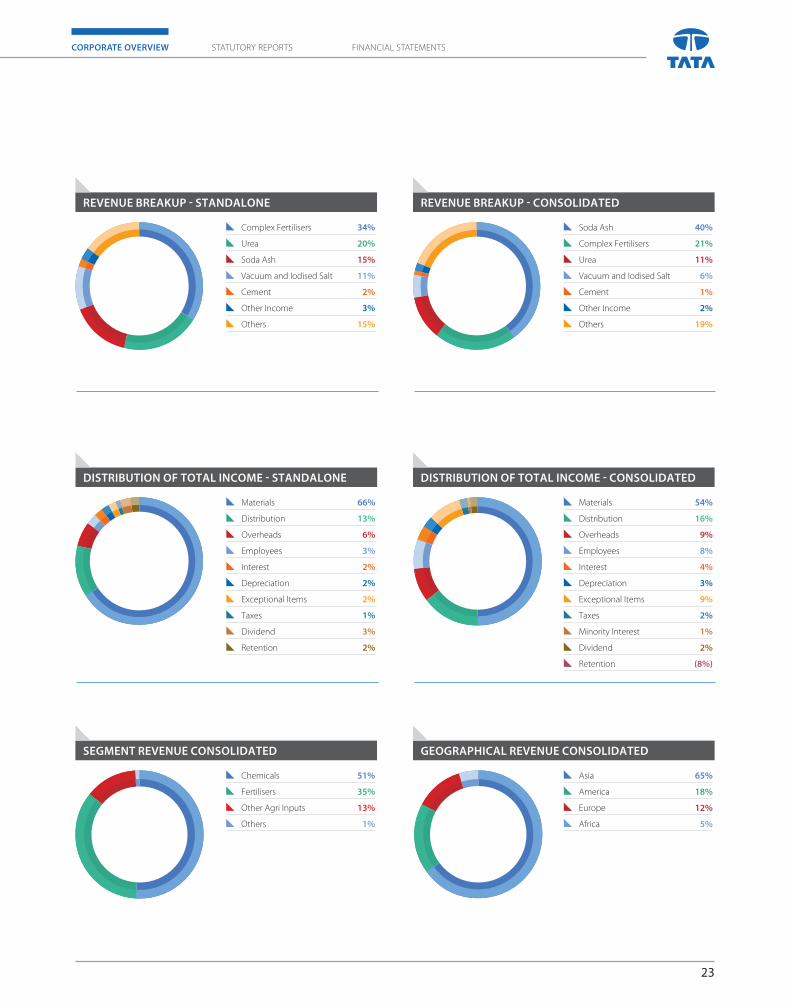
GEOGRAPHICAL REVENUE CONSOLIDATED
Asia 65%
America 18%
Europe 12%
Africa 5%
SEGMENT REVENUE CONSOLIDATED
Chemicals 51%
Fertilisers 35%
Other Agri Inputs 13%
Others 1%
DISTRIBUTION OF TOTAL INCOME - STANDALONE
Materials 66%
Distribution 13%
Overheads 6%
Employees 3%
Interest 2%
Depreciation 2%
Exceptional Items 2%
Taxes 1%
Dividend 3%
Retention 2%
Materials 54%
Distribution 16%
Overheads 9%
Employees 8%
Interest 4%
Depreciation 3%
Exceptional Items 9%
Taxes 2%
Minority Interest 1%
Dividend 2%
Retention (8%)
DISTRIBUTION OF TOTAL INCOME - CONSOLIDATED
REVENUE BREAKUP - STANDALONE
Complex Fertilisers 34%
Urea 20%
Soda Ash 15%
Vacuum and Iodised Salt 11%
Cement 2%
Other Income 3%
Others 15%
REVENUE BREAKUP - CONSOLIDATED
Soda Ash 40%
Complex Fertilisers 21%
Urea 11%
Vacuum and Iodised Salt 6%
Cement 1%
Other Income 2%
Others 19%
75th ANNUAL REPORT 2013-14
TATA CHEMICALS LIMITED24
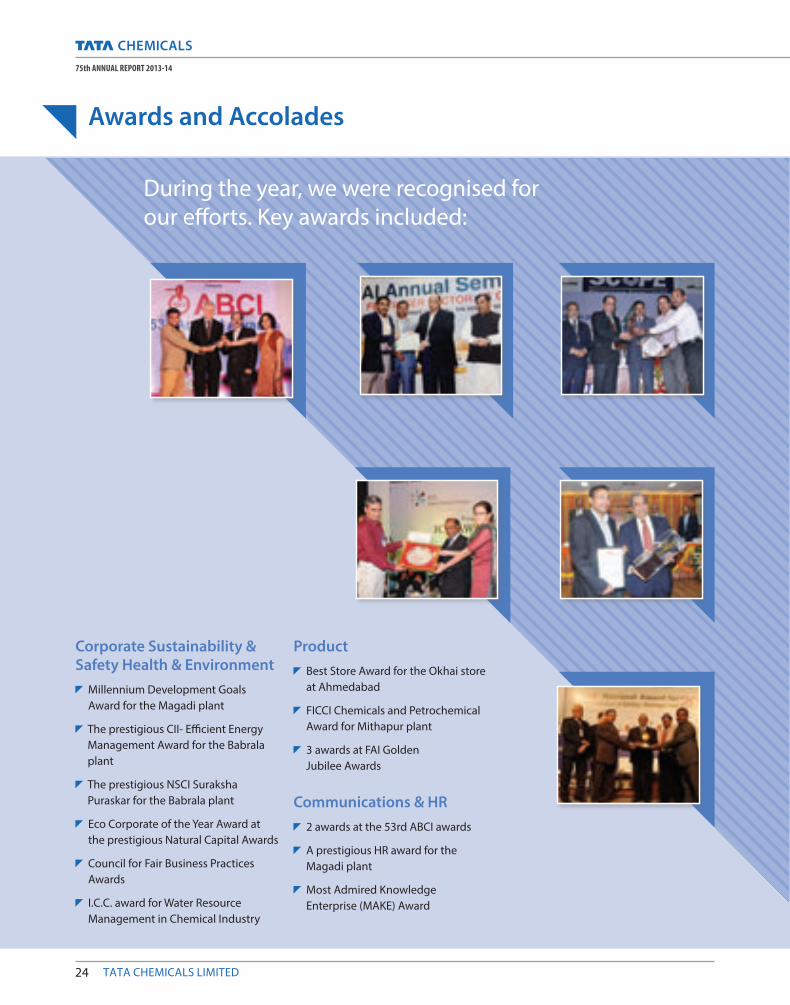
Awards and Accolades
Tata Swach, water purifier
During the year, we were recognised for our efforts. Key awards included:
Corporate Sustainability & Safety Health & Environment
Millennium Development Goals Award for the Magadi plant
The prestigious CII- Efficient Energy Management Award for the Babrala plant
The prestigious NSCI Suraksha Puraskar for the Babrala plant
Eco Corporate of the Year Award at the prestigious Natural Capital Awards
Council for Fair Business Practices Awards
I.C.C. award for Water Resource Management in Chemical Industry
Product Best Store Award for the Okhai store at Ahmedabad
FICCI Chemicals and Petrochemical Award for Mithapur plant
3 awards at FAI Golden Jubilee Awards
Communications & HR 2 awards at the 53rd ABCI awards
A prestigious HR award for the Magadi plant
Most Admired Knowledge Enterprise (MAKE) Award
25
CORPORATE OVERVIEW FINANCIAL STATEMENTSSTATUTORY REPORTS
NOTICE IS HEREBY GIVEN THAT THE SEVENTY FIFTH ANNUAL
GENERAL MEETING OF TATA CHEMICALS LIMITED will be held
on Thursday, 21st August, 2014 at 3.00 p.m. at Birla Matushri
Sabhagar, 19, Sir Vithaldas Thackersey Marg, Mumbai 400 020, to
transact the following businesses:-
1. To receive, consider and adopt the Audited Statement of
Profi t and Loss for the year ended 31st March, 2014 and
Balance Sheet as at that date together with the Reports of
the Board of Directors and Auditors thereon.
2. To declare dividend on Ordinary Shares.
3. To appoint a Director in place of Mr. R. Gopalakrishnan
(holding DIN 00027858), who retires by rotation and being
eligible, off ers himself for re-appointment and his term
would be up to 25th December, 2015.
4. Appointment of statutory auditors of the Company and fi x
their remuneration.
To consider and if thought fi t, to pass with or without
modifi cation(s), the following resolution as an Ordinary
Resolution:
“RESOLVED THAT pursuant to the provisions of Section 139
and other applicable provisions, if any, of the Companies
Act, 2013 and the Rules framed thereunder, Deloitte
Haskins & Sells LLP, Chartered Accountants (Registration
No. 117366W/W – 100018), be and is hereby appointed
as Auditors of the Company to hold offi ce from the
conclusion of this Annual General Meeting (AGM) till the
conclusion of the Seventy Eighth (78th) AGM to be held in
2017 (subject to ratifi cation of their appointment at every
AGM), at such remuneration plus service tax, out of pocket
and travelling expenses, etc; as may be mutually agreed
between the Board of Directors of the Company and the
Auditors.”
5. Appointment of Mr. Nusli Wadia as an Independent
Director of the Company
To consider and if thought fi t, to pass with or without
modifi cation(s), the following resolution as an Ordinary
Resolution:
“RESOLVED THAT pursuant to the provisions of Sections
149, 152 and other applicable provisions, if any, of the
Companies Act, 2013 (“Act”) and the Rules framed
thereunder, read with Schedule IV to the Act, as
amended from time to time, Mr. Nusli Wadia (holding DIN
00015731), a Non-Executive Director of the Company,
who has submitted a declaration that he meets the
criteria for independence as provided in Section 149(6)
of the Act and who is eligible for appointment, be and
is hereby appointed as an Independent Director of the
Company with eff ect from 21st August, 2014 up to
15th February, 2019.”
6. Appointment of Mr. Nasser Munjee as an Independent
Director of the Company
To consider and if thought fi t, to pass with or without
modifi cation(s), the following resolution as an Ordinary
Resolution:
“RESOLVED THAT pursuant to the provisions of Sections
149, 152 and other applicable provisions, if any, of the
Companies Act, 2013 (“Act”) and the Rules framed
thereunder read with Schedule IV to the Act, as amended
from time to time, Mr. Nasser Munjee (holding DIN
00010180), a Non-Executive Director of the Company,
who has submitted a declaration that he meets the
criteria for independence as provided in Section 149(6)
of the Act and who is eligible for appointment, be and
is hereby appointed as an Independent Director of the
Company with eff ect from 21st August, 2014 up to
20th August, 2019.”
7. Appointment of Mr. Eknath Kshirsagar as an
Independent Director of the Company
To consider and if thought fi t, to pass with or without
modifi cation(s), the following resolution as an Ordinary
Resolution:
“RESOLVED THAT pursuant to the provisions of Sections
149, 152 and other applicable provisions, if any, of the
Companies Act, 2013 (“Act”) and the Rules framed
thereunder read with Schedule IV to the Act, as amended
from time to time, Mr. Eknath Kshirsagar (holding DIN
00121824), a Non-Executive Director of the Company,
who has submitted a declaration that he meets the
criteria for independence as provided in Section 149(6)
NOTICE
26 TATA CHEMICALS LIMITED
75th ANNUAL REPORT 2013-14
of the Act and who is eligible for appointment, be and
is hereby appointed as an Independent Director of the
Company with eff ect from 21st August, 2014 up to
10th September, 2016.”
8. Appointment of Dr. Y. S. P. Thorat as an Independent
Director of the Company
To consider and if thought fi t, to pass with or without
modifi cation(s), the following resolution as an Ordinary
Resolution:
“RESOLVED THAT pursuant to the provisions of Sections
149, 152 and other applicable provisions, if any, of the
Companies Act, 2013 (“Act”) and the Rules framed
thereunder read with Schedule IV to the Act, as amended
from time to time, Dr. Y. S. P. Thorat (holding DIN
02652734), a Non-Executive Director of the Company, who
has submitted a declaration that he meets the criteria for
independence as provided in Section 149(6) of the Act
and who is eligible for appointment, be and is hereby
appointed as an Independent Director of the Company,
with eff ect from 21st August, 2014 up to 20th August, 2019.”
9. Appointment of Dr. Vijay Kelkar as an Independent
Director of the Company
To consider and if thought fi t, to pass with or without
modifi cation(s), the following resolution as an Ordinary
Resolution:
“RESOLVED THAT pursuant to the provisions of Sections
149, 152 and other applicable provisions, if any, of the
Companies Act, 2013 (“Act”) and the Rules framed
thereunder read with Schedule IV to the Act, as amended
from time to time, Dr. Vijay Kelkar (holding DIN 00011991),
a Non-Executive Director of the Company, who has
submitted a declaration that he meets the criteria for
independence as provided in Section 149(6) of the Act
and who is eligible for appointment, be and is hereby
appointed as an Independent Director of the Company,
with eff ect from 21st August, 2014 up to 15th May, 2017.”
10. Re-appointment of Mr. R. Mukundan as Managing
Director of the Company
To consider and if thought fi t, to pass with or without
modifi cation(s), the following resolution as an Ordinary
Resolution:
“RESOLVED THAT pursuant to the provisions of Sections
196, 197 and other applicable provisions, if any, of the
Companies Act, 2013 (‘‘Act”) read with Schedule V to the
Act and the Companies (Appointment and Remuneration
of Managerial Personnel) Rules, 2014 (including any
statutory modifi cation(s) thereof for the time being
in force), the consent of the Company, be and is
hereby accorded to the re-appointment and terms of
remuneration of Mr. R. Mukundan (holding DIN 00778253)
as a Managing Director of the Company for a period
of 5 years, with eff ect from 26th November, 2013 upto
25th November, 2018, upon the terms and conditions
(including the remuneration to be paid in the event of loss
or inadequacy of profi ts in any fi nancial year during the
aforesaid period) as set out in the Explanatory Statement
annexed to this Notice with liberty to the Board of
Directors (hereinafter referred to as “the Board” which term
shall be deemed to include Nomination and Remuneration
Committee of the Board) to alter and vary the terms and
conditions of the said re-appointment /remuneration in
such manner as may be agreed to between the Board and
Mr. Mukundan.
RESOLVED FURTHER THAT the Board be and is hereby
authorised to take all such steps as may be necessary,
proper and expedient and to do any acts, deeds, matters
and things to give eff ect to this resolution.”
11. Re-appointment of Mr. P. K. Ghose as an Executive
Director & CFO of the Company
To consider and if thought fi t, to pass with or without
modifi cation(s), the following resolution as an Ordinary
Resolution:
“RESOLVED THAT pursuant to the provisions of Sections
196, 197, and other applicable provisions, if any, of the
Companies Act, 2013 (‘‘Act”) read with Schedule V to the
Act and the Companies (Appointment and Remuneration
of Managerial Personnel) Rules, 2014 (including any
statutory modifi cation(s) thereof for the time being in force),
the consent of the Company, be and is hereby accorded to
the re-appointment and terms of remuneration of Mr. P.
K. Ghose (holding DIN 00034945) as an Executive Director
& CFO of the Company with eff ect from 26th November,
NOTICE
27
CORPORATE OVERVIEW FINANCIAL STATEMENTSSTATUTORY REPORTS
2013 upto 30th September, 2015 (till he attains the
retirement age), upon the terms and conditions (including
the remuneration to be paid in the event of loss or
inadequacy of profi ts in any fi nancial year during the
aforesaid period) as set out in the Explanatory Statement
annexed to this Notice with liberty to the Board of
Directors (hereinafter referred to as “the Board” which term
shall be deemed to include Nomination and Remuneration
Committee of the Board) to alter and vary the terms and
conditions of the said re-appointment/remuneration in
such manner as may be agreed to between the Board
and Mr. Ghose.
RESOLVED FURTHER THAT the Board be and is hereby
authorised to take all such steps as may be necessary,
proper and expedient and to do any acts, deeds, matters
and things to give eff ect to this resolution.”
12. Ratifi cation of Remuneration of Cost Auditor
To consider and if thought fi t, to pass with or without
modifi cation(s), the following Resolution as an Ordinary
Resolution:
“RESOLVED THAT pursuant to Section 148 and other
applicable provisions, if any, of the Companies Act, 2013
(‘‘Act‘’) and the Companies (Audit and Auditors) Rules,
2014 , as amended from time to time, the Company
hereby ratifi es the remuneration of ` 9,00,000 plus service
tax and out-of-pocket expenses payable to M/s. N. I. Mehta
& Co., Cost Accountants and ` 1,20,000 plus service tax
and out-of-pocket expenses payable to M/s. Ramanath
Iyer & Co; Cost Accountants, who are appointed as Cost
Auditors of the Company to conduct Cost Audits relating
to cost records of the Company for the year ending
31st March, 2015.
RESOLVED FURTHER THAT the Board be and is hereby
authorised to do all acts and take all such steps as may
be necessary, proper or expedient to give eff ect to this
resolution.”
13. Approve borrowing limits of the Company
To consider and if thought fi t, to pass with or without
modifi cation(s), the following resolution as a Special
Resolution:
“RESOLVED THAT in supersession of the Ordinary
Resolution passed at the 69th Annual General Meeting
held on 4th August, 2008 and pursuant to Section
180(1)(c) and any other applicable provisions of the
Companies Act, 2013 and the rules made thereunder
(including any statutory modifi cation(s) for the time being
in force) and Memorandum and Articles of Association
of the Company, the consent of the Company be and is
hereby accorded to the Board of Directors of the Company
(‘the Board‘) to borrow monies in excess of the aggregate of
the paid up share capital and free reserves of the Company,
provided that the total amount borrowed and outstanding
at any point of time, apart from temporary loans obtained/
to be obtained from the Company’s Bankers in the ordinary
course of business, shall not be in excess of ` 5,500 crore
(Rupees fi ve thousand fi ve hundred crore only) or the
aggregate of the paid up share capital and free reserves of
the Company, whichever is higher.
RESOLVED FURTHER THAT the Board be and is hereby
authorised and empowered to arrange or settle the
terms and conditions on which all such monies are to be
borrowed from time to time as to interest, repayment,
security or otherwise howsoever as it may think fi t and
to do all such acts, deeds and things, to execute all such
documents, instruments and writings as may be required
and to delegate all or any of its powers herein conferred
to a Committee constituted by the Board and/ or any
member of such Committee.”
14. Creation of Charge on the assets of the Company
To consider and if thought fi t, to pass with or without
modifi cation(s), the following resolution as a Special
Resolution:
‘‘RESOLVED THAT in supersession of the Ordinary Resolution
passed at the 69th Annual General Meeting held on 4th
August, 2008 and pursuant to the provisions of Section
180(1)(a) and other applicable provisions, if any, of the
Companies Act, 2013, as amended from time to time, the
consent of the Company be and is hereby accorded to the
Board of Directors of the Company (‘the Board’) to create
such charges, mortgages and hypothecations in addition
to the existing charges, mortgages and hypothecations,
28 TATA CHEMICALS LIMITED
75th ANNUAL REPORT 2013-14
if any, created by the Company, on such movable and
immovable properties, both present and future, and in
such manner as the Board may deem fi t, in favour of Banks,
Financial Institutions, Insurance Companies, other lending/
investing agencies or bodies/ trustees for holders of
debentures/ bonds which may be issued to or subscribed
to by all or any of the Banks, Financial Institutions, Insurance
Companies, other lending/ investing agencies or any other
person(s)/ bodies corporate by way of private placement or
otherwise (hereinafter collectively referred to as ‘Lenders’),
provided that the total amount of loans together with
interest thereon, additional interest, compound interest,
liquidated damages, commitment charges, premia on
pre-payment or on redemption, costs, charges, expenses
and all other monies payable by the Company in respect
of the said loans, for which such charges, mortgages
or hypothecations are created, shall not, at any time
exceed the limit of ` 5,500 crore (Rupees fi ve thousand
fi ve hundred crore only) or the aggregate of the paid up
share capital and free reserves of the Company, whichever
is higher.
RESOLVED FURTHER THAT the Board be and is hereby
authorised to do all such acts, deeds and things, to execute
all such documents, instruments and writings as may be
required and to delegate all or any of its powers herein
conferred to a Committee constituted by the Board and/
or any member of such Committee.‘‘
15. Off er or invitation to subscribe to Non-Convertible
Debentures on Private Placement
To consider and if thought fi t, to pass with or without
modifi cation(s), the following resolution as a Special
Resolution:
“RESOLVED THAT pursuant to the provisions of Sections 42,
71 and all other applicable provisions of the Companies
Act, 2013 read with the Rules framed thereunder (including
any statutory modifi cation(s) thereof, for the time being
in force) and subject to the provisions of the Articles of
Association of the Company, the approval of members be
and is hereby accorded to authorise the Board of Directors
of the Company (‘the Board‘) to off er or invite subscriptions
for Redeemable Non-Convertible Debentures, in one or
more tranches, such that aggregate amount does not
exceed ` 1,000 crore (Rupees one thousand crore only)
on private placement on such terms and conditions as
the Board may, from time to time, determine and consider
proper and most benefi cial to the Company during a
period of one year from the date of passing the Resolution
and that the said borrowing is within the overall borrowing
limit of the Company.
RESOLVED FURTHER THAT the Board be and is hereby
authorised to do all the acts and to take all such steps as
may be necessary to give eff ect to this resolution.”
NOTES:
1. The Explanatory Statement pursuant to Section 102 of the
Companies Act, 2013 is annexed hereto.
2. A member entitled to attend and vote at the Annual
General Meeting (“AGM”) is entitled to appoint a proxy
to attend and vote on a poll instead of himself and the
proxy need not be a member of the Company. The
instrument appointing the proxy should, however, be
deposited at the registered offi ce of the Company not
less than forty-eight hours before the commencement of
the AGM.
A person can act as a proxy on behalf of members not
exceeding fi fty and holding in the aggregate not more
than ten percent of the total share capital of the Company
carrying voting rights. A member holding more than ten
percent of the total share capital of the Company carrying
voting rights may appoint a single person as proxy and
such person shall not act as a proxy for any other person or
member.
3. Book Closure and Dividend:
The Register of Members and the Share Transfer Books of
the Company will be closed from 12th August, 2014 to
21st August, 2014, both days inclusive.
The dividend, if declared at the AGM, will be paid between
22nd August, 2014 to 29th August, 2014 to those persons
or their mandates:
(a) whose names appear as Benefi cial Owners as at the
end of the business hours on 11th August, 2014
NOTICE
29
CORPORATE OVERVIEW FINANCIAL STATEMENTSSTATUTORY REPORTS
in the list of Benefi cial Owners to be furnished by
National Securities Depository Limited and Central
Depository Services (India) Limited in respect of the
shares held in electronic form; and
(b) whose names appear in the Register of Members
of the Company on 11th August, 2014 after giving
eff ect to valid share transfers in physical form
lodged with the Company / Registrar and Share
Transfer Agents on or before the aforesaid date.
4. National Electronic Clearing Service (NECS):
(a) To avoid loss of dividend warrants in transit and
undue delay in receipt of dividend warrants, the
Company has provided National Electronic Clearing
Service (NECS) facility to the Members for the
remittance of dividend. NECS facility is available
at locations identifi ed by the Reserve Bank of India
from time to time. Members holding shares in
physical form and desirous of availing this facility
are requested to provide their latest bank account
details (Core Banking Solutions Enabled Account
Number, 9 digit MICR and 11 digit IFS Code),
along with their Folio Number, to the Company’s
Registrars and Share Transfer Agents, TSR Darashaw
Private Limited.
(b) Members holding shares in electronic form are
hereby informed that bank particulars registered
against their respective depository accounts will
be used by the Company for payment of dividend.
The Company or its Registrars cannot act on any
request received directly from the Members holding
shares in electronic form for any change of bank
particulars or bank mandates. Such changes are to
be advised only to the depository participant of the
Members.
5. Nomination Facility:
Members holding shares in physical form may obtain the
Nomination forms from the Company’s Registrar and Share
Transfer Agents. Members holding shares in electronic form
may obtain the Nomination forms from their respective
depository participants.
6. Unclaimed Dividend:
(a) Transfer to General Revenue Account
Pursuant to Section 205A(5) of the Companies Act,
1956 (‘‘1956 Act‘‘), all unclaimed dividend upto the
Financial year ended 31st March, 1995 has been
transferred to the General Revenue Account of the
Central Government. Members, who have not yet
encashed their dividend warrant for the said period,
are requested to forward their claims in Form No. II
prescribed under the Companies Unpaid Dividend
(Transfer to General Revenue Account of the Central
Government) Rules, 1978 to:
Offi ce of the Registrar of Companies
Central Government Offi ce Building
‘A’ Wing, Second fl oor,
Next to Reserve Bank of India,
CBD, Belapur 400 614
(b) Transfer to the Investor Education and
Protection Fund
Consequent upon amendment to Section 205A
of the 1956 Act and introduction of Section 205C
by the Companies (Amendment) Act, 1999, the
amount of dividend for the subsequent years
remaining unpaid or unclaimed for a period of
seven years from the dates they became fi rst due
for payment shall be transferred to the Investor
Education and Protection Fund (the “Fund”) set up
by the Government of India.
Accordingly, the dividend which had remained
unpaid / unclaimed from the fi nancial years ended
31st March, 1996 to 31st March, 2006 have been
transferred to the Fund in respect of the Company
and that of erstwhile Hind Lever Chemicals Limited
(since merged with the Company eff ective 1st June,
2004), for the fi nancial year ended 31st December,
2003 have been transferred to the Fund. Members
are requested to note that pursuant to Section
205(C) of the 1956 Act, no claim shall lie against
the Company or the aforesaid Fund in respect of
any amount of dividend remaining unclaimed /
unpaid for a period of seven years from the dates
30 TATA CHEMICALS LIMITED
75th ANNUAL REPORT 2013-14
they became fi rst due for payment. Any person /
member who has not claimed dividend in respect
of the fi nancial year ended 31st March, 2007 or
any year thereafter is requested to approach the
Company / Registrar and Share Transfer Agents
of the Company for claiming the same. It may be
noted that the unpaid / unclaimed dividend for the
fi nancial year ended 31st March, 2007 declared by
the Company on 27th July, 2007 can be claimed by
the Members by 26th July, 2014.
It may also be noted that the unpaid / unclaimed
dividend for the fi nancial year ended 31st March,
2008 declared by the Company on 4th August, 2008
can be claimed by the Members by 3rd August, 2015.
(c) Details of unclaimed dividend on the website
The Ministry of Corporate Aff airs (MCA) on 10th May,
2012 notifi ed the IEPF (Uploading of information
regarding unpaid and unclaimed amounts lying
with companies) Rules, 2012 (IEPF Rules), which is
applicable to the Company. The objective of the
IEPF Rules is to help the shareholders ascertain
status of the unclaimed amounts and overcome
the problems due to misplacement of intimation
thereof by post etc. In terms of the said IEPF Rules,
the Company has uploaded the information in
respect of the Unclaimed Dividends in respect of
the fi nancial years from 2006, as on 22nd August,
2012 (date of 73rd AGM) and 26th August, 2013
(date of 74th AGM), respectively on the website of
the IEPF viz. www.iepf.gov.in and under “Investors
Section” on the Website of the Company viz;
www.tatachemicals.com
7. The Securities and Exchange Board of India (SEBI) has
mandated the submission of Permanent Account Number
(PAN) by every participant in securities market. Members
holding shares in electronic form are, therefore, requested
to submit the PAN to their depository participants with
whom they are maintaining their demat accounts.
Members holding shares in physical form can submit their
PAN details to the Company‘s Registrar and Share Transfer
Agents.
8. Details under Clause 49 of the Listing Agreement with
the Stock Exchanges in respect of the Directors seeking
appointment/re-appointment at the AGM are annexed
hereto and forms an integral part of the Notice.
9. Electronic copy of the Annual Report for 2013-14 is
being sent to all the members whose email IDs are
registered with the Company/depository participant(s)
for communication purposes unless any member has
requested for a hard copy of the same. For members who
have not registered their email address, physical copies of
the Annual Report for 2013-14 is being sent in the permitted
mode.
10. To support the ‘Green Initiative’, the Members
who have not registered their e-mail addresses
are requested to register the same with Registrars/
Depositories.
11. Voting through electronic means:
In compliance with the provisions of Section 108 of the
Companies Act, 2013 and Rule 20 of the Companies
(Management and Administration) Rules, 2014, the
Company is pleased to provide members facility to exercise
their right to vote at the 75th AGM by electronic means
and the business may be transacted through e-Voting
services provided by National Securities Depository
Limited (NSDL):
The instructions for e-voting are as under:
A. In case a Member receives an email from NSDL [for
members whose email IDs are registered with the
Company/depository participants(s)]:
(i) Open email and open PDF fi le viz; “TCL
e-Voting.pdf” with your Client ID or Folio No.
as password. The said PDF fi le contains your
user ID and password for e-voting. Please
note that the password is an initial password.
(ii) Launch internet browser by typing the
following URL:https://www.evoting.nsdl.com/
(iii) Click on Shareholder – Login
(iv) Put user ID and password as initial password
noted in step (i) above. Click Login.
NOTICE
31
CORPORATE OVERVIEW FINANCIAL STATEMENTSSTATUTORY REPORTS
(v) Password change menu appears. Change
the password with new password of your
choice with minimum 8 digits/characters or
combination thereof. Note new password.
It is strongly recommended not to share
your password with any other person and
take utmost care to keep your password
confi dential.
(vi) Home page of e-voting opens. Click on
e-Voting: Active Voting Cycles.
(vii) Select “EVEN” (e-voting EVENT Number) of
Tata Chemicals Limited.
(viii) Now you are ready for e-voting as Cast Vote
page opens.
(ix) Cast your vote by selecting appropriate
option and click on “Submit” and also
“Confi rm” when prompted.
(x) Upon confi rmation, the message “Vote cast
successfully” will be displayed.
(xi) Once you have voted on the resolution, you
will not be allowed to modify your vote.
(xii) Institutional shareholders (i.e. other than
individuals, HUF, NRI etc.) are required to
send scanned copy (PDF/JPG Format) of
the relevant Board Resolution / Authority
letter etc. together with attested specimen
signature of the duly authorised signatory(ies)
who are authorised to vote, to the Scrutinizer
through e-mail to [email protected]
with a copy marked to [email protected]
B. In case a Member receives physical copy of the
Notice of AGM [for members whose email IDs are
not registered with the Company/ depository
participants(s) or requesting physical copy]:
(i) Initial password is provided in the enclosed
ballot form: EVEN (e-voting EVENT Number)
User ID and Password.
(ii) Please follow all steps from Sl. No. (ii) to
Sl. No. (xii) above, to cast vote. In case of
any queries, you may refer the Frequently
Asked Questions (FAQs) for Shareholders
and e-voting user manual for Shareholders
available at the Downloads section of www.
evoting.nsdl.com
(iii) If you are already registered with NSDL for
e-voting then you can use your existing user
ID and password for casting your vote.
(iv) You can also update your mobile number
and e-mail id in the user profi le details of
the folio which may be used for sending
future communication(s).
C. Other Instructions:
(i) The e-voting period commences on
12th August, 2014 (9.00 a.m.) and ends
on 14th August, 2014 (6.00 p.m.). During
this period members of the Company,
holding shares either in physical form or
in dematerialised form, as on the cut-off
date (record date) of 4th July, 2014, may
cast their votes electronically. The e-voting
module shall be disabled by NSDL for voting
thereafter. Once the vote on a resolution is
cast by the member, the member shall not
be allowed to change it subsequently.
(ii) The voting rights of members shall be in
proportion to their shares of the paid up
equity share capital of the Company as on
the cut-off date (record date) of 4th July,
2014.
(iii) Mr. P. N. Parikh of M/s. Parikh &
Associates, Practicing Company Secretaries,
(Membership No. FCS-327), has been
appointed as the Scrutinizer to scrutinize
the e-voting process in a fair and transparent
manner.
(iv) The Scrutinizer shall within a period not
exceeding three (3) working days from the
conclusion of the e-voting period unblock
the votes in the presence of at least two (2)
witnesses not in the employment of the
32 TATA CHEMICALS LIMITED
75th ANNUAL REPORT 2013-14
Company and make a Scrutinizer’s Report
of the votes cast in favour or against, if any,
and submit forthwith to the Chairman of the
Company.
(v) The Results shall be declared on or after
the AGM of the Company. The Results
declared alongwith the Scrutinizer’s Report
shall be placed on the Company’s website
www.tatachemicals.com and on the website
of NSDL within two (2) days of passing of the
resolutions at the AGM of the Company and
communicated to the stock exchanges.
(vi) Members who do not have access to
e-voting facility may send duly completed
Ballot Form enclosed with the Annual report
so as to reach the Scrutinizer appointed by
the Board of Directors of the Company,
Mr. P. N. Parikh of M/s. Parikh & Associates,
Practising Company Secretary (Membership
No. FCS-327), at the Registered Offi ce of the
Company not later than 14th August, 2014
(6.00 p.m.).
Ballot Form received after this date will be
treated as invalid.
(vii) A member can opt for only one mode of
voting i.e. either through e-voting or by Ballot.
If a Member casts votes by both modes, then
voting done through e-voting shall prevail
and Ballot shall be treated as invalid.
By Order of the Board of Directors
Rajiv Chandan
General Counsel & Company Secretary
Mumbai, 30th May, 2014
Registered Offi ce:
Bombay House,
24, Homi Mody Street, Fort,
Mumbai 400 001
CIN:- L24239MH1939PLC002893
Email:- [email protected]
Website:- www.tatachemicals.com
33
CORPORATE OVERVIEW FINANCIAL STATEMENTSSTATUTORY REPORTS
The following Explanatory Statement, pursuant to Section 102
of the Companies Act, 2013 (“Act”), sets out all material facts
relating to the business mentioned at Item Nos. 4 to 15 of the
accompanying Notice dated 30th May, 2014.
Item No. 4:
This Explanatory Statement is provided though strictly not
required as per section 102 of the Act.
Deloitte Haskins & Sells (DHS) Chartered Accountants (CAs), (ICAI
Firm‘s Registration No. 117366W), Mumbai were appointed as the
statutory auditors of the Company for Financial Year (FY) 2013-14
at the Annual General Meeting (AGM) of the Company held on
26th August, 2013. DHS converted itself into a Limited Liability
Partnership (LLP) under the provisions of the Limited Liability
Partnership Act, 2008 and is now known as Deloitte Haskins & Sells
LLP, (DHS LLP) Chartered Accountants (ICAI Firm‘s Registration
No. 117366W/W - 100018) with eff ect from 20th November, 2013.
In terms of the Ministry of Corporate Aff airs, Government of India,
General Circular No. 9/2013 dated 30th April, 2013, if a fi rm of CAs,
being an auditor in a company under the Companies Act, 1956,
is converted into an LLP, then such an LLP would be deemed to
be the auditor of the said company. The Board of Directors of the
Company has taken due note of this change. Accordingly, the
audit of the Company for fi nancial year 2013-14 was conducted
by DHS LLP.
DHS LLP have been the Auditors of the Company since
FY 2008-09 and have completed a term of six years. Prior to
this, Messrs. S. B. Billimoria & Co. (SBB) were the Auditors of the
Company since 1939. SBB was an associate of DHS LLP. As per
the provisions of section 139 of the Act, no listed company can
appoint or re-appoint an audit fi rm as auditor for more than two
terms of fi ve consecutive years. Section 139 of the Act has also
provided a period of three years from the date of commencement
of the Act to comply with this requirement.
In view of the above, DHS LLP, being eligible for re-appointment
and based on the recommendation of the Audit Committee,
the Board of Directors has, at its meeting held on 30th May,
2014, proposed the appointment of DHS LLP as the statutory
auditors of the Company for a period of three years to hold
offi ce from the conclusion of this AGM till the conclusion of
EXPLANATORY STATEMENT PURSUANT TO SECTION 102 OF THE COMPANIES ACT, 2013 (‘‘ACT‘‘)
the seventy eighth (78th) AGM of the Company to be held
in 2017 (subject to ratifi cation of their appointment at every
AGM).
The Board commends the Ordinary Resolution set out at Item
No. 4 for approval by the Members.
None of the Directors or Key Managerial Personnel of the
Company or their relatives is, in any way, concerned or interested,
in the Resolution at Item No. 4 of the Notice.
Item Nos. 5 to 9:
The Company had appointed Mr. Nusli Wadia, Mr. Nasser Munjee,
Mr. Eknath Kshirsagar, Dr. Y. S. P. Thorat and Dr. Vijay Kelkar as
Non-Executive Directors and were considered as Independent
Directors under clause 49 of the Listing Agreement.
As per the provisions of Section 149(4) which has come into force
with eff ect from 1st April, 2014, every listed company is required
to have at least one-third of the total number of Directors as
Independent Directors. Further, Section 149(10) of the Act
provides that an Independent Director shall hold offi ce for a term
up to fi ve consecutive years on the Board of a company and is not
liable to retire by rotation pursuant to Section 149(13) read with
Section 152 of the Act.
The Nomination and Remuneration Committee has
recommended the appointments of these Directors as
Independent Directors for the following term:
Directors Term
1. Mr. Nasser Munjee For a period of fi ve years from 21st
August, 2014 upto 20th August,
2019.2. Dr. Y. S. P. Thorat
3. Mr. Nusli Wadia From 21st August, 2014 to 15th
February, 2019 *
4. Mr. Eknath Kshirsagar From 21st August, 2014 to 10th
September, 2016*
5. Dr. Vijay Kelkar From 21st August, 2014 to 15th
May, 2017*
*They will be retiring on attaining the age of 75 years in accordance
with the Company‘s retirement age policy for Directors.
The above Independent Directors have given a declaration to the
Board that they meet the criteria of independence as provided
under Section 149(6) of the Act. In the opinion of the Board, the
34 TATA CHEMICALS LIMITED
75th ANNUAL REPORT 2013-14
above Independent Directors fulfi ll the conditions specifi ed
in the Act and the Rules made thereunder for appointment as
Independent Directors and they are independent of the
management.
In compliance with the provisions of Section 149 read with
Schedule IV to the Act, the appointment of the above Directors as
Independent Directors is now being placed before the Members
in General Meeting for their approval.
The terms and conditions of appointment of Independent
Directors shall be open for inspection by the Members at the
Registered Offi ce of the Company on all working days, during
business hours upto the date of the Meeting.
The brief profi le of the Independent Directors to be appointed is
given below:
Mr. Nusli Wadia is educated in the UK. Mr. Wadia is the Chairman
of the Bombay Dyeing & Manufacturing Company Limited and
heads the Wadia Group. He is also the Chairman/Trustee of various
charitable institutions and non-profi t organisation. Mr. Wadia
has been on the Company’s Board since 26th June, 1981 as an
Independent Director.
Mr. Nasser Munjee holds a Bachelor’s degree and a Master’s
degree from the London School of Economics, UK. He served
with HDFC for over 20 years at various positions including as its
Executive Director. He was the Managing Director of Infrastructure
Development Finance Co. Ltd. (IDFC) up to March 2004. Presently
he is the Chairman of Development Credit Bank (DCB) since
June 2005 and is also on the Board of various multinational
companies and Trusts. Mr. Munjee is a Technical Advisor on the
World Bank-Public Private Partnership Infrastructure and Advisory
Fund. Mr. Munjee has been on the Company‘s Board since 25th
September, 2006 as an Independent Director.
Mr. Eknath Kshirsagar is a fellow of the Institute of Chartered
Accountants in England and Wales. He has wide experience in
corporate strategy and structure, valuation, feasibility studies,
disinvestment and mergers and acquisitions. He was associated
with the management consultancy division of A.F. Ferguson
for over three decades and retired in 2004 as a senior partner.
Mr. Kshirsagar serves on the Boards of several leading Indian
public companies. Mr. Kshirsagar has been on the Company‘s
Board since 26th November, 2008 as an Independent Director.
Dr. Y. S. P. Thorat holds a Doctorate in Economics and degrees
in Political Science and Law. Dr. Thorat served RBI from 1972 to
2003 in various capacities, including as Executive Director. He
has also served NABARD as Managing Director from 2004 and
was appointed as its Chairman in 2006 and served the Institution
in that capacity until November 2007. He has been recently
appointed by the Government of Maharashtra as Executive
Chairman of the Dry Land Farming Commission and Chairman
of the Agriculture Universities Recruitment Board. Presently,
Dr. Thorat is on the Boards of several companies. Dr. Thorat has
been on the Company‘s Board since 8th January, 2010 as an
Independent Director.
Dr. Vijay Kelkar has done PhD from the University of California at
Berkeley. Dr. Kelkar joined the Planning Commission in 1973 and
thereafter the Commerce Ministry in 1977 as Economic Advisor,
and has since then served in various posts including Secretary to
the Economic Advisory Council to the Prime Minister between
1985 and 1988. In 1994, he served as Petroleum Secretary and was
made Finance Secretary in 1998. He was an Executive Director in
the International Monetary Fund (IMF), overseeing its operations
in South Asia during 2000-02. Dr. Kelkar has retired as Chairman,
Finance Commission, in the rank of a Union Cabinet Minister.
He has held several other key positions in the Government of
India. In January 2011, the President of India awarded Dr. Kelkar
“Padma Vibhushan”, the second highest Civilian Award for
distinguished and exceptional service to the Nation. Dr. Kelkar
has been on the Company‘s Board since 30th May, 2012 as an
Independent Director.
The Board commends the Ordinary Resolutions set out at Items
Nos. 5 to 9 of the Notice for approval by the Members.
The above Independent Directors are interested in the Resolutions
mentioned at Item Nos. 5 to 9 of the Notice with regard to their
respective appointments. Other than the above Independent
Directors, no other Director, Key Managerial Personnel of the
Company or their relatives are in any way, concerned or interested,
in the Resolutions mentioned at Items Nos. 5 to 9 of the Notice
Item No. 10 & 11:
A. MR. R. MUKUNDAN:
Mr. R. Mukundan was appointed as the Managing Director
of the Company for a period of 5 years with eff ect from
26th November, 2008. The Board, at its meeting held on
NOTICE
35
CORPORATE OVERVIEW FINANCIAL STATEMENTSSTATUTORY REPORTS
11th November, 2013, had passed a resolution and re-
appointed Mr. R. Mukundan as the Managing Director of
the Company for a further period of 5 years with eff ect
from 26th November, 2013 upto 25th November, 2018.
Mr. Mukundan is an MBA from FMS, Delhi University and
BE-Electrical Engineering from IIT, Roorkee. He has attended
the Advanced Management Programme at Harvard
Business School. He joined the Tata Administrative Service
in 1990. He joined Tata Chemicals Limited (TCL) in 2001
and has led various functions like strategy and business
development, corporate quality, corporate planning and
manufacturing before taking over as the Chief Operating
Offi cer of the chemicals business of the Company. He
played an active role in the TCL transformation eff orts in
2002, and also in the growth of domestic business as well as
acquisition of new facilities in United Kingdom, Kenya and
United States.
(a) The principal terms and conditions of re-appointment of
Mr. Mukundan as the Managing Director are as follows:
(i) Period:
For a period of 5 years eff ective from 26th
November, 2013 upto 25th November, 2018.
(ii) Nature of Duties:
Mr. Mukundan shall devote his whole time and
attention to the business of the Company and
carry out such duties as may be entrusted to him
by the Board from time to time and separately
communicated to him and exercise such powers as
may be assigned to him, subject to superintendence,
control and directions of the Board in connection
with and in the best interests of the business of the
Company and the business of any one or more of
its associated companies and / or joint ventures
and / or subsidiaries, including performing duties
as assigned by the Board from time to time by
serving on the boards of such associated companies
and / or joint ventures and / or subsidiaries or any
other executive body or any committee of such a
company.
Mr. Mukundan undertakes to employ the best of his
skill and ability to make his utmost endeavours to
promote the interests and welfare of the Company
and to conform to and comply with the directions
and regulations of the Company and all such orders
and directions as may be given to him from time to
time by the Board.
(iii) a. Remuneration:
Salary - ` 5,50,000/- per month in the scale
of ` 5,50,000/- to ` 8,00,000/- per month. The
annual increments which will be eff ective
1st April each year, will be decided by the
Board and will be merit-based and take
into account the Company’s performance;
Incentive Remuneration and/or Commission
based on certain performance criteria to be
laid down by the Board; Benefi ts, Perquisites,
Allowances as may be determined from time
to time.
b. Minimum Remuneration:
Notwithstanding anything to the contrary
herein contained, where in any fi nancial
year during the currency of the tenure of
Mr. Mukundan, the Company has no profi ts
or its profi ts are inadequate, the Company
will pay to Mr. Mukundan remuneration
by way of Salary, Benefi ts, Perquisites and
Allowances, and Incentive Remuneration as
specifi ed above.
B. MR. P. K. GHOSE:
Mr. P. K. Ghose was appointed as an Executive Director &
CFO of the Company for a period of 5 years with eff ect
from 26th November, 2008. The Board, at its meeting held
on 11th November, 2013 had passed a resolution and re-
appointed Mr. Ghose as an Executive Director and CFO of
the Company with eff ect from 26th November, 2013 upto
30th September, 2015 (till he attains the retirement age).
Mr. Ghose is an Honours Graduate in Commerce and a
member of the Institute of Cost and Works Accountants
of India, the Institute of Company Secretaries of India
and is an alumnus of the Advanced International General
Management Programme of INSEAD, France. He joined
the Company in 2002 as CFO. He was elevated as
Executive Vice President & CFO in 2007. Prior to joining
Tata Chemicals Limited, he was with Tata Steel Limited
36 TATA CHEMICALS LIMITED
75th ANNUAL REPORT 2013-14
and worked with Tata Steel for three decades in several
senior positions, including General Manager (Accounts),
Chief Financial Controller (Corporate) and Chief of
Strategic Finance.
(b) The principal terms and conditions of re-appointment
of Mr. P. K. Ghose as an Executive Director & CFO are as
follows:
(i) Period:
From 26th November, 2013 upto 30th September,
2015.
(ii) Nature of Duties:
Mr. Ghose shall devote his whole time and attention
to the business of the Company and carry out such
duties as may be entrusted to him by the Managing
Director and/ or the Board from time to time and
separately communicated to him and exercise
such powers as may be assigned to him, subject to
superintendence, control and directions of the Board
in connection with and in the best interests of the
business of the Company and the business of any
one or more of its associated companies and/ or joint
ventures and / or subsidiaries, including performing
duties as assigned by the Managing Director and/or
the Board from time to time by serving on the boards
of such associated companies and / or joint ventures
and / or subsidiaries or any other executive body
or any committee of such a company. Mr. Ghose
shall not exceed the powers so delegated by the
Managing Director and/or Board pursuant to this
clause.
Mr. Ghose undertakes to employ the best of his
skill and ability to make his utmost endeavours to
promote the interests and welfare of the Company
and to conform to and comply with the directions
and regulations of the Company and all such orders
and directions as may be given to him from time to
time by the Managing Director and/or the Board.
(iii) a. Remuneration:
Salary - ` 4,30,000/- per month in the scale of
` 4,30,000/- to ` 7,00,000/- per month. The
annual increments which will be eff ective 1st
April each year, will be decided by the Board
and will be merit-based and take into account
the Company’s performance; Incentive
Remuneration and/or Commission based on
certain performance criteria to be laid down
by the Board; Benefi ts, Perquisites, Allowances
as may be determined from time to time.
b. Minimum Remuneration:
Notwithstanding anything to the contrary
herein contained, where in any fi nancial
year during the currency of the tenure of
Mr. Ghose, the Company has no profi ts or its
profi ts are inadequate, the Company will pay
to Mr. Ghose remuneration by way of Salary,
Benefi ts, Perquisites and Allowances, and
Incentive Remuneration as specifi ed above.
(c) The Board is of the view that the re-appointment of
Mr. Mukundan as the Managing Director and Mr. Ghose
as an Executive Director and CFO will greatly benefi t
the operations of the Company and the remuneration
payable to them is commensurate with their abilities and
experience.
(d) The terms and conditions of appointment of Mr. Mukundan
and Mr. Ghose (hereinafter referred to as “ the Appointees”)
also include, inter-alia, following principal clauses:
(i) The Appointees shall adhere with the Tata Code of
Conduct, intellectual property, non competition,
no confl ict of interest with the Company and
maintenance of confi dentiality.
(ii) The Appointees shall not become interested or
otherwise concerned, directly or indirectly through
their respective spouse and /or children, in any
selling agency of the Company.
(iii) These appointments may be terminated by
either party by giving six months’ notice of such
termination or the Company paying six months’
remuneration in lieu of such notice.
(iv) The employment of the Appointees may be
terminated by the Company without notice or
payment in lieu of Notice:
NOTICE
37
CORPORATE OVERVIEW FINANCIAL STATEMENTSSTATUTORY REPORTS
a. If the Appointees are found guilty of any
gross negligence, default or misconduct in
connection with or aff ecting the business
of the Company or any subsidiary or joint
venture or associated company to which
they are required by the Agreement to
render services; or
b. In the event of any serious or repeated or
continuing breach (after prior warning) or
non observance by the Appointees of any of
the stipulations contained in the Agreement
to be executed between the Company and
the Appointees; or
c. In the event the Board expresses its loss of
confi dence in the Appointees.
(v) In the event the Appointees are not in a position
to discharge their offi cial duties due to any
physical or mental incapacity, the Board shall be
entitled to terminate their contracts on such terms
as the Board may consider appropriate in the
circumstances.
(vi) Upon termination of the Appointees’ employment,
by whatever means:
a. The Appointees shall immediately cease
to hold the offi ces held by them in any
subsidiaries and associate companies
without claim for compensation for loss of
offi ce by virtue of Section 167(1)(h) of the
Act.
b. The Appointees shall not without the consent
of the Company at any time thereafter
represent themselves as connected with
the Company or any of the subsidiaries, joint
ventures or associated companies.
(vii) The Appointees are appointed as Directors by virtue
of their employment in the Company and their
appointment shall be subject to the provisions of
Section 167(1)(h) of the Act.
(viii) If and when the Agreements expire or are terminated
for any reason whatsoever, the Appointees shall
cease to be the Managing Director / Executive
Director, as the case may be, and also cease to
be the Directors, if at any time, the Appointees
cease to be the Directors of the Company for any
reason whatsoever, they shall cease to be the
Managing Director / Executive Director, as the
case may be, and the Agreements shall forthwith
terminate. If at any time the Appointees shall cease
to be in the employment of the Company for any
reason whatsoever, they shall cease to be the
Managing Director / Executive Director, as the case
may be.
(ix) The terms and conditions of the appointments
may be altered or varied from time to time by the
Board of Directors, as it may in its discretion deem fi t,
irrespective of the limits stipulated under Schedule
V to the Act, or amendments made hereafter in
this regard, in such manner as may be agreed to
between the Board and the Appointees, subject to
such approvals as may be required.
(x) All Personnel Policies of the Company and the
related Rules which are applicable to other
employees of the Company shall also be applicable
to the Appointees unless specifi cally provided
otherwise.
(xi) In compliance with the provisions of Sections
196 & 197 and any other applicable provisions
of the Act read with the Schedule V to the Act,
the re-appointment and terms of remuneration
specifi ed above of the Appointees are now
being placed before the Members for their
approval.
(e) Abstract in terms of Section 302 of the Companies Act, 1956
pertaining to the terms of appointment and remuneration
payable to Mr. Mukundan and Mr. Ghose was duly sent to
the members in the month of November, 2013.
The Board commends the Ordinary Resolutions at Item Nos.10
and 11 of the Notice for approval by the Members.
None of the Directors, Key Managerial Personnel of the Company
or their relatives is, in any way concerned or interested, in the
38 TATA CHEMICALS LIMITED
75th ANNUAL REPORT 2013-14
said Resolutions, except for Mr. Mukundan and Mr. Ghose, in
Resolution at Item Nos. 10 and 11 of the Notice.
Item No. 12:
The cost audit of the products such as Soda Ash, Caustic Soda,
Chemicals, Fertilisers, Cement, etc. is conducted by the cost
auditors.
The Board, on the recommendation of the Audit Committee,
has approved the appointment and remuneration of the Cost
Auditors to conduct the audit of the cost records of the Company
for the fi nancial year ending 31st March, 2015 as per the following
details:
Sr.
No.
Name of the Cost Auditor Audit Fees
1. M/s. N.I. Mehta & Co; Cost Accountants ` 9,00,000
2. M/s. Ramanath Iyer & Co; Cost
Accountants
` 1,20,000
In accordance with the provisions of Section 148 of the Act
read with the Companies (Audit and Auditors) Rules, 2014, the
remuneration payable to the Cost Auditors has to be ratifi ed by
the shareholders of the Company.
Accordingly, consent of the members is sought for passing an
Ordinary Resolution as set out at Item No. 12 of the Notice for
ratifi cation of the remuneration payable to the Cost Auditors for
the fi nancial year ending 31st March, 2015.
The Board commends the Ordinary Resolution set out at Item No.
12 of the Notice for approval by the members.
None of the Directors, Key Managerial Personnel of the Company
or their relatives is, in any way, concerned or interested, in the
resolution set out at Item No. 12 of the Notice.
Item no. 13 & 14:
The members of the Company at their 69th Annual General
Meeting held on 4th August, 2008 had approved by way
of an Ordinary Resolutions under Section 293(1)(d) and
Section 293(1)(a) of the Companies Act, 1956, for borrowings
over and above the aggregate of paid up share capital and free
reserves of the Company provided that the total amount of
such borrowings together with the amounts already borrowed
and outstanding at any point of time shall not be in excess of
` 5,500 crore and to create charge / mortgage / hypothecation
on the Company’s assets, both present and future, in favour of the
lenders / trustees for the holders of debentures / bonds, to secure
the repayment of monies borrowed by the Company (including
temporary loans obtained from the Company’s Bankers in the
ordinary course of business) respectively.
Under the provisions of Section 180(1)(c) and Section 180(1)(a) of
the Act, the above powers can be exercised by the Board only
with the consent of the shareholders obtained by a Special
Resolution. Further, as per a clarifi cation dated 25th March, 2014
issued by the Ministry of Corporate Aff airs, the Ordinary Resolution
earlier passed under Section 293(1)(d) and Section 293(1)(a) of the
Companies Act, 1956 will remain valid for a period of one year
from the date of notifi cation of Section 180 of the Act, i.e. upto
11th September, 2014. As such, it is necessary to obtain fresh
approval of the shareholders by means of a Special Resolution, to
enable the Board of Directors of the Company to borrow monies,
apart from temporary loans obtained from the Company’s Bankers
in the ordinary course of business, in excess of the aggregate of
paid-up share capital and free reserves of the Company and to
create charge / mortgage / hypothecation of the Company‘s
assets, both present and future, in favour of the lenders, trustees
for the holders of the debenures / bonds, to secure the repayment
of monies borrowed by the Company (including temporary
loans obtained from the Company’s Bankers in the ordinary
course of business).
The approval for borrowing limit being sought is ` 5,500 crore
or the aggregate of the paid up share capital and free reserves
of the Company, whichever is higher, and to create charge /
mortgage / hypothecation on the Company‘s assets to secure
such borrowings, under Section 180(1)(c) and 180(1)(a) of the Act.
The Board commends the Special Resolution set out at Item Nos.
13 & 14 of the Notice for approval by the members.
None of the Directors, Key Managerial Personnel of the Company
or their relatives is, in any way, concerned or interested, in the
resolution set out at Item Nos. 13 and 14.
Item no. 15:
Section 42 of the Act read along with sub rule (2) of the Rule 14 of
Companies (Prospectus and Allotment of Securities) Rules, 2014
states that in case of an off er or invitation to subscribe the Non-
Convertible Debentures on Private Placement the Company shall
NOTICE
39
CORPORATE OVERVIEW FINANCIAL STATEMENTSSTATUTORY REPORTS
obtain prior approval of Members by Special resolution only once
in a year for all the off ers or invitations for such Debentures during
the year.
In order to augment the long term resources for fi nancing and
for general corporate purposes, the Company may off er or
invite subscriptions for Non–Convertible Debentures in one or
more tranches on private placement, issuable / redeemable
at par.
Accordingly, the consent of members is sought for passing
a Special Resolution as set out at Item No. 15 of the Notice
pursuant to Sections 42, 71 and other applicable provisions of
the Act, read together with the Rules framed thereunder. This
resolution enables the Board of Directors of the Company to
off er or invite subscriptions for Non-Convertible Debentures,
as may be required by the Company from time to time for a
year.
The Board commends the Special Resolution at Item No. 15 of the
Notice for approval by the members.
The Directors of the Company who are directors or members of
other companies may be deemed to be concerned or interested in
the said Resolution to the extent of Non-Convertible Debentures
that may be subscribed to by such companies. Other than this,
none of the Directors, Members, Key Managerial Personnel
of the Company or their relatives is, in any way concerned or
interested, in the Resolution mentioned at Item No. 15 of the
Notice.
By Order of the Board of Directors
Rajiv Chandan
General Counsel & Company Secretary
Mumbai, 30th May, 2014
Registered Offi ce:
Bombay House,
24, Homi Mody Street, Fort,
Mumbai 400 001
CIN:- L24239MH1939PLC002893
Email:- [email protected]
Website:- www.tatachemicals.com
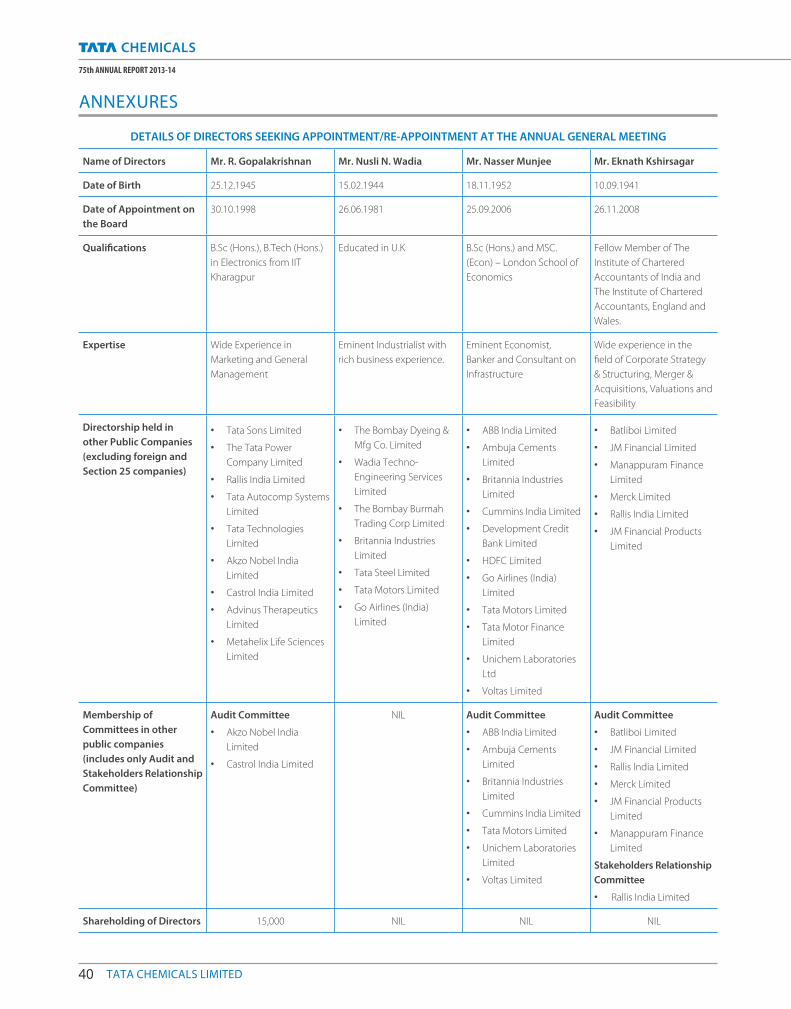
40 TATA CHEMICALS LIMITED
75th ANNUAL REPORT 2013-14
DETAILS OF DIRECTORS SEEKING APPOINTMENT/RE-APPOINTMENT AT THE ANNUAL GENERAL MEETING
Name of Directors Mr. R. Gopalakrishnan Mr. Nusli N. Wadia Mr. Nasser Munjee Mr. Eknath Kshirsagar
Date of Birth 25.12.1945 15.02.1944 18.11.1952 10.09.1941
Date of Appointment on
the Board
30.10.1998 26.06.1981 25.09.2006 26.11.2008
Qualifi cations B.Sc (Hons.), B.Tech (Hons.)
in Electronics from IIT
Kharagpur
Educated in U.K B.Sc (Hons.) and MSC.
(Econ) – London School of
Economics
Fellow Member of The
Institute of Chartered
Accountants of India and
The Institute of Chartered
Accountants, England and
Wales.
Expertise Wide Experience in
Marketing and General
Management
Eminent Industrialist with
rich business experience.
Eminent Economist,
Banker and Consultant on
Infrastructure
Wide experience in the
fi eld of Corporate Strategy
& Structuring, Merger &
Acquisitions, Valuations and
Feasibility
Directorship held in
other Public Companies
(excluding foreign and
Section 25 companies)
• Tata Sons Limited
• The Tata Power
Company Limited
• Rallis India Limited
• Tata Autocomp Systems
Limited
• Tata Technologies
Limited
• Akzo Nobel India
Limited
• Castrol India Limited
• Advinus Therapeutics
Limited
• Metahelix Life Sciences
Limited
• The Bombay Dyeing &
Mfg Co. Limited
• Wadia Techno-
Engineering Services
Limited
• The Bombay Burmah
Trading Corp Limited
• Britannia Industries
Limited
• Tata Steel Limited
• Tata Motors Limited
• Go Airlines (India)
Limited
• ABB India Limited
• Ambuja Cements
Limited
• Britannia Industries
Limited
• Cummins India Limited
• Development Credit
Bank Limited
• HDFC Limited
• Go Airlines (India)
Limited
• Tata Motors Limited
• Tata Motor Finance
Limited
• Unichem Laboratories
Ltd
• Voltas Limited
• Batliboi Limited
• JM Financial Limited
• Manappuram Finance
Limited
• Merck Limited
• Rallis India Limited
• JM Financial Products
Limited
Membership of
Committees in other
public companies
(includes only Audit and
Stakeholders Relationship
Committee)
Audit Committee
• Akzo Nobel India
Limited
• Castrol India Limited
NIL Audit Committee
• ABB India Limited
• Ambuja Cements
Limited
• Britannia Industries
Limited
• Cummins India Limited
• Tata Motors Limited
• Unichem Laboratories
Limited
• Voltas Limited
Audit Committee
• Batliboi Limited
• JM Financial Limited
• Rallis India Limited
• Merck Limited
• JM Financial Products
Limited
• Manappuram Finance
Limited
Stakeholders Relationship
Committee
• Rallis India Limited
Shareholding of Directors 15,000 NIL NIL NIL
ANNEXURES
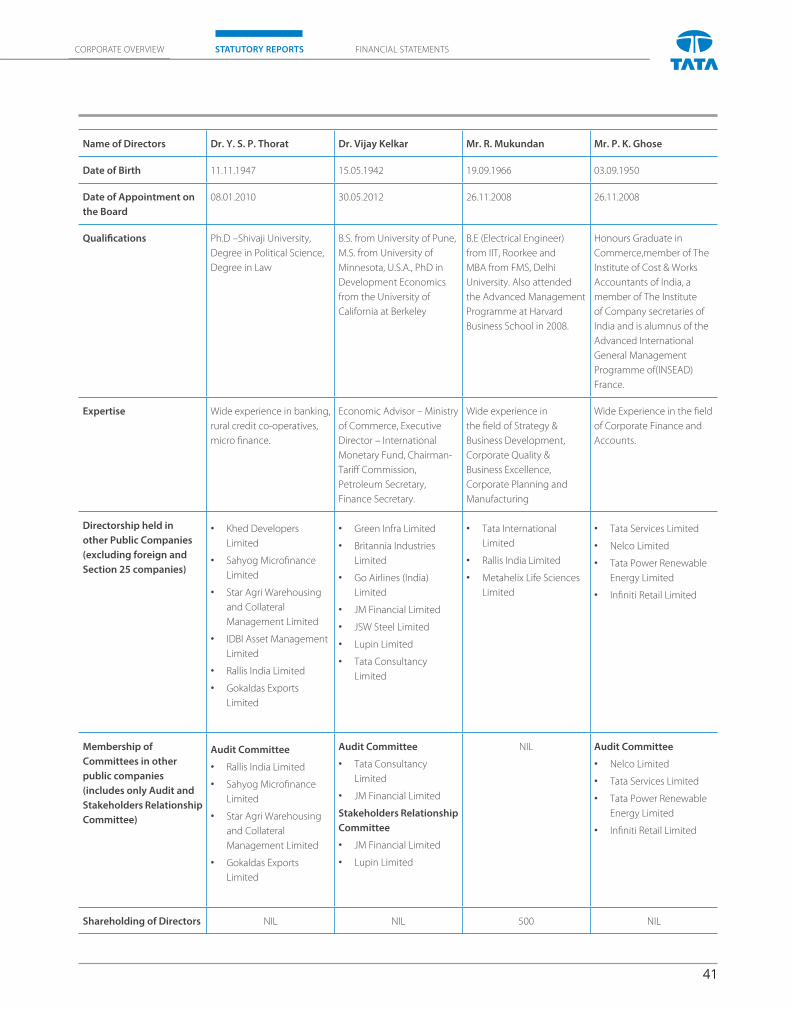
41
CORPORATE OVERVIEW FINANCIAL STATEMENTSSTATUTORY REPORTS
Name of Directors Dr. Y. S. P. Thorat Dr. Vijay Kelkar Mr. R. Mukundan Mr. P. K. Ghose
Date of Birth 11.11.1947 15.05.1942 19.09.1966 03.09.1950
Date of Appointment on
the Board
08.01.2010 30.05.2012 26.11.2008 26.11.2008
Qualifi cations Ph.D –Shivaji University,
Degree in Political Science,
Degree in Law
B.S. from University of Pune,
M.S. from University of
Minnesota, U.S.A., PhD in
Development Economics
from the University of
California at Berkeley
B.E (Electrical Engineer)
from IIT, Roorkee and
MBA from FMS, Delhi
University. Also attended
the Advanced Management
Programme at Harvard
Business School in 2008.
Honours Graduate in
Commerce,member of The
Institute of Cost & Works
Accountants of India, a
member of The Institute
of Company secretaries of
India and is alumnus of the
Advanced International
General Management
Programme of(INSEAD)
France.
Expertise Wide experience in banking,
rural credit co-operatives,
micro fi nance.
Economic Advisor – Ministry
of Commerce, Executive
Director – International
Monetary Fund, Chairman-
Tariff Commission,
Petroleum Secretary,
Finance Secretary.
Wide experience in
the fi eld of Strategy &
Business Development,
Corporate Quality &
Business Excellence,
Corporate Planning and
Manufacturing
Wide Experience in the fi eld
of Corporate Finance and
Accounts.
Directorship held in
other Public Companies
(excluding foreign and
Section 25 companies)
• Khed Developers
Limited
• Sahyog Microfi nance
Limited
• Star Agri Warehousing
and Collateral
Management Limited
• IDBI Asset Management
Limited
• Rallis India Limited
• Gokaldas Exports
Limited
• Green Infra Limited
• Britannia Industries
Limited
• Go Airlines (India)
Limited
• JM Financial Limited
• JSW Steel Limited
• Lupin Limited
• Tata Consultancy
Limited
• Tata International
Limited
• Rallis India Limited
• Metahelix Life Sciences
Limited
• Tata Services Limited
• Nelco Limited
• Tata Power Renewable
Energy Limited
• Infi niti Retail Limited
Membership of
Committees in other
public companies
(includes only Audit and
Stakeholders Relationship
Committee)
Audit Committee
• Rallis India Limited
• Sahyog Microfi nance
Limited
• Star Agri Warehousing
and Collateral
Management Limited
• Gokaldas Exports
Limited
Audit Committee
• Tata Consultancy
Limited
• JM Financial Limited
Stakeholders Relationship
Committee
• JM Financial Limited
• Lupin Limited
NIL Audit Committee
• Nelco Limited
• Tata Services Limited
• Tata Power Renewable
Energy Limited
• Infi niti Retail Limited
Shareholding of Directors NIL NIL 500 NIL
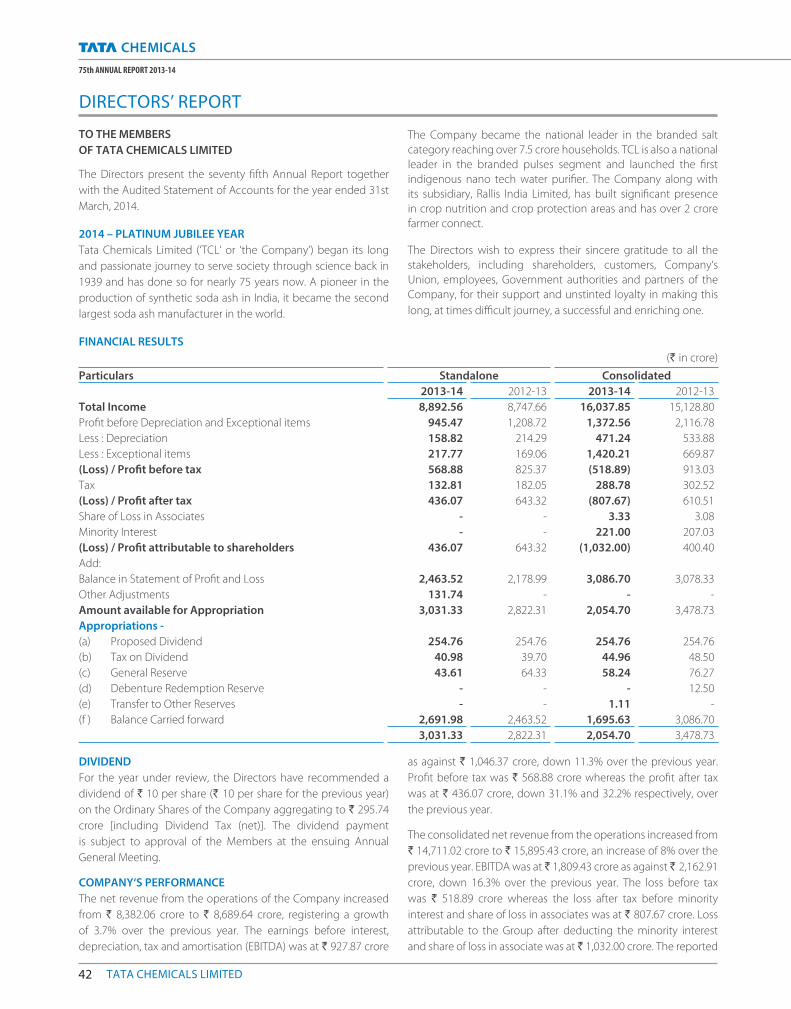
42 TATA CHEMICALS LIMITED
75th ANNUAL REPORT 2013-14
TO THE MEMBERS
OF TATA CHEMICALS LIMITED
The Directors present the seventy fi fth Annual Report together
with the Audited Statement of Accounts for the year ended 31st
March, 2014.
2014 – PLATINUM JUBILEE YEAR
Tata Chemicals Limited (‘TCL‘ or ‘the Company‘) began its long
and passionate journey to serve society through science back in
1939 and has done so for nearly 75 years now. A pioneer in the
production of synthetic soda ash in India, it became the second
largest soda ash manufacturer in the world.
DIRECTORS’ REPORT
The Company became the national leader in the branded salt
category reaching over 7.5 crore households. TCL is also a national
leader in the branded pulses segment and launched the fi rst
indigenous nano tech water purifi er. The Company along with
its subsidiary, Rallis India Limited, has built signifi cant presence
in crop nutrition and crop protection areas and has over 2 crore
farmer connect.
The Directors wish to express their sincere gratitude to all the
stakeholders, including shareholders, customers, Company‘s
Union, employees, Government authorities and partners of the
Company, for their support and unstinted loyalty in making this
long, at times diffi cult journey, a successful and enriching one.
FINANCIAL RESULTS
(` in crore)
Particulars Standalone Consolidated
2013-14 2012-13 2013-14 2012-13
Total Income 8,892.56 8,747.66 16,037.85 15,128.80
Profi t before Depreciation and Exceptional items 945.47 1,208.72 1,372.56 2,116.78
Less : Depreciation 158.82 214.29 471.24 533.88
Less : Exceptional items 217.77 169.06 1,420.21 669.87
(Loss) / Profi t before tax 568.88 825.37 (518.89) 913.03
Tax 132.81 182.05 288.78 302.52
(Loss) / Profi t after tax 436.07 643.32 (807.67) 610.51
Share of Loss in Associates - - 3.33 3.08
Minority Interest - - 221.00 207.03
(Loss) / Profi t attributable to shareholders 436.07 643.32 (1,032.00) 400.40
Add:
Balance in Statement of Profi t and Loss 2,463.52 2,178.99 3,086.70 3,078.33
Other Adjustments 131.74 - - -
Amount available for Appropriation 3,031.33 2,822.31 2,054.70 3,478.73
Appropriations -
(a) Proposed Dividend 254.76 254.76 254.76 254.76
(b) Tax on Dividend 40.98 39.70 44.96 48.50
(c) General Reserve 43.61 64.33 58.24 76.27
(d) Debenture Redemption Reserve - - - 12.50
(e) Transfer to Other Reserves - - 1.11 -
(f ) Balance Carried forward 2,691.98 2,463.52 1,695.63 3,086.70
3,031.33 2,822.31 2,054.70 3,478.73
DIVIDEND
For the year under review, the Directors have recommended a
dividend of ` 10 per share (` 10 per share for the previous year)
on the Ordinary Shares of the Company aggregating to ` 295.74
crore [including Dividend Tax (net)]. The dividend payment
is subject to approval of the Members at the ensuing Annual
General Meeting.
COMPANY‘S PERFORMANCE
The net revenue from the operations of the Company increased
from ` 8,382.06 crore to ` 8,689.64 crore, registering a growth
of 3.7% over the previous year. The earnings before interest,
depreciation, tax and amortisation (EBITDA) was at ` 927.87 crore
as against ` 1,046.37 crore, down 11.3% over the previous year.
Profi t before tax was ` 568.88 crore whereas the profi t after tax
was at ` 436.07 crore, down 31.1% and 32.2% respectively, over
the previous year.
The consolidated net revenue from the operations increased from
` 14,711.02 crore to ` 15,895.43 crore, an increase of 8% over the
previous year. EBITDA was at ` 1,809.43 crore as against ` 2,162.91
crore, down 16.3% over the previous year. The loss before tax
was ` 518.89 crore whereas the loss after tax before minority
interest and share of loss in associates was at ` 807.67 crore. Loss
attributable to the Group after deducting the minority interest
and share of loss in associate was at ` 1,032.00 crore. The reported
43
CORPORATE OVERVIEW FINANCIAL STATEMENTSSTATUTORY REPORTS
loss was largely on account of exceptional items aggregating to
` 1,420.21 crore (net) primarily towards impairment of certain
assets, restructuring cost, write down of goodwill and certain
investments and exchange loss.
The Company‘s operation is organised under four segments
i.e. (1) Inorganic Chemicals comprising soda ash, salt, sodium
bicarbonate, marine chemicals, caustic soda and cement;
(2) Fertilisers comprising fertilisers and other traded products;
(3) Other Agri-inputs including Rallis India Limited’s operations
and (4) Others - comprising water purifi er, nutritional solutions
and pulses. Performance of these businesses are as under:
1. INORGANIC CHEMICALS SEGMENT
1.1 India Operations:
The Company’s industrial chemicals operation is primarily
built around soda ash, sodium bicarbonate, cement
and allied traded products. On a macro-economic front,
Financial Year (FY) 2013-14 has been a story of two halves;
while the fi rst half was about high pipeline inventories and
volatile economic conditions, the second half was about
rebounding industrial sentiment.
The year also witnessed record volumes of imports
from China in the fi rst half. Pricing pressures prevailed
in the market, driven by tightening market conditions
and increased cost pressures. In line with the existing
competencies of customer-connect, quality products
and distribution reach, the Company has been actively
engaged in trading activities in the inorganic chemicals
space. The trading portfolio, consisting of new and allied
chemicals, will help the Company in exploring new
growth areas while catering to a larger portion of the
customer’s basket.
SODA ASH
FY 2013-14 saw a 2% de-growth in the domestic soda ash
market. On the back of very strong growth in the previous
year, pipeline inventories remained high through the fi rst
half of the year. By the end of the second half, stocks had
been utilised for most end user sectors.
From a manufacturing perspective, despite unfavourable
weather conditions, production was 798,897 tonnes
of soda ash at Mithapur. The total sales volume for the
year stood at 750,747 tonnes against 714,519 tonnes in
the previous year. As a continuation of the Company’s
soda ash strategy towards supporting customer specifi c
requirements and servicing market growth, sourcing of
material from the subsidiary companies increased for
the year.
The fi rst half witnessed high imports at lower price levels
in the market. Imports decreased in the second half due
to realignment of trade fl ows, anti-dumping duties and
shift in focus towards margins of Chinese producers. A
total of 560,000 tonnes imports were recorded for the year;
most of these were from Kenya, China, Bulgaria, Romania
and Turkey.
Apart from robust continuous improvement programmes
and customer partnership initiatives, focus was laid upon
leveraging IT for driving customer service levels. The
Company’s initiatives around sustainable supply chain
continued with increased transportation of bulk material.
Initiatives around manufacturing site and employee
engagement are showing positive results evidenced by
reduced attrition at the site.
SODIUM BICARBONATE
Post a very high market growth in FY 2012-13, FY 2013-14
registered a 2.1% market growth in sodium bicarbonate.
Sodium bicarbonate imports touched an all-time high of
29,000 tonnes against 20,000 tonnes in the previous year.
Despite this, the Company has been able to maintain more
than 50% market share on the back of higher production.
Sodium bicarbonate production for the year stood at
90,331 tonnes against 87,924 tonnes in the previous
year. The overall sales volume for sodium bicarbonate
was 86,570 tonnes for the year. Imports for the year were
skewed with very high import volumes in the fi rst half. A
strong dollar and increased Chinese domestic demand
substantially decreased imports in the second half. Of the
total imports, China accounted for 93% volumes.
During the year, the Company continued to invest in
the branded off erings of sodium bicarbonate; branded
volumes now account for 23% of the bicarbonate portfolio.
This is in line with the Company’s strategy to off er value
added branded variants as the domestic market matures
and grows over a period of time and is consistent with its
global portfolio for this product.
CEMENT
The domestic cement market faced a slump in demand
during the year. Sentiment remained very weak in the
market with sustained price pressures for a major part
of the year. Consolidation in the industry and extended
discounts from major players also aff ected the business.
The Gujarat cement market declined by 2.8% to 534,000
tonnes during the year.
Production of 460,275 tonnes Ordinary Portland Cement
(OPC) and 79,574 tonnes masonry cement was achieved
during the year. The sales volume of OPC and masonry
cement were at 454,280 tonnes and 79,513 tonnes
respectively during the year. Considering the volumes of
44 TATA CHEMICALS LIMITED
75th ANNUAL REPORT 2013-14
cement, evaluations are currently underway to develop
niche grades of cement and allied downstream off erings.
SALT AND RELATED PRODUCTS
Salt production of 805,637 tonnes was achieved at
Mithapur during the year as against the previous
year production of 805,388 tonnes. Overall, branded
salt sales marginally grew from 935,579 tonnes in FY
2012-13 to 939,981 tonnes in FY 2013-14. Sales of Tata
Salt grew by 4% in volume from 728,829 tonnes in
FY 2012-13 to 754,955 tonnes in FY 2013-14. Tata Salt
continues to be the largest distributed brand with a reach
of 14.5 lakh retail outlets across India.
Sales of I-Shakti salt in FY 2013-14 was 162,930 tonnes.
I-Shakti salt continues to meet the iodisation movement,
complimenting Tata Salt. The Company’s market
share of its salt portfolio has increased to 67.9% in the
National Branded Salt segment, up from 66.8% in FY
2012-13. Sales of Tata Salt Lite grew by 11% in volume
from 10,883 tonnes in FY 2012-13 to 12,111 tonnes in
FY 2013-14.
I-Shakti cooking soda sales showed an encouraging
growth of 73% with sales of 3,302 tonnes during the year
as compared to 1,908 tonnes in the previous year.
The business continues to work towards new product
introduction through salt variants and development of
other categories.
1.2 Overseas Operations
1.2.1 Tata Chemicals North America Inc. (TCNA)
Soda ash production at TCNA during the year were
23,607,000 tonnes as against the previous year volume of
23,316,000 tonnes.
Sales volume for the year increased to 23,899,000 tonnes as
against 23,431,000 tonnes in the previous year showing a
positive volume of 468,000 tonnes.
TCNA gross revenues (including freight costs) were
marginally down at USD 471.87 million (` 2,853.55 crore)
as against USD 478.73 million (` 2,604.64 crore) in the
previous year. The average unit selling price was down,
driven primarily by decreased exports prices.
EBIDTA, profi t before tax and profi t after tax were at USD
109.48 million (` 662.07 crore), USD 69.06 million (` 417.65
crore) and USD 37.87 million (` 229.01 crore) respectively.
The results were impacted due to increase in cost of goods
sold which primarily consists of labour, energy, materials,
royalties and depreciation, increased by USD 3.6 million
(` 21.77 crore) over the previous year. Interest expense
and fi nancing fees were USD 8.13 million (` 49.16 crore)
higher than last year driven by refi nancing the existing
USD 375 million (` 2,246.81 crore) Senior syndicated
facility, replacing with a USD 340 million ( ` 2,037.11 crore)
credit facility.
1.2.2 Tata Chemicals Europe (TCE)
During the year, TCE ceased operation of its soda ash
facilities at Winnington while investing in increased sodium
bicarbonate capacity and quality improvements at the
same to feed the growing high value sodium bicarbonate
sectors. The new sodium bicarbonate plant is now on line.
The UK market declined in size somewhat post-recession,
but volumes rebounded during the course of the year
from lows in the fi rst quarter of 2013. Turnover for the year
was at £142.6 million (` 1,372.35 crore), 3% lower than in
FY 2012-13. TCE continues to supply its soda ash customer
base from its operation at Lostock and through a dedicated
import facility in the UK.
Meanwhile, TCE‘s salt business saw a challenging
environment, but nevertheless continued with strong
market share throughout the period. Turnover for the year
was at £42.4 million (` 408.05 crore). TCE also acquired the
Combined Heat and Power (CHP) plant at Winnington
from EON, which is a state-of-the-art facility supplying
electricity and steam to the Lostock operations. The power
plant operation continues to be operated and maintained
by EON under contract to TCE. Energy prices during winter
FY 2013-14 made for diffi cult economics with a mild winter
and high wind generation making gas fi red generation
marginal at best.
Reconfi guration of the CHP plant will optimise its heat
and power effi ciency during 2015 and in the meantime
regulatory changes and lower gas prices are expected to
benefi t TCE in FY 2014-15 and beyond.
During FY 2014-15, the fi nal stages of the
restructuring programme will be completed in TCE
and growth in the high value sodium bicarbonate
business is expected to increase signifi cantly from
FY 2013-14 levels.
Total turnover of TCE for the year is £191.4 million (` 1,842.45
crore), EBITDA stood at loss of £1.77 million (` 17 crore).
TCE posted a net loss after tax of £36.99 million (` 356.01
crore) for the year after charging off £25.18 million
(` 242.28 crore) towards exceptional items pertaining to
restructuring of Winnington Plant.
1.2.3 Tata Chemicals Magadi Limited (TCML)
Turnover of TCML for the year ended 31st March, 2014
was USD 105.18 million (` 636.05 crore) as compared
DIRECTORS’ REPORT
45
CORPORATE OVERVIEW FINANCIAL STATEMENTSSTATUTORY REPORTS
to the previous year’s fi gure of USD 105.73 million
(` 575.24 crore). TCML incurred the loss of USD 77.66
million (` 469.63 crore) during the year as against the
loss of USD 22.29 million (` 121.27 crore) during the
previous year.
The results were impacted due to missed production
targets caused by worsening plant effi ciencies, signifi cant
decrease in prices during the year and increased costs of
sales. The cost of sales increased by 68.8% to USD 116.05
million (` 701.78 crore) during the year from USD 68.73
million (` 373.94 crore) in the previous year primarily due
to rising energy costs.
High energy costs ultimately led to a downward revision
of cash fl ow projections for the Premium Ash (PAM)
plant at Magadi, thus, resulting in a provision towards
impairment of assets of USD 50.69 million (` 304.42 crore)
which also contributed to the loss for the year ended
31st March, 2014.
1.2.4 Tata Chemicals International Pte Limited (TCIPL)
TCIPL commenced trading in April, 2013 and recorded sales
of USD 31.4 million (` 189.82 crore) through the purchase
and sale of 135,312 tonnes of soda ash and heavy fuel oil
between a mixture of related and third party customers
and suppliers. In addition to trading goods, TCIPL is the
International Headquarters for Tata Chemicals and holds
the investments in the UK, Kenya and USA and provides
strategy and business support to its subsidiaries, including
raising of fi nance.
2. FERTILISER SEGMENT
2.1 CROP NUTRITION AND AGRI BUSINESS
Crop Nutrition and Agri business comprises nitrogenous
fertilisers i.e. urea manufactured at Babrala plant and
phosphatic fertilisers like Di-ammonium Phosphate (DAP),
NPK and Single Super Phosphate (SSP) manufactured
at the Haldia plant. In addition to these, the Company
imports and sells Muriate of Potash (MOP), DAP and
supplies other crop nutrition products like Specialty
Fertilisers and organic materials. It also includes a
Customised Fertiliser plant at Babrala, the fi rst of its kind
in India.
Urea
During the year, the Babrala plant achieved a total urea
production of 1,137,504 tonnes, higher by 10,083 tonnes
compared to the previous year. The specifi c energy
consumption level of plant improved during the year
to 5.203 GCal / tonne as against 5.218 GCal/tonne, aided by
lesser number of interruptions.
Complex Fertilisers (DAP / NPK / SSP)
During the year, the Haldia plant achieved a combined
production of 727,114 tonnes of complex fertilisers as
against the previous year’s production of 661,149 tonnes.
The sales of complex fertilisers were 718,182 tonnes as
against 657,123 tonnes in the previous year.
Imported Products (DAP / MOP)
Given the heavy inventory overhang with the trade of
phosphatic and potassic fertilisers, the DAP imports into
India fell by 43% while complex imports were low and fell
by 11%. The collapse of the Russian and Belarusian entity
for potash triggered a serious price correction in MOP,
although the impact of the same for India will only be felt in
FY 2014-15. While MOP imports to India were higher by 31%,
the sales of MOP were similar to last year, which indicates
that most of the additional imports went into manufacture
of complex fertilisers. The Company sold imported DAP of
189,194 tonnes as against 324,313 tonnes in the previous
year. MOP sales were at 143,715 tonnes against the previous
year sales of 38,356 tonnes.
Specialty Crop Nutrients
The Company continued to focus on the non-subsidised
portfolio and posted a signifi cant revenue growth over
the previous year by expanding into new geographies
of the Western and the Southern parts of India and by
introducing new products.
Customised Fertilisers
The Company had commissioned the maiden
customised fertiliser plant in the country in FY 2011-
12. These are advanced fertilisers, customised for
specifi c crop and region. The Company manufactures
4 grades of fertilisers suitable for paddy, wheat, potato
and sugarcane.
The sales of customised fertilisers during the year were
16,874 tonnes as against 18,701 tonnes in the previous
year. The Company believes that, this being a new concept
would be promoted in a phased manner and will slowly
gain acceptance.
2.2 TATA KISAN SANSAR
Tata Kisan Sansar, a dedicated network for distribution
of agri inputs, is well established in the Northern and the
Eastern geographies. This concept provides a trustworthy
store off ering “One stop agri input and services shop” to
farmers. The dealer and franchisee network deal with
products such as Primary Nutrients (urea, DAP, MOP,
NPK etc.) and Specialty Fertilisers (zinc sulphate, boron,
micronutrients, calcium nitrate, organics, water soluble
fertilisers, etc.), Seeds (fi eld crops, vegetable crops) and
46 TATA CHEMICALS LIMITED
75th ANNUAL REPORT 2013-14
the entire range of pesticides. Along with the above
mentioned inputs, the Company is providing products
of other reputed companies through this retail network
which help farmers to get all the nutrients and inputs under
one roof.
3. OTHER AGRI INPUTS
3.1 The Company has posted a signifi cant revenue growth
over the previous year. The Company has expanded
the network in new geographies in the Western and
the Southern parts of India with increased focus on its
own brands.
3.2 Rallis India Limited (Rallis)
Rallis achieved the revenue of ` 1,746.56 crore for the
year as compared to ` 1,458.18 crore of the previous
year, registering a growth of 19.78%. Profi t before tax
on a consolidated basis was ` 214.40 crore during the
year as compared to ` 172.29 crore in the previous
year, an increase of 24.44% over the previous year. The
Company earned a net profi t of ` 151.87 crore, as against
a net profi t of ` 119.02 crore in the previous year on a
consolidated basis.
Rallis has registered an overall double digit growth
during the FY 2013-14. This growth is driven by an
all-round performance and, in particular, rise in sales
of megabrands.
The branded Domestic Formulation Business registered
a good growth during the year over the previous year.
The International Business Division showed a signifi cant
growth over FY 2012-13 and continues to be above
30% of the overall revenue for the past two years. Rallis’
eff orts in building a robust Non-Pesticide Portfolio
(NPP) of businesses, to cater to the changing needs
of the farmers and agriculture gained momentum
during the year. The share of NPP sales was 31% of the
total revenue.
The acquisition of a majority stake in Metahelix Life
Sciences Limited (Metahelix), a research-led seeds
company in December 2010, has started yielding results.
In three years, the revenue of Metahelix has grown
signifi cantly to reach ` 180 crore during FY 2013-14, one
of the highest growth rates among seed companies in the
country. Metahelix plans to introduce new hybrids during
FY 2014-15, including Bt cotton hybrids, which
will help in sustainable and profi table growth in
the future.
During the year, Rallis has acquired additional stake in equity
shares of Zero Waste Agro Organics Limited (ZWAOL),
taking its shareholding in ZWAOL to 51.02%. ZWAOL is a
company manufacturing scientifi cally prepared organic
compost, a soil conditioner. ZWAOL has recorded a four-
fold growth in its sales volumes, as its high quality organic
compost “GeoGreen” gained market acceptance.
4. OTHERS
4.1 Water Purifi er
During the year, Tata Swach water purifi ers reported value
growth of 86% and volume growth of 55%. During the
year, the Company introduced multiple new products in
the storage offl ine category such as Tata Swach Cristella
Plus with sturdy body, new spaceship bulb with enhanced
purifi cation media and the Tata Swach Silver Boost with
higher storage capacity and cyst removal mechanism
(MF membrane).
The year also marked the entry of Tata Swach into high-
end “Online - RO and UV based Purifi ers” that use electricity
and running water. Two variants were pilot launched - Tata
Swach Silver RO Platina – Multistage RO purifi cation and
Tata Swach Silver RO Ultima - multistage RO+UV purifi cation
which are able to handle all types of impurities and
contamination including high TDS, heavy metals and
harmful minerals besides pathogens such as bacteria, virus
and cyst thus ensuring a “Total Purifi cation Solution” from
the Tata Swach umbrella. Both variants are being rolled out
nationally in top 20 cities in FY 2014-15.
4.2 Pulses
In FY 2013-14, unpolished dals and besan revenue (sold
under Tata I-Shakti brand) grew by 110%. During the
year, the product availability grew from 18,000 outlets
to over 45,000 outlets in the key focus markets. The
Company continued to focus on brand building activities
and consumer awareness campaigns for promoting
Tata I-Shakti unpolished dals. The ‘Dal on Call’ service
of the Company reached to 3 cities (Mumbai, Delhi
and Bangalore) and delivered to over 14,500 customers
and has over 50% repeat customers ordering through
the service.
4.3 Nutritional Solutions
The objective of TCL’s fl edgling Nutritional Solutions
business is to off er ingredients and formulations that
can be consumed as part of a daily diet to improve
gut health. To this end, the fi rst product, Fructo-
oligosaccharide (FOS) is a short chain, soluble dietary fi bre
that is grouped with a set of products, collectively known
as prebiotics.
The manufacturing process for FOS, using cane sugar
as the raw material and based on principles of green
chemistry was developed at TCL’s Innovation Centre and
is undergoing scale-up and pre-commercial production
trials at the Company’s green-fi eld manufacturing plant at
DIRECTORS’ REPORT
47
CORPORATE OVERVIEW FINANCIAL STATEMENTSSTATUTORY REPORTS
Sriperumbudur, near Chennai. The trials are being carried
out concurrently with the establishment of a downstream
drier system to produce FOS in both solid and liquid forms.
Over fi fty potential customers have been sent samples for
approval; product studies to obtain regulatory approvals
to allow export of FOS are also underway. Trial production
will commence in the fi rst quarter of FY 2014-15 and
production will be scaled up in a phased manner from 300
MTPA to 1000 MTPA.
5. JOINT VENTURES AND ASSOCIATES
5.1 Indo Maroc Phosphore S.A. (IMACID)
IMACID is a joint-venture company established in Morocco,
North Africa and is engaged in the manufacture of
phosphoric acid. In IMACID, the Company has a 33.33%
shareholding, together with two other equal partners,
Chambal Fertilisers and Chemicals Limited and Offi ce
Cherifi en Des Phosphates (OCP), Morocco. The Company
procures phosphoric acid through supply from IMACID for
manufacture of granulated DAP and NPK fertilisers at its
Haldia facility.
During the year, the cumulative production of phosphoric
acid in this period was 353,626 tonnes as against 326,501
tonnes in the previous year.
5.2 JOil (Singapore) Pte. Limited (JOil)
JOil, a Jatropha plant science company, is based in
Singapore in which the Company holds a 33.78% stake.
JOil has been set up by the Temasek Life Sciences
Laboratory Limited (TLL), Temasek Life Sciences Ventures
Pte. Limited (a subsidiary of Temasek Holdings) and other
investors in Singapore.
JOil has progressed well on Jatropha plant science. It has
invested in pure research and enabling technologies,
developing GM materials and in developing industrially
scaled propagation techniques. JOil has conducted
successful fi eld trials in India and South East Asia.
JOil achieved an income of S$ 1.58 million (` 7.59 crore)
for the FY 2013-14 as compared to S$ 1.15 million (` 5.02
crore) in the previous year.
5.3 EPM Mining Ventures Inc. (EPM)
The Company, through its subsidiaries, owns a 25.70%
stake in EPM, a company listed on the Toronto Stock
Exchange, Canada.
EPM, together with its subsidiaries, operates an exploration
stage entity focused on the construction and operation
of a major Sulphate of Potash (“SOP”) project on Sevier
Lake Playa in South Western Utah, USA. EPM is engaged
in exploration, drilling, engineering and permitting
activities on its Sevier Playa Project with the objective
of providing a feasibility study and reserve estimates in
accordance with the Canadian standards of disclosure
for mineral projects. EPM completed a preliminary
feasibility study on the Sevier Playa Project in November
2013; and is at present engaged in the project’s feasibility
study phase.
5.4 Natronx Technologies LLC (Natronx)
Natronx, which is an equal stake (33.33%) joint venture
between Tata Chemicals (Soda Ash) Partners, U.S.A., FMC
Corporation, U.S.A. and Church & Dwight Co. Inc., U.S.A., is in
the fi nal stages of commissioning a 450,000 tonne per year
ground trona operation which will produce a very small
particle size, high assay sodium based sorbent that will be
primarily used by coal fi red electrical utilities to reduce acid
gases in their air emissions. Since the original formation
of the business there have been a number of challenges
to government agencies including the US Environmental
Protection Agency regarding their ability to set certain
air emission regulations, including the Cross State Air
Pollution Rule, which are key to the demand proposition for
Natronx. In early 2014, these objections were overturned
so demand for dry sorbent injection should now begin
to grow over the next 18-24 months and Natronx will
be bringing the plant into production in order to meet
demand. These delays have, thus, negatively impacted
Natronx; sales demand and previously forecast business
performance.
REVIEW OF IMPAIRMENT RISKS
Under the Indian Accounting Standards, a company is
required to undertake impairment review of its assets
and investments based on certain triggers relating to the
business or operating environment.
Based on the impairment review, the Company has made
a provision in the standalone fi nancial statements of
` 59.30 crore towards impairment in respect of certain
fertiliser and bio-fuel assets. Further, the Company has
recognised non-cash write down of goodwill and other
assets of ` 924.38 crore in the consolidated fi nancial
statements. The impairment of assets represents the non-
cash write down of goodwill of ` 619.77 crore and assets of
` 304.61 crore primarily relating to Tata Chemicals Magadi
operations. The impairment is mainly on account of high
energy costs at the plant at Kenya which has ultimately led
to downward revision of cash fl ow projections of Kenya
business. The above provisions are non-cash charges
and do not aff ect any of the fi nancial covenants of Tata
Chemicals Group.
48 TATA CHEMICALS LIMITED
75th ANNUAL REPORT 2013-14
AMALGAMATION OF HOMEFIELD INTERNATIONAL PVT. LTD,
(MAURITIUS) WITH THE COMPANY
During the year, the Scheme of Amalgamation of Homefi eld
International Pvt. Ltd. (Mauritius) a wholly owned subsidiary, with
the Company (‘the Scheme’) was fi led before the High Court of
Judicature at Bombay for its sanction pursuant to Section 391-394
of the Companies Act, 1956.
The Hon’ble High Court of Judicature at Bombay sanctioned
the Scheme vide its Order dated 7th March, 2014. The Scheme
became eff ective on 29th April, 2014 with the Appointed Date
of the Scheme as 1st April, 2013. No shares of the Company
were issued and allotted in lieu or exchange of the equity
shares of Homefi eld International Pvt. Ltd. (Mauritius) under
the Scheme.
Accordingly, the standalone balance sheet for the fi nancial year
ended 31st March, 2014 of the Company includes fi nancial results
of Homefi eld International Pvt. Ltd. (Mauritius) from 1st April, 2013.
FINANCE
The outstanding balance of External Commercial Borrowing (ECB)
of USD 285 million, out of the ECB of USD 475 million raised in
March 2008, was fully repaid during the year. Out of the total
repayment of USD 285 million, an amount of USD 190 million
was pre-paid and refi nanced by raising ECB of USD 190 million.
In addition to this, the Company had repaid 11.80% secured Non-
Convertible Debentures (NCDs) of ` 240 crore on the due date.
The pace of subsidy disbursements for fertilisers witnessed a
signifi cant slow-down from August 2013. This resulted in high
levels of working capital through the second half of the year. The
outstanding balance of subsidy receivables as on 31st March,
2014 is ` 1,794.89 crore as against an amount of ` 1,752.63 crore
outstanding as on 31st March, 2013.
The increased level of working capital has been funded through
working capital facilities including buyers’ credit. The outstanding
balance of buyers’ credit as on 31st March, 2014 was USD 160.89
million (` 963.99 crore). Further, pursuant to the reintroduction
of Special Banking Arrangement (SBA) made by The Department
of Fertilizers, Government of India, twice during the year, the
Company had availed loans against subsidy receivables for an
aggregate amount of ` 465.71 crore from the State Bank of India
led consortium. Out of this, ` 139.61 crore was liquidated during
the month of February 2014 in accordance with the SBA scheme.
The brought forward outstanding balance of loan against subsidy
receivables of ` 179.63 crore, availed during March 2013, was also
liquidated during the month of April 2013 in accordance with the
SBA scheme.
The year witnessed elevated levels of interest rates on the back
of high infl ationary pressure and volatile macro-economic
scenario. Amid volatility in fi nancial and capital markets, the
Company was able to contain the interest costs as a result of
better cash management and repayment of high cost NCDs. The
reduction in cost of borrowing resulted in savings in interest cost
of ` 17.93 crore.
During the year, Rallis India Limited, a subsidiary of the Company
and IMACID, a joint venture, have paid dividends of ` 22.39 crore
and ` 29.47 crore respectively to the Company.
During the year, the Company’s overseas subsidiary Tata
Chemicals North America Inc. (TCNA) had refi nanced debt facilities
to the tune of USD 340 million. Further, the Company’s overseas
subsidiary Tata Chemicals Europe Holdings Limited (TCEHL) had
raised term and multicurrency revolving facilities (bridge facilities)
aggregating to GBP 140 million to refi nance the existing facilities.
In addition to this, the Company’s overseas subsidiary Homefi eld
Pvt UK Ltd had raised a term loan of USD 28 million to buy back
6.44% United States Private Placement Notes of USD 25 million
issued in 2007.
INFORMATION TECHNOLOGY
The Company’s Information Technology (IT) infrastructure is
continuously reviewed and renewed in line with the development
in technology and its requirements. During the year, the Company
upgraded its servers for running ERP platform. The Company has
also implemented common ERP programme across all its wholly
owned operating subsidiaries.
AWARDS AND RECOGNITIONS
The Company/ its subsidiaries during the year has won many
awards some of which are listed below:
• Eco Corporate of the Year Award at the prestigious Natural
Capital Awards 2013.
• I.C.C. award for Water Resource Management in Chemical
Industry.
• Two awards at the 53rd ABCI awards.
• Council for Fair Business Practices Awards 2013.
• Tata Chemicals Magadi wins the Millennium Development
Goals Award.
• Babrala plant wins the prestigious CII - Effi cient Energy
Management Award.
• TCL Babrala plant wins the prestigious NSCI Suraksha Puraskar.
• Okhai store at Ahmedabad was awarded ‘Alpha One Retail
Renaissance Award for Best Store.
• TCL Mithapur plant wins the FICCI Chemicals and
Petrochemical Award.
• Three awards at FAI Golden Jubilee Awards.
• Tata Chemicals Magadi received a prestigious HR award
from Institute of Human Resource Management.
• Most Admired Knowledge Enterprise (MAKE) Award 2013.
DIRECTORS’ REPORT
49
CORPORATE OVERVIEW FINANCIAL STATEMENTSSTATUTORY REPORTS
FIXED DEPOSITS
The Company has not accepted any public deposits and as such,
no amount on account of principal or interest on public deposits
was outstanding as on the date of the balance sheet.
CONSOLIDATED FINANCIAL STATEMENTS
The Consolidated Financial Statements pursuant to Clause 32 of
the Listing Agreement entered into with the Stock Exchanges
and prepared in accordance with the Accounting Standards is
attached herewith.
SUBSIDIARY COMPANIES
The Ministry of Corporate Aff airs, the Government of India, has
vide Circular No. 2/2011 dated 8th February, 2011 granted
general exemption subject to fulfi lment of certain conditions
from attaching the Balance Sheet of the subsidiaries to the
Balance Sheet of the Company without making an application
for exemption. Accordingly, the Balance Sheet, the Statement of
Profi t and Loss and other documents of the subsidiary companies
are not being attached with the Balance Sheet of the Company.
Financial information of the subsidiary companies is disclosed in
the Annual Report. The Annual Accounts of these subsidiaries and
related detailed information will be made available to any Member
of the Company/ its subsidiaries seeking such information at any
point of time and are also available for inspection by any Member
of the Company/ its subsidiaries at the Registered Offi ce of the
Company. The Annual Accounts of the said subsidiaries will also
be available for inspection, as above, at the Head Offi ces of the
respective subsidiary companies.
As on 31st March, 2014, the Company had 43 (direct and indirect)
subsidiaries (4 in India and 39 overseas).
During the year, following changes have taken place in the
subsidiary companies:
• Rallis acquired and subscribed to equity shares representing
51.02% of the paid-up equity share capital of Zero Waste
Agro Organics Limited (ZWAOL).
• Dhaanya Seeds Limited merged with Metahelix Life
Sciences Limited eff ective 6th March, 2014.
Subsequent to the year end, Homefi eld International Pvt. Ltd.
(Mauritius) merged with the Company with the eff ective date as
29th April, 2014.
DIRECTORS
Dr. Yoginder K. Alagh retired as a Director of the Company
on 14th February, 2014 in line with the retirement policy for
Directors. The Board placed on record its sincere appreciation for
his invaluable guidance and contribution during his tenure as the
Director of the Company.
Pursuant to the provisions of Clause 49 of the Listing Agreement
entered into with the Stock Exchanges, the Company had
appointed Mr. Nusli N. Wadia, Mr. Nasser Munjee, Mr. E. A.
Kshirsagar, Dr. Y. S. P. Thorat and Dr. Vijay Kelkar as Independent
Directors of the Company.
As per Section 149 (4) of the Companies Act, 2013 (the Act), which
came into eff ect from 1st April, 2014, every listed public company
is required to have at least 1/3rd of the total number of directors as
Independent Directors. The Company, in terms of the provisions
of Clause 49 of the Listing Agreement entered into with the Stock
Exchanges, already has one half of its Directors in the category of
Independent Directors. The Board at its meeting held on 30th May,
2014, appointed the existing Independent Directors under Clause
49 viz. Mr. Nusli N Wadia, Mr. Nasser Munjee, Mr. E. A. Kshirsagar,
Dr. Y. S. P. Thorat and Dr. Vijay Kelkar as Independent Directors of
the Company for the tenure of appointment as mentioned in the
Notice of the forthcoming Annual General Meeting pursuant to
the provisions of the Act.
In the opinion of the Board, they fulfi ll the conditions specifi ed
in the Act and the Rules made thereunder for appointment as
Independent Directors and are independent of the management.
Mr. R. Gopalakrishnan, Director of the Company, is due for
retirement by rotation and is eligible for re-appointment.
Mr. R. Mukundan was re-appointed as Managing Director of the
Company with eff ect from 26th November, 2013 for a period
of 5 years upto 25th November, 2018, subject to the approval
of Members. Mr. P. K. Ghose was re-appointed as an Executive
Director & CFO of the Company with eff ect from 26th November,
2013 for a period upto 30th September, 2015 (date of retirement),
subject to the approval of Members. The Board commends the
re-appointment of Mr. R. Mukundan as the Managing Director and
Mr. P. K. Ghose as the Executive Director & CFO of the Company
to the Members of the Company.
The Company has received declarations from all the Independent
Directors of the Company confi rming that they meet with the
criteria of independence as prescribed both under sub-section (6)
of Section 149 of the Companies Act, 2013 and under Clause 49
of the Listing Agreement with the Stock Exchanges. Members are
requested to refer to the Notice and Explanatory Statement for the
experience, qualifi cation and tenure of the Independent Directors.
MANAGEMENT DISCUSSION AND ANALYSIS AND
CORPORATE GOVERNANCE REPORTS
Pursuant to Clause 49 of the Listing Agreement, the Management
Discussion and Analysis and the Corporate Governance Reports
together with the Auditors’ Certifi cate on compliance with the
conditions of Corporate Governance as laid down form part of
the Annual Report.
DIRECTORS’ RESPONSIBILITY STATEMENT
Pursuant to Section 217(2AA) of the Act, the Directors, based on
the representations received from the Operating Management,
confi rm that:
i) in the preparation of the annual accounts, the applicable
accounting standards have been followed and that there
are no material departures;
50 TATA CHEMICALS LIMITED
75th ANNUAL REPORT 2013-14
ii) they have in the selection of the accounting policies,
consulted the Statutory Auditors and have applied them
consistently and made judgments and estimates that are
reasonable and prudent so as to give a true and fair view
of the state of aff airs of the Company at the end of the
fi nancial year viz., 31st March, 2014 and of the profi t of the
Company for the year ended on that date;
iii) they have taken proper and suffi cient care, to the best
of their knowledge and ability, for the maintenance of
adequate accounting records in accordance with the
provisions of the Companies Act, 1956, for safeguarding the
assets of the Company and for preventing and detecting
fraud and other irregularities;
iv) they have prepared the annual accounts on a going
concern basis.
CONSERVATION OF ENERGY, TECHNOLOGY ABSORPTION,
FOREIGN EXCHANGE EARNINGS AND OUTGO
The information required under Section 217(1)(e) of the
Companies Act, 1956 read with the Companies (Disclosure of
Particulars in the Report of the Board of Directors) Rules, 1988 is
annexed hereto as Annexure ‘A’ and forms part of this Report.
PARTICULARS OF EMPLOYEES
In terms of the provisions of Section 217(2A) of the Companies
Act, 1956 read with the Companies (Particulars of Employees)
Rules,1975 as amended, the names and other particulars of the
employees are set out in the Annexure to the Directors’ Report.
However, having regard to the provisions of Section 219(1)
(b)(iv) of the Act, the Annual Report excluding the aforesaid
information is being sent to all the Members of the Company
and others entitled thereto. Any member interested in obtaining
such particulars may write to the General Counsel & Company
Secretary at the Registered Offi ce of the Company.
AUDITORS
M/s. Deloitte Haskins & Sells LLP, Chartered Accountants, (DHS)
who are the statutory auditors of the Company, hold offi ce till
the conclusion of the ensuing Annual General Meeting (AGM)
and are eligible for re-appointment. Pursuant to the provisions
of Section 139 of the Companies Act, 2013 and the Rules framed
thereunder, it is proposed to appoint DHS as the statutory auditors
of the Company from the conclusion of forthcoming AGM till the
conclusion of the 78th AGM to be held in the year 2017, subject
to ratifi cation of their appointment at every AGM.
During the year, the Company had received intimation from DHS
stating that Deloitte Haskins & Sells had been converted into a
Limited Liability Partnership (LLP) under the provisions of the
Limited Liability Partnership with eff ect from 20th November,
2013. In terms of General Circular No.9/2013 dated 30th April,
2013 issued by the Ministry of Corporate Aff airs, if a fi rm of
Chartered Accountants, being an Auditor of the Company under
the Companies Act, 1956, is converted into an LLP, then such LLP
would be deemed to be the Auditor of the Company. The Board
has taken due note of this change. Accordingly, the audit of the
Company for FY 2013-14 was conducted by DHS.
The Company has received letter from the statutory auditors to
the eff ect that their re-appointment, if made, would be within the
prescribed limits under Section 141(3)(g) of the Companies Act,
2013 and that they are not disqualifi ed for appointment.
COST AUDIT
By General Circular No. 8/2012 dated 10th May, 2012 issued by
the Ministry of Corporate Aff airs, Government of India, it has been
made mandatory for companies to fi le Cost Audit Reports from
the FY 2011-12 onwards in XBRL (Extensible Business Reporting
Language) format. The due date for fi ling of the Cost Audit
Reports for FY 2012-13 was 30th September, 2013. The Company
has fi led the Cost Audit Reports with the Ministry of Corporate
Aff airs on 27th September, 2013.
On behalf of the Board of Directors
CYRUS P. MISTRY
Chairman
Mumbai, 30th May, 2014
DIRECTORS’ REPORT
51
CORPORATE OVERVIEW FINANCIAL STATEMENTSSTATUTORY REPORTS
ANNEXURE TO THE DIRECTORS’ REPORT
Annexure ‘A’
(UNDER SECTION 217(1)(e) OF THE COMPANIES ACT, 1956)
Disclosures
A. CONSERVATION OF ENERGY
(a) Energy Conservation measures taken:
• Usage of tailing waste in kiln raw mix to reduce specifi c heat consumption and to increase waste solids utilisation.
• Sea water stopped in Effl uent Solids Filtration (ESF) process by recycling wash water.
• Use of grinding aid in cement mill to improve cement throughput resulting in reduction in specifi c power
consumption.
• Installation of Flash vessel and its bypass system for heat recovery.
• Replacement of elements of electrolyser.
• Replacement of Lime kiln top assembly.
• Energy Effi cient IE 3 based premium effi ciency motor installation as standard practice in all projects.
• Induction lamp (40 Watt) installation at High Pressure Boiler transformers in place of 125W HPMV lamp.
• Usage of astronomical timer in twilighting circuit.
• Variable frequency drive installed in ammonia scrubber fan in DAP1.
• Modifi cation of Lighting circuit in phosphoric acid plant.
• TG overhauled to utilise unused Steam for generating electricity.
• Installation of LED Lights.
• Installation of casale trays in urea reactor to improve conversion effi ciency and to reduce steam consumption.
• Installation of solar geysers in new houses of township to reduce electricity consumption and utilise renewable
energy source.
• Cleaning ammonia plant primary reformer waste heat recovery coils, Fire heater exit coils and GV section air coolers
to improve heat transfer eff ectiveness.
• Replacement of low temperature shift catalyst to improve overall performance of ammonia plant.
(b) Additional investments and proposals, if any, being implemented for reduction of energy consumption:
• New capital projects being done with energy effi cient motors, energy effi cient lighting, and high effi ciency
distribution transformers.
• Brick lining for Kiln 5.
• Installation of new turbine for Ingersol Rand compressor to improve effi ciency.
• Overhauling of Turbo generating Set.
• New Induction lamp (40W) installation started in place of 125W HPMV lamp.
• Installation of facility to generate Low pressure Steam from continuous blow down heat recovery boiler of captive
power plant.
• Installation of 100 KW Solar PV System in township to generate electric power from renewable source.
• Installation of Turbo-expander in fuel natural gas line to generate electric power in captive power plant.
• Installation of Variable frequency drive in motor of service boiler forced draft fan to reduce power consumption
(c) Impact of the measures at (a) and (b) for reduction of energy consumption and consequent impact on the cost of
production:
• Reduction in specifi c consumption of steam
• Reduction of power consumption
• Reduction in greenhouse gas emission
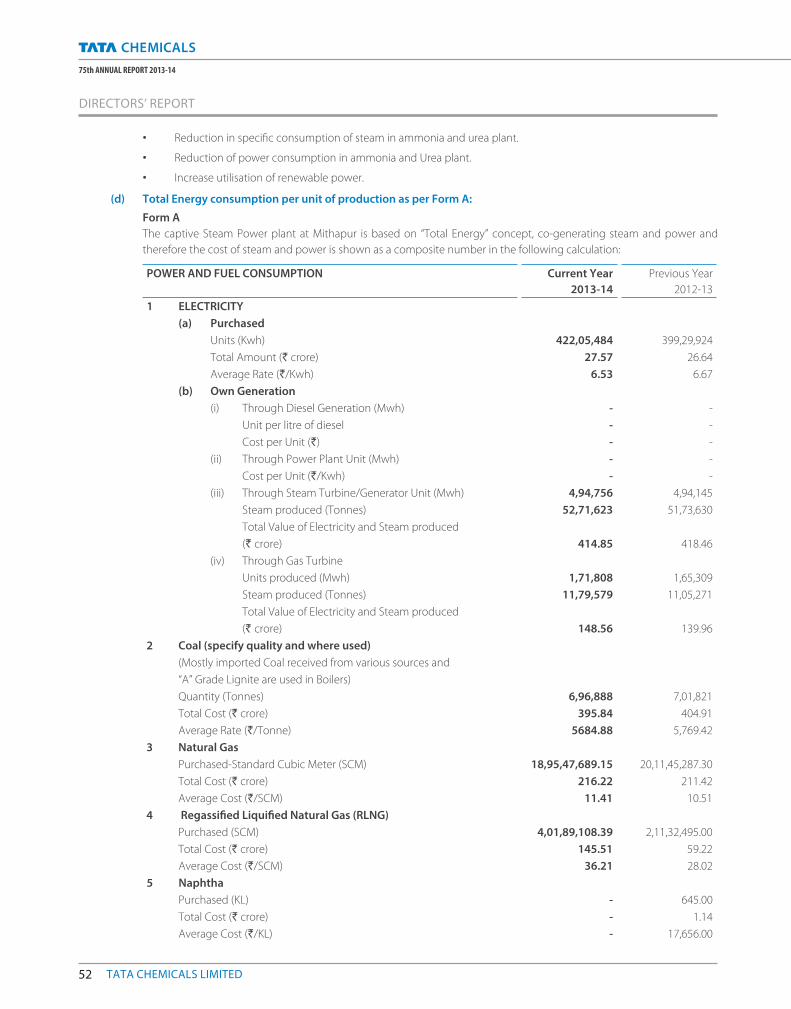
52 TATA CHEMICALS LIMITED
75th ANNUAL REPORT 2013-14
• Reduction in specifi c consumption of steam in ammonia and urea plant.
• Reduction of power consumption in ammonia and Urea plant.
• Increase utilisation of renewable power.
(d) Total Energy consumption per unit of production as per Form A:
Form A
The captive Steam Power plant at Mithapur is based on “Total Energy” concept, co-generating steam and power and
therefore the cost of steam and power is shown as a composite number in the following calculation:
POWER AND FUEL CONSUMPTION Current Year
2013-14
Previous Year
2012-13
1 ELECTRICITY
(a) Purchased
Units (Kwh) 422,05,484 399,29,924
Total Amount (` crore) 27.57 26.64
Average Rate (`/Kwh) 6.53 6.67
(b) Own Generation
(i) Through Diesel Generation (Mwh) - -
Unit per litre of diesel - -
Cost per Unit (`) - -
(ii) Through Power Plant Unit (Mwh) - -
Cost per Unit (`/Kwh) - -
(iii) Through Steam Turbine/Generator Unit (Mwh) 4,94,756 4,94,145
Steam produced (Tonnes) 52,71,623 51,73,630
Total Value of Electricity and Steam produced
(` crore) 414.85 418.46
(iv) Through Gas Turbine
Units produced (Mwh) 1,71,808 1,65,309
Steam produced (Tonnes) 11,79,579 11,05,271
Total Value of Electricity and Steam produced
(` crore) 148.56 139.96
2 Coal (specify quality and where used)
(Mostly imported Coal received from various sources and
“A” Grade Lignite are used in Boilers)
Quantity (Tonnes) 6,96,888 7,01,821
Total Cost (` crore) 395.84 404.91
Average Rate (`/Tonne) 5684.88 5,769.42
3 Natural Gas
Purchased-Standard Cubic Meter (SCM) 18,95,47,689.15 20,11,45,287.30
Total Cost (` crore) 216.22 211.42
Average Cost (`/SCM) 11.41 10.51
4 Regassifi ed Liquifi ed Natural Gas (RLNG)
Purchased (SCM) 4,01,89,108.39 2,11,32,495.00
Total Cost (` crore) 145.51 59.22
Average Cost (`/SCM) 36.21 28.02
5 Naphtha
Purchased (KL) - 645.00
Total Cost (` crore) - 1.14
Average Cost (`/KL) - 17,656.00
DIRECTORS’ REPORT

53
CORPORATE OVERVIEW FINANCIAL STATEMENTSSTATUTORY REPORTS
POWER AND FUEL CONSUMPTION Current Year
2013-14
Previous Year
2012-13
6 Furnace Oil
Purchased (KL) 1,431.00 1,361.00
Total Cost (` crore) 6.83 6.03
Average Cost (`/KL) 47,728.86 44,305.66
7 High Speed Diesel (HSD)
Purchased (KL) 236.42 230.15
Total Cost (` crore) 1.44 1.04
Average Rate(`/KL) 60,908.55 45,187.92
CONSUMPTION PER UNIT OF PRODUCTION
ELECTRICITY (Kwh/MT) STEAM (MT/MT)
Current Year
2013-14
Previous year
2012-13
Current Year
2013-14
Previous year
2012-13
Soda Ash Light 189.61 190.34 3.51 3.73
Sodium Bicarbonate 54.15 55.97 0.82 0.84
Caustic Soda Evaporated 2,739.73 2,790.28 0.83 0.96
Vacuum Evaporated Salt 73.73 72.59 2.28 2.27
Cement 124.23 125.04 - -
Urea 61.03 58.40 0.97 0.93
Ammonia 155.38 152.90 0.10 0.09
Sulphuric Acid 44.79 42.58 - -
Phosphoric Acid 270.67 244.58 - 0.431
Diammonium Phosphate 49.31 50.96 0.073 0.069
NPK Complexes 30.88 31.05 0.048 0.049
Single Super Phosphate 27.69 30.94 - -
Furnace Oil liter/Tonne
Diammonium Phosphate 1.13 2.21
NPK Complexes 2.93 2.06
B. TECHNOLOGY ABSORPTION
Form B
Research and Development (R&D)
1. Specifi c areas in which R&D is carried out by the Company
• Kainite type mixed salt preparation from sea bittern in progress.
• Commissioning of 3 TPD SOP test bed pilot plant in progress.
• Commissioning of Magnesium Oxide test bed pilot plant in progress.
• Waste utilisation.
2. Benefi ts derived as a result of above R&D
• Data generation for process scale up and commercial plant feasibility evaluation.
3. Future plan of action
• Continued R&D eff orts to attain objectives of cost reduction, energy conservation, waste minimisation / recycling and
reuse, related value added products, reduction in carbon footprints and environmental improvement.
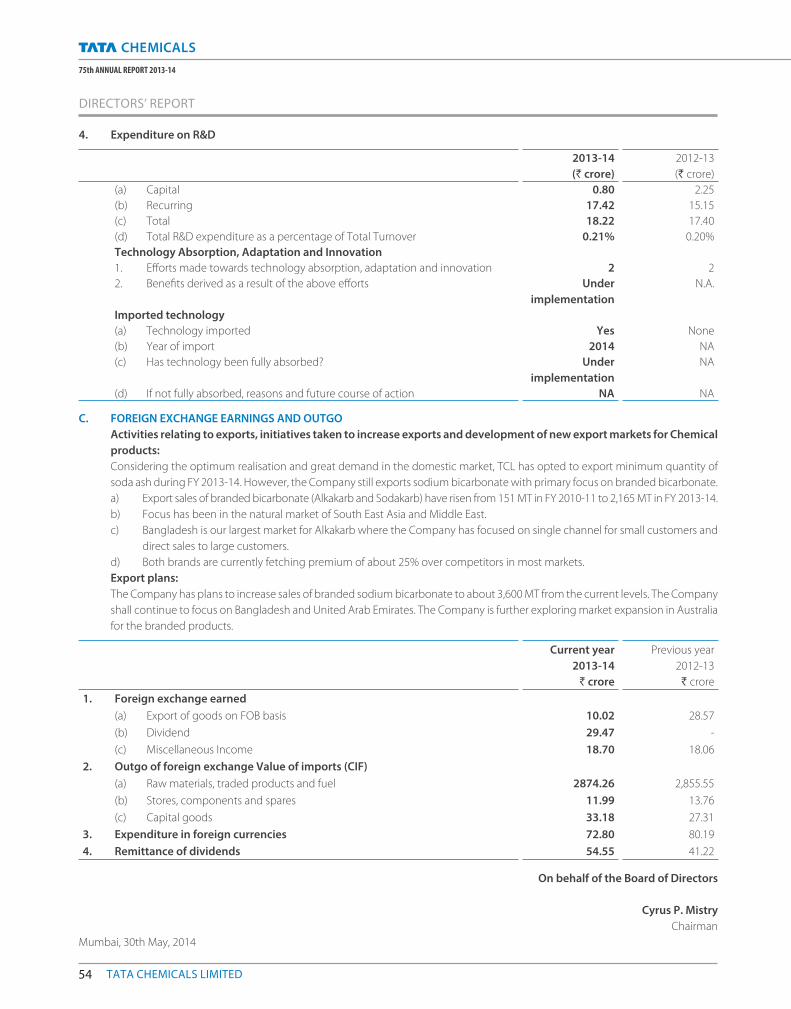
54 TATA CHEMICALS LIMITED
75th ANNUAL REPORT 2013-14
4. Expenditure on R&D
2013-14
(` crore)
2012-13
(` crore)
(a) Capital 0.80 2.25
(b) Recurring 17.42 15.15
(c) Total 18.22 17.40
(d) Total R&D expenditure as a percentage of Total Turnover 0.21% 0.20%
Technology Absorption, Adaptation and Innovation
1. Eff orts made towards technology absorption, adaptation and innovation 2 2
2. Benefi ts derived as a result of the above eff orts Under
implementation
N.A.
Imported technology
(a) Technology imported Yes None
(b) Year of import 2014 NA
(c) Has technology been fully absorbed? Under
implementation
NA
(d) If not fully absorbed, reasons and future course of action NA NA
C. FOREIGN EXCHANGE EARNINGS AND OUTGO
Activities relating to exports, initiatives taken to increase exports and development of new export markets for Chemical
products:
Considering the optimum realisation and great demand in the domestic market, TCL has opted to export minimum quantity of
soda ash during FY 2013-14. However, the Company still exports sodium bicarbonate with primary focus on branded bicarbonate.
a) Export sales of branded bicarbonate (Alkakarb and Sodakarb) have risen from 151 MT in FY 2010-11 to 2,165 MT in FY 2013-14.
b) Focus has been in the natural market of South East Asia and Middle East.
c) Bangladesh is our largest market for Alkakarb where the Company has focused on single channel for small customers and
direct sales to large customers.
d) Both brands are currently fetching premium of about 25% over competitors in most markets.
Export plans:
The Company has plans to increase sales of branded sodium bicarbonate to about 3,600 MT from the current levels. The Company
shall continue to focus on Bangladesh and United Arab Emirates. The Company is further exploring market expansion in Australia
for the branded products.
Current year
2013-14
` crore
Previous year
2012-13
` crore
1. Foreign exchange earned
(a) Export of goods on FOB basis 10.02 28.57
(b) Dividend 29.47 -
(c) Miscellaneous Income 18.70 18.06
2. Outgo of foreign exchange Value of imports (CIF)
(a) Raw materials, traded products and fuel 2874.26 2,855.55
(b) Stores, components and spares 11.99 13.76
(c) Capital goods 33.18 27.31
3. Expenditure in foreign currencies 72.80 80.19
4. Remittance of dividends 54.55 41.22
On behalf of the Board of Directors
Cyrus P. Mistry
Chairman
Mumbai, 30th May, 2014
DIRECTORS’ REPORT
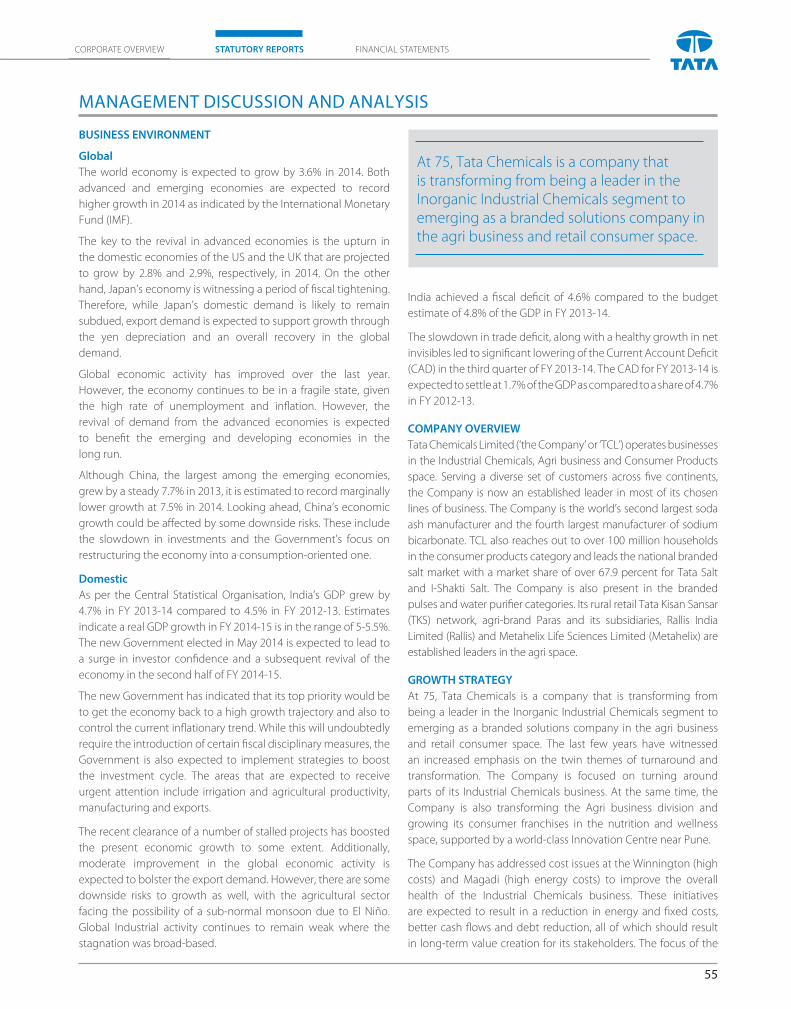
55
CORPORATE OVERVIEW FINANCIAL STATEMENTSSTATUTORY REPORTS
BUSINESS ENVIRONMENT
Global
The world economy is expected to grow by 3.6% in 2014. Both
advanced and emerging economies are expected to record
higher growth in 2014 as indicated by the International Monetary
Fund (IMF).
The key to the revival in advanced economies is the upturn in
the domestic economies of the US and the UK that are projected
to grow by 2.8% and 2.9%, respectively, in 2014. On the other
hand, Japan’s economy is witnessing a period of fi scal tightening.
Therefore, while Japan’s domestic demand is likely to remain
subdued, export demand is expected to support growth through
the yen depreciation and an overall recovery in the global
demand.
Global economic activity has improved over the last year.
However, the economy continues to be in a fragile state, given
the high rate of unemployment and infl ation. However, the
revival of demand from the advanced economies is expected
to benefi t the emerging and developing economies in the
long run.
Although China, the largest among the emerging economies,
grew by a steady 7.7% in 2013, it is estimated to record marginally
lower growth at 7.5% in 2014. Looking ahead, China’s economic
growth could be aff ected by some downside risks. These include
the slowdown in investments and the Government’s focus on
restructuring the economy into a consumption-oriented one.
Domestic
As per the Central Statistical Organisation, India’s GDP grew by
4.7% in FY 2013-14 compared to 4.5% in FY 2012-13. Estimates
indicate a real GDP growth in FY 2014-15 is in the range of 5-5.5%.
The new Government elected in May 2014 is expected to lead to
a surge in investor confi dence and a subsequent revival of the
economy in the second half of FY 2014-15.
The new Government has indicated that its top priority would be
to get the economy back to a high growth trajectory and also to
control the current infl ationary trend. While this will undoubtedly
require the introduction of certain fi scal disciplinary measures, the
Government is also expected to implement strategies to boost
the investment cycle. The areas that are expected to receive
urgent attention include irrigation and agricultural productivity,
manufacturing and exports.
The recent clearance of a number of stalled projects has boosted
the present economic growth to some extent. Additionally,
moderate improvement in the global economic activity is
expected to bolster the export demand. However, there are some
downside risks to growth as well, with the agricultural sector
facing the possibility of a sub-normal monsoon due to El Niño.
Global Industrial activity continues to remain weak where the
stagnation was broad-based.
MANAGEMENT DISCUSSION AND ANALYSIS
India achieved a fi scal defi cit of 4.6% compared to the budget
estimate of 4.8% of the GDP in FY 2013-14.
The slowdown in trade defi cit, along with a healthy growth in net
invisibles led to signifi cant lowering of the Current Account Defi cit
(CAD) in the third quarter of FY 2013-14. The CAD for FY 2013-14 is
expected to settle at 1.7% of the GDP as compared to a share of 4.7%
in FY 2012-13.
COMPANY OVERVIEW
Tata Chemicals Limited (‘the Company’ or ‘TCL’) operates businesses
in the Industrial Chemicals, Agri business and Consumer Products
space. Serving a diverse set of customers across fi ve continents,
the Company is now an established leader in most of its chosen
lines of business. The Company is the world’s second largest soda
ash manufacturer and the fourth largest manufacturer of sodium
bicarbonate. TCL also reaches out to over 100 million households
in the consumer products category and leads the national branded
salt market with a market share of over 67.9 percent for Tata Salt
and I-Shakti Salt. The Company is also present in the branded
pulses and water purifi er categories. Its rural retail Tata Kisan Sansar
(TKS) network, agri-brand Paras and its subsidiaries, Rallis India
Limited (Rallis) and Metahelix Life Sciences Limited (Metahelix) are
established leaders in the agri space.
GROWTH STRATEGY
At 75, Tata Chemicals is a company that is transforming from
being a leader in the Inorganic Industrial Chemicals segment to
emerging as a branded solutions company in the agri business
and retail consumer space. The last few years have witnessed
an increased emphasis on the twin themes of turnaround and
transformation. The Company is focused on turning around
parts of its Industrial Chemicals business. At the same time, the
Company is also transforming the Agri business division and
growing its consumer franchises in the nutrition and wellness
space, supported by a world-class Innovation Centre near Pune.
The Company has addressed cost issues at the Winnington (high
costs) and Magadi (high energy costs) to improve the overall
health of the Industrial Chemicals business. These initiatives
are expected to result in a reduction in energy and fi xed costs,
better cash fl ows and debt reduction, all of which should result
in long-term value creation for its stakeholders. The focus of the
At 75, Tata Chemicals is a company that is transforming from being a leader in the Inorganic Industrial Chemicals segment toemerging as a branded solutions company in the agri business and retail consumer space.
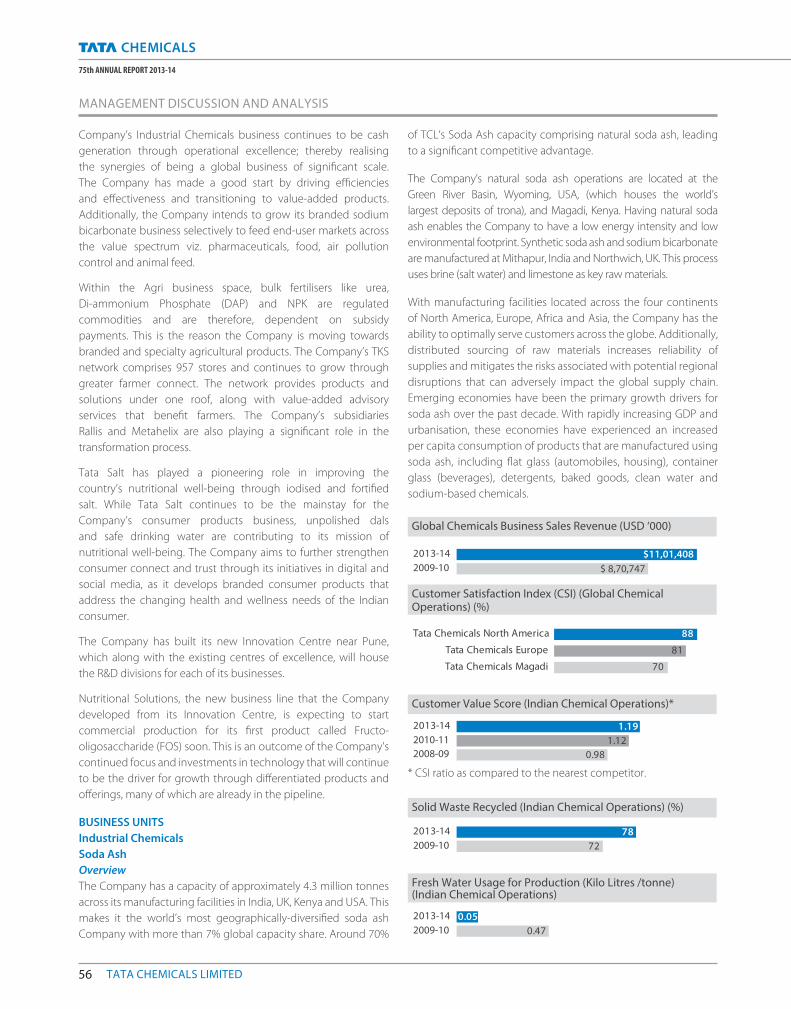
56 TATA CHEMICALS LIMITED
75th ANNUAL REPORT 2013-14
MANAGEMENT DISCUSSION AND ANALYSIS
Company’s Industrial Chemicals business continues to be cash
generation through operational excellence; thereby realising
the synergies of being a global business of signifi cant scale.
The Company has made a good start by driving effi ciencies
and eff ectiveness and transitioning to value-added products.
Additionally, the Company intends to grow its branded sodium
bicarbonate business selectively to feed end-user markets across
the value spectrum viz. pharmaceuticals, food, air pollution
control and animal feed.
Within the Agri business space, bulk fertilisers like urea,
Di-ammonium Phosphate (DAP) and NPK are regulated
commodities and are therefore, dependent on subsidy
payments. This is the reason the Company is moving towards
branded and specialty agricultural products. The Company’s TKS
network comprises 957 stores and continues to grow through
greater farmer connect. The network provides products and
solutions under one roof, along with value-added advisory
services that benefi t farmers. The Company’s subsidiaries
Rallis and Metahelix are also playing a signifi cant role in the
transformation process.
Tata Salt has played a pioneering role in improving the
country’s nutritional well-being through iodised and fortifi ed
salt. While Tata Salt continues to be the mainstay for the
Company’s consumer products business, unpolished dals
and safe drinking water are contributing to its mission of
nutritional well-being. The Company aims to further strengthen
consumer connect and trust through its initiatives in digital and
social media, as it develops branded consumer products that
address the changing health and wellness needs of the Indian
consumer.
The Company has built its new Innovation Centre near Pune,
which along with the existing centres of excellence, will house
the R&D divisions for each of its businesses.
Nutritional Solutions, the new business line that the Company
developed from its Innovation Centre, is expecting to start
commercial production for its fi rst product called Fructo-
oligosaccharide (FOS) soon. This is an outcome of the Company’s
continued focus and investments in technology that will continue
to be the driver for growth through diff erentiated products and
off erings, many of which are already in the pipeline.
BUSINESS UNITS
Industrial Chemicals
Soda Ash
OverviewThe Company has a capacity of approximately 4.3 million tonnes
across its manufacturing facilities in India, UK, Kenya and USA. This
makes it the world’s most geographically-diversified soda ash
Company with more than 7% global capacity share. Around 70%
of TCL‘s Soda Ash capacity comprising natural soda ash, leading
to a signifi cant competitive advantage.
The Company’s natural soda ash operations are located at the
Green River Basin, Wyoming, USA, (which houses the world’s
largest deposits of trona), and Magadi, Kenya. Having natural soda
ash enables the Company to have a low energy intensity and low
environmental footprint. Synthetic soda ash and sodium bicarbonate
are manufactured at Mithapur, India and Northwich, UK. This process
uses brine (salt water) and limestone as key raw materials.
With manufacturing facilities located across the four continents
of North America, Europe, Africa and Asia, the Company has the
ability to optimally serve customers across the globe. Additionally,
distributed sourcing of raw materials increases reliability of
supplies and mitigates the risks associated with potential regional
disruptions that can adversely impact the global supply chain.
Emerging economies have been the primary growth drivers for
soda ash over the past decade. With rapidly increasing GDP and
urbanisation, these economies have experienced an increased
per capita consumption of products that are manufactured using
soda ash, including fl at glass (automobiles, housing), container
glass (beverages), detergents, baked goods, clean water and
sodium-based chemicals.
Global Chemicals Business Sales Revenue (USD ‘000)
$11,01,408 2013-14
2009-10 $ 8,70,747
Customer Satisfaction Index (CSI) (Global Chemical Operations) (%)
Tata Chemicals Magadi
Tata Chemicals Europe
Tata Chemicals North America
70
81
88
Customer Value Score (Indian Chemical Operations)*
0.981.12
2013-14
2010-11
2008-09
1.19
* CSI ratio as compared to the nearest competitor.
Solid Waste Recycled (Indian Chemical Operations) (%)
2013-14
2009-10
78
72
Fresh Water Usage for Production (Kilo Litres /tonne)(Indian Chemical Operations)
0.472013-14
2009-10
0.05
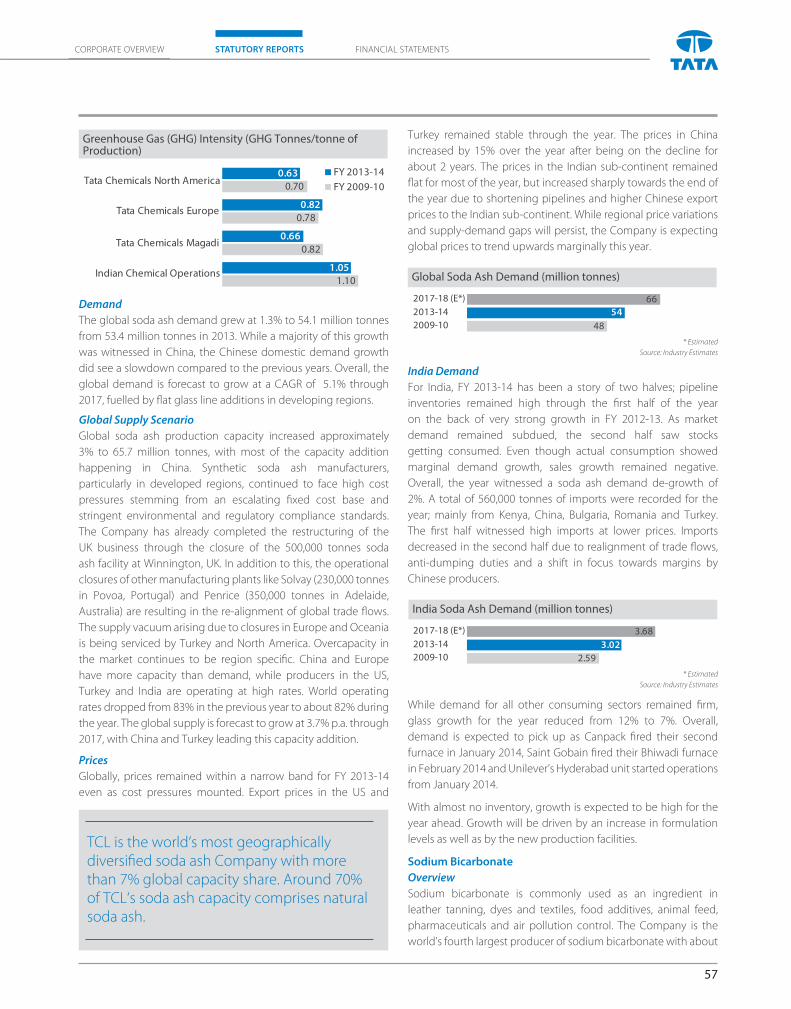
57
CORPORATE OVERVIEW FINANCIAL STATEMENTSSTATUTORY REPORTS
Greenhouse Gas (GHG) Intensity (GHG Tonnes/tonne of Production)
1.10
0.82
0.78
0.70
1.05
0.66
0.82
0.63
Indian Chemical Operations
Tata Chemicals Magadi
Tata Chemicals Europe
Tata Chemicals North AmericaFY 2013-14FY 2009-10
DemandThe global soda ash demand grew at 1.3% to 54.1 million tonnes
from 53.4 million tonnes in 2013. While a majority of this growth
was witnessed in China, the Chinese domestic demand growth
did see a slowdown compared to the previous years. Overall, the
global demand is forecast to grow at a CAGR of 5.1% through
2017, fuelled by fl at glass line additions in developing regions.
Global Supply ScenarioGlobal soda ash production capacity increased approximately
3% to 65.7 million tonnes, with most of the capacity addition
happening in China. Synthetic soda ash manufacturers,
particularly in developed regions, continued to face high cost
pressures stemming from an escalating fi xed cost base and
stringent environmental and regulatory compliance standards.
The Company has already completed the restructuring of the
UK business through the closure of the 500,000 tonnes soda
ash facility at Winnington, UK. In addition to this, the operational
closures of other manufacturing plants like Solvay (230,000 tonnes
in Povoa, Portugal) and Penrice (350,000 tonnes in Adelaide,
Australia) are resulting in the re-alignment of global trade fl ows.
The supply vacuum arising due to closures in Europe and Oceania
is being serviced by Turkey and North America. Overcapacity in
the market continues to be region specifi c. China and Europe
have more capacity than demand, while producers in the US,
Turkey and India are operating at high rates. World operating
rates dropped from 83% in the previous year to about 82% during
the year. The global supply is forecast to grow at 3.7% p.a. through
2017, with China and Turkey leading this capacity addition.
PricesGlobally, prices remained within a narrow band for FY 2013-14
even as cost pressures mounted. Export prices in the US and
Turkey remained stable through the year. The prices in China
increased by 15% over the year after being on the decline for
about 2 years. The prices in the Indian sub-continent remained
fl at for most of the year, but increased sharply towards the end of
the year due to shortening pipelines and higher Chinese export
prices to the Indian sub-continent. While regional price variations
and supply-demand gaps will persist, the Company is expecting
global prices to trend upwards marginally this year.
Global Soda Ash Demand (million tonnes)
54
48
662017-18 (E*)
2013-14
2009-10
* Estimated
Source: Industry Estimates
India DemandFor India, FY 2013-14 has been a story of two halves; pipeline
inventories remained high through the fi rst half of the year
on the back of very strong growth in FY 2012-13. As market
demand remained subdued, the second half saw stocks
getting consumed. Even though actual consumption showed
marginal demand growth, sales growth remained negative.
Overall, the year witnessed a soda ash demand de-growth of
2%. A total of 560,000 tonnes of imports were recorded for the
year; mainly from Kenya, China, Bulgaria, Romania and Turkey.
The fi rst half witnessed high imports at lower prices. Imports
decreased in the second half due to realignment of trade fl ows,
anti-dumping duties and a shift in focus towards margins by
Chinese producers.
India Soda Ash Demand (million tonnes)
2017-18 (E*)
2013-14
2009-10
3.683.02
2.59
* Estimated
Source: Industry Estimates
While demand for all other consuming sectors remained fi rm,
glass growth for the year reduced from 12% to 7%. Overall,
demand is expected to pick up as Canpack fi red their second
furnace in January 2014, Saint Gobain fi red their Bhiwadi furnace
in February 2014 and Unilever’s Hyderabad unit started operations
from January 2014.
With almost no inventory, growth is expected to be high for the
year ahead. Growth will be driven by an increase in formulation
levels as well as by the new production facilities.
Sodium Bicarbonate
Overview
Sodium bicarbonate is commonly used as an ingredient in
leather tanning, dyes and textiles, food additives, animal feed,
pharmaceuticals and air pollution control. The Company is the
world’s fourth largest producer of sodium bicarbonate with about
TCL is the world‘s most geographically diversifi ed soda ash Company with more than 7% global capacity share. Around 70% of TCL‘s soda ash capacity comprises natural soda ash.
58 TATA CHEMICALS LIMITED
75th ANNUAL REPORT 2013-14
MANAGEMENT DISCUSSION AND ANALYSIS
6% capacity share (FY 2013-14) and is the market leader in India
and the UK.
UK DemandIn Europe, Tata Chemicals Europe’s (TCE) sodium bicarbonate
brands are widely accepted and hold an established market
position. In 2013, demand for sodium bicarbonate in the UK
was 65,000 tonnes, a signifi cant increase compared to 2012,
inspired by improved economic conditions in the UK. The
UK market continues to be driven by treatment of fl ue gas
from waste incineration activities. TCE’s reputation for quality
and diff erentiated grades continues to be its strength in the
development of niche value sectors such as foam blowing, soda
blasting and other more graded product applications.
India Demand The Company is the market leader in sodium bicarbonate with
a share of over 50% in the domestic market. During the year, the
market witnessed record high imports of 29,000 tonnes of bicarb.
While end users in the animal feed, food and pharmaceutical
sectors provided stable growth, a weakening rupee has led
to an indirect increase in sodium bicarbonate demand due to
higher exports of leather, textile and dyes. Sodium bicarbonate
demand continues to demonstrate healthy growth across all
consuming sectors, particularly in food related applications.
Growth rates of 8-10% p.a. are anticipated for the next 5 years,
with development of applications in fl ue gas treatment and
uranium leaching.
Cement
OverviewThe Company’s cement plant was setup in the year 1993 to
convert the solid waste, generated as a by-product of soda ash,
into a value-added product. Solid effl uents are separated and
processed into Ordinary Portland Cement (OPC) and masonry
cement. The masonry cement enables the Company to add value
to its fl y ash (generated in the power plant) by converting it into a
useful binding material.
DemandThe domestic cement market faced a slump in demand during the
year. Market sentiments remained extremely weak, with sustained
price pressures for a major part of the year. Consolidation in the
industry and extended discounts from major players also aff ected
the business. However, the Company is expecting an upswing
in demand over the coming months. While the upward trend in
raw materials and freight costs is likely to be a key challenge for
the business, the Company is continuing to focus on catering to
the nearby markets for maximising realisations. The Company is
exploring opportunities for the development of niche grades of
cement and allied downstream off erings in an attempt to reduce
price sensitivity.
Agri Business
OverviewThe Company’s nitrogenous fertiliser plant is located at Babrala
(Uttar Pradesh) and its phosphatic fertiliser plant is based at Haldia
(West Bengal). The Company has a joint venture in Morocco
through a one-third stake in Indo Maroc Phosphore S.A., Morocco
(IMACID) that supplies phosphoric acid to Haldia. The Company
also trades in ‘P’ and ‘K’ fertilisers and is running a network of TKS
franchises.
The Company continues to make eff orts towards higher use
of technology to enhance productivity for the Indian farmers.
The focus, going forward, will be to adopt technology as a
diff erentiator, to invest in high-tech products such as specialty
fertilisers, herbicides, weedicides and high-grade seeds. TCL
(including its subsidiaries Rallis and Metahelix) is continuing
to strengthen its deep engagement with the Indian farming
community.
Crop Nutrition and Agri Business (` crore)
5,5382013-14
2009-10 3,543
TCL‘s Presence (No. of States)
14192013-14
2009-10
Following a year of below-average monsoons, the country has
witnessed a good monsoon in FY 2013-14. This has had a positive
impact on food grain production, with the latest estimates
pointing towards a record of 263 million tonnes, with agriculture
GDP growth estimated at 4.6% compared to 4% in the last four
years.
Urea
In FY 2013-14, the domestic production for urea at 22.7 million
tonnes was marginally higher than FY 2012-13 and urea imports
into India were 7 million tonnes, lower by 12% as compared to
the previous year. With no change in the MRP of urea, the year
witnessed a marginal 1% increase in urea sales.
Given that the gas prices are slated to increase in FY 2014-15, the
domestic production over “cut off ” levels may see some reduction,
The Company is the world‘s fourth largest producer of sodium bicarbonate with about 6% capacity share (FY 2013-14) and is the market leader in India and UK.
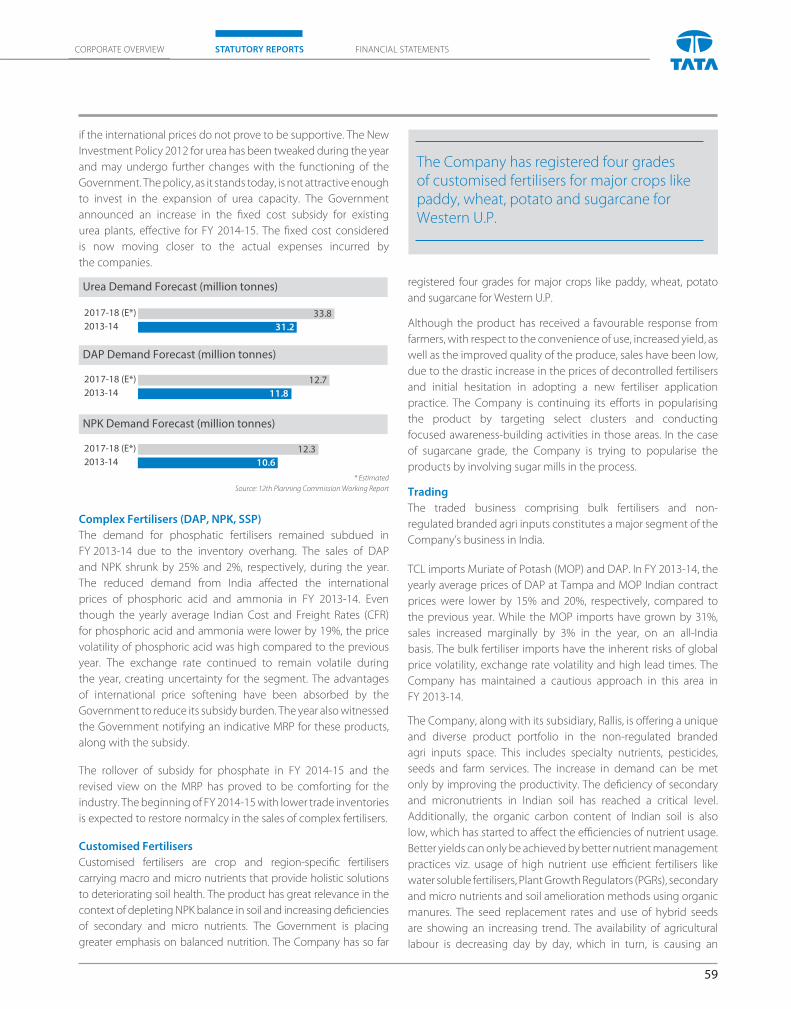
59
CORPORATE OVERVIEW FINANCIAL STATEMENTSSTATUTORY REPORTS
if the international prices do not prove to be supportive. The New
Investment Policy 2012 for urea has been tweaked during the year
and may undergo further changes with the functioning of the
Government. The policy, as it stands today, is not attractive enough
to invest in the expansion of urea capacity. The Government
announced an increase in the fi xed cost subsidy for existing
urea plants, eff ective for FY 2014-15. The fi xed cost considered
is now moving closer to the actual expenses incurred by
the companies.
Urea Demand Forecast (million tonnes)
33.82017-18 (E*)
2013-14 31.2
DAP Demand Forecast (million tonnes)
2017-18 (E*)
2013-14
12.711.8
NPK Demand Forecast (million tonnes)
2017-18 (E*)
2013-14
12.310.6
* Estimated
Source: 12th Planning Commission Working Report
Complex Fertilisers (DAP, NPK, SSP)
The demand for phosphatic fertilisers remained subdued in
FY 2013-14 due to the inventory overhang. The sales of DAP
and NPK shrunk by 25% and 2%, respectively, during the year.
The reduced demand from India aff ected the international
prices of phosphoric acid and ammonia in FY 2013-14. Even
though the yearly average Indian Cost and Freight Rates (CFR)
for phosphoric acid and ammonia were lower by 19%, the price
volatility of phosphoric acid was high compared to the previous
year. The exchange rate continued to remain volatile during
the year, creating uncertainty for the segment. The advantages
of international price softening have been absorbed by the
Government to reduce its subsidy burden. The year also witnessed
the Government notifying an indicative MRP for these products,
along with the subsidy.
The rollover of subsidy for phosphate in FY 2014-15 and the
revised view on the MRP has proved to be comforting for the
industry. The beginning of FY 2014-15 with lower trade inventories
is expected to restore normalcy in the sales of complex fertilisers.
Customised Fertilisers
Customised fertilisers are crop and region-specifi c fertilisers
carrying macro and micro nutrients that provide holistic solutions
to deteriorating soil health. The product has great relevance in the
context of depleting NPK balance in soil and increasing defi ciencies
of secondary and micro nutrients. The Government is placing
greater emphasis on balanced nutrition. The Company has so far
registered four grades for major crops like paddy, wheat, potato
and sugarcane for Western U.P.
Although the product has received a favourable response from
farmers, with respect to the convenience of use, increased yield, as
well as the improved quality of the produce, sales have been low,
due to the drastic increase in the prices of decontrolled fertilisers
and initial hesitation in adopting a new fertiliser application
practice. The Company is continuing its eff orts in popularising
the product by targeting select clusters and conducting
focused awareness-building activities in those areas. In the case
of sugarcane grade, the Company is trying to popularise the
products by involving sugar mills in the process.
Trading
The traded business comprising bulk fertilisers and non-
regulated branded agri inputs constitutes a major segment of the
Company’s business in India.
TCL imports Muriate of Potash (MOP) and DAP. In FY 2013-14, the
yearly average prices of DAP at Tampa and MOP Indian contract
prices were lower by 15% and 20%, respectively, compared to
the previous year. While the MOP imports have grown by 31%,
sales increased marginally by 3% in the year, on an all-India
basis. The bulk fertiliser imports have the inherent risks of global
price volatility, exchange rate volatility and high lead times. The
Company has maintained a cautious approach in this area in
FY 2013-14.
The Company, along with its subsidiary, Rallis, is off ering a unique
and diverse product portfolio in the non-regulated branded
agri inputs space. This includes specialty nutrients, pesticides,
seeds and farm services. The increase in demand can be met
only by improving the productivity. The defi ciency of secondary
and micronutrients in Indian soil has reached a critical level.
Additionally, the organic carbon content of Indian soil is also
low, which has started to aff ect the effi ciencies of nutrient usage.
Better yields can only be achieved by better nutrient management
practices viz. usage of high nutrient use effi cient fertilisers like
water soluble fertilisers, Plant Growth Regulators (PGRs), secondary
and micro nutrients and soil amelioration methods using organic
manures. The seed replacement rates and use of hybrid seeds
are showing an increasing trend. The availability of agricultural
labour is decreasing day by day, which in turn, is causing an
The Company has registered four grades of customised fertilisers for major crops like paddy, wheat, potato and sugarcane for Western U.P.
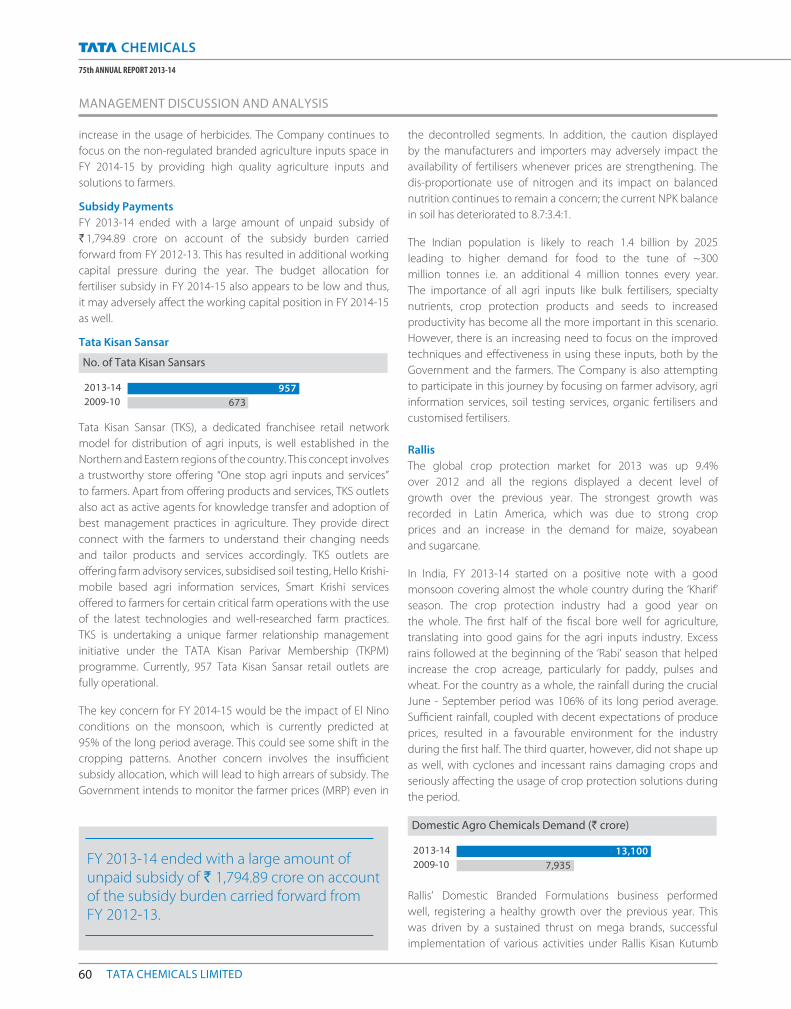
60 TATA CHEMICALS LIMITED
75th ANNUAL REPORT 2013-14
MANAGEMENT DISCUSSION AND ANALYSIS
increase in the usage of herbicides. The Company continues to
focus on the non-regulated branded agriculture inputs space in
FY 2014-15 by providing high quality agriculture inputs and
solutions to farmers.
Subsidy Payments
FY 2013-14 ended with a large amount of unpaid subsidy of
` 1,794.89 crore on account of the subsidy burden carried
forward from FY 2012-13. This has resulted in additional working
capital pressure during the year. The budget allocation for
fertiliser subsidy in FY 2014-15 also appears to be low and thus,
it may adversely aff ect the working capital position in FY 2014-15
as well.
Tata Kisan Sansar
No. of Tata Kisan Sansars
2013-14
2009-10
957
673
Tata Kisan Sansar (TKS), a dedicated franchisee retail network
model for distribution of agri inputs, is well established in the
Northern and Eastern regions of the country. This concept involves
a trustworthy store off ering “One stop agri inputs and services”
to farmers. Apart from off ering products and services, TKS outlets
also act as active agents for knowledge transfer and adoption of
best management practices in agriculture. They provide direct
connect with the farmers to understand their changing needs
and tailor products and services accordingly. TKS outlets are
off ering farm advisory services, subsidised soil testing, Hello Krishi-
mobile based agri information services, Smart Krishi services
off ered to farmers for certain critical farm operations with the use
of the latest technologies and well-researched farm practices.
TKS is undertaking a unique farmer relationship management
initiative under the TATA Kisan Parivar Membership (TKPM)
programme. Currently, 957 Tata Kisan Sansar retail outlets are
fully operational.
The key concern for FY 2014-15 would be the impact of El Nino
conditions on the monsoon, which is currently predicted at
95% of the long period average. This could see some shift in the
cropping patterns. Another concern involves the insuffi cient
subsidy allocation, which will lead to high arrears of subsidy. The
Government intends to monitor the farmer prices (MRP) even in
the decontrolled segments. In addition, the caution displayed
by the manufacturers and importers may adversely impact the
availability of fertilisers whenever prices are strengthening. The
dis-proportionate use of nitrogen and its impact on balanced
nutrition continues to remain a concern; the current NPK balance
in soil has deteriorated to 8.7:3.4:1.
The Indian population is likely to reach 1.4 billion by 2025
leading to higher demand for food to the tune of ~300
million tonnes i.e. an additional 4 million tonnes every year.
The importance of all agri inputs like bulk fertilisers, specialty
nutrients, crop protection products and seeds to increased
productivity has become all the more important in this scenario.
However, there is an increasing need to focus on the improved
techniques and eff ectiveness in using these inputs, both by the
Government and the farmers. The Company is also attempting
to participate in this journey by focusing on farmer advisory, agri
information services, soil testing services, organic fertilisers and
customised fertilisers.
Rallis
The global crop protection market for 2013 was up 9.4%
over 2012 and all the regions displayed a decent level of
growth over the previous year. The strongest growth was
recorded in Latin America, which was due to strong crop
prices and an increase in the demand for maize, soyabean
and sugarcane.
In India, FY 2013-14 started on a positive note with a good
monsoon covering almost the whole country during the ‘Kharif’
season. The crop protection industry had a good year on
the whole. The fi rst half of the fi scal bore well for agriculture,
translating into good gains for the agri inputs industry. Excess
rains followed at the beginning of the ‘Rabi’ season that helped
increase the crop acreage, particularly for paddy, pulses and
wheat. For the country as a whole, the rainfall during the crucial
June - September period was 106% of its long period average.
Suffi cient rainfall, coupled with decent expectations of produce
prices, resulted in a favourable environment for the industry
during the fi rst half. The third quarter, however, did not shape up
as well, with cyclones and incessant rains damaging crops and
seriously aff ecting the usage of crop protection solutions during
the period.
Domestic Agro Chemicals Demand (` crore)
7,93513,1002013-14
2009-10
Rallis’ Domestic Branded Formulations business performed
well, registering a healthy growth over the previous year. This
was driven by a sustained thrust on mega brands, successful
implementation of various activities under Rallis Kisan Kutumb
FY 2013-14 ended with a large amount of unpaid subsidy of ` 1,794.89 crore on account of the subsidy burden carried forward from FY 2012-13.
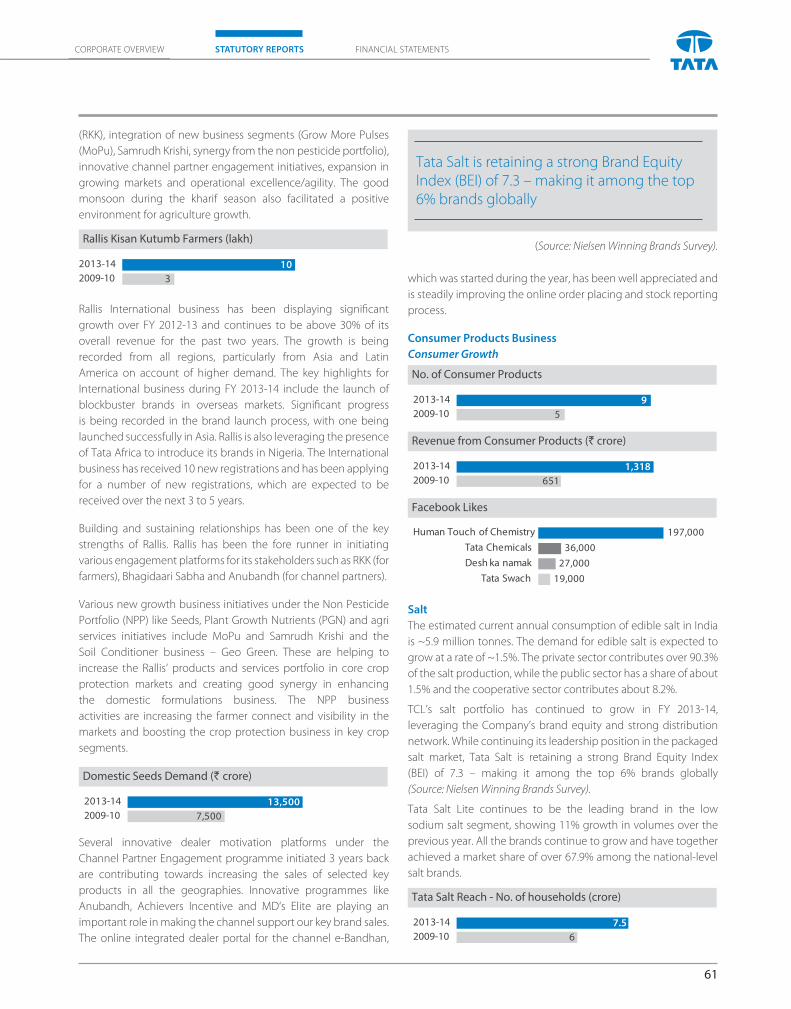
61
CORPORATE OVERVIEW FINANCIAL STATEMENTSSTATUTORY REPORTS
(RKK), integration of new business segments (Grow More Pulses
(MoPu), Samrudh Krishi, synergy from the non pesticide portfolio),
innovative channel partner engagement initiatives, expansion in
growing markets and operational excellence/agility. The good
monsoon during the kharif season also facilitated a positive
environment for agriculture growth.
Rallis Kisan Kutumb Farmers (lakh)
2013-14
2009-10 310
Rallis International business has been displaying signifi cant
growth over FY 2012-13 and continues to be above 30% of its
overall revenue for the past two years. The growth is being
recorded from all regions, particularly from Asia and Latin
America on account of higher demand. The key highlights for
International business during FY 2013-14 include the launch of
blockbuster brands in overseas markets. Signifi cant progress
is being recorded in the brand launch process, with one being
launched successfully in Asia. Rallis is also leveraging the presence
of Tata Africa to introduce its brands in Nigeria. The International
business has received 10 new registrations and has been applying
for a number of new registrations, which are expected to be
received over the next 3 to 5 years.
Building and sustaining relationships has been one of the key
strengths of Rallis. Rallis has been the fore runner in initiating
various engagement platforms for its stakeholders such as RKK (for
farmers), Bhagidaari Sabha and Anubandh (for channel partners).
Various new growth business initiatives under the Non Pesticide
Portfolio (NPP) like Seeds, Plant Growth Nutrients (PGN) and agri
services initiatives include MoPu and Samrudh Krishi and the
Soil Conditioner business – Geo Green. These are helping to
increase the Rallis‘ products and services portfolio in core crop
protection markets and creating good synergy in enhancing
the domestic formulations business. The NPP business
activities are increasing the farmer connect and visibility in the
markets and boosting the crop protection business in key crop
segments.
Domestic Seeds Demand (` crore)
7,5002013-14
2009-10
13,500
Several innovative dealer motivation platforms under the
Channel Partner Engagement programme initiated 3 years back
are contributing towards increasing the sales of selected key
products in all the geographies. Innovative programmes like
Anubandh, Achievers Incentive and MD‘s Elite are playing an
important role in making the channel support our key brand sales.
The online integrated dealer portal for the channel e-Bandhan,
which was started during the year, has been well appreciated and
is steadily improving the online order placing and stock reporting
process.
Consumer Products Business
Consumer Growth
No. of Consumer Products
2013-14
2009-10
9
5
Revenue from Consumer Products (` crore)
2013-14
2009-10
1,318
651
Facebook Likes
19,00027,000
36,000197,000
Tata Swach
Desh ka namak
Tata Chemicals
Human Touch of Chemistry
Salt
The estimated current annual consumption of edible salt in India
is ~5.9 million tonnes. The demand for edible salt is expected to
grow at a rate of ~1.5%. The private sector contributes over 90.3%
of the salt production, while the public sector has a share of about
1.5% and the cooperative sector contributes about 8.2%.
TCL’s salt portfolio has continued to grow in FY 2013-14,
leveraging the Company’s brand equity and strong distribution
network. While continuing its leadership position in the packaged
salt market, Tata Salt is retaining a strong Brand Equity Index
(BEI) of 7.3 – making it among the top 6% brands globally
(Source: Nielsen Winning Brands Survey).
Tata Salt Lite continues to be the leading brand in the low
sodium salt segment, showing 11% growth in volumes over the
previous year. All the brands continue to grow and have together
achieved a market share of over 67.9% among the national-level
salt brands.
Tata Salt Reach - No. of households (crore)
2013-14
2009-10
7.5
6
Tata Salt is retaining a strong Brand Equity Index (BEI) of 7.3 – making it among the top 6% brands globally
(Source: Nielsen Winning Brands Survey).
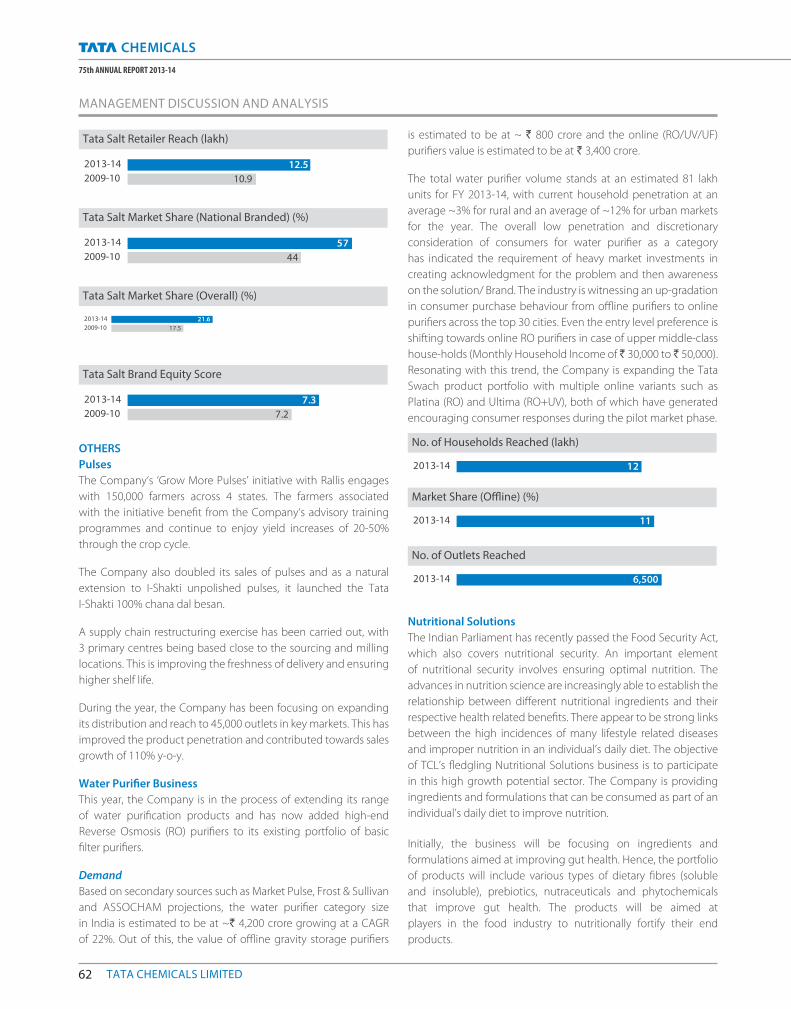
62 TATA CHEMICALS LIMITED
75th ANNUAL REPORT 2013-14
MANAGEMENT DISCUSSION AND ANALYSIS
Tata Salt Retailer Reach (lakh)
2013-14
2009-10
12.5
10.9
Tata Salt Market Share (National Branded) (%)
57
442013-14
2009-10
Tata Salt Market Share (Overall) (%)
2013-14
2009-10
21.6
17.5
Tata Salt Brand Equity Score
2013-14
2009-10
7.3
7.2
OTHERS
Pulses
The Company‘s ‘Grow More Pulses’ initiative with Rallis engages
with 150,000 farmers across 4 states. The farmers associated
with the initiative benefi t from the Company‘s advisory training
programmes and continue to enjoy yield increases of 20-50%
through the crop cycle.
The Company also doubled its sales of pulses and as a natural
extension to I-Shakti unpolished pulses, it launched the Tata
I-Shakti 100% chana dal besan.
A supply chain restructuring exercise has been carried out, with
3 primary centres being based close to the sourcing and milling
locations. This is improving the freshness of delivery and ensuring
higher shelf life.
During the year, the Company has been focusing on expanding
its distribution and reach to 45,000 outlets in key markets. This has
improved the product penetration and contributed towards sales
growth of 110% y-o-y.
Water Purifi er Business
This year, the Company is in the process of extending its range
of water purifi cation products and has now added high-end
Reverse Osmosis (RO) purifi ers to its existing portfolio of basic
fi lter purifi ers.
DemandBased on secondary sources such as Market Pulse, Frost & Sullivan
and ASSOCHAM projections, the water purifi er category size
in India is estimated to be at ~` 4,200 crore growing at a CAGR
of 22%. Out of this, the value of offl ine gravity storage purifi ers
is estimated to be at ~ ` 800 crore and the online (RO/UV/UF)
purifi ers value is estimated to be at ` 3,400 crore.
The total water purifi er volume stands at an estimated 81 lakh
units for FY 2013-14, with current household penetration at an
average ~3% for rural and an average of ~12% for urban markets
for the year. The overall low penetration and discretionary
consideration of consumers for water purifi er as a category
has indicated the requirement of heavy market investments in
creating acknowledgment for the problem and then awareness
on the solution/ Brand. The industry is witnessing an up-gradation
in consumer purchase behaviour from offl ine purifi ers to online
purifi ers across the top 30 cities. Even the entry level preference is
shifting towards online RO purifi ers in case of upper middle-class
house-holds (Monthly Household Income of ̀ 30,000 to ̀ 50,000).
Resonating with this trend, the Company is expanding the Tata
Swach product portfolio with multiple online variants such as
Platina (RO) and Ultima (RO+UV), both of which have generated
encouraging consumer responses during the pilot market phase.
No. of Households Reached (lakh)
122013-14
Market Share (Offl ine) (%)
112013-14
No. of Outlets Reached
6,5002013-14
Nutritional Solutions
The Indian Parliament has recently passed the Food Security Act,
which also covers nutritional security. An important element
of nutritional security involves ensuring optimal nutrition. The
advances in nutrition science are increasingly able to establish the
relationship between diff erent nutritional ingredients and their
respective health related benefi ts. There appear to be strong links
between the high incidences of many lifestyle related diseases
and improper nutrition in an individual’s daily diet. The objective
of TCL’s fl edgling Nutritional Solutions business is to participate
in this high growth potential sector. The Company is providing
ingredients and formulations that can be consumed as part of an
individual’s daily diet to improve nutrition.
Initially, the business will be focusing on ingredients and
formulations aimed at improving gut health. Hence, the portfolio
of products will include various types of dietary fi bres (soluble
and insoluble), prebiotics, nutraceuticals and phytochemicals
that improve gut health. The products will be aimed at
players in the food industry to nutritionally fortify their end
products.
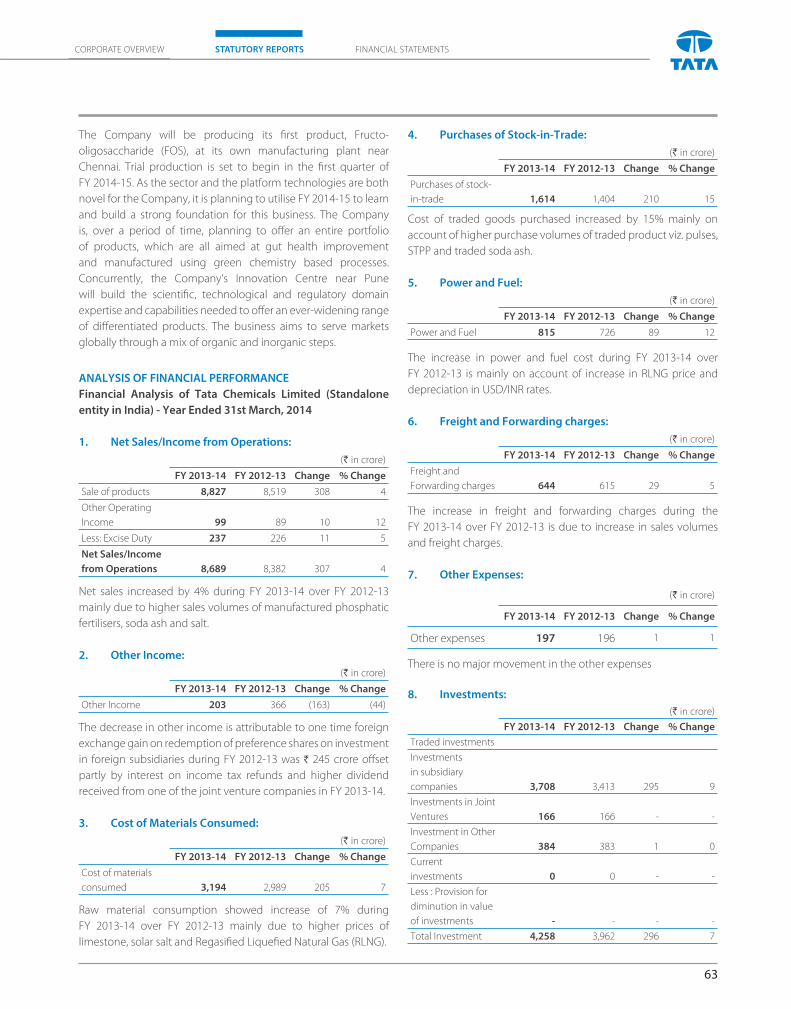
63
CORPORATE OVERVIEW FINANCIAL STATEMENTSSTATUTORY REPORTS
The Company will be producing its fi rst product, Fructo-
oligosaccharide (FOS), at its own manufacturing plant near
Chennai. Trial production is set to begin in the fi rst quarter of
FY 2014-15. As the sector and the platform technologies are both
novel for the Company, it is planning to utilise FY 2014-15 to learn
and build a strong foundation for this business. The Company
is, over a period of time, planning to off er an entire portfolio
of products, which are all aimed at gut health improvement
and manufactured using green chemistry based processes.
Concurrently, the Company‘s Innovation Centre near Pune
will build the scientifi c, technological and regulatory domain
expertise and capabilities needed to off er an ever-widening range
of diff erentiated products. The business aims to serve markets
globally through a mix of organic and inorganic steps.
ANALYSIS OF FINANCIAL PERFORMANCE
Financial Analysis of Tata Chemicals Limited (Standalone
entity in India) - Year Ended 31st March, 2014
1. Net Sales/Income from Operations:
(` in crore)
FY 2013-14 FY 2012-13 Change % Change
Sale of products 8,827 8,519 308 4
Other Operating
Income 99 89 10 12
Less: Excise Duty 237 226 11 5
Net Sales/Income
from Operations 8,689 8,382 307 4
Net sales increased by 4% during FY 2013-14 over FY 2012-13
mainly due to higher sales volumes of manufactured phosphatic
fertilisers, soda ash and salt.
2. Other Income:
(` in crore)
FY 2013-14 FY 2012-13 Change % Change
Other Income 203 366 (163) (44)
The decrease in other income is attributable to one time foreign
exchange gain on redemption of preference shares on investment
in foreign subsidiaries during FY 2012-13 was ` 245 crore off set
partly by interest on income tax refunds and higher dividend
received from one of the joint venture companies in FY 2013-14.
3. Cost of Materials Consumed:
(` in crore)
FY 2013-14 FY 2012-13 Change % Change
Cost of materials
consumed 3,194 2,989 205 7
Raw material consumption showed increase of 7% during
FY 2013-14 over FY 2012-13 mainly due to higher prices of
limestone, solar salt and Regasifi ed Liquefi ed Natural Gas (RLNG).
4. Purchases of Stock-in-Trade:
(` in crore)
FY 2013-14 FY 2012-13 Change % Change
Purchases of stock-
in-trade 1,614 1,404 210 15
Cost of traded goods purchased increased by 15% mainly on
account of higher purchase volumes of traded product viz. pulses,
STPP and traded soda ash.
5. Power and Fuel:
(` in crore)
FY 2013-14 FY 2012-13 Change % Change
Power and Fuel 815 726 89 12
The increase in power and fuel cost during FY 2013-14 over
FY 2012-13 is mainly on account of increase in RLNG price and
depreciation in USD/INR rates.
6. Freight and Forwarding charges:
(` in crore)
FY 2013-14 FY 2012-13 Change % Change
Freight and
Forwarding charges 644 615 29 5
The increase in freight and forwarding charges during the
FY 2013-14 over FY 2012-13 is due to increase in sales volumes
and freight charges.
7. Other Expenses:
(` in crore)
FY 2013-14 FY 2012-13 Change % Change
Other expenses 197 196 1 1
There is no major movement in the other expenses
8. Investments:
(` in crore)
FY 2013-14 FY 2012-13 Change % Change
Traded investments
Investments
in subsidiary
companies 3,708 3,413 295 9
Investments in Joint
Ventures 166 166 - -
Investment in Other
Companies 384 383 1 0
Current
investments 0 0 - -
Less : Provision for
diminution in value
of investments - - - -
Total Investment 4,258 3,962 296 7
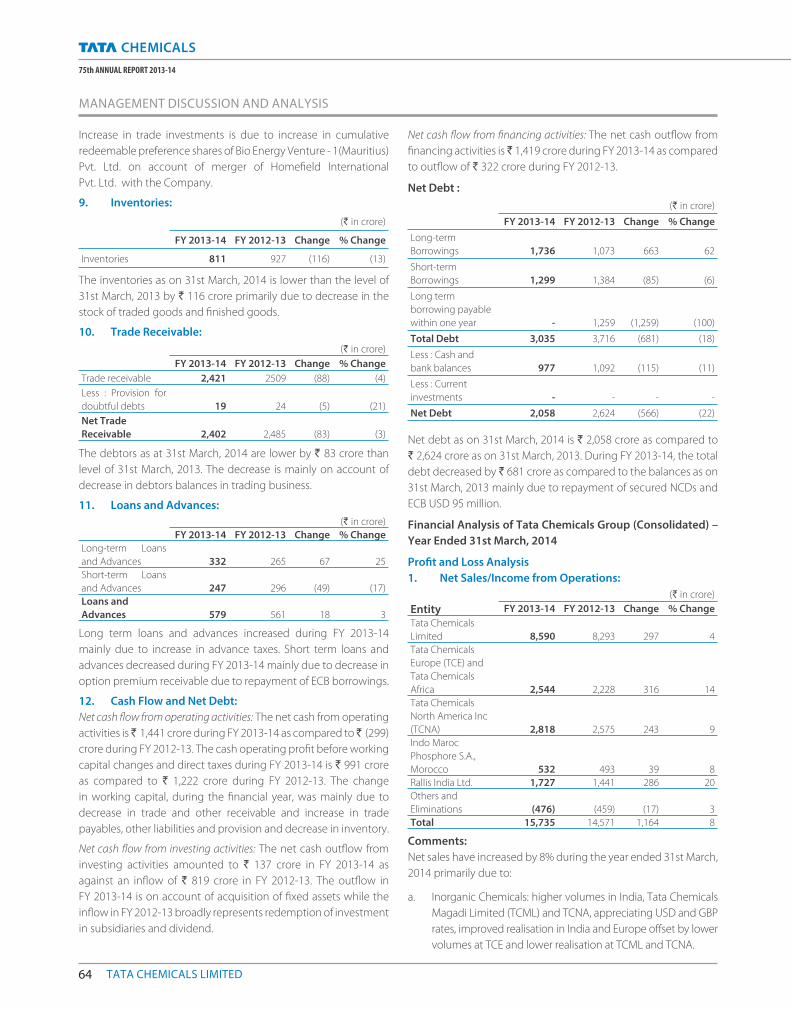
64 TATA CHEMICALS LIMITED
75th ANNUAL REPORT 2013-14
MANAGEMENT DISCUSSION AND ANALYSIS
Increase in trade investments is due to increase in cumulative
redeemable preference shares of Bio Energy Venture - 1(Mauritius)
Pvt. Ltd. on account of merger of Homefi eld International
Pvt. Ltd. with the Company.
9. Inventories:
(` in crore)
FY 2013-14 FY 2012-13 Change % Change
Inventories 811 927 (116) (13)
The inventories as on 31st March, 2014 is lower than the level of
31st March, 2013 by ` 116 crore primarily due to decrease in the
stock of traded goods and fi nished goods.
10. Trade Receivable:
(` in crore)
FY 2013-14 FY 2012-13 Change % Change
Trade receivable 2,421 2509 (88) (4)
Less : Provision for
doubtful debts 19 24 (5) (21)
Net Trade
Receivable 2,402 2,485 (83) (3)
The debtors as at 31st March, 2014 are lower by ` 83 crore than
level of 31st March, 2013. The decrease is mainly on account of
decrease in debtors balances in trading business.
11. Loans and Advances:
(` in crore)
FY 2013-14 FY 2012-13 Change % Change
Long-term Loans
and Advances 332 265 67 25
Short-term Loans
and Advances 247 296 (49) (17)
Loans and
Advances 579 561 18 3
Long term loans and advances increased during FY 2013-14
mainly due to increase in advance taxes. Short term loans and
advances decreased during FY 2013-14 mainly due to decrease in
option premium receivable due to repayment of ECB borrowings.
12. Cash Flow and Net Debt:
Net cash fl ow from operating activities: The net cash from operating
activities is ̀ 1,441 crore during FY 2013-14 as compared to ̀ (299)
crore during FY 2012-13. The cash operating profi t before working
capital changes and direct taxes during FY 2013-14 is ` 991 crore
as compared to ` 1,222 crore during FY 2012-13. The change
in working capital, during the fi nancial year, was mainly due to
decrease in trade and other receivable and increase in trade
payables, other liabilities and provision and decrease in inventory.
Net cash fl ow from investing activities: The net cash outfl ow from
investing activities amounted to ` 137 crore in FY 2013-14 as
against an infl ow of ` 819 crore in FY 2012-13. The outfl ow in
FY 2013-14 is on account of acquisition of fi xed assets while the
infl ow in FY 2012-13 broadly represents redemption of investment
in subsidiaries and dividend.
Net cash fl ow from fi nancing activities: The net cash outfl ow from
fi nancing activities is ̀ 1,419 crore during FY 2013-14 as compared
to outfl ow of ` 322 crore during FY 2012-13.
Net Debt :
(` in crore)
FY 2013-14 FY 2012-13 Change % Change
Long-term
Borrowings 1,736 1,073 663 62
Short-term
Borrowings 1,299 1,384 (85) (6)
Long term
borrowing payable
within one year - 1,259 (1,259) (100)
Total Debt 3,035 3,716 (681) (18)
Less : Cash and
bank balances 977 1,092 (115) (11)
Less : Current
investments - - - -
Net Debt 2,058 2,624 (566) (22)
Net debt as on 31st March, 2014 is ` 2,058 crore as compared to
` 2,624 crore as on 31st March, 2013. During FY 2013-14, the total
debt decreased by ` 681 crore as compared to the balances as on
31st March, 2013 mainly due to repayment of secured NCDs and
ECB USD 95 million.
Financial Analysis of Tata Chemicals Group (Consolidated) –
Year Ended 31st March, 2014
Profi t and Loss Analysis
1. Net Sales/Income from Operations:
(` in crore)
Entity FY 2013-14 FY 2012-13 Change % Change
Tata Chemicals
Limited 8,590 8,293 297 4
Tata Chemicals
Europe (TCE) and
Tata Chemicals
Africa 2,544 2,228 316 14
Tata Chemicals
North America Inc
(TCNA) 2,818 2,575 243 9
Indo Maroc
Phosphore S.A.,
Morocco 532 493 39 8
Rallis India Ltd. 1,727 1,441 286 20
Others and
Eliminations (476) (459) (17) 3
Total 15,735 14,571 1,164 8
Comments:
Net sales have increased by 8% during the year ended 31st March,
2014 primarily due to:
a. Inorganic Chemicals: higher volumes in India, Tata Chemicals
Magadi Limited (TCML) and TCNA, appreciating USD and GBP
rates, improved realisation in India and Europe off set by lower
volumes at TCE and lower realisation at TCML and TCNA.
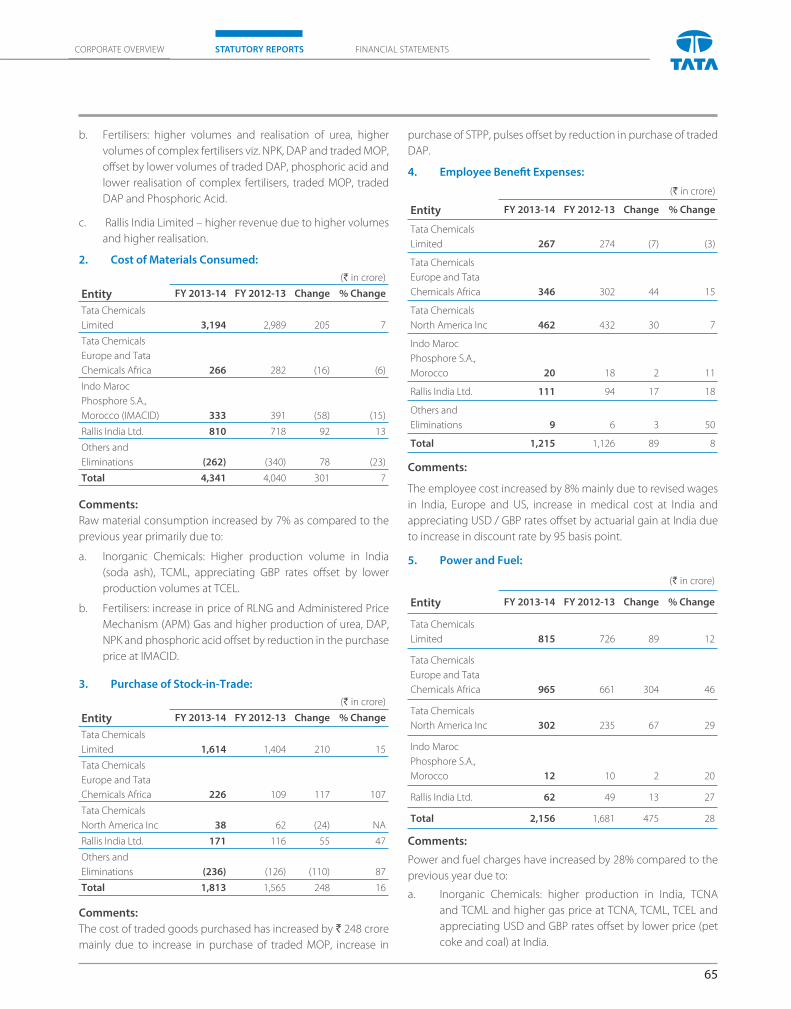
65
CORPORATE OVERVIEW FINANCIAL STATEMENTSSTATUTORY REPORTS
b. Fertilisers: higher volumes and realisation of urea, higher
volumes of complex fertilisers viz. NPK, DAP and traded MOP,
off set by lower volumes of traded DAP, phosphoric acid and
lower realisation of complex fertilisers, traded MOP, traded
DAP and Phosphoric Acid.
c. Rallis India Limited – higher revenue due to higher volumes
and higher realisation.
2. Cost of Materials Consumed:
(` in crore)
Entity FY 2013-14 FY 2012-13 Change % Change
Tata Chemicals
Limited 3,194 2,989 205 7
Tata Chemicals
Europe and Tata
Chemicals Africa 266 282 (16) (6)
Indo Maroc
Phosphore S.A.,
Morocco (IMACID) 333 391 (58) (15)
Rallis India Ltd. 810 718 92 13
Others and
Eliminations (262) (340) 78 (23)
Total 4,341 4,040 301 7
Comments:
Raw material consumption increased by 7% as compared to the
previous year primarily due to:
a. Inorganic Chemicals: Higher production volume in India
(soda ash), TCML, appreciating GBP rates off set by lower
production volumes at TCEL.
b. Fertilisers: increase in price of RLNG and Administered Price
Mechanism (APM) Gas and higher production of urea, DAP,
NPK and phosphoric acid off set by reduction in the purchase
price at IMACID.
3. Purchase of Stock-in-Trade:
(` in crore)
Entity FY 2013-14 FY 2012-13 Change % Change
Tata Chemicals
Limited 1,614 1,404 210 15
Tata Chemicals
Europe and Tata
Chemicals Africa 226 109 117 107
Tata Chemicals
North America Inc 38 62 (24) NA
Rallis India Ltd. 171 116 55 47
Others and
Eliminations (236) (126) (110) 87
Total 1,813 1,565 248 16
Comments:
The cost of traded goods purchased has increased by ` 248 crore
mainly due to increase in purchase of traded MOP, increase in
purchase of STPP, pulses off set by reduction in purchase of traded
DAP.
4. Employee Benefi t Expenses:
(` in crore)
Entity FY 2013-14 FY 2012-13 Change % Change
Tata Chemicals
Limited 267 274 (7) (3)
Tata Chemicals
Europe and Tata
Chemicals Africa 346 302 44 15
Tata Chemicals
North America Inc 462 432 30 7
Indo Maroc
Phosphore S.A.,
Morocco 20 18 2 11
Rallis India Ltd. 111 94 17 18
Others and
Eliminations 9 6 3 50
Total 1,215 1,126 89 8
Comments:
The employee cost increased by 8% mainly due to revised wages
in India, Europe and US, increase in medical cost at India and
appreciating USD / GBP rates off set by actuarial gain at India due
to increase in discount rate by 95 basis point.
5. Power and Fuel:
(` in crore)
Entity FY 2013-14 FY 2012-13 Change % Change
Tata Chemicals
Limited 815 726 89 12
Tata Chemicals
Europe and Tata
Chemicals Africa 965 661 304 46
Tata Chemicals
North America Inc 302 235 67 29
Indo Maroc
Phosphore S.A.,
Morocco 12 10 2 20
Rallis India Ltd. 62 49 13 27
Total 2,156 1,681 475 28
Comments:
Power and fuel charges have increased by 28% compared to the
previous year due to:
a. Inorganic Chemicals: higher production in India, TCNA
and TCML and higher gas price at TCNA, TCML, TCEL and
appreciating USD and GBP rates off set by lower price (pet
coke and coal) at India.
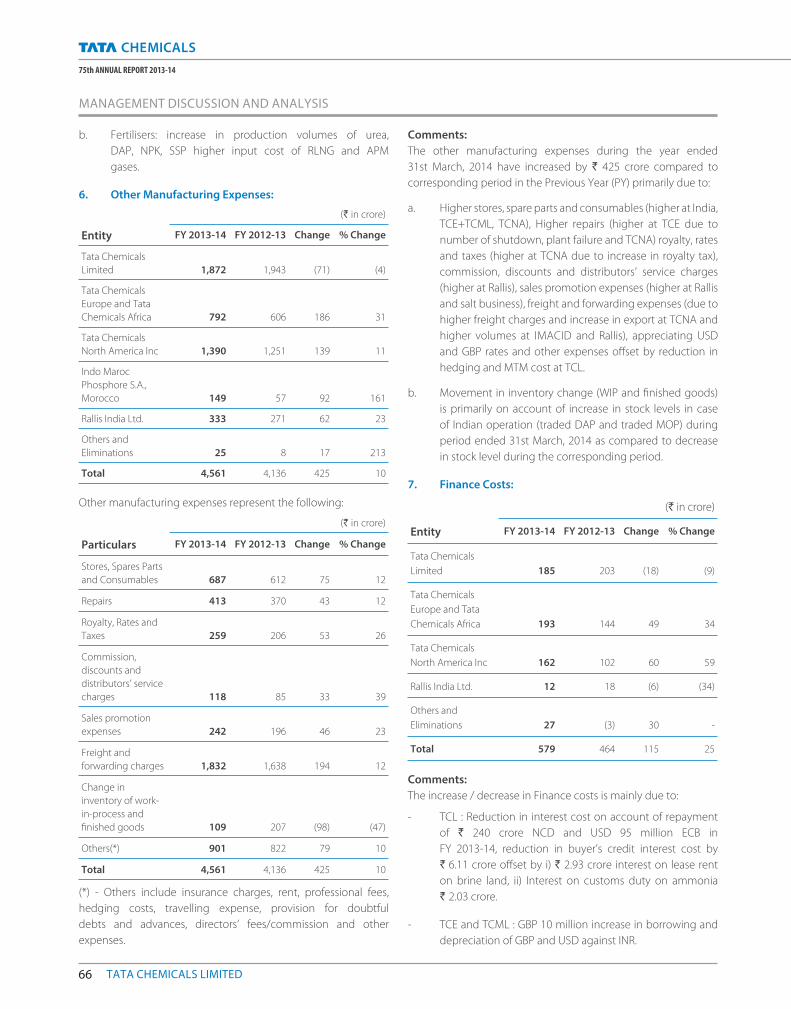
66 TATA CHEMICALS LIMITED
75th ANNUAL REPORT 2013-14
b. Fertilisers: increase in production volumes of urea,
DAP, NPK, SSP higher input cost of RLNG and APM
gases.
6. Other Manufacturing Expenses:
(` in crore)
Entity FY 2013-14 FY 2012-13 Change % Change
Tata Chemicals
Limited 1,872 1,943 (71) (4)
Tata Chemicals
Europe and Tata
Chemicals Africa 792 606 186 31
Tata Chemicals
North America Inc 1,390 1,251 139 11
Indo Maroc
Phosphore S.A.,
Morocco 149 57 92 161
Rallis India Ltd. 333 271 62 23
Others and
Eliminations 25 8 17 213
Total 4,561 4,136 425 10
Other manufacturing expenses represent the following:
(` in crore)
Particulars FY 2013-14 FY 2012-13 Change % Change
Stores, Spares Parts
and Consumables 687 612 75 12
Repairs 413 370 43 12
Royalty, Rates and
Taxes 259 206 53 26
Commission,
discounts and
distributors’ service
charges 118 85 33 39
Sales promotion
expenses 242 196 46 23
Freight and
forwarding charges 1,832 1,638 194 12
Change in
inventory of work-
in-process and
fi nished goods 109 207 (98) (47)
Others(*) 901 822 79 10
Total 4,561 4,136 425 10
(*) - Others include insurance charges, rent, professional fees,
hedging costs, travelling expense, provision for doubtful
debts and advances, directors’ fees/commission and other
expenses.
Comments:
The other manufacturing expenses during the year ended
31st March, 2014 have increased by ` 425 crore compared to
corresponding period in the Previous Year (PY) primarily due to:
a. Higher stores, spare parts and consumables (higher at India,
TCE+TCML, TCNA), Higher repairs (higher at TCE due to
number of shutdown, plant failure and TCNA) royalty, rates
and taxes (higher at TCNA due to increase in royalty tax),
commission, discounts and distributors’ service charges
(higher at Rallis), sales promotion expenses (higher at Rallis
and salt business), freight and forwarding expenses (due to
higher freight charges and increase in export at TCNA and
higher volumes at IMACID and Rallis), appreciating USD
and GBP rates and other expenses off set by reduction in
hedging and MTM cost at TCL.
b. Movement in inventory change (WIP and fi nished goods)
is primarily on account of increase in stock levels in case
of Indian operation (traded DAP and traded MOP) during
period ended 31st March, 2014 as compared to decrease
in stock level during the corresponding period.
7. Finance Costs:
(` in crore)
Entity FY 2013-14 FY 2012-13 Change % Change
Tata Chemicals
Limited 185 203 (18) (9)
Tata Chemicals
Europe and Tata
Chemicals Africa 193 144 49 34
Tata Chemicals
North America Inc 162 102 60 59
Rallis India Ltd. 12 18 (6) (34)
Others and
Eliminations 27 (3) 30 -
Total 579 464 115 25
Comments:
The increase / decrease in Finance costs is mainly due to:
- TCL : Reduction in interest cost on account of repayment
of ` 240 crore NCD and USD 95 million ECB in
FY 2013-14, reduction in buyer’s credit interest cost by
` 6.11 crore off set by i) ` 2.93 crore interest on lease rent
on brine land, ii) Interest on customs duty on ammonia
` 2.03 crore.
- TCE and TCML : GBP 10 million increase in borrowing and
depreciation of GBP and USD against INR.
MANAGEMENT DISCUSSION AND ANALYSIS
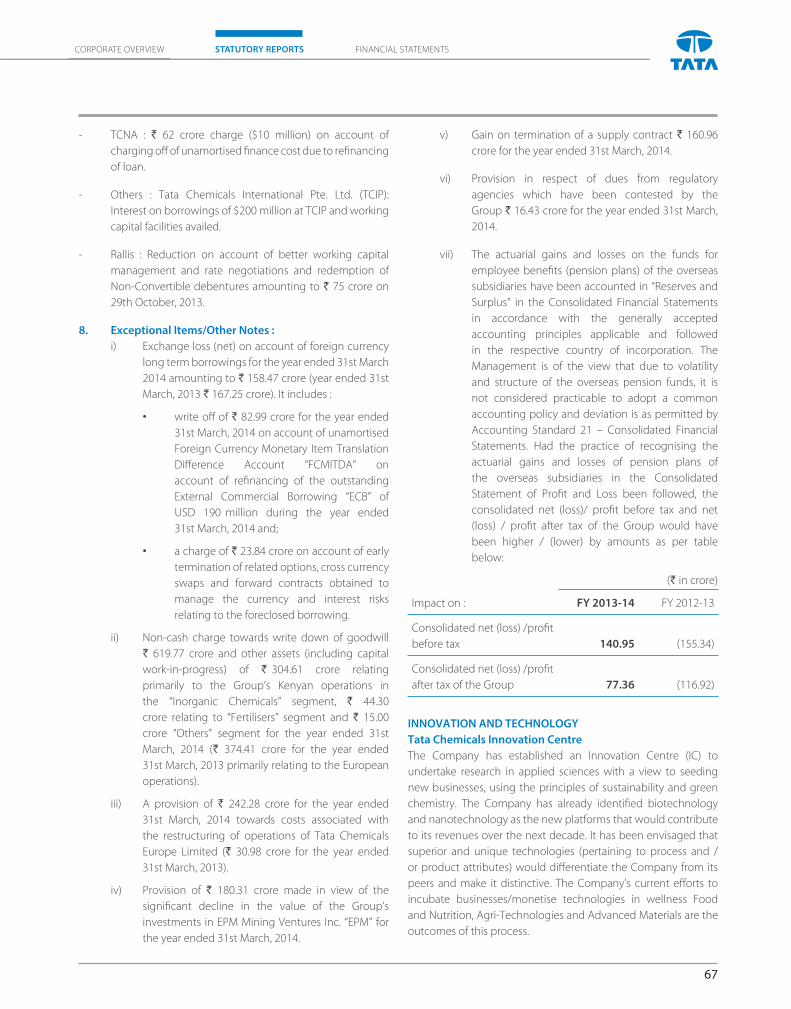
67
CORPORATE OVERVIEW FINANCIAL STATEMENTSSTATUTORY REPORTS
- TCNA : ` 62 crore charge ($10 million) on account of
charging off of unamortised fi nance cost due to refi nancing
of loan.
- Others : Tata Chemicals International Pte. Ltd. (TCIP):
Interest on borrowings of $200 million at TCIP and working
capital facilities availed.
- Rallis : Reduction on account of better working capital
management and rate negotiations and redemption of
Non-Convertible debentures amounting to ` 75 crore on
29th October, 2013.
8. Exceptional Items/Other Notes :
i) Exchange loss (net) on account of foreign currency
long term borrowings for the year ended 31st March
2014 amounting to ` 158.47 crore (year ended 31st
March, 2013 ` 167.25 crore). It includes :
• write off of ` 82.99 crore for the year ended
31st March, 2014 on account of unamortised
Foreign Currency Monetary Item Translation
Diff erence Account “FCMITDA” on
account of refi nancing of the outstanding
External Commercial Borrowing “ECB” of
USD 190 million during the year ended
31st March, 2014 and;
• a charge of ` 23.84 crore on account of early
termination of related options, cross currency
swaps and forward contracts obtained to
manage the currency and interest risks
relating to the foreclosed borrowing.
ii) Non-cash charge towards write down of goodwill
` 619.77 crore and other assets (including capital
work-in-progress) of ` 304.61 crore relating
primarily to the Group’s Kenyan operations in
the “Inorganic Chemicals” segment, ` 44.30
crore relating to “Fertilisers” segment and ` 15.00
crore “Others” segment for the year ended 31st
March, 2014 (` 374.41 crore for the year ended
31st March, 2013 primarily relating to the European
operations).
iii) A provision of ` 242.28 crore for the year ended
31st March, 2014 towards costs associated with
the restructuring of operations of Tata Chemicals
Europe Limited (` 30.98 crore for the year ended
31st March, 2013).
iv) Provision of ` 180.31 crore made in view of the
signifi cant decline in the value of the Group’s
investments in EPM Mining Ventures Inc. “EPM” for
the year ended 31st March, 2014.
v) Gain on termination of a supply contract ` 160.96
crore for the year ended 31st March, 2014.
vi) Provision in respect of dues from regulatory
agencies which have been contested by the
Group ` 16.43 crore for the year ended 31st March,
2014.
vii) The actuarial gains and losses on the funds for
employee benefi ts (pension plans) of the overseas
subsidiaries have been accounted in “Reserves and
Surplus” in the Consolidated Financial Statements
in accordance with the generally accepted
accounting principles applicable and followed
in the respective country of incorporation. The
Management is of the view that due to volatility
and structure of the overseas pension funds, it is
not considered practicable to adopt a common
accounting policy and deviation is as permitted by
Accounting Standard 21 – Consolidated Financial
Statements. Had the practice of recognising the
actuarial gains and losses of pension plans of
the overseas subsidiaries in the Consolidated
Statement of Profi t and Loss been followed, the
consolidated net (loss)/ profi t before tax and net
(loss) / profi t after tax of the Group would have
been higher / (lower) by amounts as per table
below:
(` in crore)
Impact on : FY 2013-14 FY 2012-13
Consolidated net (loss) /profi t
before tax 140.95 (155.34)
Consolidated net (loss) /profi t
after tax of the Group 77.36 (116.92)
INNOVATION AND TECHNOLOGY
Tata Chemicals Innovation Centre
The Company has established an Innovation Centre (IC) to
undertake research in applied sciences with a view to seeding
new businesses, using the principles of sustainability and green
chemistry. The Company has already identifi ed biotechnology
and nanotechnology as the new platforms that would contribute
to its revenues over the next decade. It has been envisaged that
superior and unique technologies (pertaining to process and /
or product attributes) would diff erentiate the Company from its
peers and make it distinctive. The Company’s current eff orts to
incubate businesses/monetise technologies in wellness Food
and Nutrition, Agri-Technologies and Advanced Materials are the
outcomes of this process.
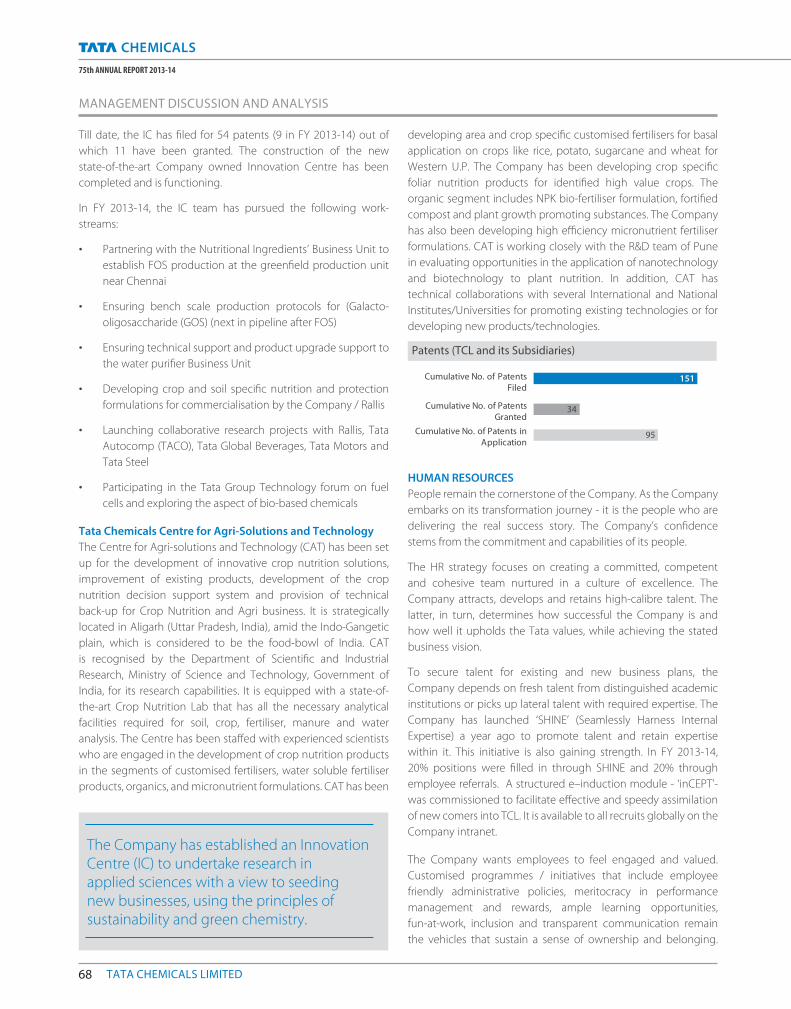
68 TATA CHEMICALS LIMITED
75th ANNUAL REPORT 2013-14
Till date, the IC has fi led for 54 patents (9 in FY 2013-14) out of
which 11 have been granted. The construction of the new
state-of-the-art Company owned Innovation Centre has been
completed and is functioning.
In FY 2013-14, the IC team has pursued the following work-
streams:
• Partnering with the Nutritional Ingredients’ Business Unit to
establish FOS production at the greenfi eld production unit
near Chennai
• Ensuring bench scale production protocols for (Galacto-
oligosaccharide (GOS) (next in pipeline after FOS)
• Ensuring technical support and product upgrade support to
the water purifi er Business Unit
• Developing crop and soil specifi c nutrition and protection
formulations for commercialisation by the Company / Rallis
• Launching collaborative research projects with Rallis, Tata
Autocomp (TACO), Tata Global Beverages, Tata Motors and
Tata Steel
• Participating in the Tata Group Technology forum on fuel
cells and exploring the aspect of bio-based chemicals
Tata Chemicals Centre for Agri-Solutions and Technology
The Centre for Agri-solutions and Technology (CAT) has been set
up for the development of innovative crop nutrition solutions,
improvement of existing products, development of the crop
nutrition decision support system and provision of technical
back-up for Crop Nutrition and Agri business. It is strategically
located in Aligarh (Uttar Pradesh, India), amid the Indo-Gangetic
plain, which is considered to be the food-bowl of India. CAT
is recognised by the Department of Scientifi c and Industrial
Research, Ministry of Science and Technology, Government of
India, for its research capabilities. It is equipped with a state-of-
the-art Crop Nutrition Lab that has all the necessary analytical
facilities required for soil, crop, fertiliser, manure and water
analysis. The Centre has been staff ed with experienced scientists
who are engaged in the development of crop nutrition products
in the segments of customised fertilisers, water soluble fertiliser
products, organics, and micronutrient formulations. CAT has been
developing area and crop specifi c customised fertilisers for basal
application on crops like rice, potato, sugarcane and wheat for
Western U.P. The Company has been developing crop specifi c
foliar nutrition products for identifi ed high value crops. The
organic segment includes NPK bio-fertiliser formulation, fortifi ed
compost and plant growth promoting substances. The Company
has also been developing high effi ciency micronutrient fertiliser
formulations. CAT is working closely with the R&D team of Pune
in evaluating opportunities in the application of nanotechnology
and biotechnology to plant nutrition. In addition, CAT has
technical collaborations with several International and National
Institutes/Universities for promoting existing technologies or for
developing new products/technologies.
Patents (TCL and its Subsidiaries)
Cumulative No. of Patents
Filed
Cumulative No. of Patents
Granted
Cumulative No. of Patents in
Application
151
1434
95
HUMAN RESOURCES
People remain the cornerstone of the Company. As the Company
embarks on its transformation journey - it is the people who are
delivering the real success story. The Company’s confi dence
stems from the commitment and capabilities of its people.
The HR strategy focuses on creating a committed, competent
and cohesive team nurtured in a culture of excellence. The
Company attracts, develops and retains high-calibre talent. The
latter, in turn, determines how successful the Company is and
how well it upholds the Tata values, while achieving the stated
business vision.
To secure talent for existing and new business plans, the
Company depends on fresh talent from distinguished academic
institutions or picks up lateral talent with required expertise. The
Company has launched ‘SHINE’ (Seamlessly Harness Internal
Expertise) a year ago to promote talent and retain expertise
within it. This initiative is also gaining strength. In FY 2013-14,
20% positions were fi lled in through SHINE and 20% through
employee referrals. A structured e–induction module - ‘inCEPT’-
was commissioned to facilitate eff ective and speedy assimilation
of new comers into TCL. It is available to all recruits globally on the
Company intranet.
The Company wants employees to feel engaged and valued.
Customised programmes / initiatives that include employee
friendly administrative policies, meritocracy in performance
management and rewards, ample learning opportunities,
fun-at-work, inclusion and transparent communication remain
the vehicles that sustain a sense of ownership and belonging.
The Company has established an Innovation Centre (IC) to undertake research in applied sciences with a view to seeding new businesses, using the principles of sustainability and green chemistry.
MANAGEMENT DISCUSSION AND ANALYSIS
69
CORPORATE OVERVIEW FINANCIAL STATEMENTSSTATUTORY REPORTS
Leveraging opportunities in new businesses and products,
the Company stimulates employee development by moving
people into new roles as part of their career progression. The
overall attrition rate stands at 4.8%. A slew of tailor-made
wellness programmes and group activities at sites provide
support in building a well-knit team. The Employee Engagement
Survey for FY 2013-14 witnessed 94% participation. The
Company‘s score is consistent at 68% while scores in other
geographies have also registered an improvement over previous
years.
The Company has always acknowledged that knowledge is a
source of competitive advantage in preparing its workforce to
overcome the challenges of the future. The Company’s Learning
and Development eff orts are being directed towards sharpening
of core competitive advantages - Operational Excellence and
Customer Centricity. Several learning initiatives are being made
available to the employees across the organisation to build
or enhance role-critical competencies through functional,
behavioural and leadership training in these areas. These include
Jagruti – for the front-line fi eld force in Agri business, Technical
Capability programmes at manufacturing sites, On-the-job projects
by Management Development Programme (MDP) members and
extensive focus on Safety Awareness initiatives. The MDP has
been redesigned to incorporate relevant inputs to equip people
in handling future challenges. During the fi scal, the Company
initiated 88 unique programmes with 13,207 workdays of training,
including the fl agship MDP programme. E-learning platforms
like Skill Soft and Harvard Manage Mentor (HMM) enable wider
participation with self-paced learning. The Company continues
to encourage and build internal faculty through its fl agship
Certifi ed Trainers’ programme named ‘Katalyst’. As many as 143
training sessions have been conducted across the country by the
internal faculty.
The knowledge management portal on the social space of
the Company has been redesigned to contribute towards
enhanced learning and sharing opportunities for its employees.
The Company values diversity of thought, inclusion, varied
backgrounds and global experiences, which collectively help it to
succeed in the long run. TCL has drawn up an integrated action
plan to promote Diversity and Affi rmative Action, in line with the
Tata Group’s LEAD programme.
The Industrial relations situation across all locations of the
Company continues to remain harmonious.
The Company’s leadership commitment to deploy Lean Six
Sigma and Operational Excellence has helped drive employee
productivity and large scale process improvements across
geographies. The Company has a well-defi ned mitigation
programme to address HR related risks.
The Company would also like to thank its workforce and
employee representatives for their commitment and constructive
cooperation during the past year.
Manpower Strength as on 31st March 2014
476435
5423,113
Tata Chemicals Europe
Tata Chemicals Magadi
Tata Chemicals North America
TCL-India
SUSTAINABILITY
Business Responsibility Report (BRR)
Vide its circular dated 13th August, 2012, the Securities
and Exchange Board of India (SEBI) introduced Clause 55
of the Listing Agreement which mandates the inclusion of
BRR as a part of the Annual Report for top 100 listed entities,
based on their market capitalisation on BSE Limited and the
National Stock Exchange of India Limited as on 31st March, 2012.
Although the Company was not part of the top 100 listed
entities as on 31st March, 2012, it has decided, as a
Responsible Corporate Citizen, to voluntarily prepare the
BRR as per the format prescribed by SEBI. In accordance with
the press release and FAQs dated 10th May, 2013 issued by
SEBI, the Company’s BRR will be hosted on its website www.
tatachemicals.com. Any Shareholder interested in obtaining
a physical copy of the same may write to the General
Counsel & Company Secretary at the Registered Offi ce of
the Company.
Sustainability Reporting
The Company is conscious of its role as a Responsible
Corporate Citizen and adheres to the norms of Corporate
Governance. The Company has published a Sustainability
Report since 2003, which is externally assured and in the public
domain from 2006. The Company plans to come out with the
Sustainability Report FY 2013-14 shortly. This report will be
based on the GRI G4 guidelines covering the core indicators. The
Company’s Sustainability Report can be viewed on its website
www.tatachemicals.com.
Community Satisfaction Index - TCL India
4.22013-14
2009-10 3.8
In FY 2013-14, 20% positions were fi lled by internal talent, 20% were fi lled in through employee referrals.
70 TATA CHEMICALS LIMITED
75th ANNUAL REPORT 2013-14
United Nations Global Compact (UNGC)
The Global Compact requires businesses to adhere to ten
principles in the areas of human rights, labour standards,
environment and anti-bribery. The Company has been preparing
the “Communication on Progress” (COP) from 2005 as per the
Global Compact Initiative taken up by the Secretary General of
the United Nations. The Company continues its commitment to
the UN Global Compact and will submit its COP on the ten UNGC
principles for the current year. The details of the UNGC COP can
be viewed on www.unglobalcompact.org and the Company‘s
website www.tatachemicals.com.
Carbon Disclosure Project (CDP)
The Carbon Disclosure Project (CDP) is an international, not-for-
profi t organisation providing a global system for companies and
cities to measure, disclose, manage and share vital environment
related information. It works to transform the way the world does
business to mitigate the eff ects of climate change and protect
our natural resources. The Company is responding to CDP since
FY 2008-09 for Climate Change and is consistently maintaining
its position under the Carbon Disclosure Leadership Index (CDLI)
since FY 2010-11. The Company has also started CDP Water
reporting from FY 2012-13.
Enterprise Specifi c Emission (Tonnes CO2 / Tonne Products)
0.6892013-14
2010-11 0.678
SAFETY AND HEALTH
Safety is one of the core values and the Company is committed
to continually improve the safety performance by targeting Zero
Harm, through world class safety practices. For exclusive oversight
on Safety, Health, Environment (SHE) and Sustainability aspect, the
Company has formed a Board level Committee – Safety, Health,
Environment and Sustainability (SHES) Committee (now known
as CSR, Safety and Sustainability Committee). The Board provides
valuable direction and guidance to the Management to ensure
that SHES implications are duly addressed in all new strategic
initiatives, budgets, audit actions and improvement plans. The
senior leadership plays a critical role in encouraging positive
attitudes towards safety and help in creating an environment that
fosters safety culture, by establishing clear and transparent policies
like SHE Policy, Cardinal Rules of Safety, TataChem Golden Rules
of Safety, etc. The Company has adopted voluntary standards like
Responsible Care, OHSAS, British Safety Council guidelines, AIChE-
CCPS Guidelines, to ensure continual improvement in the SHE
performance.
Senior managers seek to demonstrate eff ective safety and health
leadership from line functions and have integrated the same with
their responsibilities and daily duties. Reward and Recognition
schemes are in place for safety.
Regular health check-ups tailored as per work area hazards are
carried out to monitor all aspects of health including occupational
parameters. Employees working in hazardous areas undergo
health check-ups twice a year while others undergo the same
once a year. Ergonomic surveys are conducted from time to time.
The Company has continuously promoted a safe and fair
workplace. A “Prevention of Sexual Harassment” (POSH) at
workplace policy in line with the statutory requirement is put
in place along with the required redressal mechanism. Various
training and awareness programs are conducted across the
organisation in order to sensitise the employees to needs and
concerns of women employees and the POSH policy.
During the year, the Company received one complaint on sexual
harassment which was resolved. Appropriate actions were taken
in terms of improvement of policy and administration department
support to make business travel better for women employees.
Five workshops/awareness programs against sexual harassment
were carried out during the year.
INTERNAL CONTROLS AND RISK MANAGEMENT
The Company has robust systems for internal audit, risk
assessment and mitigation and has an independent Internal
Audit Department with well-established internal control and
risk management processes both at the business and corporate
levels. The Head of Audit and Risk Management reports directly to
the Chairman of the Audit Committee of the Board of Directors,
which ensures process independence.
The Corporate Audit function plays a key role in providing to both
the operating management and to the Audit Committee of the
Board, an objective view and reassurance of the overall control
systems and eff ectiveness of the Risk Management processes
across the Company and its subsidiaries. Corporate Audit also
assesses opportunities for improvement in business processes,
systems and controls and provides recommendations designed
to add value to the operations.
The scope and authority of the Corporate Audit Department is
derived from the Audit Charter approved by the Audit Committee.
Internal Audits are performed by an in-house team of multi-
disciplinary professionals comprising Chartered Accountants and
Engineers. Reviews are conducted on an on-going basis, based
on a comprehensive risk-based audit plan, which is approved by
MANAGEMENT DISCUSSION AND ANALYSIS
The Company is committed to continually improve the safety performance by targeting Zero Harm, through world class safety practices.
71
CORPORATE OVERVIEW FINANCIAL STATEMENTSSTATUTORY REPORTS
the Audit Committee at the beginning of the year. The internal
audit department which operates on a decentralised basis
continuously monitors the adequacy and eff ectiveness of the
internal control environment across the Company and the status
of compliance with operating systems, internal policies and
regulatory requirements.
The Audit Committee meets on a quarterly basis to review and
discuss the reports submitted by the Head of Audit and Risk
Management and also review closure of all agreed actions. The
Audit Committee also meets the Statutory Auditors separately to
ascertain their views on the adequacy and effi ciency of the internal
control systems. A peer review of the Internal Audit function
is conducted once every four years to assess the qualitative
eff ectiveness of internal audits, with reference to standards and
best practices.
The Company believes that every employee has a role to play
in fostering an environment in which controls, assurance,
accountability and ethical behaviour are accorded high
importance. To supplement the reviews carried out by the Internal
Audit teams, the Company follows an elaborate system of Control
Self Assurance (CSA) (self-audit) which is carried out during the
year. The CSA coverage includes all critical departments in the
organisation.
The IT enabled CSA process provides a good bottom-up approach
and build up for the CEO/CFO certifi cation as required by Clause
49 of the Listing Agreement, besides helping in awareness
creation of controls across a wide segment of the Company
employees. This complements the Internal Audits conducted to
ensure total coverage during a year.
Risk Management and Internal Audit functions complement
each other. Over the years, the Enterprise Risk Management
(ERM) process has evolved into a robust exercise entailing a
balanced bottom up and top down approach covering all
units, functions and departments of the Company and its
subsidiaries. The basic framework followed is the international
standard AS/NZS 4360:1999. The Risk Management process is
also benchmarked periodically against available standards such
as ISO 31000.
The Company’s risk identifi cation and assessment process is
dynamic and hence it has been able to identify, monitor and
mitigate the most relevant strategic and operational risks, both
during periods of accelerated growth and recessionary pressures.
BUSINESS EXCELLENCE
The Company remains committed to continually raise the bar
on performance in all aspects of the business. The Tata Business
Excellence Model (TBEM) serves as a pivotal framework that
allows the Company to gain insights into its performance and
establish continuous improvement initiatives for attaining
superior business results and maximising satisfaction and value
to our customers. The TBEM framework covers six core aspects
of the business: Leadership; Strategic planning; Customer focus;
Measurement, Analysis and Knowledge Management; Workforce
focus and Process Management. For a Global organisation which
has its manufacturing operations spread across four continents,
with diverse business segments and employees from diff erent
cultures, TBEM serves as a platform to establish a common
standard of excellence.
The Company participates annually in the Tata Group level
TBEM assessments, which provide valuable inputs into the
strengths and areas of focus for the Company to strengthen the
culture of excellence. In the recently concluded assessment, the
Company achieved the standard of Emerging Industry Leader.
The Company believes that the continued emphasis on TBEM
will provide the thrust as it progresses towards becoming a world
class organisation.
Cautionary statementStatements in the Management Discussion and Analysis describing
the objectives, projections, estimates and expectations of the
Company, its direct and indirect subsidiaries and its associates, may be
‘forward looking statements’ within the meaning of applicable laws
and regulations. Actual results might diff er substantially or materially
from those expressed or implied. Important factors that could make
a diff erence to the Company’s operations include, among others,
economic conditions aff ecting demand / supply, price conditions in
the domestic and overseas markets in which the Company operates,
changes in Government regulations, tax laws, and other statutes and
incidental factors.
In FY 2013-14, the Company achieved the standard of ‘‘Emerging Industry Leader‘‘ in the Tata Business Excellence Model Assessment.
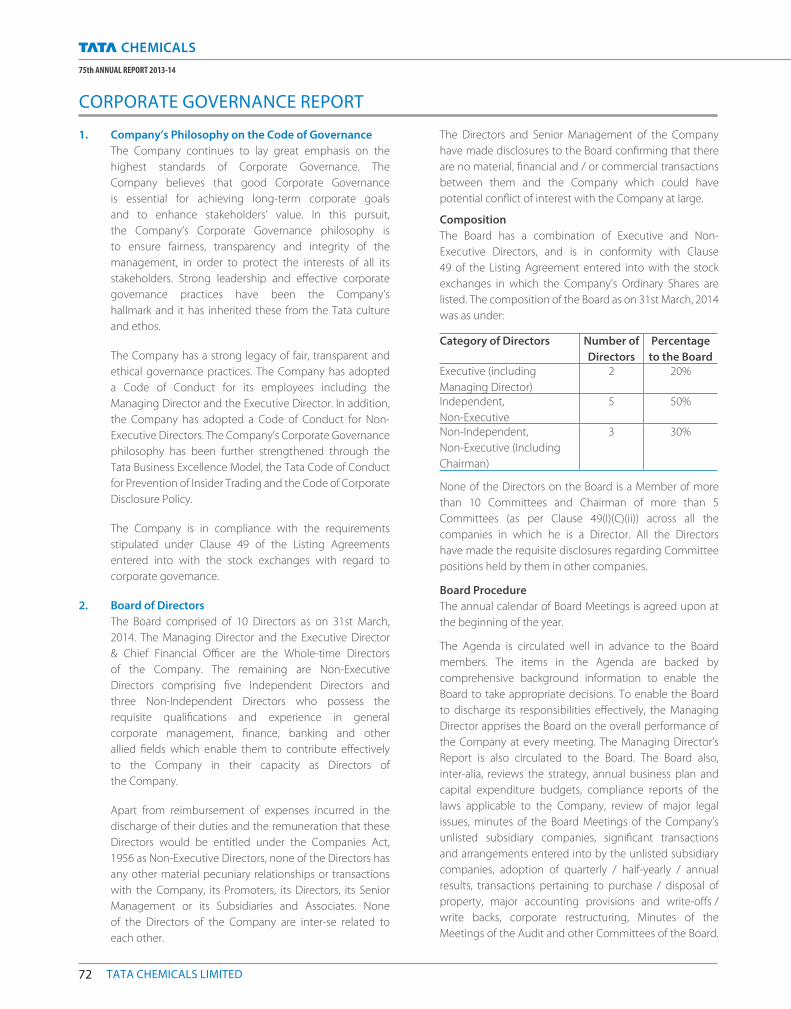
72 TATA CHEMICALS LIMITED
75th ANNUAL REPORT 2013-14
1. Company’s Philosophy on the Code of Governance
The Company continues to lay great emphasis on the
highest standards of Corporate Governance. The
Company believes that good Corporate Governance
is essential for achieving long-term corporate goals
and to enhance stakeholders’ value. In this pursuit,
the Company’s Corporate Governance philosophy is
to ensure fairness, transparency and integrity of the
management, in order to protect the interests of all its
stakeholders. Strong leadership and eff ective corporate
governance practices have been the Company’s
hallmark and it has inherited these from the Tata culture
and ethos.
The Company has a strong legacy of fair, transparent and
ethical governance practices. The Company has adopted
a Code of Conduct for its employees including the
Managing Director and the Executive Director. In addition,
the Company has adopted a Code of Conduct for Non-
Executive Directors. The Company’s Corporate Governance
philosophy has been further strengthened through the
Tata Business Excellence Model, the Tata Code of Conduct
for Prevention of Insider Trading and the Code of Corporate
Disclosure Policy.
The Company is in compliance with the requirements
stipulated under Clause 49 of the Listing Agreements
entered into with the stock exchanges with regard to
corporate governance.
2. Board of Directors
The Board comprised of 10 Directors as on 31st March,
2014. The Managing Director and the Executive Director
& Chief Financial Offi cer are the Whole-time Directors
of the Company. The remaining are Non-Executive
Directors comprising fi ve Independent Directors and
three Non-Independent Directors who possess the
requisite qualifications and experience in general
corporate management, finance, banking and other
allied fields which enable them to contribute eff ectively
to the Company in their capacity as Directors of
the Company.
Apart from reimbursement of expenses incurred in the
discharge of their duties and the remuneration that these
Directors would be entitled under the Companies Act,
1956 as Non-Executive Directors, none of the Directors has
any other material pecuniary relationships or transactions
with the Company, its Promoters, its Directors, its Senior
Management or its Subsidiaries and Associates. None
of the Directors of the Company are inter-se related to
each other.
The Directors and Senior Management of the Company
have made disclosures to the Board confirming that there
are no material, financial and / or commercial transactions
between them and the Company which could have
potential conflict of interest with the Company at large.
Composition
The Board has a combination of Executive and Non-
Executive Directors, and is in conformity with Clause
49 of the Listing Agreement entered into with the stock
exchanges in which the Company’s Ordinary Shares are
listed. The composition of the Board as on 31st March, 2014
was as under:
Category of Directors Number of
Directors
Percentage
to the BoardExecutive (including
Managing Director)
2 20%
Independent,
Non-Executive
5 50%
Non-Independent,
Non-Executive (Including
Chairman)
3 30%
None of the Directors on the Board is a Member of more
than 10 Committees and Chairman of more than 5
Committees (as per Clause 49(I)(C)(ii)) across all the
companies in which he is a Director. All the Directors
have made the requisite disclosures regarding Committee
positions held by them in other companies.
Board Procedure
The annual calendar of Board Meetings is agreed upon at
the beginning of the year.
The Agenda is circulated well in advance to the Board
members. The items in the Agenda are backed by
comprehensive background information to enable the
Board to take appropriate decisions. To enable the Board
to discharge its responsibilities eff ectively, the Managing
Director apprises the Board on the overall performance of
the Company at every meeting. The Managing Director’s
Report is also circulated to the Board. The Board also,
inter-alia, reviews the strategy, annual business plan and
capital expenditure budgets, compliance reports of the
laws applicable to the Company, review of major legal
issues, minutes of the Board Meetings of the Company’s
unlisted subsidiary companies, significant transactions
and arrangements entered into by the unlisted subsidiary
companies, adoption of quarterly / half-yearly / annual
results, transactions pertaining to purchase / disposal of
property, major accounting provisions and write-off s /
write backs, corporate restructuring, Minutes of the
Meetings of the Audit and other Committees of the Board.
CORPORATE GOVERNANCE REPORT
73
CORPORATE OVERVIEW FINANCIAL STATEMENTSSTATUTORY REPORTS
In addition to the information required under Annexure
IA to Clause 49 of the Listing Agreement, the Board is also
kept informed of major events and approvals are taken
wherever necessary.
Meetings held
The Board met 6 (six times) on the following dates during
the Financial Year (FY) 2013-14.
27th May, 2013 5th December, 2013
5th August, 2013 3rd February, 2014
11th November, 2013 24th March, 2014
The gap between two Meetings did not exceed four
months.
The Seventy-Fourth Annual General Meeting (AGM) of the
Company was held on 26th August, 2013.
Category and Attendance of Directors
The names and categories of the Directors on the Board,
their attendance at Board Meetings held during the
financial year 2013-14 and at the last AGM, as also the
number of Directorships and Committee positions held by
them in other public limited companies as on 31st March,
2014 are as follows:
Name of the Director Category No. of Board
Meetings
attended during
the FY
2013-14
Whether
attended
AGM held
on 26th
August,
2013
Number of Directorships
in other public limited
companies*
Number of Committee
positions held in
other public limited
companies**
Chairman of
the Board
Board
Member
Chairman
of the
Committee
Committee
Member
Mr. Cyrus P. Mistry
(Chairman)
DIN-00010178
Non-Independent
Non-Executive
6 Yes 9 - 1 -
Mr. R. Gopalakrishnan
(Vice-Chairman)
DIN-00027858
Non-Independent
Non-Executive
6 Yes 4 5 - 2
Mr. Nusli N. Wadia
DIN-00015731
Independent, Non-Executive 5 No 4 3 - -
Mr. Prasad R. Menon
DIN-00005078
Non-Independent
Non-Executive
4 Yes 2 5 1 3
Mr. Nasser Munjee
DIN-00010180
Independent, Non-Executive 5 Yes 2 9 4 3
Dr. Yoginder K. Alagh @
DIN-00244686
Independent, Non-Executive 4 Yes - - - -
Mr. E.A. Kshirsagar
DIN-00121824
Independent, Non-Executive 6 Yes - 6 4 3
Dr. Y.S.P. Thorat
DIN-02652734
Independent, Non-Executive 5 Yes 1 5 2 2
Dr. Vijay Kelkar
DIN-00011991
Independent, Non-Executive 5 Yes 1 6 1 3
Mr. R. Mukundan
DIN-00778233
Managing Director 6 Yes - 3 - -
Mr. P. K. Ghose
DIN-00034945
Executive Director & CFO 6 Yes - 4 2 2
Notes:
* Excludes Directorships in associations, private, foreign companies, companies registered under Section 25 of the Companies Act, 1956 and Government Bodies.
** Represents Chairmanships / Memberships of Audit Committee and Stakeholders Relationship Committee (Erstwhile Shareholders’/ Investors’ Grievance Committee).
@ Retired as a Director with eff ect from 14th February, 2014 pursuant to the Company‘s Retirement Policy for Directors.
74 TATA CHEMICALS LIMITED
75th ANNUAL REPORT 2013-14
Appointment / Reappointment of Directors
Details of the Directors seeking appointment / re-appointment
at the AGM, pursuant to Clause 49 of the Listing Agreement,
have been given along with the Notice of AGM.
Code of Conduct
Whilst the Tata Code of Conduct is applicable to the
Whole-time Directors and employees of the Company,
the Board has also adopted a Code of Conduct for Non-
Executive Directors, both of which are available on the
Company‘s website. All the Board members and Senior
Management of the Company as on 31st March, 2014
have affi rmed compliance with their respective Codes of
Conduct. A Declaration to this eff ect, duly signed by the
Managing Director, forms part of this report.
Shareholding of Non-Executive / Executive Director as
on 31st March, 2014 is as under:
Name No. of
Ordinary
shares held
% of Paid-up
Capital
Mr. R. Gopalakrishnan
(Vice-Chairman)
15,000 0.01%
Mr. R. Mukundan
(Managing Director)
500 0.00%
3. Audit Committee
The Committee comprises Mr. Nasser Munjee, Mr. R.
Gopalakrishnan, Dr. Y. S. P. Thorat and Mr. E. A. Kshirsagar.
The Company Secretary is the Secretary to the Committee.
Mr. Nasser Munjee is an eminent Economist and leading
banker. All the members of the Committee have wide
exposure and possess sound knowledge in the area
of accounts, finance, audit, internal controls, etc. The
composition of the Committee is in conformity with Clause
49 (II) (A) of the Listing Agreement.
Mr. Nasser Munjee, Chairman of the Audit Committee, was
present at the last AGM held on 26th August, 2013.
Terms of Reference
The terms of reference of the Audit Committee, inter-alia,
are:
1. Review of the Company’s accounting policies,
internal accounting controls, fi nancial and risk
management policies.
2. Oversight of the Company’s fi nancial reporting
process and disclosure of its fi nancial information.
3. Discuss and review, with the management and
auditors, the annual / quarterly fi nancial statements
before submission to the Board.
4. Hold timely discussions with external auditors
regarding critical accounting policies and practices,
signifi cant reporting issues and judgements made,
nature and scope of audit, etc. and evaluate auditors’
performance, qualifi cation and independence.
5. Recommend to the Board, the appointment, re-
appointment, removal of the external auditors,
fi xation of audit fees and also approval for payment
for audit and non-audit services.
6. Review the adequacy of internal audit and risk
management function.
7. Review the adequacy of internal control systems
and ensure adherence thereto.
8. Review the Company’s compliance with the legal and
regulatory requirements and the Tata Code of Conduct
and eff ectiveness of the system for monitoring.
9. Review the Company’s arrangements for its
employees to raise concerns about possible
wrongdoing in fi nancial reporting, accounting,
auditing or other related matters.
10. Review the signifi cant related party transactions
submitted by the management.
11. Discuss with the management, the Company’s
policies with respect to risk assessment and risk
management.
Generally all items listed in Clause 49 II (D) of the Listing
Agreement are covered in the terms of reference. The
Audit Committee has been granted powers as prescribed
under Clause 49 II (C).
The Managing Director, Executive Director & CFO, External
Auditors, Head-Internal Audit and Risk Management and Vice
President & Group Corporate Controller attend and participate
at all the meetings of the Committee. The Committee from
time to time also invites such of the executives, as it considers
appropriate, to be present at the meetings.
During the year, the Committee reviewed the key audit
findings covering operational, financial and compliance
areas and the risk mitigation plans were presented to the
Committee. The Chairman of the Audit Committee briefs
the Board about the significant discussions at the Audit
Committee meetings.
Meetings held
During the FY 2013-14, 7 (seven) Audit Committee
meetings were held on the following dates:
24th May, 2013 3rd February, 2014
2nd August, 2013 6th February, 2014
17th October, 2013 26th February, 2014
8th November, 2013
CORPORATE GOVERNANCE REPORT
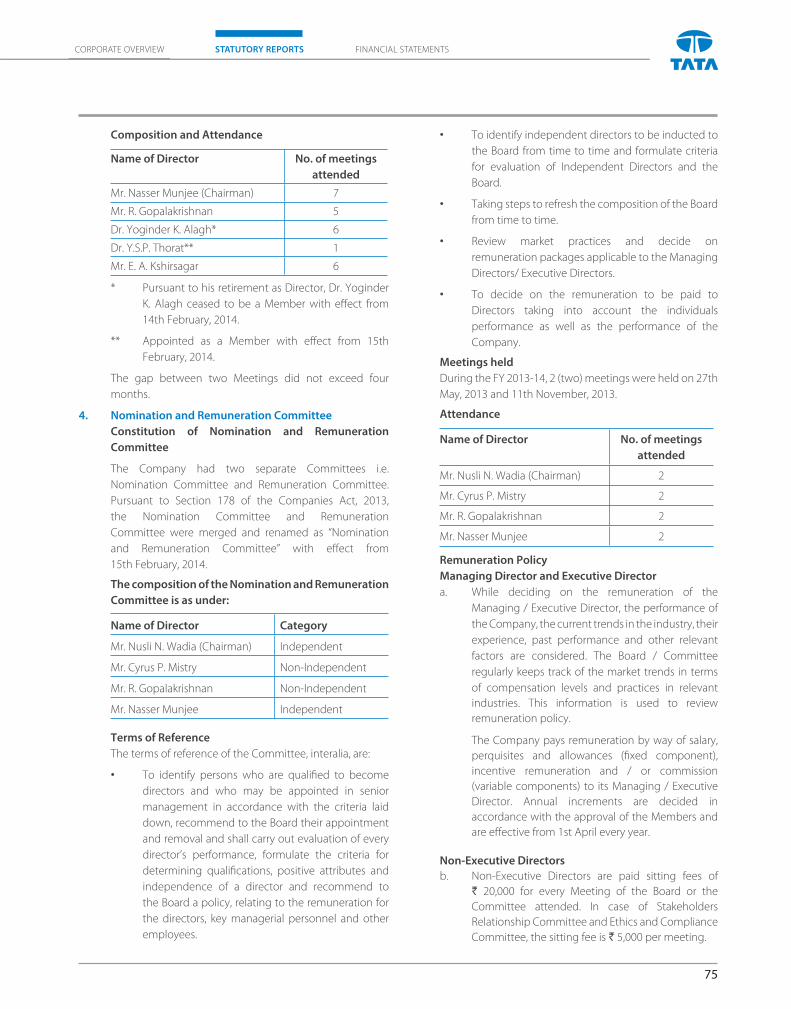
75
CORPORATE OVERVIEW FINANCIAL STATEMENTSSTATUTORY REPORTS
Composition and Attendance
Name of Director No. of meetings
attended
Mr. Nasser Munjee (Chairman) 7
Mr. R. Gopalakrishnan 5
Dr. Yoginder K. Alagh* 6
Dr. Y.S.P. Thorat** 1
Mr. E. A. Kshirsagar 6
* Pursuant to his retirement as Director, Dr. Yoginder
K. Alagh ceased to be a Member with eff ect from
14th February, 2014.
** Appointed as a Member with eff ect from 15th
February, 2014.
The gap between two Meetings did not exceed four
months.
4. Nomination and Remuneration Committee
Constitution of Nomination and Remuneration
Committee
The Company had two separate Committees i.e.
Nomination Committee and Remuneration Committee.
Pursuant to Section 178 of the Companies Act, 2013,
the Nomination Committee and Remuneration
Committee were merged and renamed as “Nomination
and Remuneration Committee” with eff ect from
15th February, 2014.
The composition of the Nomination and Remuneration
Committee is as under:
Name of Director Category
Mr. Nusli N. Wadia (Chairman) Independent
Mr. Cyrus P. Mistry Non-Independent
Mr. R. Gopalakrishnan Non-Independent
Mr. Nasser Munjee Independent
Terms of Reference
The terms of reference of the Committee, interalia, are:
• To identify persons who are qualifi ed to become
directors and who may be appointed in senior
management in accordance with the criteria laid
down, recommend to the Board their appointment
and removal and shall carry out evaluation of every
director’s performance, formulate the criteria for
determining qualifi cations, positive attributes and
independence of a director and recommend to
the Board a policy, relating to the remuneration for
the directors, key managerial personnel and other
employees.
• To identify independent directors to be inducted to
the Board from time to time and formulate criteria
for evaluation of Independent Directors and the
Board.
• Taking steps to refresh the composition of the Board
from time to time.
• Review market practices and decide on
remuneration packages applicable to the Managing
Directors/ Executive Directors.
• To decide on the remuneration to be paid to
Directors taking into account the individuals
performance as well as the performance of the
Company.
Meetings held
During the FY 2013-14, 2 (two) meetings were held on 27th
May, 2013 and 11th November, 2013.
Attendance
Name of Director No. of meetings
attended
Mr. Nusli N. Wadia (Chairman) 2
Mr. Cyrus P. Mistry 2
Mr. R. Gopalakrishnan 2
Mr. Nasser Munjee 2
Remuneration Policy
Managing Director and Executive Director
a. While deciding on the remuneration of the
Managing / Executive Director, the performance of
the Company, the current trends in the industry, their
experience, past performance and other relevant
factors are considered. The Board / Committee
regularly keeps track of the market trends in terms
of compensation levels and practices in relevant
industries. This information is used to review
remuneration policy.
The Company pays remuneration by way of salary,
perquisites and allowances (fixed component),
incentive remuneration and / or commission
(variable components) to its Managing / Executive
Director. Annual increments are decided in
accordance with the approval of the Members and
are eff ective from 1st April every year.
Non-Executive Directors
b. Non-Executive Directors are paid sitting fees of
` 20,000 for every Meeting of the Board or the
Committee attended. In case of Stakeholders
Relationship Committee and Ethics and Compliance
Committee, the sitting fee is ` 5,000 per meeting.
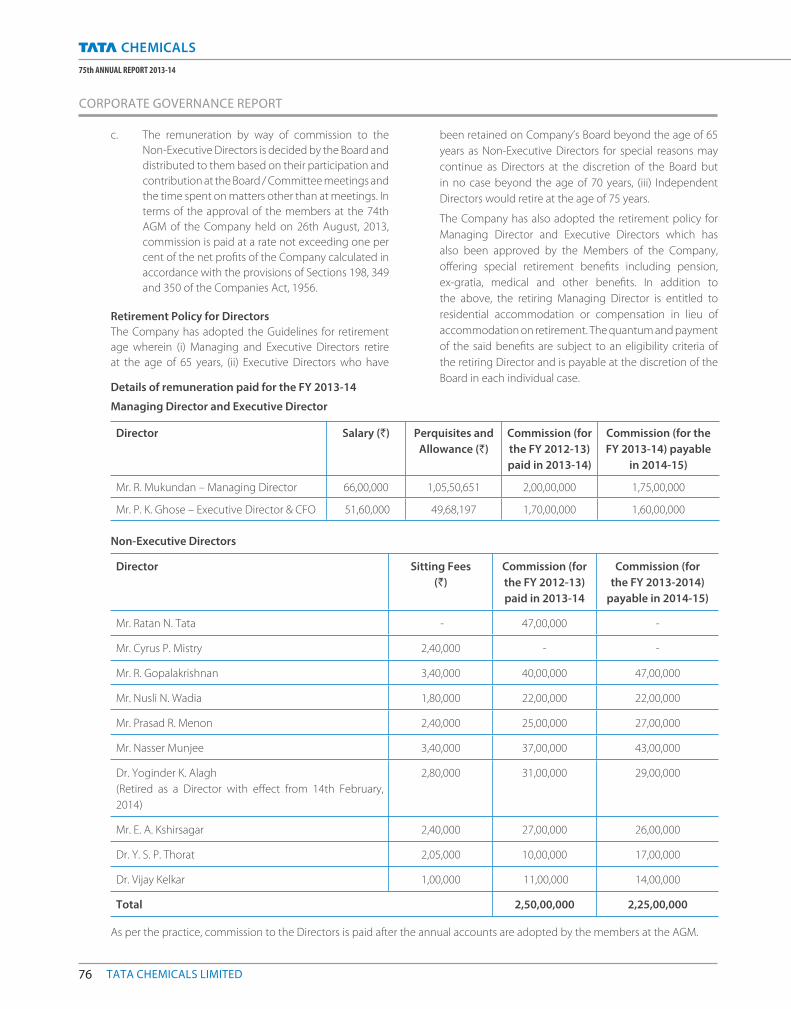
76 TATA CHEMICALS LIMITED
75th ANNUAL REPORT 2013-14
c. The remuneration by way of commission to the
Non-Executive Directors is decided by the Board and
distributed to them based on their participation and
contribution at the Board / Committee meetings and
the time spent on matters other than at meetings. In
terms of the approval of the members at the 74th
AGM of the Company held on 26th August, 2013,
commission is paid at a rate not exceeding one per
cent of the net profits of the Company calculated in
accordance with the provisions of Sections 198, 349
and 350 of the Companies Act, 1956.
Retirement Policy for Directors
The Company has adopted the Guidelines for retirement
age wherein (i) Managing and Executive Directors retire
at the age of 65 years, (ii) Executive Directors who have
CORPORATE GOVERNANCE REPORT
been retained on Company’s Board beyond the age of 65
years as Non-Executive Directors for special reasons may
continue as Directors at the discretion of the Board but
in no case beyond the age of 70 years, (iii) Independent
Directors would retire at the age of 75 years.
The Company has also adopted the retirement policy for
Managing Director and Executive Directors which has
also been approved by the Members of the Company,
off ering special retirement benefits including pension,
ex-gratia, medical and other benefits. In addition to
the above, the retiring Managing Director is entitled to
residential accommodation or compensation in lieu of
accommodation on retirement. The quantum and payment
of the said benefits are subject to an eligibility criteria of
the retiring Director and is payable at the discretion of the
Board in each individual case. Details of remuneration paid for the FY 2013-14
Managing Director and Executive Director
Director Salary (`) Perquisites and
Allowance (`)
Commission (for
the FY 2012-13)
paid in 2013-14)
Commission (for the
FY 2013-14) payable
in 2014-15)
Mr. R. Mukundan – Managing Director 66,00,000 1,05,50,651 2,00,00,000 1,75,00,000
Mr. P. K. Ghose – Executive Director & CFO 51,60,000 49,68,197 1,70,00,000 1,60,00,000
Non-Executive Directors
Director Sitting Fees
(`)
Commission (for
the FY 2012-13)
paid in 2013-14
Commission (for
the FY 2013-2014)
payable in 2014-15)
Mr. Ratan N. Tata - 47,00,000 -
Mr. Cyrus P. Mistry 2,40,000 - -
Mr. R. Gopalakrishnan 3,40,000 40,00,000 47,00,000
Mr. Nusli N. Wadia 1,80,000 22,00,000 22,00,000
Mr. Prasad R. Menon 2,40,000 25,00,000 27,00,000
Mr. Nasser Munjee 3,40,000 37,00,000 43,00,000
Dr. Yoginder K. Alagh
(Retired as a Director with eff ect from 14th February,
2014)
2,80,000 31,00,000 29,00,000
Mr. E. A. Kshirsagar 2,40,000 27,00,000 26,00,000
Dr. Y. S. P. Thorat 2,05,000 10,00,000 17,00,000
Dr. Vijay Kelkar 1,00,000 11,00,000 14,00,000
Total 2,50,00,000 2,25,00,000
As per the practice, commission to the Directors is paid after the annual accounts are adopted by the members at the AGM.
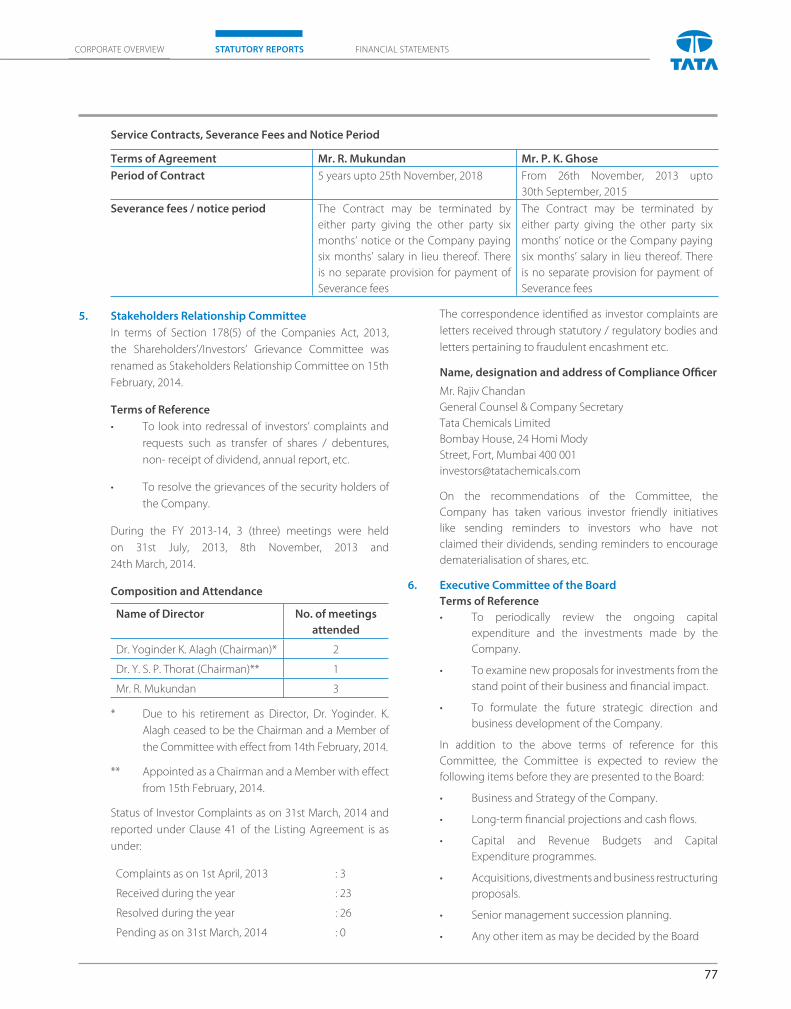
77
CORPORATE OVERVIEW FINANCIAL STATEMENTSSTATUTORY REPORTS
Service Contracts, Severance Fees and Notice Period
Terms of Agreement Mr. R. Mukundan Mr. P. K. Ghose
Period of Contract 5 years upto 25th November, 2018 From 26th November, 2013 upto
30th September, 2015
Severance fees / notice period The Contract may be terminated by
either party giving the other party six
months’ notice or the Company paying
six months’ salary in lieu thereof. There
is no separate provision for payment of
Severance fees
The Contract may be terminated by
either party giving the other party six
months’ notice or the Company paying
six months’ salary in lieu thereof. There
is no separate provision for payment of
Severance fees
5. Stakeholders Relationship Committee
In terms of Section 178(5) of the Companies Act, 2013,
the Shareholders’/Investors’ Grievance Committee was
renamed as Stakeholders Relationship Committee on 15th
February, 2014.
Terms of Reference
• To look into redressal of investors’ complaints and
requests such as transfer of shares / debentures,
non- receipt of dividend, annual report, etc.
• To resolve the grievances of the security holders of
the Company.
During the FY 2013-14, 3 (three) meetings were held
on 31st July, 2013, 8th November, 2013 and
24th March, 2014.
Composition and Attendance
Name of Director No. of meetings
attended
Dr. Yoginder K. Alagh (Chairman)* 2
Dr. Y. S. P. Thorat (Chairman)** 1
Mr. R. Mukundan 3
* Due to his retirement as Director, Dr. Yoginder. K.
Alagh ceased to be the Chairman and a Member of
the Committee with eff ect from 14th February, 2014.
** Appointed as a Chairman and a Member with eff ect
from 15th February, 2014.
Status of Investor Complaints as on 31st March, 2014 and
reported under Clause 41 of the Listing Agreement is as
under:
Complaints as on 1st April, 2013 : 3
Received during the year : 23
Resolved during the year : 26
Pending as on 31st March, 2014 : 0
The correspondence identified as investor complaints are
letters received through statutory / regulatory bodies and
letters pertaining to fraudulent encashment etc.
Name, designation and address of Compliance Officer
Mr. Rajiv Chandan
General Counsel & Company Secretary
Tata Chemicals Limited
Bombay House, 24 Homi Mody
Street, Fort, Mumbai 400 001
On the recommendations of the Committee, the
Company has taken various investor friendly initiatives
like sending reminders to investors who have not
claimed their dividends, sending reminders to encourage
dematerialisation of shares, etc.
6. Executive Committee of the Board
Terms of Reference
• To periodically review the ongoing capital
expenditure and the investments made by the
Company.
• To examine new proposals for investments from the
stand point of their business and financial impact.
• To formulate the future strategic direction and
business development of the Company.
In addition to the above terms of reference for this
Committee, the Committee is expected to review the
following items before they are presented to the Board:
• Business and Strategy of the Company.
• Long-term financial projections and cash flows.
• Capital and Revenue Budgets and Capital
Expenditure programmes.
• Acquisitions, divestments and business restructuring
proposals.
• Senior management succession planning.
• Any other item as may be decided by the Board
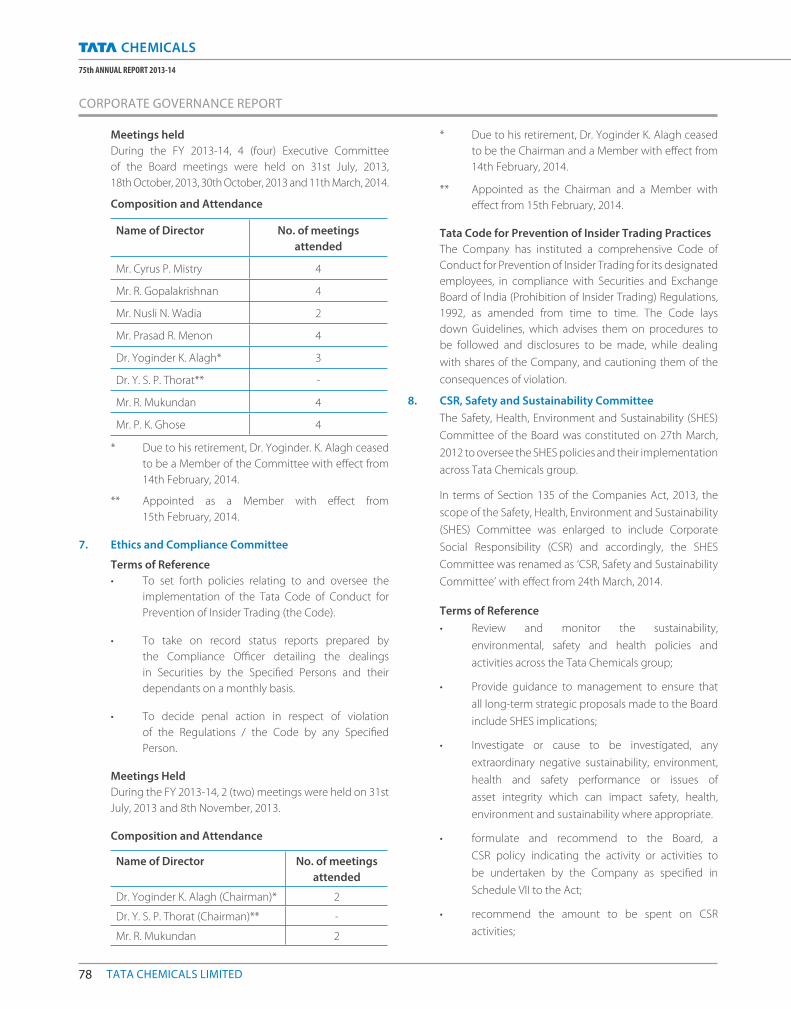
78 TATA CHEMICALS LIMITED
75th ANNUAL REPORT 2013-14
Meetings held
During the FY 2013-14, 4 (four) Executive Committee
of the Board meetings were held on 31st July, 2013,
18th October, 2013, 30th October, 2013 and 11th March, 2014.
Composition and Attendance
Name of Director No. of meetings
attended
Mr. Cyrus P. Mistry 4
Mr. R. Gopalakrishnan 4
Mr. Nusli N. Wadia 2
Mr. Prasad R. Menon 4
Dr. Yoginder K. Alagh* 3
Dr. Y. S. P. Thorat** -
Mr. R. Mukundan 4
Mr. P. K. Ghose 4
* Due to his retirement, Dr. Yoginder. K. Alagh ceased
to be a Member of the Committee with eff ect from
14th February, 2014.
** Appointed as a Member with eff ect from
15th February, 2014.
7. Ethics and Compliance Committee
Terms of Reference
• To set forth policies relating to and oversee the
implementation of the Tata Code of Conduct for
Prevention of Insider Trading (the Code).
• To take on record status reports prepared by
the Compliance Officer detailing the dealings
in Securities by the Specified Persons and their
dependants on a monthly basis.
• To decide penal action in respect of violation
of the Regulations / the Code by any Specified
Person.
Meetings Held
During the FY 2013-14, 2 (two) meetings were held on 31st
July, 2013 and 8th November, 2013.
Composition and Attendance
Name of Director No. of meetings
attended
Dr. Yoginder K. Alagh (Chairman)* 2
Dr. Y. S. P. Thorat (Chairman)** -
Mr. R. Mukundan 2
* Due to his retirement, Dr. Yoginder K. Alagh ceased
to be the Chairman and a Member with eff ect from
14th February, 2014.
** Appointed as the Chairman and a Member with
eff ect from 15th February, 2014.
Tata Code for Prevention of Insider Trading Practices
The Company has instituted a comprehensive Code of
Conduct for Prevention of Insider Trading for its designated
employees, in compliance with Securities and Exchange
Board of India (Prohibition of Insider Trading) Regulations,
1992, as amended from time to time. The Code lays
down Guidelines, which advises them on procedures to
be followed and disclosures to be made, while dealing
with shares of the Company, and cautioning them of the
consequences of violation.
8. CSR, Safety and Sustainability Committee
The Safety, Health, Environment and Sustainability (SHES)
Committee of the Board was constituted on 27th March,
2012 to oversee the SHES policies and their implementation
across Tata Chemicals group.
In terms of Section 135 of the Companies Act, 2013, the
scope of the Safety, Health, Environment and Sustainability
(SHES) Committee was enlarged to include Corporate
Social Responsibility (CSR) and accordingly, the SHES
Committee was renamed as ‘CSR, Safety and Sustainability
Committee’ with eff ect from 24th March, 2014.
Terms of Reference
• Review and monitor the sustainability,
environmental, safety and health policies and
activities across the Tata Chemicals group;
• Provide guidance to management to ensure that
all long-term strategic proposals made to the Board
include SHES implications;
• Investigate or cause to be investigated, any
extraordinary negative sustainability, environment,
health and safety performance or issues of
asset integrity which can impact safety, health,
environment and sustainability where appropriate.
• formulate and recommend to the Board, a
CSR policy indicating the activity or activities to
be undertaken by the Company as specifi ed in
Schedule VII to the Act;
• recommend the amount to be spent on CSR
activities;
CORPORATE GOVERNANCE REPORT
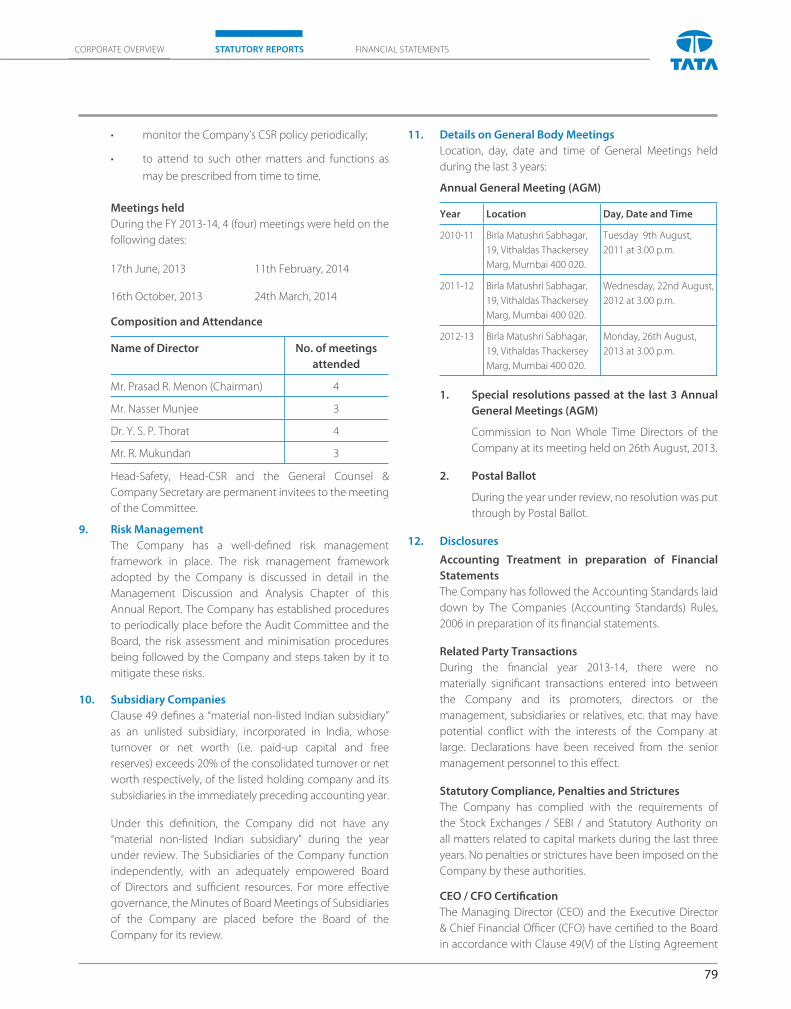
79
CORPORATE OVERVIEW FINANCIAL STATEMENTSSTATUTORY REPORTS
• monitor the Company’s CSR policy periodically;
• to attend to such other matters and functions as
may be prescribed from time to time.
Meetings held
During the FY 2013-14, 4 (four) meetings were held on the
following dates:
17th June, 2013 11th February, 2014
16th October, 2013 24th March, 2014
Composition and Attendance
Name of Director No. of meetings
attended
Mr. Prasad R. Menon (Chairman) 4
Mr. Nasser Munjee 3
Dr. Y. S. P. Thorat 4
Mr. R. Mukundan 3
Head-Safety, Head-CSR and the General Counsel &
Company Secretary are permanent invitees to the meeting
of the Committee.
9. Risk Management
The Company has a well-defined risk management
framework in place. The risk management framework
adopted by the Company is discussed in detail in the
Management Discussion and Analysis Chapter of this
Annual Report. The Company has established procedures
to periodically place before the Audit Committee and the
Board, the risk assessment and minimisation procedures
being followed by the Company and steps taken by it to
mitigate these risks.
10. Subsidiary Companies
Clause 49 defines a “material non-listed Indian subsidiary”
as an unlisted subsidiary, incorporated in India, whose
turnover or net worth (i.e. paid-up capital and free
reserves) exceeds 20% of the consolidated turnover or net
worth respectively, of the listed holding company and its
subsidiaries in the immediately preceding accounting year.
Under this definition, the Company did not have any
“material non-listed Indian subsidiary” during the year
under review. The Subsidiaries of the Company function
independently, with an adequately empowered Board
of Directors and sufficient resources. For more eff ective
governance, the Minutes of Board Meetings of Subsidiaries
of the Company are placed before the Board of the
Company for its review.
11. Details on General Body Meetings
Location, day, date and time of General Meetings held
during the last 3 years:
Annual General Meeting (AGM)
Year Location Day, Date and Time
2010-11 Birla Matushri Sabhagar,
19, Vithaldas Thackersey
Marg, Mumbai 400 020.
Tuesday 9th August,
2011 at 3.00 p.m.
2011-12 Birla Matushri Sabhagar,
19, Vithaldas Thackersey
Marg, Mumbai 400 020.
Wednesday, 22nd August,
2012 at 3.00 p.m.
2012-13 Birla Matushri Sabhagar,
19, Vithaldas Thackersey
Marg, Mumbai 400 020.
Monday, 26th August,
2013 at 3.00 p.m.
1. Special resolutions passed at the last 3 Annual
General Meetings (AGM)
Commission to Non Whole Time Directors of the
Company at its meeting held on 26th August, 2013.
2. Postal Ballot
During the year under review, no resolution was put
through by Postal Ballot.
12. Disclosures
Accounting Treatment in preparation of Financial
Statements
The Company has followed the Accounting Standards laid
down by The Companies (Accounting Standards) Rules,
2006 in preparation of its financial statements.
Related Party Transactions
During the financial year 2013-14, there were no
materially significant transactions entered into between
the Company and its promoters, directors or the
management, subsidiaries or relatives, etc. that may have
potential conflict with the interests of the Company at
large. Declarations have been received from the senior
management personnel to this eff ect.
Statutory Compliance, Penalties and Strictures
The Company has complied with the requirements of
the Stock Exchanges / SEBI / and Statutory Authority on
all matters related to capital markets during the last three
years. No penalties or strictures have been imposed on the
Company by these authorities.
CEO / CFO Certification
The Managing Director (CEO) and the Executive Director
& Chief Financial Officer (CFO) have certified to the Board
in accordance with Clause 49(V) of the Listing Agreement
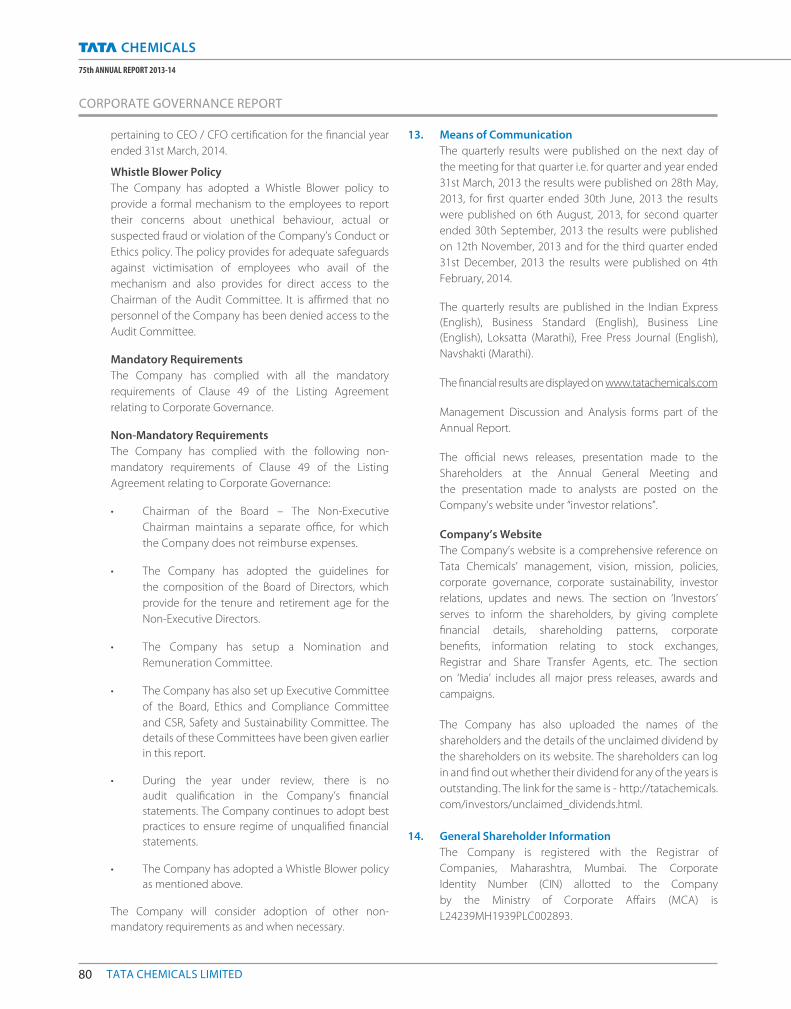
80 TATA CHEMICALS LIMITED
75th ANNUAL REPORT 2013-14
pertaining to CEO / CFO certification for the financial year
ended 31st March, 2014.
Whistle Blower Policy
The Company has adopted a Whistle Blower policy to
provide a formal mechanism to the employees to report
their concerns about unethical behaviour, actual or
suspected fraud or violation of the Company’s Conduct or
Ethics policy. The policy provides for adequate safeguards
against victimisation of employees who avail of the
mechanism and also provides for direct access to the
Chairman of the Audit Committee. It is affirmed that no
personnel of the Company has been denied access to the
Audit Committee.
Mandatory Requirements
The Company has complied with all the mandatory
requirements of Clause 49 of the Listing Agreement
relating to Corporate Governance.
Non-Mandatory Requirements
The Company has complied with the following non-
mandatory requirements of Clause 49 of the Listing
Agreement relating to Corporate Governance:
• Chairman of the Board – The Non-Executive
Chairman maintains a separate offi ce, for which
the Company does not reimburse expenses.
• The Company has adopted the guidelines for
the composition of the Board of Directors, which
provide for the tenure and retirement age for the
Non-Executive Directors.
• The Company has setup a Nomination and
Remuneration Committee.
• The Company has also set up Executive Committee
of the Board, Ethics and Compliance Committee
and CSR, Safety and Sustainability Committee. The
details of these Committees have been given earlier
in this report.
• During the year under review, there is no
audit qualification in the Company’s financial
statements. The Company continues to adopt best
practices to ensure regime of unqualified financial
statements.
• The Company has adopted a Whistle Blower policy
as mentioned above.
The Company will consider adoption of other non-
mandatory requirements as and when necessary.
13. Means of Communication
The quarterly results were published on the next day of
the meeting for that quarter i.e. for quarter and year ended
31st March, 2013 the results were published on 28th May,
2013, for first quarter ended 30th June, 2013 the results
were published on 6th August, 2013, for second quarter
ended 30th September, 2013 the results were published
on 12th November, 2013 and for the third quarter ended
31st December, 2013 the results were published on 4th
February, 2014.
The quarterly results are published in the Indian Express
(English), Business Standard (English), Business Line
(English), Loksatta (Marathi), Free Press Journal (English),
Navshakti (Marathi).
The financial results are displayed on www.tatachemicals.com
Management Discussion and Analysis forms part of the
Annual Report.
The official news releases, presentation made to the
Shareholders at the Annual General Meeting and
the presentation made to analysts are posted on the
Company’s website under “investor relations”.
Company’s Website
The Company’s website is a comprehensive reference on
Tata Chemicals’ management, vision, mission, policies,
corporate governance, corporate sustainability, investor
relations, updates and news. The section on ‘Investors’
serves to inform the shareholders, by giving complete
financial details, shareholding patterns, corporate
benefits, information relating to stock exchanges,
Registrar and Share Transfer Agents, etc. The section
on ‘Media’ includes all major press releases, awards and
campaigns.
The Company has also uploaded the names of the
shareholders and the details of the unclaimed dividend by
the shareholders on its website. The shareholders can log
in and find out whether their dividend for any of the years is
outstanding. The link for the same is - http://tatachemicals.
com/investors/unclaimed_dividends.html.
14. General Shareholder Information
The Company is registered with the Registrar of
Companies, Maharashtra, Mumbai. The Corporate
Identity Number (CIN) allotted to the Company
by the Ministry of Corporate Aff airs (MCA) is
L24239MH1939PLC002893.
CORPORATE GOVERNANCE REPORT
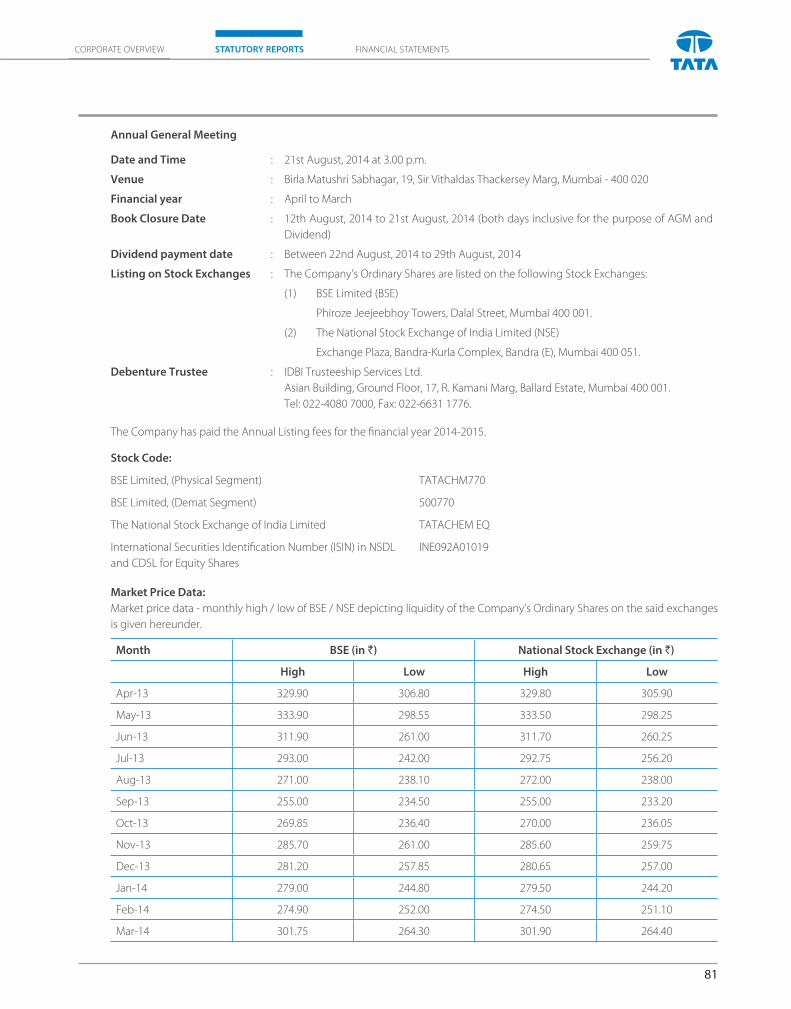
81
CORPORATE OVERVIEW FINANCIAL STATEMENTSSTATUTORY REPORTS
Annual General Meeting
Date and Time : 21st August, 2014 at 3.00 p.m.
Venue : Birla Matushri Sabhagar, 19, Sir Vithaldas Thackersey Marg, Mumbai - 400 020
Financial year : April to March
Book Closure Date : 12th August, 2014 to 21st August, 2014 (both days inclusive for the purpose of AGM and
Dividend)
Dividend payment date : Between 22nd August, 2014 to 29th August, 2014
Listing on Stock Exchanges : The Company’s Ordinary Shares are listed on the following Stock Exchanges:
(1) BSE Limited (BSE)
Phiroze Jeejeebhoy Towers, Dalal Street, Mumbai 400 001.
(2) The National Stock Exchange of India Limited (NSE)
Exchange Plaza, Bandra-Kurla Complex, Bandra (E), Mumbai 400 051.
Debenture Trustee : IDBI Trusteeship Services Ltd.
Asian Building, Ground Floor, 17, R. Kamani Marg, Ballard Estate, Mumbai 400 001.
Tel: 022-4080 7000, Fax: 022-6631 1776.
The Company has paid the Annual Listing fees for the financial year 2014-2015.
Stock Code:
BSE Limited, (Physical Segment) TATACHM770
BSE Limited, (Demat Segment) 500770
The National Stock Exchange of India Limited TATACHEM EQ
International Securities Identification Number (ISIN) in NSDL
and CDSL for Equity Shares
INE092A01019
Market Price Data:
Market price data - monthly high / low of BSE / NSE depicting liquidity of the Company’s Ordinary Shares on the said exchanges
is given hereunder.
Month BSE (in `) National Stock Exchange (in `)
High Low High Low
Apr-13 329.90 306.80 329.80 305.90
May-13 333.90 298.55 333.50 298.25
Jun-13 311.90 261.00 311.70 260.25
Jul-13 293.00 242.00 292.75 256.20
Aug-13 271.00 238.10 272.00 238.00
Sep-13 255.00 234.50 255.00 233.20
Oct-13 269.85 236.40 270.00 236.05
Nov-13 285.70 261.00 285.60 259.75
Dec-13 281.20 257.85 280.65 257.00
Jan-14 279.00 244.80 279.50 244.20
Feb-14 274.90 252.00 274.50 251.10
Mar-14 301.75 264.30 301.90 264.40
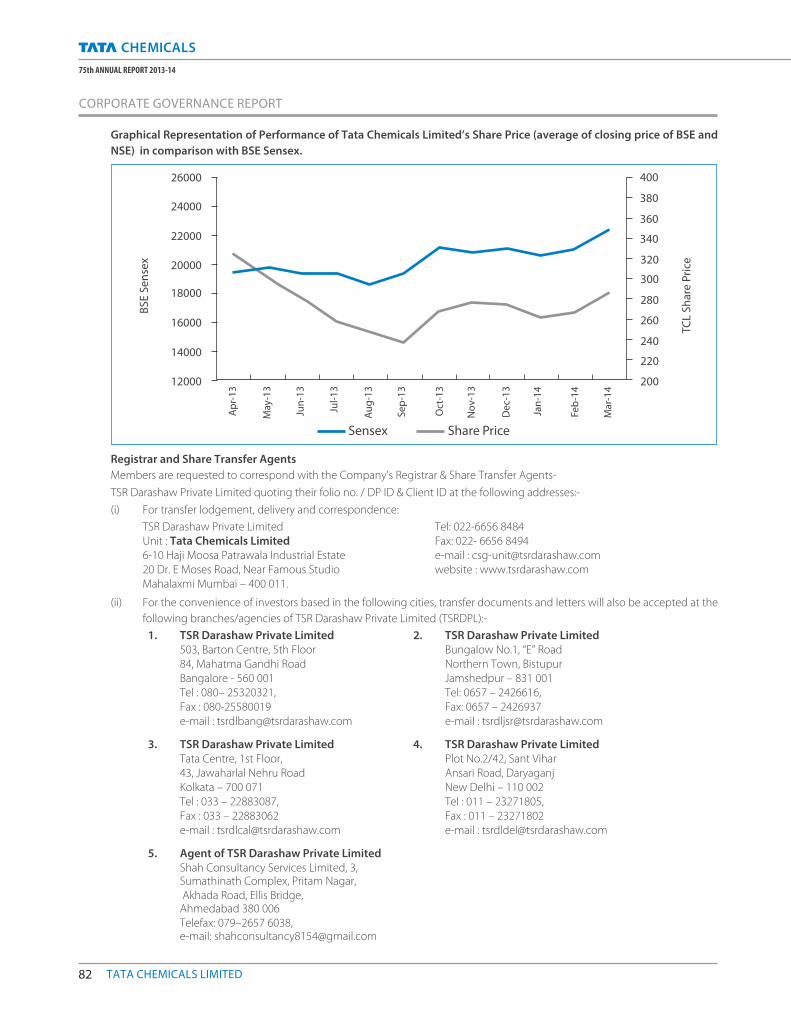
82 TATA CHEMICALS LIMITED
75th ANNUAL REPORT 2013-14
26000
12000
320
400
380
360
340
300
280
260
240
220
200
24000
22000
20000
18000
16000
14000
BSE
Sens
ex
TCL
Shar
e Pr
ice
Apr
-13
May
-13
Jun-
13
Jul-1
3
Aug-
13
Sep-
13
Oct
-13
Nov
-13
Dec
-13
Jan-
14
Feb-
14
Mar
-14
Sensex Share Price
Graphical Representation of Performance of Tata Chemicals Limited’s Share Price (average of closing price of BSE and
NSE) in comparison with BSE Sensex.
Registrar and Share Transfer Agents
Members are requested to correspond with the Company’s Registrar & Share Transfer Agents-
TSR Darashaw Private Limited quoting their folio no. / DP ID & Client ID at the following addresses:-
(i) For transfer lodgement, delivery and correspondence:
TSR Darashaw Private Limited Tel: 022-6656 8484Unit : Tata Chemicals Limited Fax: 022- 6656 84946-10 Haji Moosa Patrawala Industrial Estate e-mail : [email protected] Dr. E Moses Road, Near Famous Studio website : www.tsrdarashaw.comMahalaxmi Mumbai – 400 011.
(ii) For the convenience of investors based in the following cities, transfer documents and letters will also be accepted at the
following branches/agencies of TSR Darashaw Private Limited (TSRDPL):-
1. TSR Darashaw Private Limited 2. TSR Darashaw Private Limited 503, Barton Centre, 5th Floor Bungalow No.1, “E” Road 84, Mahatma Gandhi Road Northern Town, Bistupur Bangalore - 560 001 Jamshedpur – 831 001 Tel : 080– 25320321, Tel: 0657 – 2426616, Fax : 080-25580019 Fax: 0657 – 2426937 e-mail : [email protected] e-mail : [email protected]
3. TSR Darashaw Private Limited 4. TSR Darashaw Private Limited Tata Centre, 1st Floor, Plot No.2/42, Sant Vihar 43, Jawaharlal Nehru Road Ansari Road, Daryaganj Kolkata – 700 071 New Delhi – 110 002 Tel : 033 – 22883087, Tel : 011 – 23271805, Fax : 033 – 22883062 Fax : 011 – 23271802 e-mail : [email protected] e-mail : [email protected]
5. Agent of TSR Darashaw Private Limited Shah Consultancy Services Limited, 3,
Sumathinath Complex, Pritam Nagar, Akhada Road, Ellis Bridge, Ahmedabad 380 006 Telefax: 079–2657 6038, e-mail: [email protected]
CORPORATE GOVERNANCE REPORT
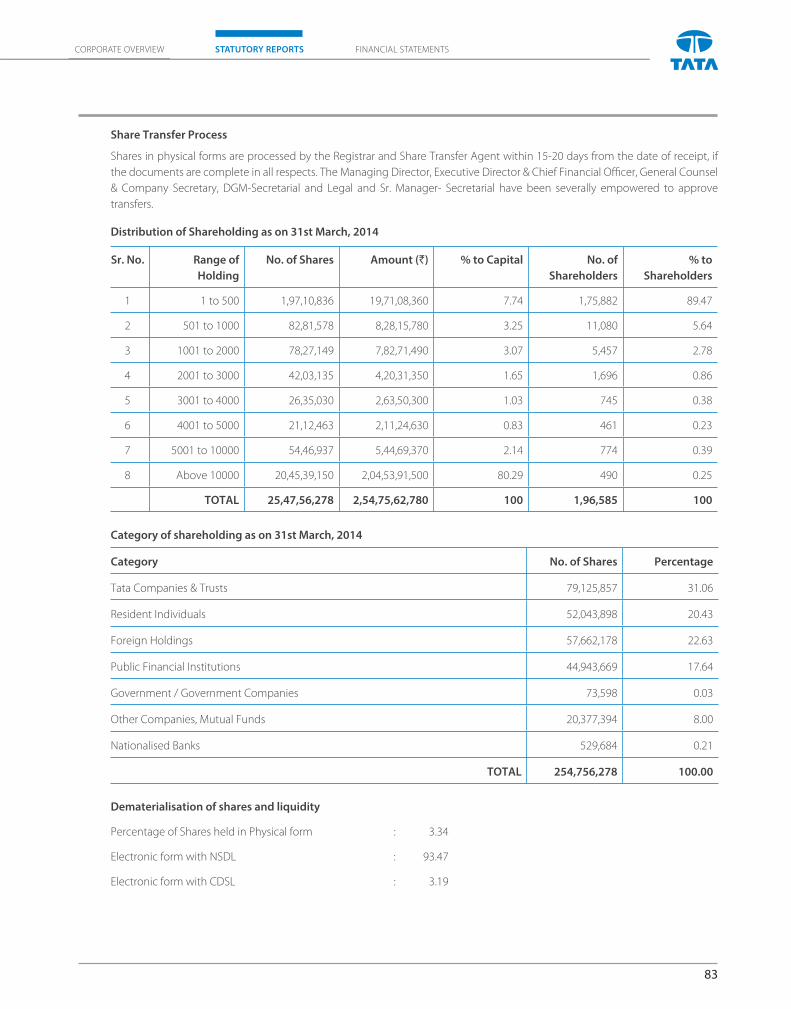
83
CORPORATE OVERVIEW FINANCIAL STATEMENTSSTATUTORY REPORTS
Share Transfer Process
Shares in physical forms are processed by the Registrar and Share Transfer Agent within 15-20 days from the date of receipt, if
the documents are complete in all respects. The Managing Director, Executive Director & Chief Financial Offi cer, General Counsel
& Company Secretary, DGM-Secretarial and Legal and Sr. Manager- Secretarial have been severally empowered to approve
transfers.
Distribution of Shareholding as on 31st March, 2014
Sr. No. Range of
Holding
No. of Shares Amount (`) % to Capital No. of
Shareholders
% to
Shareholders
1 1 to 500 1,97,10,836 19,71,08,360 7.74 1,75,882 89.47
2 501 to 1000 82,81,578 8,28,15,780 3.25 11,080 5.64
3 1001 to 2000 78,27,149 7,82,71,490 3.07 5,457 2.78
4 2001 to 3000 42,03,135 4,20,31,350 1.65 1,696 0.86
5 3001 to 4000 26,35,030 2,63,50,300 1.03 745 0.38
6 4001 to 5000 21,12,463 2,11,24,630 0.83 461 0.23
7 5001 to 10000 54,46,937 5,44,69,370 2.14 774 0.39
8 Above 10000 20,45,39,150 2,04,53,91,500 80.29 490 0.25
TOTAL 25,47,56,278 2,54,75,62,780 100 1,96,585 100
Category of shareholding as on 31st March, 2014
Category No. of Shares Percentage
Tata Companies & Trusts 79,125,857 31.06
Resident Individuals 52,043,898 20.43
Foreign Holdings 57,662,178 22.63
Public Financial Institutions 44,943,669 17.64
Government / Government Companies 73,598 0.03
Other Companies, Mutual Funds 20,377,394 8.00
Nationalised Banks 529,684 0.21
TOTAL 254,756,278 100.00
Dematerialisation of shares and liquidity
Percentage of Shares held in Physical form : 3.34
Electronic form with NSDL : 93.47
Electronic form with CDSL : 3.19
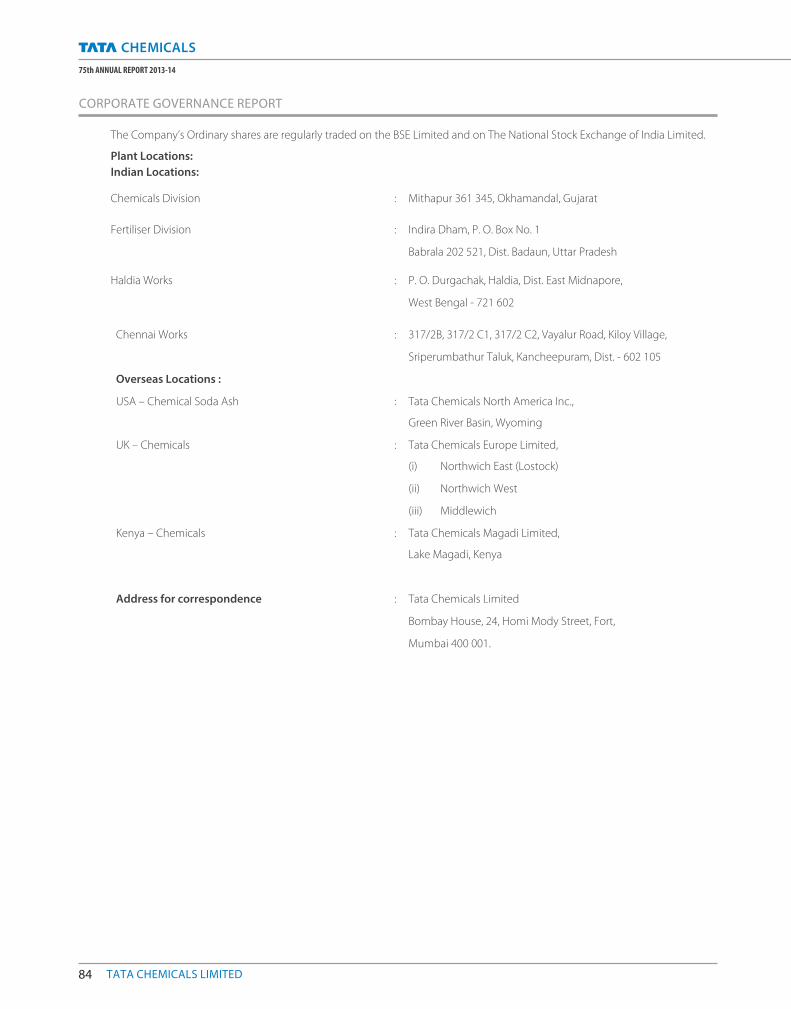
84 TATA CHEMICALS LIMITED
75th ANNUAL REPORT 2013-14
The Company’s Ordinary shares are regularly traded on the BSE Limited and on The National Stock Exchange of India Limited.
Plant Locations:
Indian Locations:
Chemicals Division : Mithapur 361 345, Okhamandal, Gujarat
Fertiliser Division : Indira Dham, P. O. Box No. 1
Babrala 202 521, Dist. Badaun, Uttar Pradesh
Haldia Works : P. O. Durgachak, Haldia, Dist. East Midnapore,
West Bengal - 721 602
Chennai Works : 317/2B, 317/2 C1, 317/2 C2, Vayalur Road, Kiloy Village,
Sriperumbathur Taluk, Kancheepuram, Dist. - 602 105
Overseas Locations :
USA – Chemical Soda Ash : Tata Chemicals North America Inc.,
Green River Basin, Wyoming
UK – Chemicals : Tata Chemicals Europe Limited,
(i) Northwich East (Lostock)
(ii) Northwich West
(iii) Middlewich
Kenya – Chemicals : Tata Chemicals Magadi Limited,
Lake Magadi, Kenya
Address for correspondence : Tata Chemicals Limited
Bombay House, 24, Homi Mody Street, Fort,
Mumbai 400 001.
CORPORATE GOVERNANCE REPORT
85
CORPORATE OVERVIEW FINANCIAL STATEMENTSSTATUTORY REPORTS
DECLARATION
I, R. Mukundan, Managing Director of Tata Chemicals Limited, hereby declare that all the members of the Board of Directors and
the Senior Management personnel have affi rmed compliance with the Code of Conduct, applicable to them as laid down by the
Board of Directors in terms of Clause 49(I)(D)(ii) of the Listing Agreement entered into with the Stock Exchanges for the year ended
31st March, 2014.
For Tata Chemicals Limited
R. Mukundan
Managing Director
Mumbai, 30th May, 2014
AUDITORS’ CERTIFICATE
TO THE MEMBERS OF
TATA CHEMICALS LIMITED
We have examined the compliance of conditions of Corporate Governance by TATA CHEMICALS LIMITED (the “Company”), for the
year ended 31st March, 2014, as stipulated in Clause 49 of the Listing Agreements of the Company with the stock exchanges.
The compliance of conditions of Corporate Governance is the responsibility of the Management. Our examination was limited to
a review of the procedures and implementation thereof adopted by the Company for ensuring compliance with the conditions of
Corporate Governance. It is neither an audit nor an expression of opinion on the fi nancial statements of the Company.
In our opinion and to the best of our information and according to the explanations given to us, we certify that the Company has
complied with the conditions of Corporate Governance as stipulated in Clause 49 of the Listing Agreements.
We further state that such compliance is neither an assurance as to the future viability of the Company nor of the effi ciency or
eff ectiveness with which the Management has conducted the aff airs of the Company.
For DELOITTE HASKINS & SELLS LLP
Chartered Accountants
(Firm‘s Registration No. 117366W / W-100018)
Sanjiv V.Pilgaonkar
(Partner)
(Membership No. 039826)
MUMBAI, 30th May, 2014
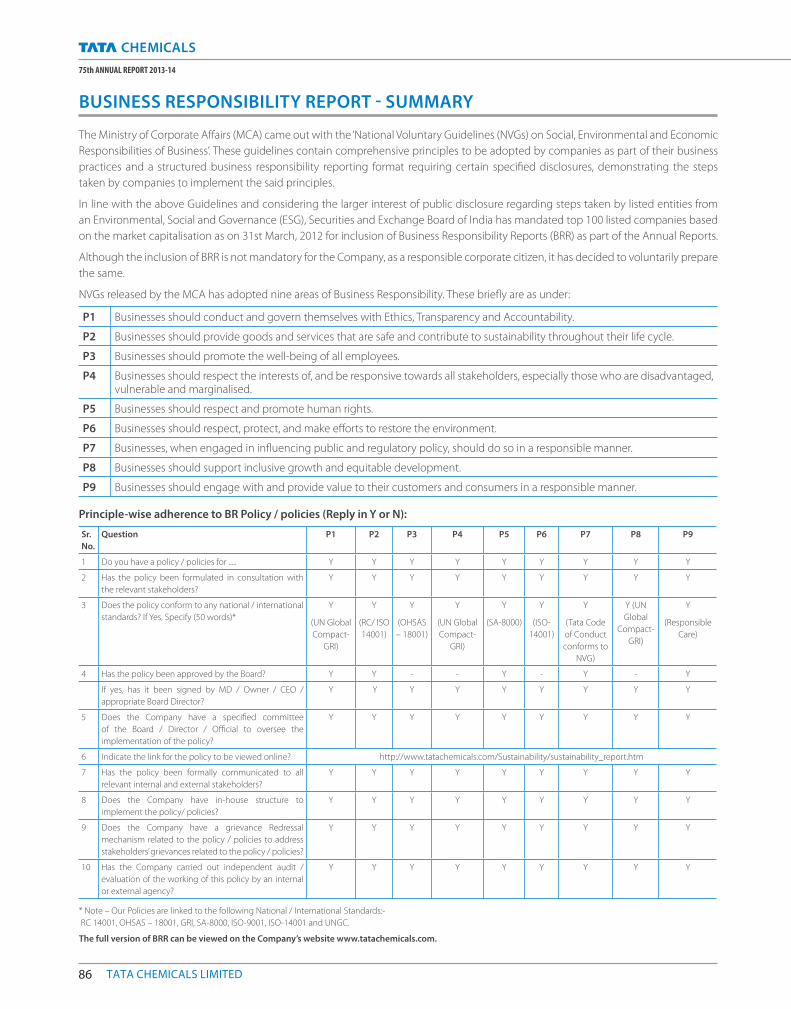
86 TATA CHEMICALS LIMITED
75th ANNUAL REPORT 2013-14
The Ministry of Corporate Aff airs (MCA) came out with the ‘National Voluntary Guidelines (NVGs) on Social, Environmental and Economic
Responsibilities of Business’. These guidelines contain comprehensive principles to be adopted by companies as part of their business
practices and a structured business responsibility reporting format requiring certain specifi ed disclosures, demonstrating the steps
taken by companies to implement the said principles.
In line with the above Guidelines and considering the larger interest of public disclosure regarding steps taken by listed entities from
an Environmental, Social and Governance (ESG), Securities and Exchange Board of India has mandated top 100 listed companies based
on the market capitalisation as on 31st March, 2012 for inclusion of Business Responsibility Reports (BRR) as part of the Annual Reports.
Although the inclusion of BRR is not mandatory for the Company, as a responsible corporate citizen, it has decided to voluntarily prepare
the same.
NVGs released by the MCA has adopted nine areas of Business Responsibility. These briefl y are as under:
P1 Businesses should conduct and govern themselves with Ethics, Transparency and Accountability.
P2 Businesses should provide goods and services that are safe and contribute to sustainability throughout their life cycle.
P3 Businesses should promote the well-being of all employees.
P4 Businesses should respect the interests of, and be responsive towards all stakeholders, especially those who are disadvantaged, vulnerable and marginalised.
P5 Businesses should respect and promote human rights.
P6 Businesses should respect, protect, and make eff orts to restore the environment.
P7 Businesses, when engaged in infl uencing public and regulatory policy, should do so in a responsible manner.
P8 Businesses should support inclusive growth and equitable development.
P9 Businesses should engage with and provide value to their customers and consumers in a responsible manner.
Principle-wise adherence to BR Policy / policies (Reply in Y or N):
Sr.
No.
Question P1 P2 P3 P4 P5 P6 P7 P8 P9
1 Do you have a policy / policies for ..... Y Y Y Y Y Y Y Y Y
2 Has the policy been formulated in consultation with
the relevant stakeholders?
Y Y Y Y Y Y Y Y Y
3 Does the policy conform to any national / international
standards? If Yes, Specify (50 words)*
Y
(UN Global
Compact-
GRI)
Y
(RC/ ISO
14001)
Y
(OHSAS
– 18001)
Y
(UN Global
Compact-
GRI)
Y
(SA-8000)
Y
(ISO-
14001)
Y
(Tata Code
of Conduct
conforms to
NVG)
Y (UN
Global
Compact-
GRI)
Y
(Responsible
Care)
4 Has the policy been approved by the Board? Y Y - - Y - Y - Y
If yes, has it been signed by MD / Owner / CEO /
appropriate Board Director?
Y Y Y Y Y Y Y Y Y
5 Does the Company have a specifi ed committee
of the Board / Director / Offi cial to oversee the
implementation of the policy?
Y Y Y Y Y Y Y Y Y
6 Indicate the link for the policy to be viewed online? http://www.tatachemicals.com/Sustainability/sustainability_report.htm
7 Has the policy been formally communicated to all
relevant internal and external stakeholders?
Y Y Y Y Y Y Y Y Y
8 Does the Company have in-house structure to
implement the policy/ policies?
Y Y Y Y Y Y Y Y Y
9 Does the Company have a grievance Redressal
mechanism related to the policy / policies to address
stakeholders’ grievances related to the policy / policies?
Y Y Y Y Y Y Y Y Y
10 Has the Company carried out independent audit /
evaluation of the working of this policy by an internal
or external agency?
Y Y Y Y Y Y Y Y Y
* Note – Our Policies are linked to the following National / International Standards:-
RC 14001, OHSAS – 18001, GRI, SA-8000, ISO-9001, ISO-14001 and UNGC.
The full version of BRR can be viewed on the Company’s website www.tatachemicals.com.
BUSINESS RESPONSIBILITY REPORT - SUMMARY
87
CORPORATE OVERVIEW FINANCIAL STATEMENTSSTATUTORY REPORTS
INDEPENDENT AUDITORS’ REPORT
To The Members of
TATA CHEMICALS LIMITED
Report on the Financial Statements
We have audited the accompanying fi nancial statements of
TATA CHEMICALS LIMITED (the “Company”), which comprise
the Balance Sheet as at 31st March, 2014, the Statement of Profi t
and Loss and the Cash Flow Statement for the year then ended,
and a summary of the signifi cant accounting policies and other
explanatory information.
Management’s Responsibility for the Financial Statements
The Company’s Management is responsible for the preparation
of these fi nancial statements that give a true and fair view of the
fi nancial position, fi nancial performance and cash fl ows of the
Company in accordance with the Accounting Standards notifi ed
under the Companies Act, 1956 (the “Act”) (which continue to
be applicable in respect of Section 133 of the Companies Act,
2013 in terms of General Circular 15/2013 dated 13th September,
2013 of the Ministry of Corporate Aff airs) and in accordance
with the accounting principles generally accepted in India.
This responsibility includes the design, implementation and
maintenance of internal control relevant to the preparation and
presentation of the fi nancial statements that give a true and fair
view and are free from material misstatement, whether due to
fraud or error.
Auditors’ Responsibility
Our responsibility is to express an opinion on these fi nancial
statements based on our audit. We conducted our audit in
accordance with the Standards on Auditing issued by the Institute
of Chartered Accountants of India. Those Standards require that
we comply with ethical requirements and plan and perform the
audit to obtain reasonable assurance about whether the fi nancial
statements are free from material misstatement.
An audit involves performing procedures to obtain audit
evidence about the amounts and the disclosures in the fi nancial
statements. The procedures selected depend on the auditor’s
judgment, including the assessment of the risks of material
misstatement of the fi nancial statements, whether due to fraud
or error. In making those risk assessments, the auditor considers
internal control relevant to the Company’s preparation and fair
presentation of the fi nancial statements in order to design audit
procedures that are appropriate in the circumstances, but not
for the purpose of expressing an opinion on the eff ectiveness
of the Company’s internal control. An audit also includes
evaluating the appropriateness of the accounting policies used
and the reasonableness of the accounting estimates made by the
Management, as well as evaluating the overall presentation of the
fi nancial statements.
We believe that the audit evidence we have obtained is suffi cient
and appropriate to provide a basis for our audit opinion.
Opinion
In our opinion and to the best of our information and according
to the explanations given to us, the aforesaid fi nancial statements
give the information required by the Act in the manner so required
and give a true and fair view in conformity with the accounting
principles generally accepted in India:
(a) in the case of the Balance Sheet, of the state of aff airs of the
Company as at 31st March, 2014;
(b) in the case of the Statement of Profi t and Loss, of the profi t
of the Company for the year ended on that date; and
(c) in the case of the Cash Flow Statement, of the cash fl ows of
the Company for the year ended on that date.
Report on Other Legal and Regulatory Requirements
1. As required by the Companies (Auditor’s Report) Order,
2003 (the “Order”) issued by the Central Government in
terms of Section 227(4A) of the Act, we give in the Annexure
a statement on the matters specifi ed in paragraphs 4 and 5
of the Order.
2. As required by Section 227(3) of the Act, we report that:
(a) We have obtained all the information and
explanations which to the best of our knowledge
and belief were necessary for the purposes of our
audit.
(b) In our opinion, proper books of account as required
by law have been kept by the Company so far as it
appears from our examination of those books.
(c) The Balance Sheet, the Statement of Profi t and Loss,
and the Cash Flow Statement dealt with by this
Report are in agreement with the books of account.
(d) In our opinion, the Balance Sheet, the Statement
of Profi t and Loss, and the Cash Flow Statement
comply with the Accounting Standards notifi ed
under the Act (which continue to be applicable
in respect of Section 133 of the Companies Act,
2013 in terms of General Circular 15/2013 dated
13th September, 2013 of the Ministry of Corporate
Aff airs).
(e) On the basis of the written representations received
from the directors as on 31st March, 2014 taken
on record by the Board of Directors, none of the
directors is disqualifi ed as on 31st March, 2014 from
being appointed as a director in terms of Section
274(1)(g) of the Act.
For DELOITTE HASKINS & SELLS LLP
Chartered Accountants
(Firm’s Registration No. 117366W / W-100018)
Sanjiv V. Pilgaonkar
(Partner)
(Membership No. 039826)
MUMBAI, 30th May, 2014
88 TATA CHEMICALS LIMITED
75th ANNUAL REPORT 2013-14
ANNEXURE TO THE INDEPENDENT AUDITORS’ REPORT
(Referred to in paragraph 1 under ‘Report on Other Legal and
Regulatory Requirements’ section of our report of even date)
(i) Having regard to the nature of the Company’s business /
activities / results during the year, clauses (x), (xiii), (xiv),
(xviii), (xix) and (xx) of paragraph 4 of the Order are not
applicable to the Company.
(ii) In respect of its fi xed assets:
(a) The Company has maintained proper records
showing full particulars, including quantitative
details and situation of fi xed assets.
(b) The fi xed assets were physically verifi ed during
the year by the Management in accordance with
a regular programme of verifi cation which, in our
opinion, provides for physical verifi cation of all
the fi xed assets at reasonable intervals. According
to the information and explanations given to us,
no material discrepancies were noticed on such
verifi cation.
(c) The fi xed assets disposed of during the year, in our
opinion, do not constitute a substantial part of the
fi xed assets of the Company and such disposal has,
in our opinion, not aff ected the going concern
status of the Company.
(iii) In respect of its inventory:
(a) As explained to us, the inventories were physically
verifi ed during the year by the Management at
reasonable intervals.
(b) In our opinion and according to the information
and explanations given to us, having regard to
the nature of the inventory the procedures of
physical verifi cation of inventories followed by
the Management including obtaining of direct
confi rmations from third parties for inventories held
by them are reasonable and adequate in relation
to the size of the Company and the nature of its
business.
(c) In our opinion and according to the information
and explanations given to us, the Company has
maintained proper records of its inventories and
no material discrepancies were noticed on physical
verifi cation.
(iv) The Company has neither granted nor taken any loan,
secured or unsecured, to / from Companies, fi rms or other
parties listed in the Register maintained under Section 301
of the Companies Act, 1956.
(v) In our opinion and according to the information and
explanations given to us, having regard to the explanations
that some of the items purchased are of special nature and
suitable alternative sources are not readily available for
obtaining comparable quotations, there is an adequate
internal control system commensurate with the size of
the Company and the nature of its business with regard
to purchases of inventory and fi xed assets and the sale
of goods and services. During the course of our audit, we
have not observed any major weakness in such internal
control system.
(vi) To the best of our knowledge and belief and according to
the information and explanations given to us, there were
no contracts or arrangements the particulars of which
needed to be entered into the register maintained under
Section 301 of the Companies Act, 1956.
(vii) According to the information and explanations given to
us, the Company has not accepted any deposit from the
public during the year.
(viii) In our opinion, the Company has an adequate internal
audit system commensurate with the size and the nature
of its business.
(ix) We have broadly reviewed the cost records maintained
by the Company pursuant to the Companies (Cost
Accounting Records) Rules, 2011 prescribed by the Central
Government under Section 209(1) (d) of the Companies
Act, 1956 and are of the opinion that, prima facie, the
prescribed cost records have been made and maintained.
We have, however, not made a detailed examination of the
cost records with a view to determine whether they are
accurate or complete.
(x) According to the information and explanations given to us
in respect of statutory dues:
(a) The Company has generally been regular in
depositing undisputed statutory dues, including
Provident Fund, Investor Education and Protection
Fund, Employees’ State Insurance, Income-tax,
Sales Tax, Wealth Tax, Service Tax, Custom Duty,
Excise Duty, Cess and other material statutory dues
applicable to it with the appropriate authorities.
(b) There were no undisputed amounts payable in
respect of Provident Fund, Investor Education
and Protection Fund, Employees’ State Insurance,
Income-tax, Sales Tax, Wealth Tax, Service Tax,
Custom Duty, Excise Duty, Cess and other material
statutory dues in arrears as at 31st March, 2014 for a
period of more than six months from the date they
became payable.
(c) Details of dues of Income-tax, Sales Tax, Custom
Duty, Service Tax, Excise Duty and Entry Tax which
have not been deposited as on 31st March, 2014 on
account of disputes are given below:
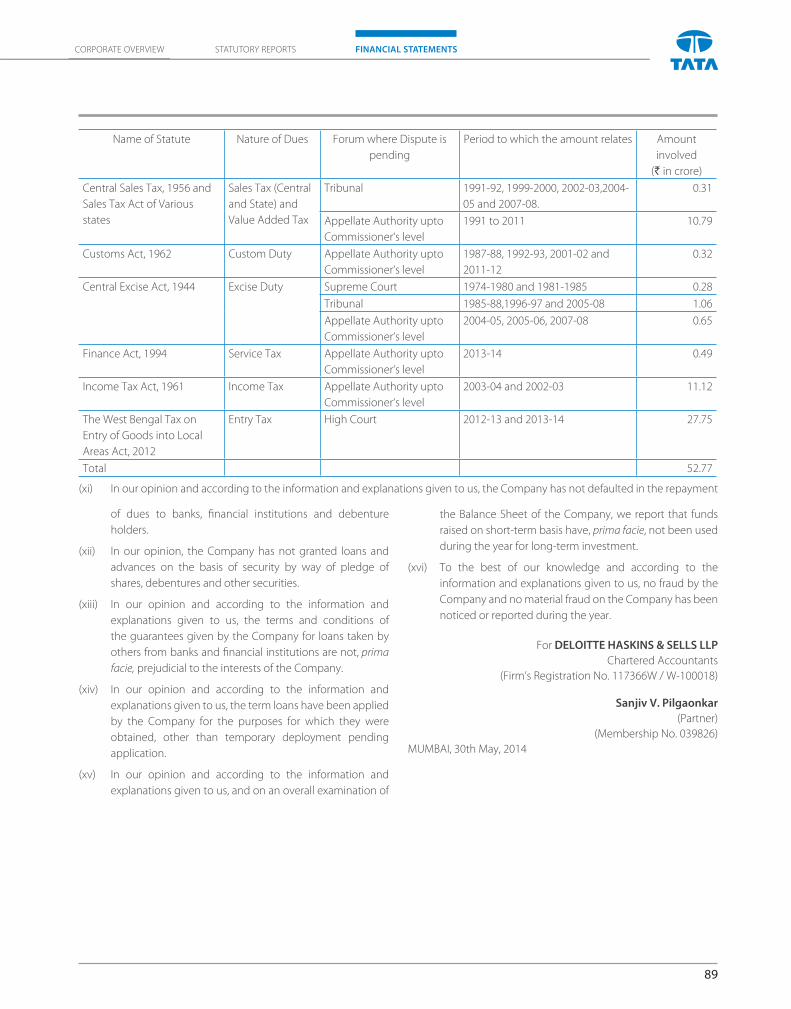
89
CORPORATE OVERVIEW FINANCIAL STATEMENTSSTATUTORY REPORTS
Name of Statute Nature of Dues Forum where Dispute is
pending
Period to which the amount relates Amount
involved
(` in crore)
Central Sales Tax, 1956 and
Sales Tax Act of Various
states
Sales Tax (Central
and State) and
Value Added Tax
Tribunal 1991-92, 1999-2000, 2002-03,2004-
05 and 2007-08.
0.31
Appellate Authority upto
Commissioner‘s level
1991 to 2011 10.79
Customs Act, 1962 Custom Duty Appellate Authority upto
Commissioner‘s level
1987-88, 1992-93, 2001-02 and
2011-12
0.32
Central Excise Act, 1944 Excise Duty Supreme Court 1974-1980 and 1981-1985 0.28
Tribunal 1985-88,1996-97 and 2005-08 1.06
Appellate Authority upto
Commissioner‘s level
2004-05, 2005-06, 2007-08 0.65
Finance Act, 1994 Service Tax Appellate Authority upto
Commissioner‘s level
2013-14 0.49
Income Tax Act, 1961 Income Tax Appellate Authority upto
Commissioner‘s level
2003-04 and 2002-03 11.12
The West Bengal Tax on
Entry of Goods into Local
Areas Act, 2012
Entry Tax High Court 2012-13 and 2013-14 27.75
Total 52.77
(xi) In our opinion and according to the information and explanations given to us, the Company has not defaulted in the repayment
of dues to banks, fi nancial institutions and debenture
holders.
(xii) In our opinion, the Company has not granted loans and
advances on the basis of security by way of pledge of
shares, debentures and other securities.
(xiii) In our opinion and according to the information and
explanations given to us, the terms and conditions of
the guarantees given by the Company for loans taken by
others from banks and fi nancial institutions are not, prima
facie, prejudicial to the interests of the Company.
(xiv) In our opinion and according to the information and
explanations given to us, the term loans have been applied
by the Company for the purposes for which they were
obtained, other than temporary deployment pending
application.
(xv) In our opinion and according to the information and
explanations given to us, and on an overall examination of
the Balance Sheet of the Company, we report that funds
raised on short-term basis have, prima facie, not been used
during the year for long-term investment.
(xvi) To the best of our knowledge and according to the
information and explanations given to us, no fraud by the
Company and no material fraud on the Company has been
noticed or reported during the year.
For DELOITTE HASKINS & SELLS LLP
Chartered Accountants
(Firm’s Registration No. 117366W / W-100018)
Sanjiv V. Pilgaonkar
(Partner)
(Membership No. 039826)
MUMBAI, 30th May, 2014
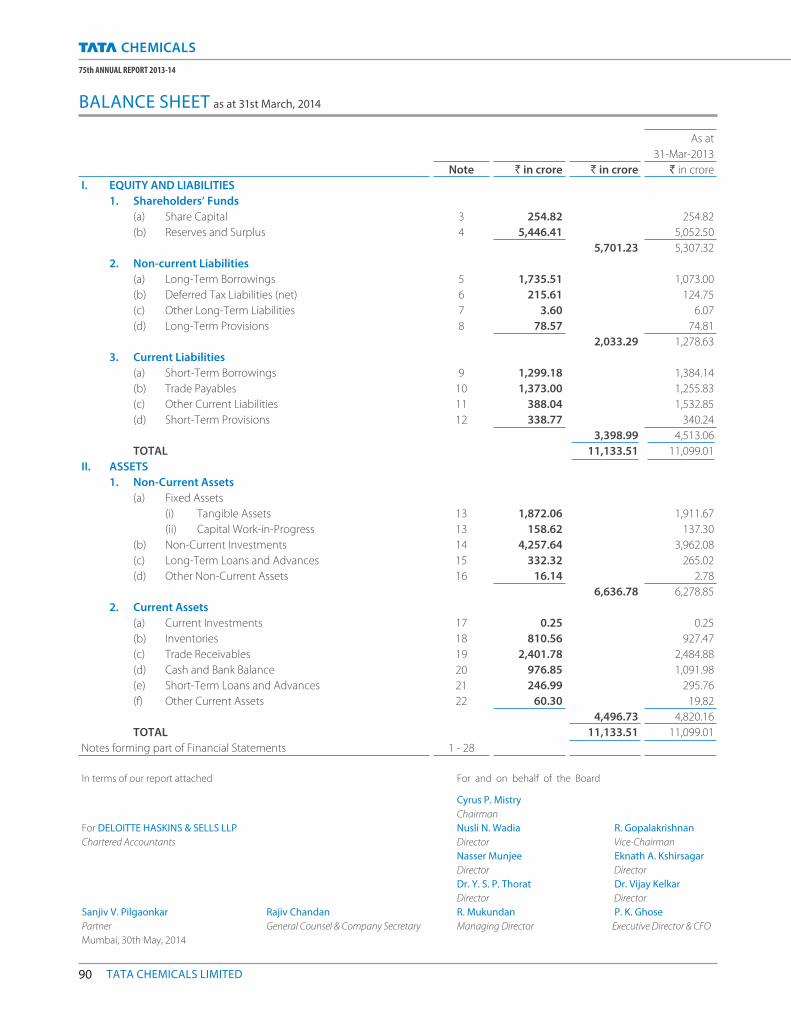
90 TATA CHEMICALS LIMITED
75th ANNUAL REPORT 2013-14
As at
31-Mar-2013
Note ` in crore ` in crore ` in crore
I. EQUITY AND LIABILITIES
1. Shareholders’ Funds
(a) Share Capital 3 254.82 254.82
(b) Reserves and Surplus 4 5,446.41 5,052.50
5,701.23 5,307.32
2. Non-current Liabilities
(a) Long-Term Borrowings 5 1,735.51 1,073.00
(b) Deferred Tax Liabilities (net) 6 215.61 124.75
(c) Other Long-Term Liabilities 7 3.60 6.07
(d) Long-Term Provisions 8 78.57 74.81
2,033.29 1,278.63
3. Current Liabilities
(a) Short-Term Borrowings 9 1,299.18 1,384.14
(b) Trade Payables 10 1,373.00 1,255.83
(c) Other Current Liabilities 11 388.04 1,532.85
(d) Short-Term Provisions 12 338.77 340.24
3,398.99 4,513.06
TOTAL 11,133.51 11,099.01
II. ASSETS
1. Non-Current Assets
(a) Fixed Assets
(i) Tangible Assets 13 1,872.06 1,911.67
(ii) Capital Work-in-Progress 13 158.62 137.30
(b) Non-Current Investments 14 4,257.64 3,962.08
(c) Long-Term Loans and Advances 15 332.32 265.02
(d) Other Non-Current Assets 16 16.14 2.78
6,636.78 6,278.85
2. Current Assets
(a) Current Investments 17 0.25 0.25
(b) Inventories 18 810.56 927.47
(c) Trade Receivables 19 2,401.78 2,484.88
(d) Cash and Bank Balance 20 976.85 1,091.98
(e) Short-Term Loans and Advances 21 246.99 295.76
(f) Other Current Assets 22 60.30 19.82
4,496.73 4,820.16
TOTAL 11,133.51 11,099.01
Notes forming part of Financial Statements 1 - 28
In terms of our report attached For and on behalf of the Board
Cyrus P. Mistry
Chairman
For DELOITTE HASKINS & SELLS LLP Nusli N. Wadia R. Gopalakrishnan
Chartered Accountants Director Vice-Chairman
Nasser Munjee Eknath A. Kshirsagar
Director Director
Dr. Y. S. P. Thorat Dr. Vijay Kelkar
Director Director
Sanjiv V. Pilgaonkar Rajiv Chandan R. Mukundan P. K. Ghose
Partner General Counsel & Company Secretary Managing Director Executive Director & CFO
Mumbai, 30th May, 2014
BALANCE SHEET as at 31st March, 2014
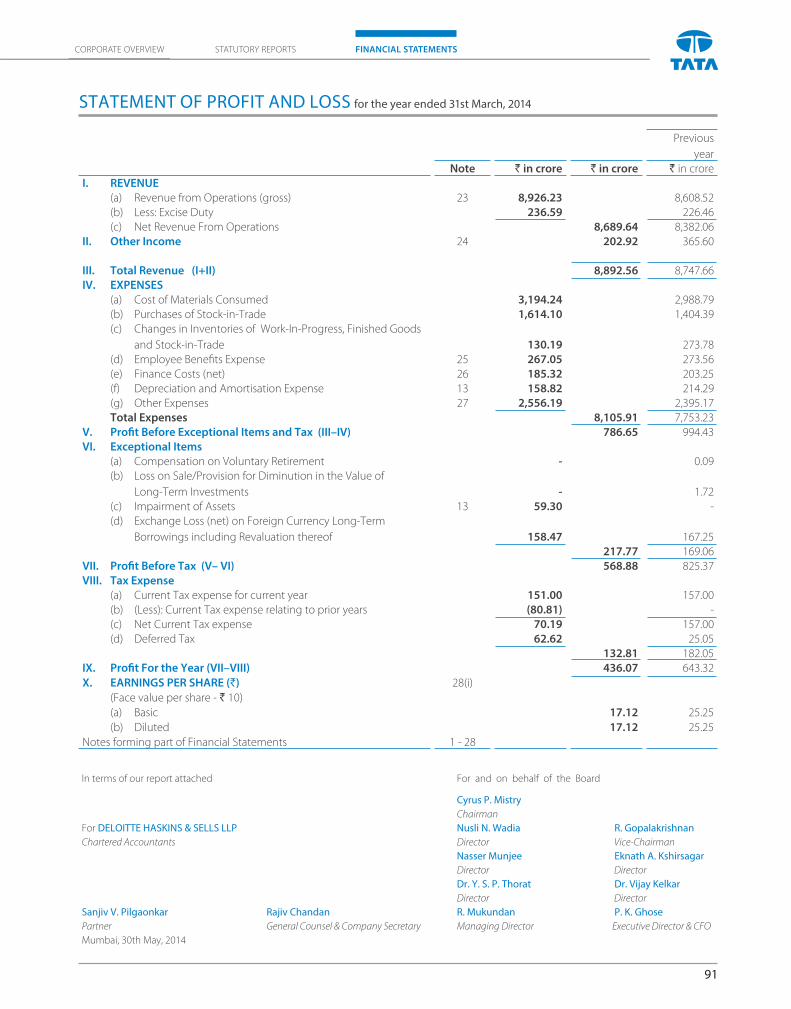
91
CORPORATE OVERVIEW FINANCIAL STATEMENTSSTATUTORY REPORTS
Previous
year
Note ` in crore ` in crore ` in crore
I. REVENUE
(a) Revenue from Operations (gross) 23 8,926.23 8,608.52
(b) Less: Excise Duty 236.59 226.46
(c) Net Revenue From Operations 8,689.64 8,382.06
II. Other Income 24 202.92 365.60
III. Total Revenue (I+II) 8,892.56 8,747.66
IV. EXPENSES
(a) Cost of Materials Consumed 3,194.24 2,988.79
(b) Purchases of Stock-in-Trade 1,614.10 1,404.39
(c) Changes in Inventories of Work-In-Progress, Finished Goods
and Stock-in-Trade 130.19 273.78
(d) Employee Benefi ts Expense 25 267.05 273.56
(e) Finance Costs (net) 26 185.32 203.25
(f) Depreciation and Amortisation Expense 13 158.82 214.29
(g) Other Expenses 27 2,556.19 2,395.17
Total Expenses 8,105.91 7,753.23
V. Profi t Before Exceptional Items and Tax (III–IV) 786.65 994.43
VI. Exceptional Items
(a) Compensation on Voluntary Retirement - 0.09
(b) Loss on Sale/Provision for Diminution in the Value of
Long-Term Investments - 1.72
(c) Impairment of Assets 13 59.30 -
(d) Exchange Loss (net) on Foreign Currency Long-Term
Borrowings including Revaluation thereof 158.47 167.25
217.77 169.06
VII. Profi t Before Tax (V– VI) 568.88 825.37
VIII. Tax Expense
(a) Current Tax expense for current year 151.00 157.00
(b) (Less): Current Tax expense relating to prior years (80.81) -
(c) Net Current Tax expense 70.19 157.00
(d) Deferred Tax 62.62 25.05
132.81 182.05
IX. Profi t For the Year (VII–VIII) 436.07 643.32
X. EARNINGS PER SHARE (`) 28(i)
(Face value per share - ` 10)
(a) Basic 17.12 25.25
(b) Diluted 17.12 25.25
Notes forming part of Financial Statements 1 - 28
STATEMENT OF PROFIT AND LOSS for the year ended 31st March, 2014
In terms of our report attached For and on behalf of the Board
Cyrus P. Mistry
Chairman
For DELOITTE HASKINS & SELLS LLP Nusli N. Wadia R. Gopalakrishnan
Chartered Accountants Director Vice-Chairman
Nasser Munjee Eknath A. Kshirsagar
Director Director
Dr. Y. S. P. Thorat Dr. Vijay Kelkar
Director Director
Sanjiv V. Pilgaonkar Rajiv Chandan R. Mukundan P. K. Ghose
Partner General Counsel & Company Secretary Managing Director Executive Director & CFO
Mumbai, 30th May, 2014
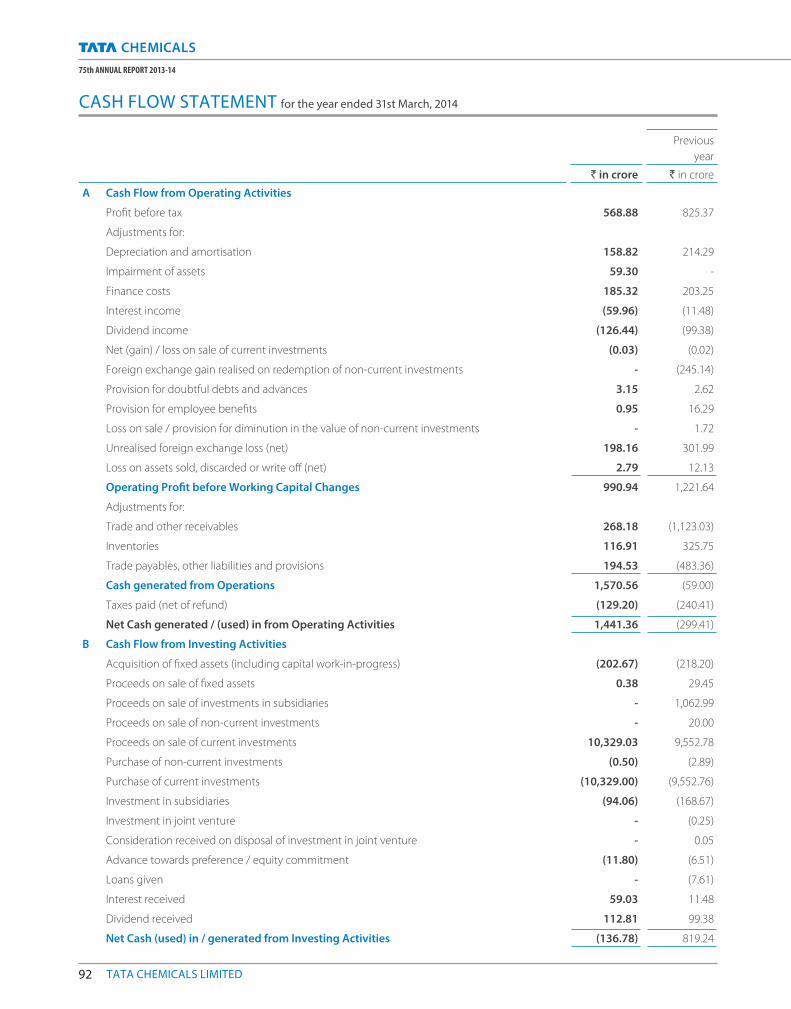
92 TATA CHEMICALS LIMITED
75th ANNUAL REPORT 2013-14
Previous
year
` in crore ` in crore
A Cash Flow from Operating Activities
Profi t before tax 568.88 825.37
Adjustments for:
Depreciation and amortisation 158.82 214.29
Impairment of assets 59.30 -
Finance costs 185.32 203.25
Interest income (59.96) (11.48)
Dividend income (126.44) (99.38)
Net (gain) / loss on sale of current investments (0.03) (0.02)
Foreign exchange gain realised on redemption of non-current investments - (245.14)
Provision for doubtful debts and advances 3.15 2.62
Provision for employee benefi ts 0.95 16.29
Loss on sale / provision for diminution in the value of non-current investments - 1.72
Unrealised foreign exchange loss (net) 198.16 301.99
Loss on assets sold, discarded or write off (net) 2.79 12.13
Operating Profi t before Working Capital Changes 990.94 1,221.64
Adjustments for:
Trade and other receivables 268.18 (1,123.03)
Inventories 116.91 325.75
Trade payables, other liabilities and provisions 194.53 (483.36)
Cash generated from Operations 1,570.56 (59.00)
Taxes paid (net of refund) (129.20) (240.41)
Net Cash generated / (used) in from Operating Activities 1,441.36 (299.41)
B Cash Flow from Investing Activities
Acquisition of fi xed assets (including capital work-in-progress) (202.67) (218.20)
Proceeds on sale of fi xed assets 0.38 29.45
Proceeds on sale of investments in subsidiaries - 1,062.99
Proceeds on sale of non-current investments - 20.00
Proceeds on sale of current investments 10,329.03 9,552.78
Purchase of non-current investments (0.50) (2.89)
Purchase of current investments (10,329.00) (9,552.76)
Investment in subsidiaries (94.06) (168.67)
Investment in joint venture - (0.25)
Consideration received on disposal of investment in joint venture - 0.05
Advance towards preference / equity commitment (11.80) (6.51)
Loans given - (7.61)
Interest received 59.03 11.48
Dividend received 112.81 99.38
Net Cash (used) in / generated from Investing Activities (136.78) 819.24
CASH FLOW STATEMENT for the year ended 31st March, 2014
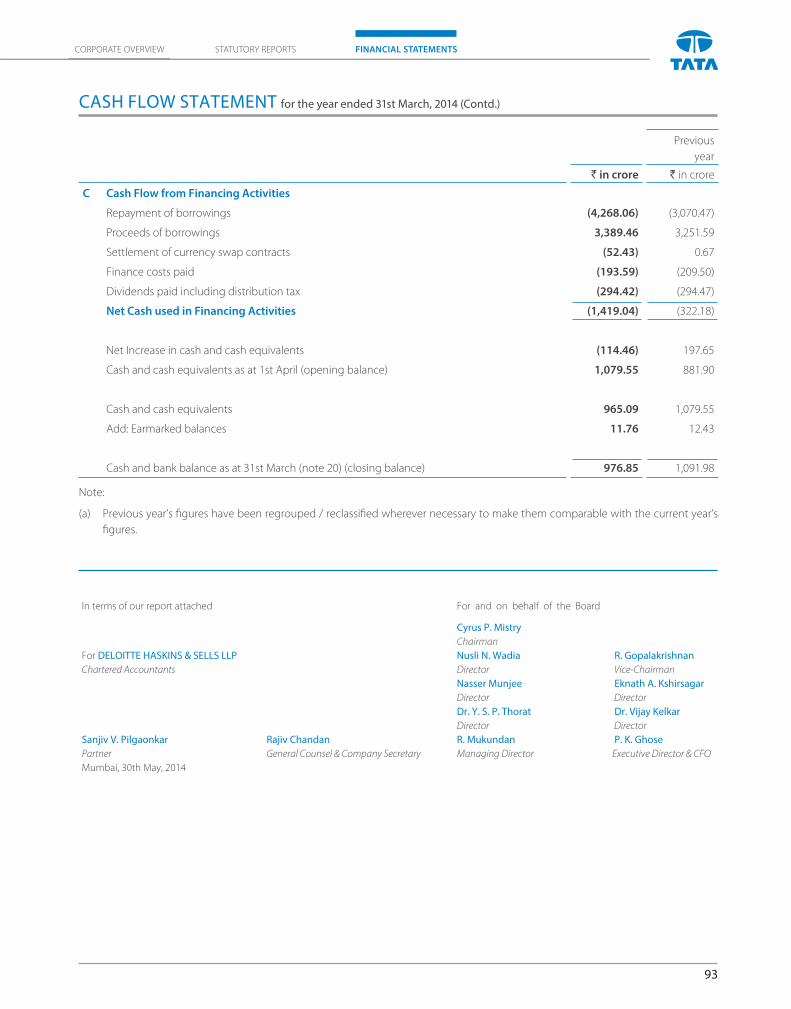
93
CORPORATE OVERVIEW FINANCIAL STATEMENTSSTATUTORY REPORTS
Previous
year
` in crore ` in crore
C Cash Flow from Financing Activities
Repayment of borrowings (4,268.06) (3,070.47)
Proceeds of borrowings 3,389.46 3,251.59
Settlement of currency swap contracts (52.43) 0.67
Finance costs paid (193.59) (209.50)
Dividends paid including distribution tax (294.42) (294.47)
Net Cash used in Financing Activities (1,419.04) (322.18)
Net Increase in cash and cash equivalents (114.46) 197.65
Cash and cash equivalents as at 1st April (opening balance) 1,079.55 881.90
Cash and cash equivalents 965.09 1,079.55
Add: Earmarked balances 11.76 12.43
Cash and bank balance as at 31st March (note 20) (closing balance) 976.85 1,091.98
Note:
(a) Previous year’s fi gures have been regrouped / reclassifi ed wherever necessary to make them comparable with the current year’s
fi gures.
CASH FLOW STATEMENT for the year ended 31st March, 2014 (Contd.)
In terms of our report attached For and on behalf of the Board
Cyrus P. Mistry
Chairman
For DELOITTE HASKINS & SELLS LLP Nusli N. Wadia R. Gopalakrishnan
Chartered Accountants Director Vice-Chairman
Nasser Munjee Eknath A. Kshirsagar
Director Director
Dr. Y. S. P. Thorat Dr. Vijay Kelkar
Director Director
Sanjiv V. Pilgaonkar Rajiv Chandan R. Mukundan P. K. Ghose
Partner General Counsel & Company Secretary Managing Director Executive Director & CFO
Mumbai, 30th May, 2014
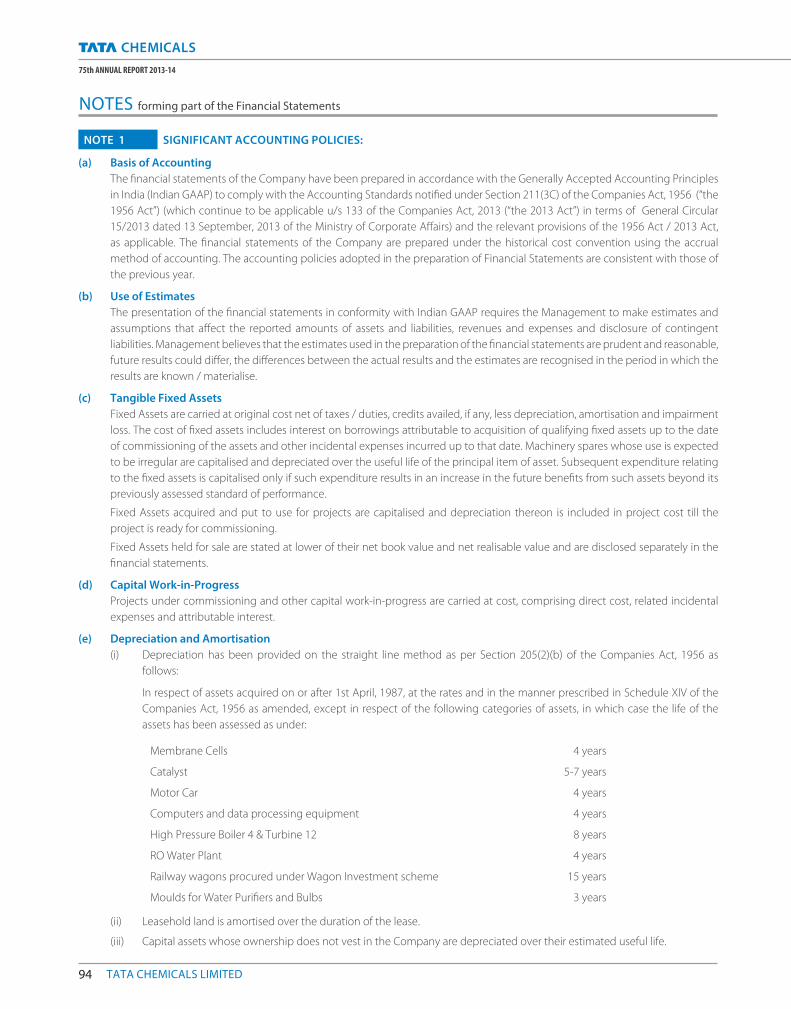
94 TATA CHEMICALS LIMITED
75th ANNUAL REPORT 2013-14
NOTE 1 SIGNIFICANT ACCOUNTING POLICIES:
(a) Basis of Accounting
The fi nancial statements of the Company have been prepared in accordance with the Generally Accepted Accounting Principles
in India (Indian GAAP) to comply with the Accounting Standards notifi ed under Section 211(3C) of the Companies Act, 1956 (“the
1956 Act”) (which continue to be applicable u/s 133 of the Companies Act, 2013 (“the 2013 Act”) in terms of General Circular
15/2013 dated 13 September, 2013 of the Ministry of Corporate Aff airs) and the relevant provisions of the 1956 Act / 2013 Act,
as applicable. The fi nancial statements of the Company are prepared under the historical cost convention using the accrual
method of accounting. The accounting policies adopted in the preparation of Financial Statements are consistent with those of
the previous year.
(b) Use of Estimates
The presentation of the fi nancial statements in conformity with Indian GAAP requires the Management to make estimates and
assumptions that aff ect the reported amounts of assets and liabilities, revenues and expenses and disclosure of contingent
liabilities. Management believes that the estimates used in the preparation of the fi nancial statements are prudent and reasonable,
future results could diff er, the diff erences between the actual results and the estimates are recognised in the period in which the
results are known / materialise.
(c) Tangible Fixed Assets
Fixed Assets are carried at original cost net of taxes / duties, credits availed, if any, less depreciation, amortisation and impairment
loss. The cost of fi xed assets includes interest on borrowings attributable to acquisition of qualifying fi xed assets up to the date
of commissioning of the assets and other incidental expenses incurred up to that date. Machinery spares whose use is expected
to be irregular are capitalised and depreciated over the useful life of the principal item of asset. Subsequent expenditure relating
to the fi xed assets is capitalised only if such expenditure results in an increase in the future benefi ts from such assets beyond its
previously assessed standard of performance.
Fixed Assets acquired and put to use for projects are capitalised and depreciation thereon is included in project cost till the
project is ready for commissioning.
Fixed Assets held for sale are stated at lower of their net book value and net realisable value and are disclosed separately in the
fi nancial statements.
(d) Capital Work-in-Progress
Projects under commissioning and other capital work-in-progress are carried at cost, comprising direct cost, related incidental
expenses and attributable interest.
(e) Depreciation and Amortisation
(i) Depreciation has been provided on the straight line method as per Section 205(2)(b) of the Companies Act, 1956 as
follows:
In respect of assets acquired on or after 1st April, 1987, at the rates and in the manner prescribed in Schedule XIV of the
Companies Act, 1956 as amended, except in respect of the following categories of assets, in which case the life of the
assets has been assessed as under:
Membrane Cells 4 years
Catalyst 5-7 years
Motor Car 4 years
Computers and data processing equipment 4 years
High Pressure Boiler 4 & Turbine 12 8 years
RO Water Plant 4 years
Railway wagons procured under Wagon Investment scheme 15 years
Moulds for Water Purifi ers and Bulbs 3 years
(ii) Leasehold land is amortised over the duration of the lease.
(iii) Capital assets whose ownership does not vest in the Company are depreciated over their estimated useful life.
NOTES forming part of the Financial Statements
95
CORPORATE OVERVIEW FINANCIAL STATEMENTSSTATUTORY REPORTS
(f) Impairment of Tangible Fixed Assets
The carrying values of assets / cash generating units at each Balance Sheet date are reviewed for impairment of assets. If any
indication of such impairment exists, the recoverable amount of such assets is estimated and impairment is recognised, if the
carrying amount of these assets exceeds their recoverable amount. The recoverable amount is the greater of the net selling
price and their value in use. Value in use is arrived at by discounting the future cash fl ows to their present value based on an
appropriate discount factor. When there is indication that an impairment loss recognised for an asset in prior accounting periods
no longer exists or may have decreased, such reversal of impairment loss is recognised in the Statement of Profi t and Loss.
(g) Investments
Long-term investments are carried individually at cost less provision for diminution, other than temporary, in the value of such
investments. Current investments are carried individually, at lower of cost and fair value. Cost of investments includes acquisition
charges such as brokerage, fees and duties.
(h) Inventories
Inventories are valued at lower of cost (on weighted average basis) and net realisable value after providing for obsolescence
and other losses, where considered necessary. Cost includes all charges in bringing the goods to their present location and
condition, including octroi and other levies, transit insurance and receiving charges. Work-in-process and fi nished goods include
appropriate proportion of overheads and, where applicable, excise duty.
(i) Revenue Recognition
Sales of Goods
Sales are recognised, net of returns including estimated returns where applicable, and trade discounts, Sales Tax and Value Added
Tax, on dispatch of goods to customers. In respect of Urea, sales are recognised based on provisional rates of group concession
as notifi ed under the New Pricing Scheme. Equated freight claims and escalation claims for Urea sales are estimated by the
Management based on the norms prescribed or notifi ed under the said Scheme. In case of complex fertilisers, sales include price
concession, as notifi ed under the Concession Scheme, or as estimated by the Management based on the norms prescribed.
Income from Services
Revenues from contracts priced on a time and material basis are recognised when services are rendered and related costs are
incurred. Foreseeable losses on such contracts are recognised when probable.
(j) Other Income
Interest income is accounted on accrual basis. Dividend income is accounted for when the right to receive income is
established.
(k) Insurance Claims
Insurance claims are accounted for on the basis of claims admitted / expected to be admitted and to the extent that there is no
uncertainty in receiving the claims.
(l) Research and Development Expenses
Revenue expenditure pertaining to research and development is charged to the Statement of Profi t and Loss. Expenditure on
tangible fi xed assets used in research and development is capitalised.
(m) Leases
Lease arrangements where the risks and rewards incidental to ownership of an asset substantially vest with the lessor are
recognised as operating leases. Lease rentals under operating leases are recognised in the Statement of Profi t and Loss on a
straight-line basis.
(n) Debenture Issues Expenses
Debenture issue expenses and redemption premium are adjusted against the Securities Premium Account as permissible under
Section 78(2) of the Companies Act, 1956.
(o) Employee Benefi ts
Employee benefi ts consist of provident fund, superannuation fund, gratuity fund, compensated absences, long service awards,
post retirement medical benefi ts, directors’ retirement obligations and family benefi t scheme.
(i) Post-employment benefi t plans
Payments to defi ned contribution retirement benefi t scheme for eligible employees in the form of superannuation fund
are charged as an expense as they fall due.
NOTES forming part of the Financial Statements (contd.)
96 TATA CHEMICALS LIMITED
75th ANNUAL REPORT 2013-14
For defi ned benefi t schemes in the form of gratuity fund, post retirement medical benefi ts, directors’ pension liabilities and
family benefi t scheme, the cost of providing benefi ts is determined using the projected unit credit method, with actuarial
valuations being carried out at each Balance Sheet date. Actuarial gains and losses are recognised in the Statement of
Profi t and Loss for the period in which they occur. Past service cost is recognised immediately to the extent that the
benefi ts are already vested, and otherwise is amortised on a straight-line basis over the average period until the benefi ts
become vested. The retirement benefi t obligation recognised in the Balance Sheet represents the present value of the
defi ned benefi t obligation as adjusted for unrecognised past service cost and as reduced by the fair value of scheme
assets. Any asset resulting from this calculation is limited to past service cost plus the present value of available refunds
and reductions in future contributions to the schemes.
The Company makes contribution towards provident fund, in substance a defi ned contribution retirement benefi t
plan. The provident fund is administered by the Trustees of the Tata Chemicals Limited Provident Fund. The rules of the
Company’s provident fund administered by a Trust, require that if the Board of Trustees are unable to pay interest at the
rate declared by the Employees’ Provident Fund by the Government under para 60 of the Employees’ Provident Fund
Scheme, 1952 for the reason that the return on investment is less or for any other reason, then the defi ciency shall be made
good by the Company. Having regard to the assets of the fund and the return on the investments, the Company does not
expect any defi ciency as at the year end.
Other defi ned benefi t scheme like family benefi t scheme is an unfunded defi ned benefi t plan. The benefi ts of the plan
accrue to eligible employees at the time of death or permanent disablement while in service, either as a result of an
injury or as certifi ed by the Company’s Medical Board. The monthly payment to dependents of the deceased / disabled
employee under the plan equals 100% of the last drawn basic salary in case of Management and Offi cer cadre employees
and 100% of the last drawn basic salary plus dearness allowance and fi xed additional dearness allowance for employees
in the workmen category. The Company accounts for the liability for family benefi t scheme payable in future based on the
cost of providing benefi ts is determined using the projected unit credit method by an independent actuarial valuation
carried out at each Balance Sheet date.
(ii) Short-term employee benefi ts
The undiscounted amount of short-term employee benefi ts expected to be paid in exchange for the services rendered by
employees is recognised during the period when the employees render the service. These benefi ts include compensated
absences such as paid annual leave and performance incentives.
The cost of compensated absences is accounted as under:
(a) in case of accumulated compensated absences, when employees render the services that increase their entitlement
of future compensated absences; and
(b) in case of non-accumulating compensated absences, when the absences occur.
(iii) Long-term employee benefi ts
Compensated absences which are not expected to occur within twelve months after the end of the period in which the
employee renders the related services are recognised as a liability at the present value of the defi ned benefi t obligation
at the Balance Sheet date. Long Service Awards are recognised as a liability at the present value of the defi ned benefi t
obligation at the Balance Sheet date.
(p) Employee Separation Compensation
(i) Compensation payable to employees who have opted for retirement under “Early Separation Scheme” is amortised over
the period for which benefi t is expected. The liability has been calculated on the basis of net present value of the future
payments of pension.
(ii) Liability under “Early Separation Scheme” is computed and accounted at the Net Present Value.
(iii) Compensation paid / payable to employees who have opted for retirement under Voluntary Retirement Scheme including
ex-gratia is charged to statement of Profi t and Loss in the year of separation.
(q) Finance Costs
Costs in connection with the borrowing of funds to the extent not directly related to the acquisition of fi xed assets are
amortised and charged to Statement of Profi t and Loss, over the tenure of the loan. Interest on borrowed money, allocated
NOTES forming part of the Financial Statements (contd.)
97
CORPORATE OVERVIEW FINANCIAL STATEMENTSSTATUTORY REPORTS
to and utilised for qualifying fi xed assets, pertaining to the period upto the date of capitalisation is added to the cost of the
assets.
Borrowing cost includes interest and amortisation of ancillary costs incurred in connection with the arrangement of borrowings.
(r) Foreign Currency Transactions and Translation
(i) Foreign currency transactions (other than derivatives) of the Company and its net investment in non-integral foreign
operations are recorded on initial recognition in the reporting currency, using the exchange rate at the date of the
transaction. Foreign currency monetary assets and liabilities (other than derivatives) of the company and its net investment
in non-integral foreign operations as at the Balance Sheet date are restated at the year end rates and the resultant net
gains or losses are recognised as income or expense in the Statement of Profi t and Loss in the year in which they arise.
The exchange diff erences on long term loans to non-integral foreign operations are accumulated in a Foreign Currency
Translation Reserve, until disposal / recovery of the net investment.
During the year ended 31st March, 2012, the Company had exercised the option granted vide notifi cation F.No.17/133/2008/
CL-V dated 29th December, 2011 issued by the Ministry of Corporate Aff airs and accordingly, the exchange diff erences
arising on revaluation of long term foreign currency monetary items have been recognised over the shorter of the loan
repayment period and 31st March, 2020. The unamortised balance is presented as “Foreign Currency Monetary Item
Translation Diff erence Account” net of tax eff ect thereon.
(ii) Premium / discount on forward exchange contracts, related to monetary items which are not intended for trading or
speculation purposes, are amortised over the period of the contract.
(s) Derivative Contracts
The Company enters into derivative contracts in the nature of full currency swaps, currency options, forward contracts
with an intention to hedge its existing assets and liabilities, fi rm commitments and highly probable transactions. Derivative
contracts which are closely linked to the underlying transactions are recognised in accordance with the contract terms and
accounted as per the policy stated for foreign currency transaction and translation. All other contracts are marked-to-market
and losses are recognised in the Statement of Profi t and Loss. Gains arising on the same are not recognised on grounds of
prudence.
(t) Government Grants
Government grants and subsidies are recognised when there is reasonable assurance that the Company will comply with the
conditions attached to them and the grants/subsidy will be received. Government grants whose primary condition is that the
company should purchase, construct or otherwise acquire capital assets are presented by deducting them from the carrying
value of the assets. The grant is recognised as income over the life of the depreciable assets by way of a reduced depreciation
charge. Other government grants and subsidies are recognised as income over the periods necessary to match them with the
costs for which they are intended to compensate on a systematic basis.
(u) Segment Reporting
The Company identifi es primary segments based on the dominant source, nature of risks and returns and the internal organisation.
The operating segments are the segments for which separate fi nancial information is available and for which operating profi t/
loss amounts are evaluated regularly by the executive Management in deciding how to allocate resources and in assessing
performance.
The accounting policies adopted for segment reporting are in line with the accounting policies of the Company. Segment
revenue, segment expenses, segment assets and segment liabilities have been identifi ed to segments on the basis of their
relationship to the operating activities of the segment. Inter Segment revenue is accounted on the basis of transactions which are
primarily determined based on market / fair value factors. Revenue, expenses, assets and liabilities which relate to the Company
as a whole and are not allocable to segments on reasonable basis have been included under “unallocated revenue / expenses /
assets / liabilities”.
(v) Taxes on Income
Current tax is the amount of tax payable on the taxable income for the year as determined in accordance with the provisions of
the Income Tax Act,1961.
Deferred fax is recognised on timing diff erences, being the diff erences between the taxable income and the accounting income
that originate in one period and are capable of reversal in one or more subsequent periods.
NOTES forming part of the Financial Statements (contd.)
98 TATA CHEMICALS LIMITED
75th ANNUAL REPORT 2013-14
Deferred tax assets in respect of unabsorbed depreciation and carry forward of losses are recognised if there is virtual certainty
that there will be suffi cient future taxable income available to realise such losses. Other deferred tax assets are recognised if there
is reasonable certainty that there will be suffi cient future taxable income to realise such assets.
(w) Provisions and Contingencies
A provision is recognised when the Company has a present obligation as a result of past events and it is probable that an outfl ow
of resources will be required to settle the obligation, in respect of which a reliable estimate can be made. Provisions (excluding
retirement benefi ts) are not discounted to their present value and are determined based on best estimate required to settle the
obligation at the Balance Sheet date. These are reviewed at each Balance Sheet date and adjusted to refl ect the current best
estimates. Contingent liabilities are disclosed in notes forming part of the fi nancial statements.
NOTE 2 CASH FLOW STATEMENT
Cash fl ows are reported using the indirect method, whereby profi t / (loss) before extraordinary items and tax is adjusted for the eff ects of
transactions of non-cash nature and any deferrals or accruals of past or future cash receipts or payments. The cash fl ows from operating,
investing and fi nancing activities of the Company are segregated based on the available information.
Cash and Cash Equivalents
Cash comprises cash on hand and demand deposits with banks. Cash equivalents are short-term balances (with an original maturity of
three months or less from the date of acquisition), highly liquid time deposits that are readily convertible into known amounts of cash
and which are subject to insignifi cant risk of changes in value.
NOTES forming part of the Financial Statements (contd.)
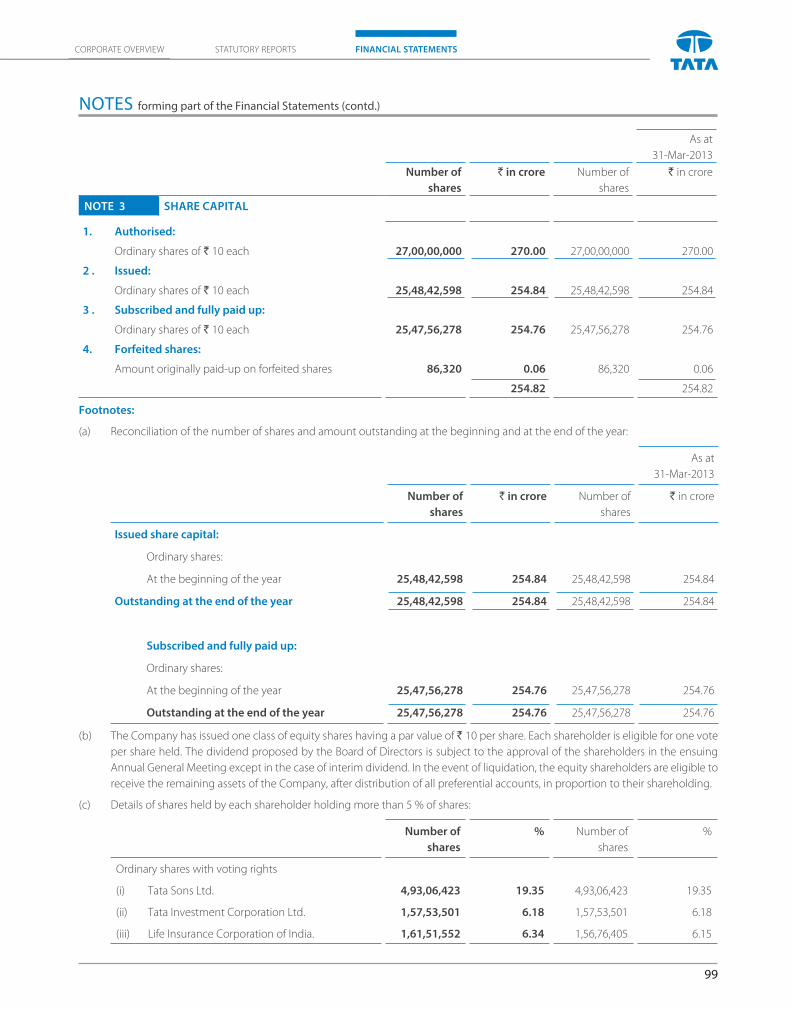
99
CORPORATE OVERVIEW FINANCIAL STATEMENTSSTATUTORY REPORTS
As at
31-Mar-2013
Number of
shares
` in crore Number of
shares
` in crore
NOTE 3 SHARE CAPITAL
1. Authorised:
Ordinary shares of ` 10 each 27,00,00,000 270.00 27,00,00,000 270.00
2 . Issued:
Ordinary shares of ` 10 each 25,48,42,598 254.84 25,48,42,598 254.84
3 . Subscribed and fully paid up:
Ordinary shares of ` 10 each 25,47,56,278 254.76 25,47,56,278 254.76
4. Forfeited shares:
Amount originally paid-up on forfeited shares 86,320 0.06 86,320 0.06
254.82 254.82
Footnotes:
(a) Reconciliation of the number of shares and amount outstanding at the beginning and at the end of the year:
As at
31-Mar-2013
Number of
shares
` in crore Number of
shares
` in crore
Issued share capital:
Ordinary shares:
At the beginning of the year 25,48,42,598 254.84 25,48,42,598 254.84
Outstanding at the end of the year 25,48,42,598 254.84 25,48,42,598 254.84
Subscribed and fully paid up:
Ordinary shares:
At the beginning of the year 25,47,56,278 254.76 25,47,56,278 254.76
Outstanding at the end of the year 25,47,56,278 254.76 25,47,56,278 254.76
(b) The Company has issued one class of equity shares having a par value of ` 10 per share. Each shareholder is eligible for one vote
per share held. The dividend proposed by the Board of Directors is subject to the approval of the shareholders in the ensuing
Annual General Meeting except in the case of interim dividend. In the event of liquidation, the equity shareholders are eligible to
receive the remaining assets of the Company, after distribution of all preferential accounts, in proportion to their shareholding.
(c) Details of shares held by each shareholder holding more than 5 % of shares:
Number of
shares
% Number of
shares
%
Ordinary shares with voting rights
(i) Tata Sons Ltd. 4,93,06,423 19.35 4,93,06,423 19.35
(ii) Tata Investment Corporation Ltd. 1,57,53,501 6.18 1,57,53,501 6.18
(iii) Life Insurance Corporation of India. 1,61,51,552 6.34 1,56,76,405 6.15
NOTES forming part of the Financial Statements (contd.)
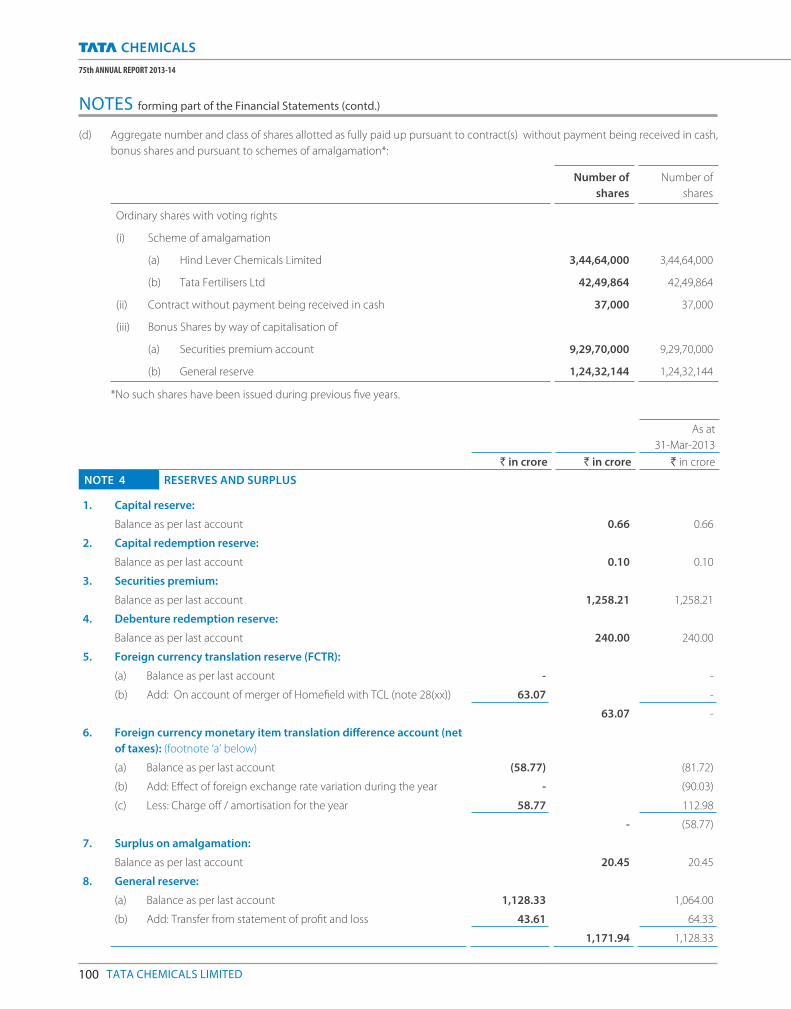
100 TATA CHEMICALS LIMITED
75th ANNUAL REPORT 2013-14
(d) Aggregate number and class of shares allotted as fully paid up pursuant to contract(s) without payment being received in cash,
bonus shares and pursuant to schemes of amalgamation*:
Number of
shares
Number of
shares
Ordinary shares with voting rights
(i) Scheme of amalgamation
(a) Hind Lever Chemicals Limited 3,44,64,000 3,44,64,000
(b) Tata Fertilisers Ltd 42,49,864 42,49,864
(ii) Contract without payment being received in cash 37,000 37,000
(iii) Bonus Shares by way of capitalisation of
(a) Securities premium account 9,29,70,000 9,29,70,000
(b) General reserve 1,24,32,144 1,24,32,144
*No such shares have been issued during previous fi ve years.
As at
31-Mar-2013
` in crore ` in crore ` in crore
NOTE 4 RESERVES AND SURPLUS
1. Capital reserve:
Balance as per last account 0.66 0.66
2. Capital redemption reserve:
Balance as per last account 0.10 0.10
3. Securities premium:
Balance as per last account 1,258.21 1,258.21
4. Debenture redemption reserve:
Balance as per last account 240.00 240.00
5. Foreign currency translation reserve (FCTR):
(a) Balance as per last account - -
(b) Add: On account of merger of Homefi eld with TCL (note 28(xx)) 63.07 -
63.07 -
6. Foreign currency monetary item translation diff erence account (net
of taxes): (footnote ‘a’ below)
(a) Balance as per last account (58.77) (81.72)
(b) Add: Eff ect of foreign exchange rate variation during the year - (90.03)
(c) Less: Charge off / amortisation for the year 58.77 112.98
- (58.77)
7. Surplus on amalgamation:
Balance as per last account 20.45 20.45
8. General reserve:
(a) Balance as per last account 1,128.33 1,064.00
(b) Add: Transfer from statement of profi t and loss 43.61 64.33
1,171.94 1,128.33
NOTES forming part of the Financial Statements (contd.)
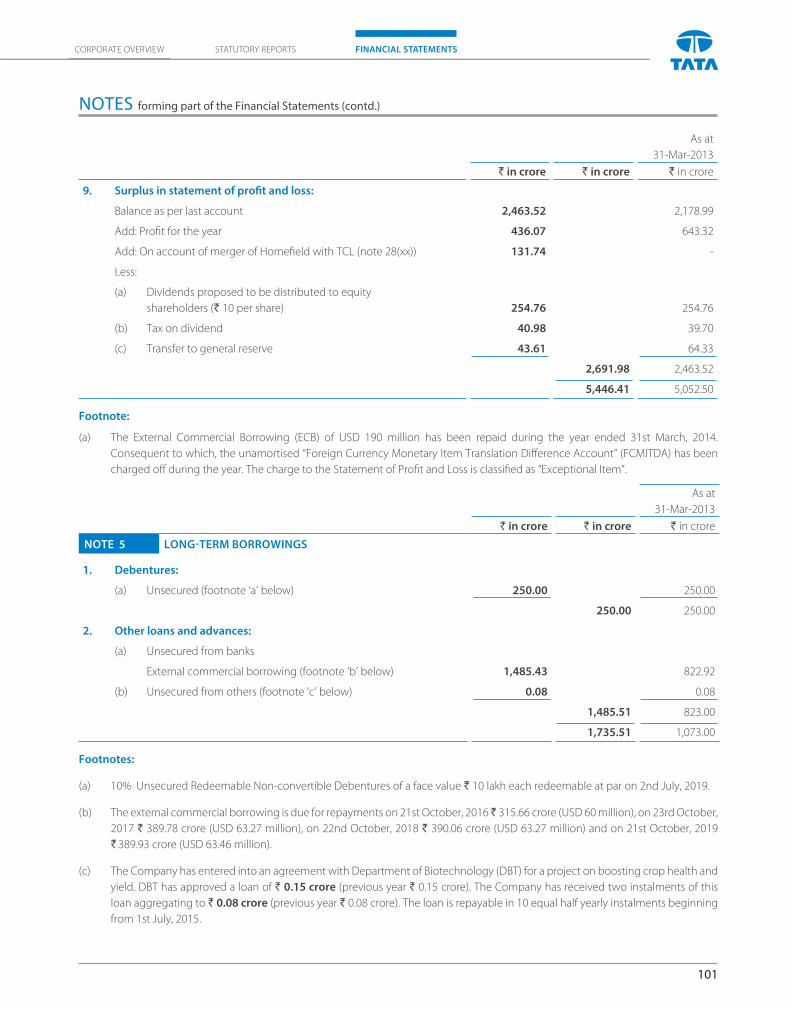
101
CORPORATE OVERVIEW FINANCIAL STATEMENTSSTATUTORY REPORTS
As at
31-Mar-2013
` in crore ` in crore ` in crore
9. Surplus in statement of profi t and loss:
Balance as per last account 2,463.52 2,178.99
Add: Profi t for the year 436.07 643.32
Add: On account of merger of Homefi eld with TCL (note 28(xx)) 131.74 -
Less:
(a) Dividends proposed to be distributed to equity
shareholders (` 10 per share) 254.76 254.76
(b) Tax on dividend 40.98 39.70
(c) Transfer to general reserve 43.61 64.33
2,691.98 2,463.52
5,446.41 5,052.50
Footnote:
(a) The External Commercial Borrowing (ECB) of USD 190 million has been repaid during the year ended 31st March, 2014.
Consequent to which, the unamortised “Foreign Currency Monetary Item Translation Diff erence Account” (FCMITDA) has been
charged off during the year. The charge to the Statement of Profi t and Loss is classifi ed as “Exceptional Item”.
As at
31-Mar-2013
` in crore ` in crore ` in crore
NOTE 5 LONG-TERM BORROWINGS
1. Debentures:
(a) Unsecured (footnote ‘a’ below) 250.00 250.00
250.00 250.00
2. Other loans and advances:
(a) Unsecured from banks
External commercial borrowing (footnote ‘b’ below) 1,485.43 822.92
(b) Unsecured from others (footnote ‘c’ below) 0.08 0.08
1,485.51 823.00
1,735.51 1,073.00
Footnotes:
(a) 10% Unsecured Redeemable Non-convertible Debentures of a face value ` 10 lakh each redeemable at par on 2nd July, 2019.
(b) The external commercial borrowing is due for repayments on 21st October, 2016 ̀ 315.66 crore (USD 60 million), on 23rd October,
2017 ` 389.78 crore (USD 63.27 million), on 22nd October, 2018 ` 390.06 crore (USD 63.27 million) and on 21st October, 2019
` 389.93 crore (USD 63.46 million).
(c) The Company has entered into an agreement with Department of Biotechnology (DBT) for a project on boosting crop health and
yield. DBT has approved a loan of ` 0.15 crore (previous year ` 0.15 crore). The Company has received two instalments of this
loan aggregating to ` 0.08 crore (previous year ` 0.08 crore). The loan is repayable in 10 equal half yearly instalments beginning
from 1st July, 2015.
NOTES forming part of the Financial Statements (contd.)
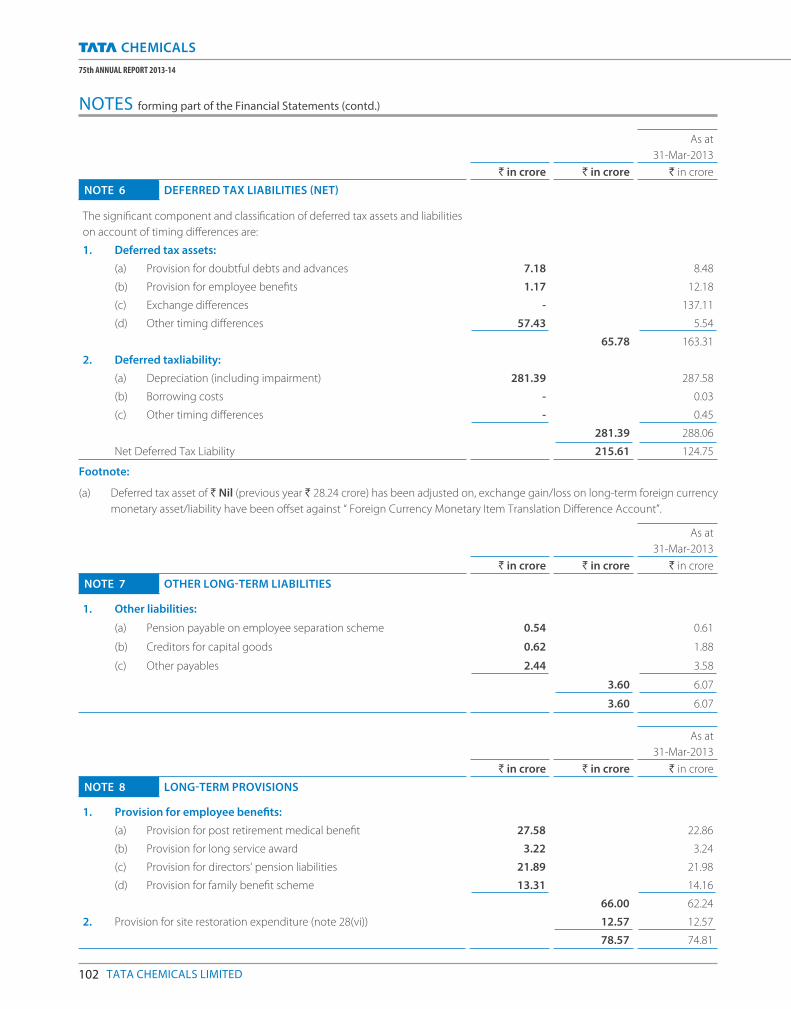
102 TATA CHEMICALS LIMITED
75th ANNUAL REPORT 2013-14
As at
31-Mar-2013
` in crore ` in crore ` in crore
NOTE 6 DEFERRED TAX LIABILITIES (NET)
The signifi cant component and classifi cation of deferred tax assets and liabilities
on account of timing diff erences are:
1. Deferred tax assets:
(a) Provision for doubtful debts and advances 7.18 8.48
(b) Provision for employee benefi ts 1.17 12.18
(c) Exchange diff erences - 137.11
(d) Other timing diff erences 57.43 5.54
65.78 163.31
2. Deferred taxliability:
(a) Depreciation (including impairment) 281.39 287.58
(b) Borrowing costs - 0.03
(c) Other timing diff erences - 0.45
281.39 288.06
Net Deferred Tax Liability 215.61 124.75
Footnote:
(a) Deferred tax asset of ` Nil (previous year ` 28.24 crore) has been adjusted on, exchange gain/loss on long-term foreign currency
monetary asset/liability have been off set against “ Foreign Currency Monetary Item Translation Diff erence Account”.
As at
31-Mar-2013
` in crore ` in crore ` in crore
NOTE 7 OTHER LONG-TERM LIABILITIES
1. Other liabilities:
(a) Pension payable on employee separation scheme 0.54 0.61
(b) Creditors for capital goods 0.62 1.88
(c) Other payables 2.44 3.58
3.60 6.07
3.60 6.07
As at
31-Mar-2013
` in crore ` in crore ` in crore
NOTE 8 LONG-TERM PROVISIONS
1. Provision for employee benefi ts:
(a) Provision for post retirement medical benefi t 27.58 22.86
(b) Provision for long service award 3.22 3.24
(c) Provision for directors‘ pension liabilities 21.89 21.98
(d) Provision for family benefi t scheme 13.31 14.16
66.00 62.24
2. Provision for site restoration expenditure (note 28(vi)) 12.57 12.57
78.57 74.81
NOTES forming part of the Financial Statements (contd.)
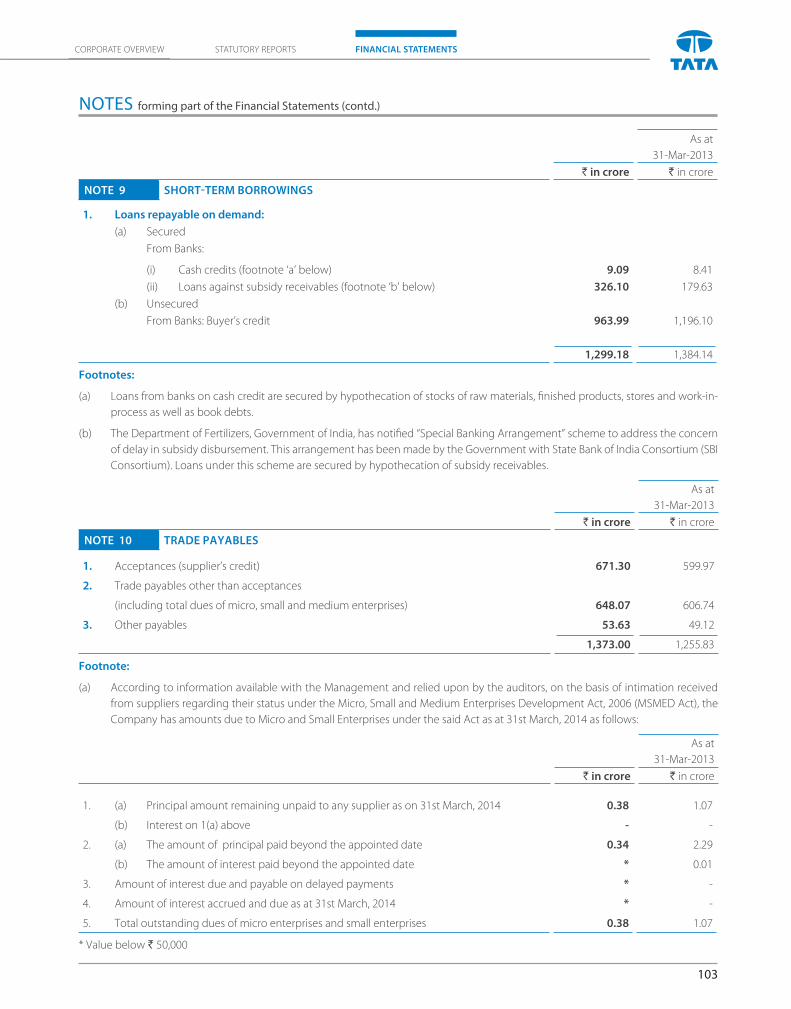
103
CORPORATE OVERVIEW FINANCIAL STATEMENTSSTATUTORY REPORTS
As at
31-Mar-2013
` in crore ` in crore
NOTE 9 SHORT-TERM BORROWINGS
1. Loans repayable on demand:
(a) Secured
From Banks:
(i) Cash credits (footnote ‘a’ below) 9.09 8.41
(ii) Loans against subsidy receivables (footnote ‘b’ below) 326.10 179.63
(b) Unsecured
From Banks: Buyer’s credit 963.99 1,196.10
1,299.18 1,384.14
Footnotes:
(a) Loans from banks on cash credit are secured by hypothecation of stocks of raw materials, fi nished products, stores and work-in-
process as well as book debts.
(b) The Department of Fertilizers, Government of India, has notifi ed “Special Banking Arrangement” scheme to address the concern
of delay in subsidy disbursement. This arrangement has been made by the Government with State Bank of India Consortium (SBI
Consortium). Loans under this scheme are secured by hypothecation of subsidy receivables.
As at
31-Mar-2013
` in crore ` in crore
NOTE 10 TRADE PAYABLES
1. Acceptances (supplier’s credit) 671.30 599.97
2. Trade payables other than acceptances
(including total dues of micro, small and medium enterprises) 648.07 606.74
3. Other payables 53.63 49.12
1,373.00 1,255.83
Footnote:
(a) According to information available with the Management and relied upon by the auditors, on the basis of intimation received
from suppliers regarding their status under the Micro, Small and Medium Enterprises Development Act, 2006 (MSMED Act), the
Company has amounts due to Micro and Small Enterprises under the said Act as at 31st March, 2014 as follows:
As at
31-Mar-2013
` in crore ` in crore
1. (a) Principal amount remaining unpaid to any supplier as on 31st March, 2014 0.38 1.07
(b) Interest on 1(a) above - -
2. (a) The amount of principal paid beyond the appointed date 0.34 2.29
(b) The amount of interest paid beyond the appointed date * 0.01
3. Amount of interest due and payable on delayed payments * -
4. Amount of interest accrued and due as at 31st March, 2014 * -
5. Total outstanding dues of micro enterprises and small enterprises 0.38 1.07
* Value below ` 50,000
NOTES forming part of the Financial Statements (contd.)
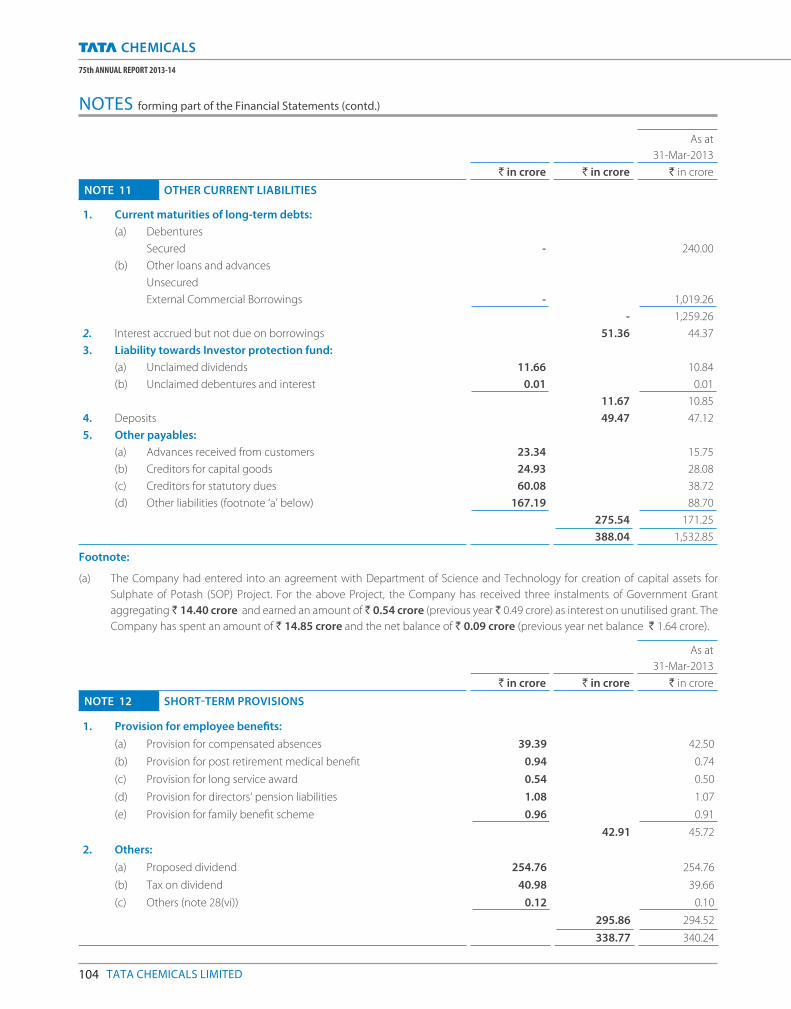
104 TATA CHEMICALS LIMITED
75th ANNUAL REPORT 2013-14
As at
31-Mar-2013
` in crore ` in crore ` in crore
NOTE 11 OTHER CURRENT LIABILITIES
1. Current maturities of long-term debts:
(a) Debentures
Secured - 240.00
(b) Other loans and advances
Unsecured
External Commercial Borrowings - 1,019.26
- 1,259.26
2. Interest accrued but not due on borrowings 51.36 44.37
3. Liability towards Investor protection fund:
(a) Unclaimed dividends 11.66 10.84
(b) Unclaimed debentures and interest 0.01 0.01
11.67 10.85
4. Deposits 49.47 47.12
5. Other payables:
(a) Advances received from customers 23.34 15.75
(b) Creditors for capital goods 24.93 28.08
(c) Creditors for statutory dues 60.08 38.72
(d) Other liabilities (footnote ‘a’ below) 167.19 88.70
275.54 171.25
388.04 1,532.85
Footnote:
(a) The Company had entered into an agreement with Department of Science and Technology for creation of capital assets for
Sulphate of Potash (SOP) Project. For the above Project, the Company has received three instalments of Government Grant
aggregating ` 14.40 crore and earned an amount of ` 0.54 crore (previous year ` 0.49 crore) as interest on unutilised grant. The
Company has spent an amount of ` 14.85 crore and the net balance of ` 0.09 crore (previous year net balance ` 1.64 crore).
As at
31-Mar-2013
` in crore ` in crore ` in crore
NOTE 12 SHORT-TERM PROVISIONS
1. Provision for employee benefi ts:
(a) Provision for compensated absences 39.39 42.50
(b) Provision for post retirement medical benefi t 0.94 0.74
(c) Provision for long service award 0.54 0.50
(d) Provision for directors‘ pension liabilities 1.08 1.07
(e) Provision for family benefi t scheme 0.96 0.91
42.91 45.72
2. Others:
(a) Proposed dividend 254.76 254.76
(b) Tax on dividend 40.98 39.66
(c) Others (note 28(vi)) 0.12 0.10
295.86 294.52
338.77 340.24
NOTES forming part of the Financial Statements (contd.)
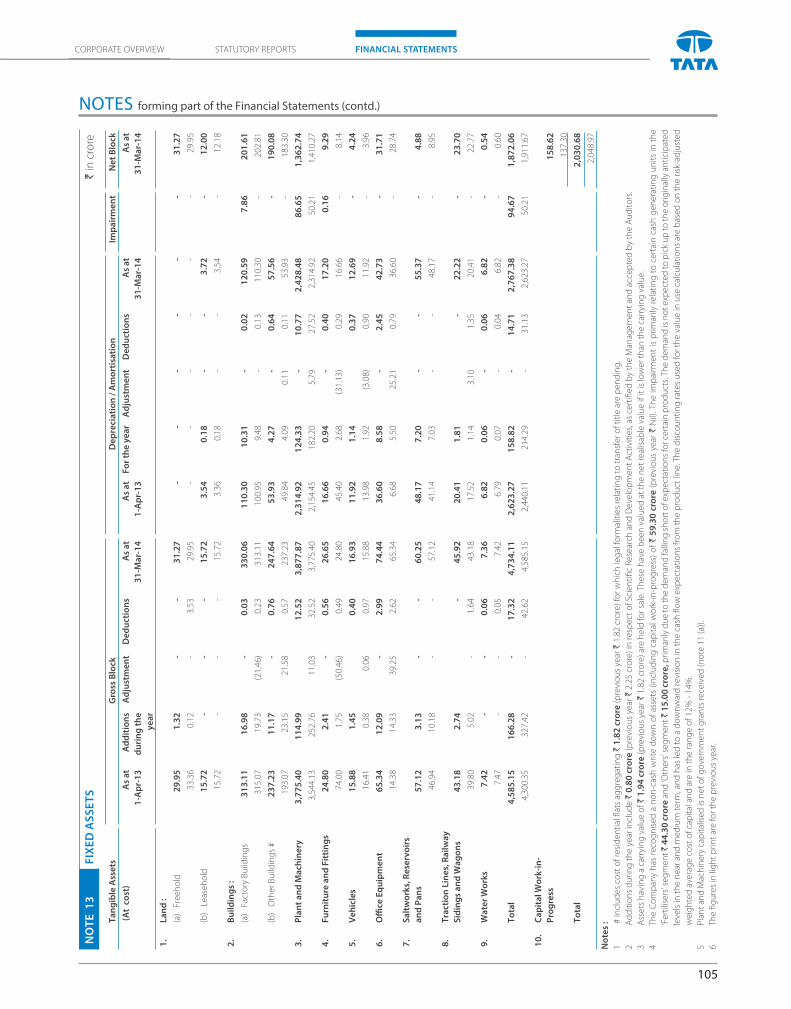
105
CORPORATE OVERVIEW FINANCIAL STATEMENTSSTATUTORY REPORTS
NO
TE
13
FIX
ED
AS
SE
TS
`
in c
rore
Ta
ng
ible
Ass
ets
Gro
ss B
lock
D
ep
reci
ati
on
/ A
mo
rtis
ati
on
Im
pa
irm
en
tN
et
Blo
ck
(A
t c
ost
)A
s a
t
1-A
pr-
13
Ad
dit
ion
s
du
rin
g t
he
ye
ar
Ad
just
me
nt
De
du
ctio
ns
As
at
31
-Ma
r-1
4
As
at
1-A
pr-
13
Fo
r th
e y
ea
rA
dju
stm
en
tD
ed
uct
ion
s A
s a
t
31
-Ma
r-1
4
As
at
31
-Ma
r-1
4
1.
La
nd
:
(a)
Fre
eh
old
29
.95
1
.32
-
-
3
1.2
7
-
-
-
-
-
-
31
.27
33
.36
0
.12
-
3
.53
2
9.9
5
-
-
-
-
-
-
29
.95
(b)
Le
ase
ho
ld 1
5.7
2
-
-
-
15
.72
3
.54
0
.18
-
-
3
.72
-
1
2.0
0
15
.72
-
-
-
1
5.7
2
3.3
6
0.1
8
-
-
3.5
4
-
12
.18
2.
Bu
ild
ing
s :
(a)
Fac
tory
Bu
ildin
gs
31
3.1
1
16
.98
-
0
.03
3
30
.06
1
10
.30
1
0.3
1
-
0.0
2
12
0.5
9
7.8
6
20
1.6
1
31
5.0
7
19
.73
(
21
.46
) 0
.23
3
13
.11
1
00
.95
9
.48
-
0
.13
1
10
.30
-
2
02
.81
(b)
Oth
er
Bu
ildin
gs
# 2
37
.23
1
1.1
7
-
0.7
6
24
7.6
4
53
.93
4
.27
-
0
.64
5
7.5
6
-
19
0.0
8
19
3.0
7
23
.15
2
1.5
8
0.5
7
23
7.2
3
49
.84
4
.09
0
.11
0
.11
5
3.9
3
-
18
3.3
0
3.
Pla
nt
an
d M
ach
ine
ry 3
,77
5.4
0
11
4.9
9
12
.52
3
,87
7.8
7
2,3
14
.92
1
24
.33
-
1
0.7
7
2,4
28
.48
8
6.6
5
1,3
62
.74
3,5
44
.13
2
52
.76
1
1.0
3
32
.52
3
,77
5.4
0
2,1
54
.45
1
82
.20
5
.79
2
7.5
2
2,3
14
.92
5
0.2
1
1,4
10
.27
4.
Fu
rnit
ure
an
d F
itti
ng
s 2
4.8
0
2.4
1
-
0.5
6
26
.65
1
6.6
6
0.9
4
-
0.4
0
17
.20
0
.16
9
.29
74
.00
1
.75
(
50
.46
) 0
.49
2
4.8
0
45
.40
2
.68
(
31
.13
) 0
.29
1
6.6
6
-
8.1
4
5.
Ve
hic
les
15
.88
1
.45
0
.40
1
6.9
3
11
.92
1
.14
0
.37
1
2.6
9
-
4.2
4
16
.41
0
.38
0
.06
0
.97
1
5.8
8
13
.98
1
.92
(
3.0
8)
0.9
0
11
.92
-
3
.96
6.
Offi
ce
Eq
uip
me
nt
65
.34
1
2.0
9
-
2.9
9
74
.44
3
6.6
0
8.5
8
-
2.4
5
42
.73
-
3
1.7
1
14
.38
1
4.3
3
39
.25
2
.62
6
5.3
4
6.6
8
5.5
0
25
.21
0
.79
3
6.6
0
-
28
.74
7.
Sa
ltw
ork
s, R
ese
rvo
irs
an
d P
an
s 5
7.1
2
3.1
3
-
-
60
.25
4
8.1
7
7.2
0
-
-
55
.37
-
4
.88
46
.94
1
0.1
8
-
-
57
.12
4
1.1
4
7.0
3
-
-
48
.17
-
8
.95
8.
Tra
ctio
n L
ine
s, R
ail
wa
y
Sid
ing
s a
nd
Wa
go
ns
43
.18
2
.74
-
4
5.9
2
20
.41
1
.81
-
2
2.2
2
-
23
.70
39
.80
5
.02
-
1
.64
4
3.1
8
17
.52
1
.14
3
.10
1
.35
2
0.4
1
-
22
.77
9.
Wa
ter
Wo
rks
7.4
2
-
-
0.0
6
7.3
6
6.8
2
0.0
6
-
0.0
6
6.8
2
-
0.5
4
7.4
7
-
-
0.0
5
7.4
2
6.7
9
0.0
7
-
0.0
4
6.8
2
-
0.6
0
To
tal
4,5
85
.15
1
66
.28
-
1
7.3
2
4,7
34
.11
2
,62
3.2
7
15
8.8
2
-
14
.71
2
,76
7.3
8
94
.67
1
,87
2.0
6
4,3
00
.35
3
27
.42
-
4
2.6
2
4,5
85
.15
2
,44
0.1
1
21
4.2
9
-
31
.13
2
,62
3.2
7
50
.21
1
,91
1.6
7
10
.C
ap
ita
l Wo
rk-i
n-
Pro
gre
ss 1
58
.62
13
7.3
0
To
tal
2,0
30
.68
2,0
48
.97
No
tes
:
1
# In
clu
de
s co
st o
f re
sid
en
tial
fl at
s ag
gre
gat
ing
` 1
.82
cro
re (
pre
vio
us
year
` 1
.82
cro
re)
for
wh
ich
leg
al f
orm
alit
ies
rela
tin
g t
o t
ran
sfe
r o
f ti
tle
are
pe
nd
ing
.
2
Ad
dit
ion
s d
uri
ng
th
e y
ear
incl
ud
e `
0.8
0 c
rore
(p
revi
ou
s ye
ar `
2.2
5 c
rore
) in
re
spe
ct o
f Sc
ien
tifi
c R
ese
arch
an
d D
eve
lop
me
nt
Act
ivit
ies,
as
cert
ifi e
d b
y th
e M
anag
em
en
t an
d a
cce
pte
d b
y th
e A
ud
ito
rs.
3
Ass
ets
hav
ing
a c
arry
ing
val
ue
of `
1.9
4 c
rore
(p
revi
ou
s ye
ar `
1.8
2 c
rore
) ar
e h
eld
fo
r sa
le. T
he
se h
ave
be
en
val
ue
d a
t th
e n
et
real
isab
le v
alu
e if
it is
low
er
than
th
e c
arry
ing
val
ue
.
4
The
Co
mp
any
has
re
cog
nis
ed
a n
on
-cas
h w
rite
do
wn
of
asse
ts (
incl
ud
ing
cap
ital
wo
rk-i
n-p
rog
ress
) o
f `
59
.30
cro
re (
pre
vio
us
year
` N
il). T
he
imp
airm
en
t is
pri
mar
ily r
ela
tin
g t
o c
ert
ain
cas
h g
en
era
tin
g u
nit
s in
th
e
‘Fe
rtili
sers
’ se
gm
en
t ̀ 4
4.3
0 c
rore
an
d ‘O
the
rs’ s
eg
me
nt ̀
15
.00
cro
re, p
rim
arily
du
e t
o t
he
de
man
d fa
llin
g s
ho
rt o
f exp
ect
atio
ns
for
cert
ain
pro
du
cts.
Th
e d
em
and
is n
ot
exp
ect
ed
to
pic
k u
p t
o t
he
ori
gin
ally
an
tici
pat
ed
leve
ls in
th
e n
ear
an
d m
ed
ium
te
rm, a
nd
has
led
to
a d
ow
nw
ard
re
visi
on
in t
he
cas
h fl
ow
exp
ect
atio
ns
fro
m t
he
pro
du
ct li
ne
. Th
e d
isco
un
tin
g r
ate
s u
sed
fo
r th
e v
alu
e in
use
cal
cula
tio
ns
are
bas
ed
on
th
e r
isk-
adju
ste
d
we
igh
ted
ave
rag
e c
ost
of
cap
ital
an
d a
re in
th
e r
ang
e o
f 1
2%
- 1
4%
.
5
Pla
nt
and
Mac
hin
ery
cap
ital
ise
d is
ne
t o
f g
ove
rnm
en
t g
ran
ts r
ece
ive
d (
no
te 1
1 (
a)).
6
The
fi g
ure
s in
lig
ht
pri
nt
are
fo
r th
e p
revi
ou
s ye
ar.
NOTES forming part of the Financial Statements (contd.)
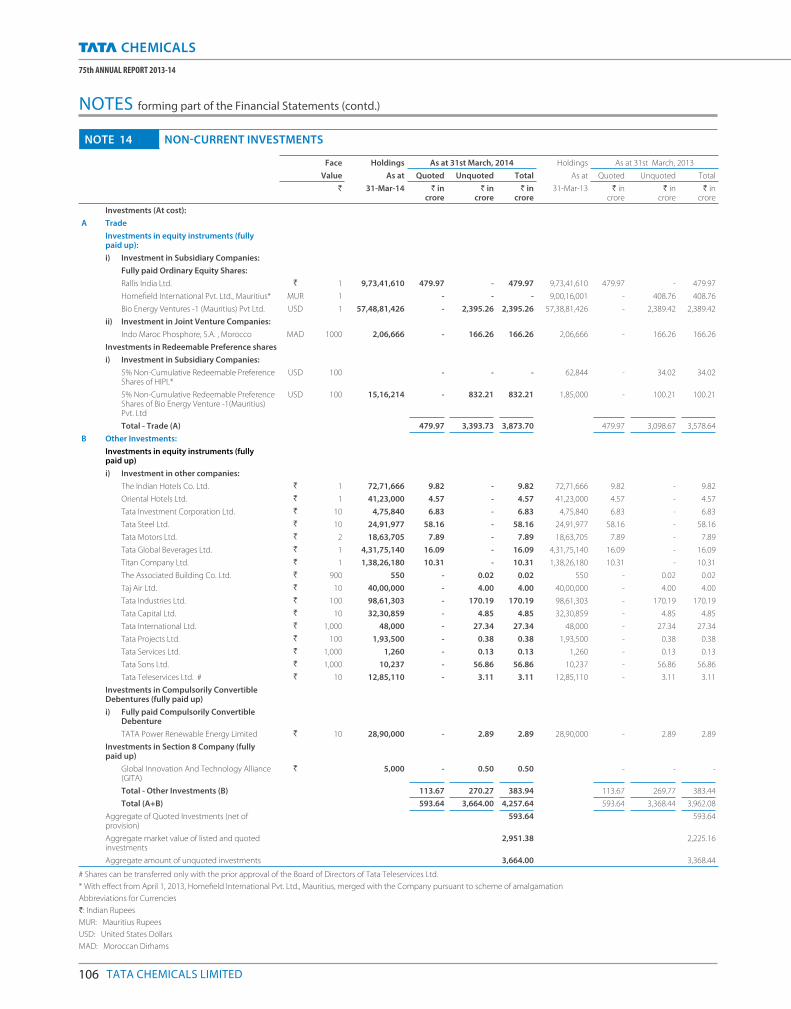
106 TATA CHEMICALS LIMITED
75th ANNUAL REPORT 2013-14
Face Holdings As at 31st March, 2014 Holdings As at 31st March, 2013
Value As at Quoted Unquoted Total As at Quoted Unquoted Total
` 31-Mar-14 ` in crore
` in crore
` in crore
31-Mar-13 ` in crore
` in crore
` in crore
Investments (At cost):
A Trade
Investments in equity instruments (fully paid up):
i) Investment in Subsidiary Companies:
Fully paid Ordinary Equity Shares:
Rallis India Ltd. ` 1 9,73,41,610 479.97 - 479.97 9,73,41,610 479.97 - 479.97
Homefi eld International Pvt. Ltd., Mauritius* MUR 1 - - - 9,00,16,001 - 408.76 408.76
Bio Energy Ventures -1 (Mauritius) Pvt Ltd. USD 1 57,48,81,426 - 2,395.26 2,395.26 57,38,81,426 - 2,389.42 2,389.42
ii) Investment in Joint Venture Companies:
Indo Maroc Phosphore, S.A. , Morocco MAD 1000 2,06,666 - 166.26 166.26 2,06,666 - 166.26 166.26
Investments in Redeemable Preference shares
i) Investment in Subsidiary Companies:
5% Non-Cumulative Redeemable Preference Shares of HIPL*
USD 100 - - - 62,844 - 34.02 34.02
5% Non-Cumulative Redeemable Preference Shares of Bio Energy Venture -1(Mauritius) Pvt. Ltd
USD 100 15,16,214 - 832.21 832.21 1,85,000 - 100.21 100.21
Total - Trade (A) 479.97 3,393.73 3,873.70 479.97 3,098.67 3,578.64
B Other Investments:
Investments in equity instruments (fully paid up)
i) Investment in other companies:
The Indian Hotels Co. Ltd. ` 1 72,71,666 9.82 - 9.82 72,71,666 9.82 - 9.82
Oriental Hotels Ltd. ` 1 41,23,000 4.57 - 4.57 41,23,000 4.57 - 4.57
Tata Investment Corporation Ltd. ` 10 4,75,840 6.83 - 6.83 4,75,840 6.83 - 6.83
Tata Steel Ltd. ` 10 24,91,977 58.16 - 58.16 24,91,977 58.16 - 58.16
Tata Motors Ltd. ` 2 18,63,705 7.89 - 7.89 18,63,705 7.89 - 7.89
Tata Global Beverages Ltd. ` 1 4,31,75,140 16.09 - 16.09 4,31,75,140 16.09 - 16.09
Titan Company Ltd. ` 1 1,38,26,180 10.31 - 10.31 1,38,26,180 10.31 - 10.31
The Associated Building Co. Ltd. ` 900 550 - 0.02 0.02 550 - 0.02 0.02
Taj Air Ltd. ` 10 40,00,000 - 4.00 4.00 40,00,000 - 4.00 4.00
Tata Industries Ltd. ` 100 98,61,303 - 170.19 170.19 98,61,303 - 170.19 170.19
Tata Capital Ltd. ` 10 32,30,859 - 4.85 4.85 32,30,859 - 4.85 4.85
Tata International Ltd. ` 1,000 48,000 - 27.34 27.34 48,000 - 27.34 27.34
Tata Projects Ltd. ` 100 1,93,500 - 0.38 0.38 1,93,500 - 0.38 0.38
Tata Services Ltd. ` 1,000 1,260 - 0.13 0.13 1,260 - 0.13 0.13
Tata Sons Ltd. ` 1,000 10,237 - 56.86 56.86 10,237 - 56.86 56.86
Tata Teleservices Ltd. # ` 10 12,85,110 - 3.11 3.11 12,85,110 - 3.11 3.11
Investments in Compulsorily Convertible Debentures (fully paid up)
i) Fully paid Compulsorily Convertible Debenture
TATA Power Renewable Energy Limited ` 10 28,90,000 - 2.89 2.89 28,90,000 - 2.89 2.89
Investments in Section 8 Company (fully paid up)
Global Innovation And Technology Alliance (GITA)
` 5,000 - 0.50 0.50 - - -
Total - Other Investments (B) 113.67 270.27 383.94 113.67 269.77 383.44
Total (A+B) 593.64 3,664.00 4,257.64 593.64 3,368.44 3,962.08
Aggregate of Quoted Investments (net of provision)
593.64 593.64
Aggregate market value of listed and quoted investments
2,951.38 2,225.16
Aggregate amount of unquoted investments 3,664.00 3,368.44
# Shares can be transferred only with the prior approval of the Board of Directors of Tata Teleservices Ltd.
* With eff ect from April 1, 2013, Homefi eld International Pvt. Ltd., Mauritius, merged with the Company pursuant to scheme of amalgamation
Abbreviations for Currencies
`: Indian Rupees
MUR: Mauritius Rupees
USD: United States Dollars
MAD: Moroccan Dirhams
NOTE 14 NON-CURRENT INVESTMENTS
NOTES forming part of the Financial Statements (contd.)
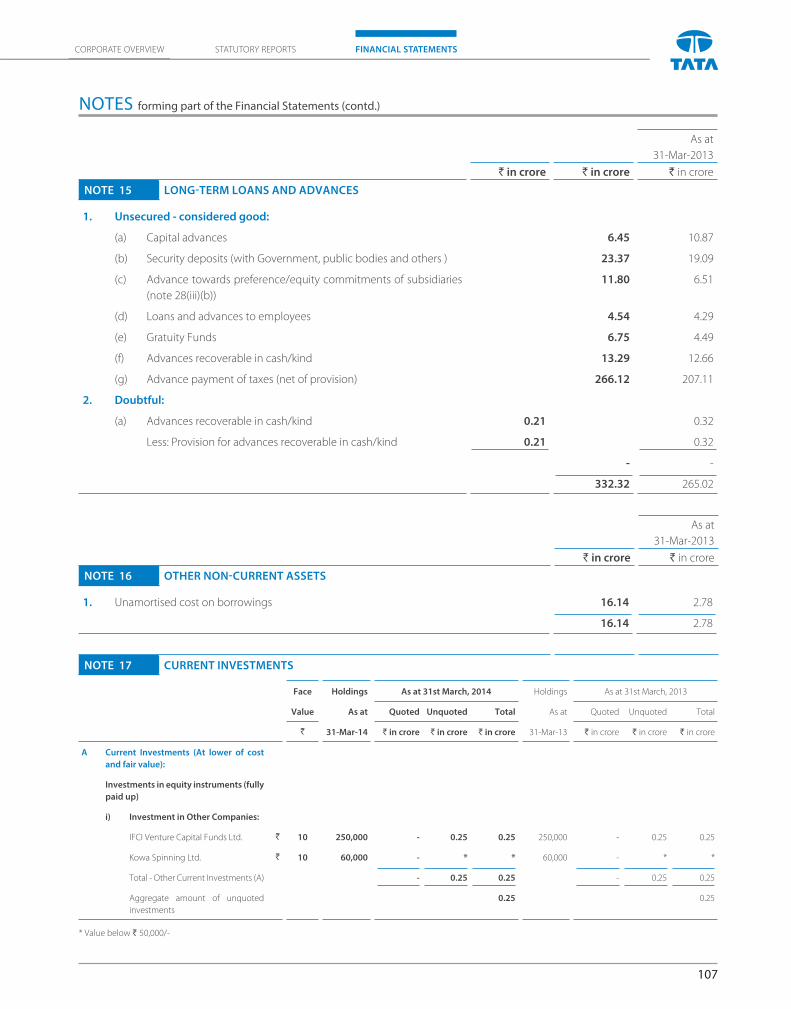
107
CORPORATE OVERVIEW FINANCIAL STATEMENTSSTATUTORY REPORTS
As at
31-Mar-2013
` in crore ` in crore ` in crore
NOTE 15 LONG-TERM LOANS AND ADVANCES
1. Unsecured - considered good:
(a) Capital advances 6.45 10.87
(b) Security deposits (with Government, public bodies and others ) 23.37 19.09
(c) Advance towards preference/equity commitments of subsidiaries
(note 28(iii)(b))
11.80 6.51
(d) Loans and advances to employees 4.54 4.29
(e) Gratuity Funds 6.75 4.49
(f) Advances recoverable in cash/kind 13.29 12.66
(g) Advance payment of taxes (net of provision) 266.12 207.11
2. Doubtful:
(a) Advances recoverable in cash/kind 0.21 0.32
Less: Provision for advances recoverable in cash/kind 0.21 0.32
- -
332.32 265.02
As at
31-Mar-2013
` in crore ` in crore
NOTE 16 OTHER NON-CURRENT ASSETS
1. Unamortised cost on borrowings 16.14 2.78
16.14 2.78
NOTE 17 CURRENT INVESTMENTS
Face Holdings As at 31st March, 2014 Holdings As at 31st March, 2013
Value As at Quoted Unquoted Total As at Quoted Unquoted Total
` 31-Mar-14 ` in crore ` in crore ` in crore 31-Mar-13 ` in crore ` in crore ` in crore
A Current Investments (At lower of cost
and fair value):
Investments in equity instruments (fully
paid up)
i) Investment in Other Companies:
IFCI Venture Capital Funds Ltd. ` 10 250,000 - 0.25 0.25 250,000 - 0.25 0.25
Kowa Spinning Ltd. ` 10 60,000 - * * 60,000 - * *
Total - Other Current Investments (A) - 0.25 0.25 - 0.25 0.25
Aggregate amount of unquoted
investments
0.25 0.25
* Value below ` 50,000/-
NOTES forming part of the Financial Statements (contd.)
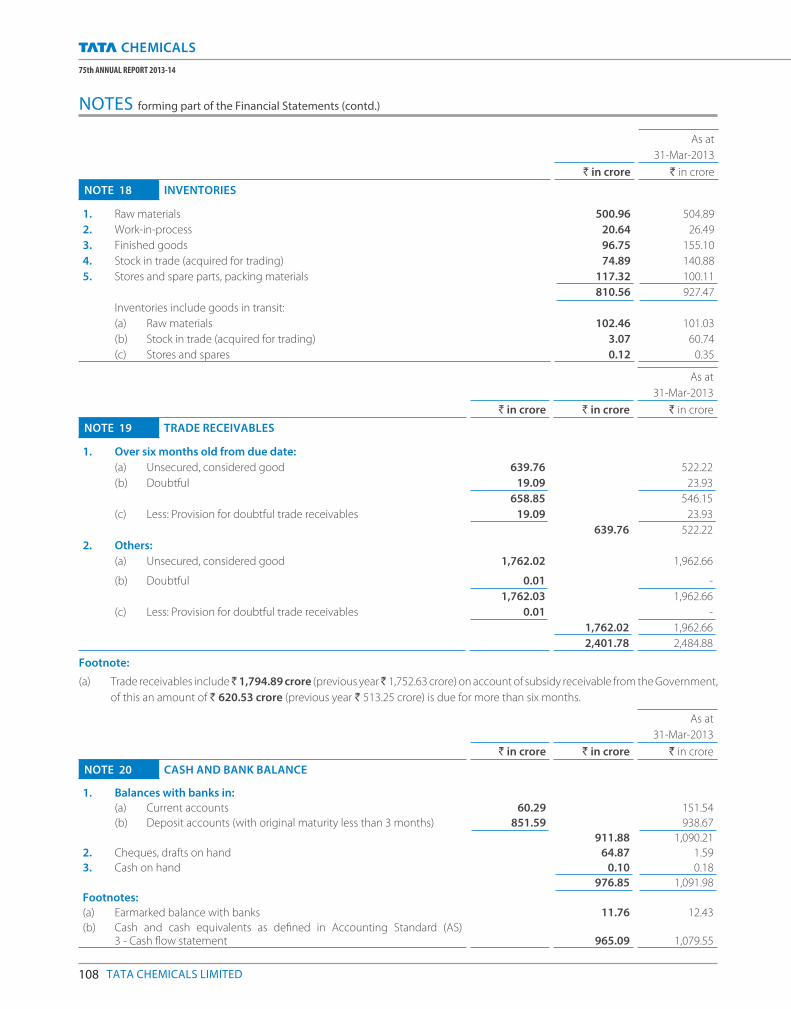
108 TATA CHEMICALS LIMITED
75th ANNUAL REPORT 2013-14
As at
31-Mar-2013
` in crore ` in crore
NOTE 18 INVENTORIES
1. Raw materials 500.96 504.89
2. Work-in-process 20.64 26.49
3. Finished goods 96.75 155.10
4. Stock in trade (acquired for trading) 74.89 140.88
5. Stores and spare parts, packing materials 117.32 100.11
810.56 927.47
Inventories include goods in transit:
(a) Raw materials 102.46 101.03
(b) Stock in trade (acquired for trading) 3.07 60.74
(c) Stores and spares 0.12 0.35
As at
31-Mar-2013
` in crore ` in crore ` in crore
NOTE 19 TRADE RECEIVABLES
1. Over six months old from due date:
(a) Unsecured, considered good 639.76 522.22
(b) Doubtful 19.09 23.93
658.85 546.15
(c) Less: Provision for doubtful trade receivables 19.09 23.93
639.76 522.22
2. Others:
(a) Unsecured, considered good 1,762.02 1,962.66
(b) Doubtful 0.01 -
1,762.03 1,962.66
(c) Less: Provision for doubtful trade receivables 0.01 -
1,762.02 1,962.66
2,401.78 2,484.88
Footnote:
(a) Trade receivables include ̀ 1,794.89 crore (previous year ̀ 1,752.63 crore) on account of subsidy receivable from the Government,
of this an amount of ` 620.53 crore (previous year ` 513.25 crore) is due for more than six months.
As at
31-Mar-2013
` in crore ` in crore ` in crore
NOTE 20 CASH AND BANK BALANCE
1. Balances with banks in:
(a) Current accounts 60.29 151.54
(b) Deposit accounts (with original maturity less than 3 months) 851.59 938.67
911.88 1,090.21
2. Cheques, drafts on hand 64.87 1.59
3. Cash on hand 0.10 0.18
976.85 1,091.98
Footnotes:
(a) Earmarked balance with banks 11.76 12.43
(b) Cash and cash equivalents as defi ned in Accounting Standard (AS) 3 - Cash fl ow statement 965.09 1,079.55
NOTES forming part of the Financial Statements (contd.)
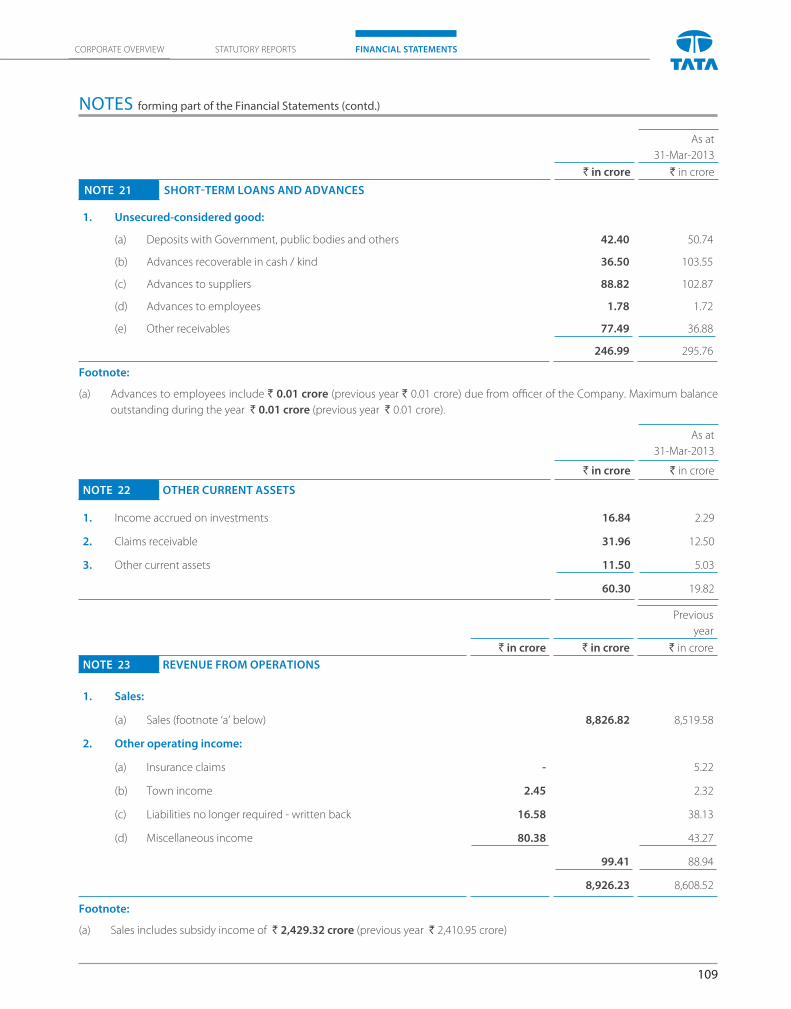
109
CORPORATE OVERVIEW FINANCIAL STATEMENTSSTATUTORY REPORTS
As at
31-Mar-2013
` in crore ` in crore
NOTE 21 SHORT-TERM LOANS AND ADVANCES
1. Unsecured-considered good:
(a) Deposits with Government, public bodies and others 42.40 50.74
(b) Advances recoverable in cash / kind 36.50 103.55
(c) Advances to suppliers 88.82 102.87
(d) Advances to employees 1.78 1.72
(e) Other receivables 77.49 36.88
246.99 295.76
Footnote:
(a) Advances to employees include ` 0.01 crore (previous year ` 0.01 crore) due from offi cer of the Company. Maximum balance
outstanding during the year ` 0.01 crore (previous year ` 0.01 crore).
As at
31-Mar-2013
` in crore ` in crore
NOTE 22 OTHER CURRENT ASSETS
1. Income accrued on investments 16.84 2.29
2. Claims receivable 31.96 12.50
3. Other current assets 11.50 5.03
60.30 19.82
Previous
year
` in crore ` in crore ` in crore
NOTE 23 REVENUE FROM OPERATIONS
1. Sales:
(a) Sales (footnote ‘a’ below) 8,826.82 8,519.58
2. Other operating income:
(a) Insurance claims - 5.22
(b) Town income 2.45 2.32
(c) Liabilities no longer required - written back 16.58 38.13
(d) Miscellaneous income 80.38 43.27
99.41 88.94
8,926.23 8,608.52
Footnote:
(a) Sales includes subsidy income of ` 2,429.32 crore (previous year ` 2,410.95 crore)
NOTES forming part of the Financial Statements (contd.)
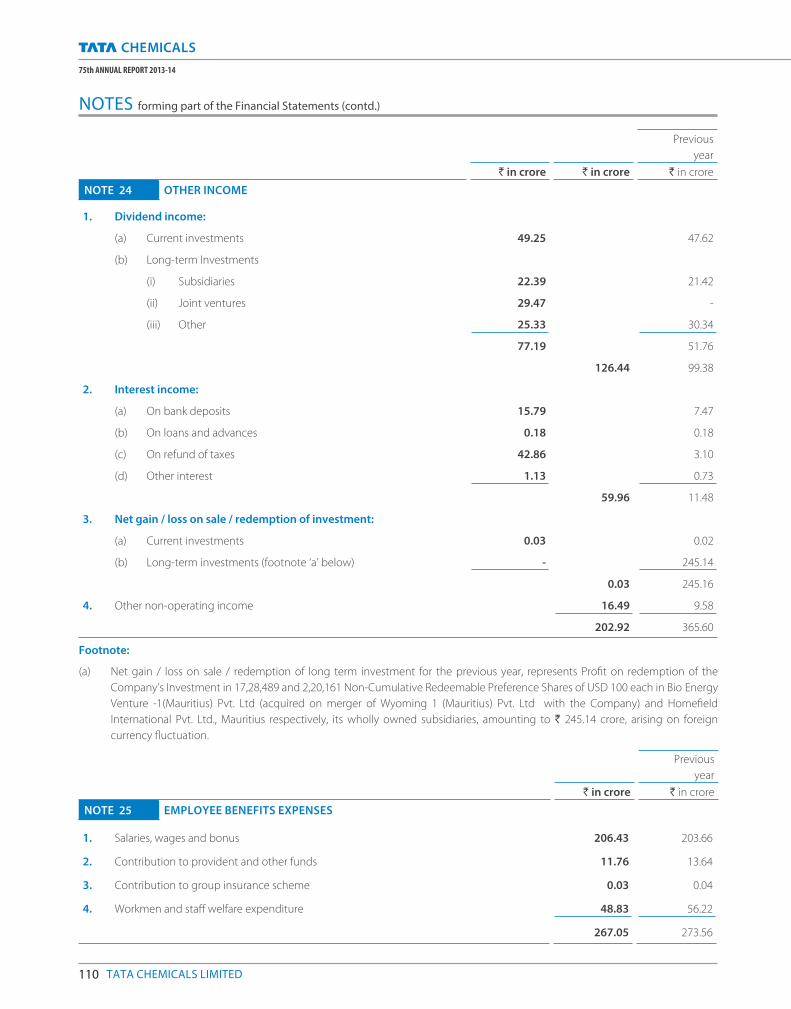
110 TATA CHEMICALS LIMITED
75th ANNUAL REPORT 2013-14
Previous
year
` in crore ` in crore ` in crore
NOTE 24 OTHER INCOME
1. Dividend income:
(a) Current investments 49.25 47.62
(b) Long-term Investments
(i) Subsidiaries 22.39 21.42
(ii) Joint ventures 29.47 -
(iii) Other 25.33 30.34
77.19 51.76
126.44 99.38
2. Interest income:
(a) On bank deposits 15.79 7.47
(b) On loans and advances 0.18 0.18
(c) On refund of taxes 42.86 3.10
(d) Other interest 1.13 0.73
59.96 11.48
3. Net gain / loss on sale / redemption of investment:
(a) Current investments 0.03 0.02
(b) Long-term investments (footnote ‘a’ below) - 245.14
0.03 245.16
4. Other non-operating income 16.49 9.58
202.92 365.60
Footnote:
(a) Net gain / loss on sale / redemption of long term investment for the previous year, represents Profi t on redemption of the
Company’s Investment in 17,28,489 and 2,20,161 Non-Cumulative Redeemable Preference Shares of USD 100 each in Bio Energy
Venture -1(Mauritius) Pvt. Ltd (acquired on merger of Wyoming 1 (Mauritius) Pvt. Ltd with the Company) and Homefi eld
International Pvt. Ltd., Mauritius respectively, its wholly owned subsidiaries, amounting to ` 245.14 crore, arising on foreign
currency fl uctuation.
Previous
year
` in crore ` in crore
NOTE 25 EMPLOYEE BENEFITS EXPENSES
1. Salaries, wages and bonus 206.43 203.66
2. Contribution to provident and other funds 11.76 13.64
3. Contribution to group insurance scheme 0.03 0.04
4. Workmen and staff welfare expenditure 48.83 56.22
267.05 273.56
NOTES forming part of the Financial Statements (contd.)
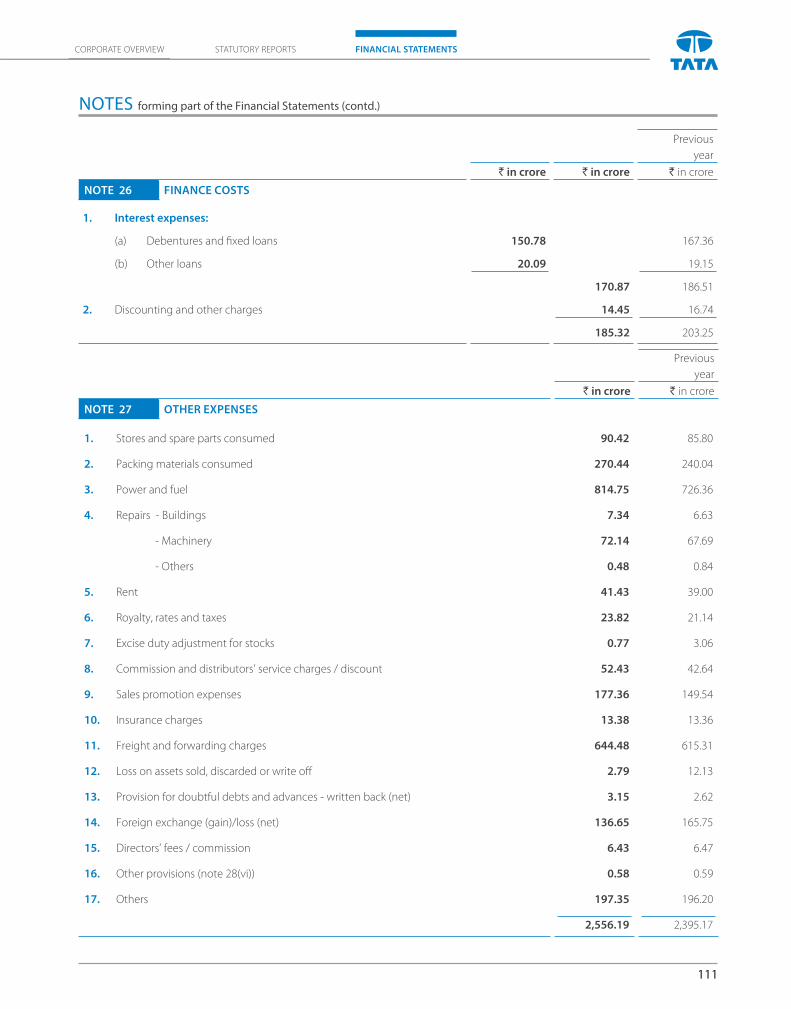
111
CORPORATE OVERVIEW FINANCIAL STATEMENTSSTATUTORY REPORTS
Previous
year
` in crore ` in crore ` in crore
NOTE 26 FINANCE COSTS
1. Interest expenses:
(a) Debentures and fi xed loans 150.78 167.36
(b) Other loans 20.09 19.15
170.87 186.51
2. Discounting and other charges 14.45 16.74
185.32 203.25
Previous
year
` in crore ` in crore
NOTE 27 OTHER EXPENSES
1. Stores and spare parts consumed 90.42 85.80
2. Packing materials consumed 270.44 240.04
3. Power and fuel 814.75 726.36
4. Repairs - Buildings 7.34 6.63
- Machinery 72.14 67.69
- Others 0.48 0.84
5. Rent 41.43 39.00
6. Royalty, rates and taxes 23.82 21.14
7. Excise duty adjustment for stocks 0.77 3.06
8. Commission and distributors’ service charges / discount 52.43 42.64
9. Sales promotion expenses 177.36 149.54
10. Insurance charges 13.38 13.36
11. Freight and forwarding charges 644.48 615.31
12. Loss on assets sold, discarded or write off 2.79 12.13
13. Provision for doubtful debts and advances - written back (net) 3.15 2.62
14. Foreign exchange (gain)/loss (net) 136.65 165.75
15. Directors’ fees / commission 6.43 6.47
16. Other provisions (note 28(vi)) 0.58 0.59
17. Others 197.35 196.20
2,556.19 2,395.17
NOTES forming part of the Financial Statements (contd.)
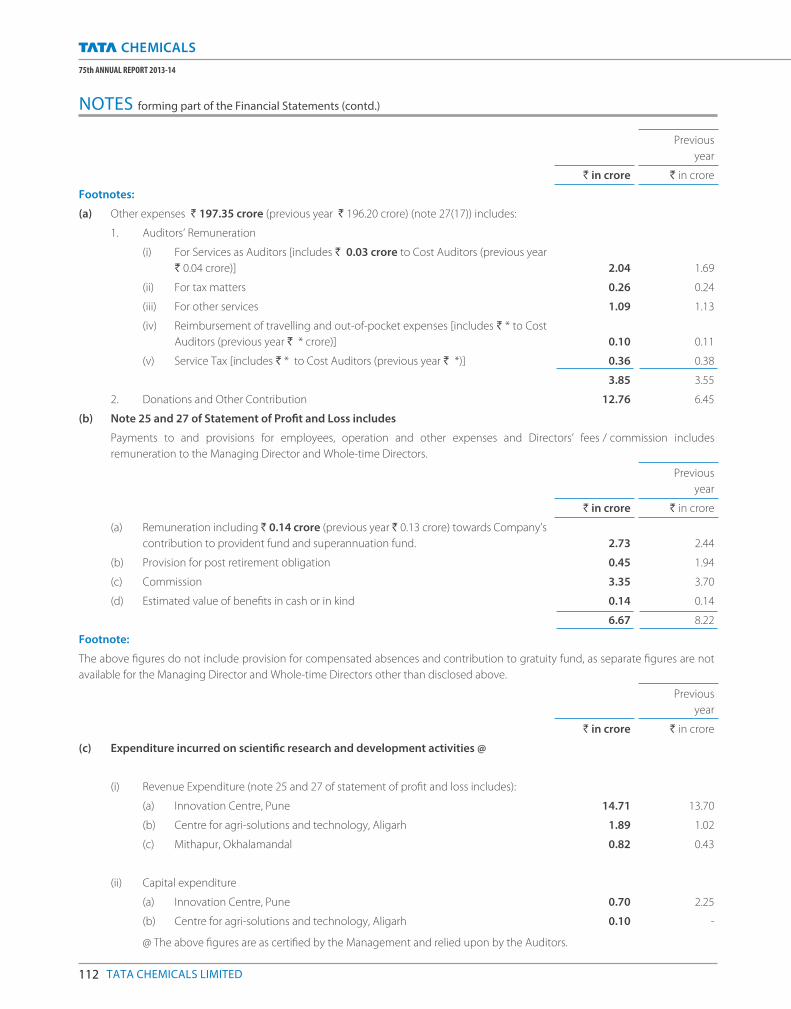
112 TATA CHEMICALS LIMITED
75th ANNUAL REPORT 2013-14
Previous
year
` in crore ` in crore
Footnotes:
(a) Other expenses ` 197.35 crore (previous year ` 196.20 crore) (note 27(17)) includes:
1. Auditors’ Remuneration
(i) For Services as Auditors [includes ` 0.03 crore to Cost Auditors (previous year
` 0.04 crore)] 2.04 1.69
(ii) For tax matters 0.26 0.24
(iii) For other services 1.09 1.13
(iv) Reimbursement of travelling and out-of-pocket expenses [includes ` * to Cost
Auditors (previous year ` * crore)] 0.10 0.11
(v) Service Tax [includes ` * to Cost Auditors (previous year ` *)] 0.36 0.38
3.85 3.55
2. Donations and Other Contribution 12.76 6.45
(b) Note 25 and 27 of Statement of Profi t and Loss includes
Payments to and provisions for employees, operation and other expenses and Directors’ fees / commission includes
remuneration to the Managing Director and Whole-time Directors.
Previous
year
` in crore ` in crore
(a) Remuneration including ` 0.14 crore (previous year ` 0.13 crore) towards Company’s
contribution to provident fund and superannuation fund. 2.73 2.44
(b) Provision for post retirement obligation 0.45 1.94
(c) Commission 3.35 3.70
(d) Estimated value of benefi ts in cash or in kind 0.14 0.14
6.67 8.22
Footnote:
The above fi gures do not include provision for compensated absences and contribution to gratuity fund, as separate fi gures are not
available for the Managing Director and Whole-time Directors other than disclosed above.
Previous
year
` in crore ` in crore
(c) Expenditure incurred on scientifi c research and development activities @
(i) Revenue Expenditure (note 25 and 27 of statement of profi t and loss includes):
(a) Innovation Centre, Pune 14.71 13.70
(b) Centre for agri-solutions and technology, Aligarh 1.89 1.02
(c) Mithapur, Okhalamandal 0.82 0.43
(ii) Capital expenditure
(a) Innovation Centre, Pune 0.70 2.25
(b) Centre for agri-solutions and technology, Aligarh 0.10 -
@ The above fi gures are as certifi ed by the Management and relied upon by the Auditors.
NOTES forming part of the Financial Statements (contd.)
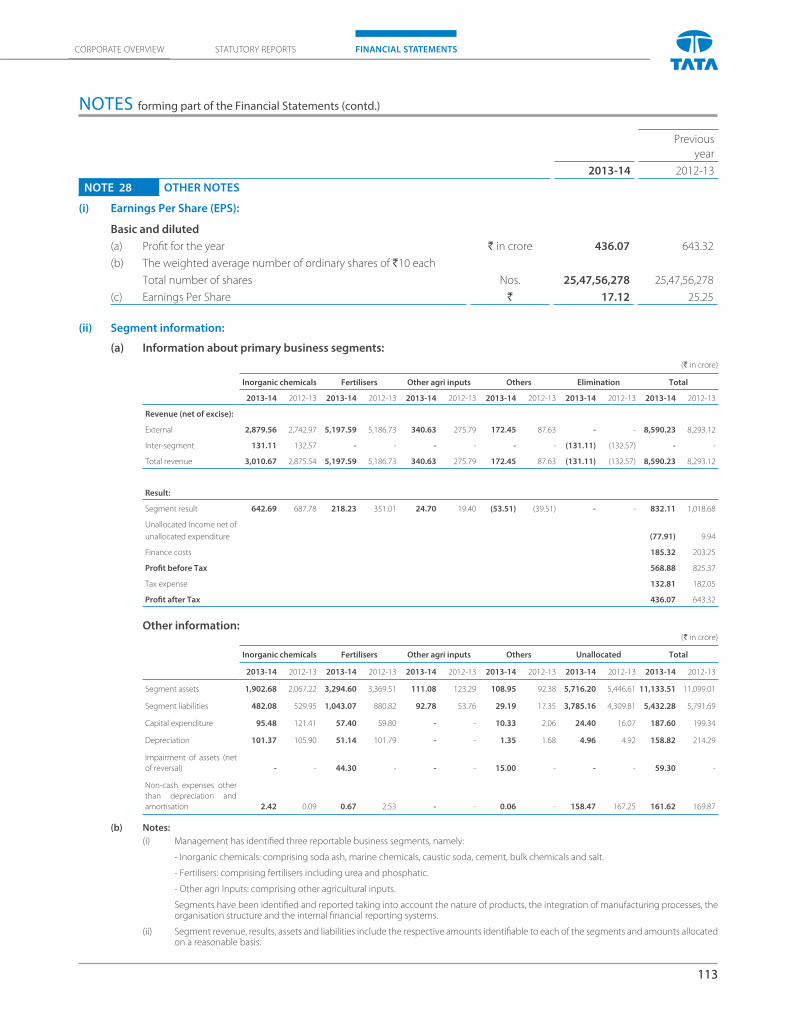
113
CORPORATE OVERVIEW FINANCIAL STATEMENTSSTATUTORY REPORTS
Previous
year
2013-14 2012-13
NOTE 28 OTHER NOTES
(i) Earnings Per Share (EPS):
Basic and diluted
(a) Profi t for the year ` in crore 436.07 643.32
(b) The weighted average number of ordinary shares of `10 each
Total number of shares Nos. 25,47,56,278 25,47,56,278
(c) Earnings Per Share ` 17.12 25.25
(ii) Segment information:
(a) Information about primary business segments:
(` in crore)
Inorganic chemicals Fertilisers Other agri inputs Others Elimination Total
2013-14 2012-13 2013-14 2012-13 2013-14 2012-13 2013-14 2012-13 2013-14 2012-13 2013-14 2012-13
Revenue (net of excise):
External 2,879.56 2,742.97 5,197.59 5,186.73 340.63 275.79 172.45 87.63 - - 8,590.23 8,293.12
Inter-segment 131.11 132.57 - - - - - - (131.11) (132.57) - -
Total revenue 3,010.67 2,875.54 5,197.59 5,186.73 340.63 275.79 172.45 87.63 (131.11) (132.57) 8,590.23 8,293.12
Result:
Segment result 642.69 687.78 218.23 351.01 24.70 19.40 (53.51) (39.51) - - 832.11 1,018.68
Unallocated Income net of
unallocated expenditure (77.91) 9.94
Finance costs 185.32 203.25
Profi t before Tax 568.88 825.37
Tax expense 132.81 182.05
Profi t after Tax 436.07 643.32
Other information: (` in crore)
Inorganic chemicals Fertilisers Other agri inputs Others Unallocated Total
2013-14 2012-13 2013-14 2012-13 2013-14 2012-13 2013-14 2012-13 2013-14 2012-13 2013-14 2012-13
Segment assets 1,902.68 2,067.22 3,294.60 3,369.51 111.08 123.29 108.95 92.38 5,716.20 5,446.61 11,133.51 11,099.01
Segment liabilities 482.08 529.95 1,043.07 880.82 92.78 53.76 29.19 17.35 3,785.16 4,309.81 5,432.28 5,791.69
Capital expenditure 95.48 121.41 57.40 59.80 - - 10.33 2.06 24.40 16.07 187.60 199.34
Depreciation 101.37 105.90 51.14 101.79 - - 1.35 1.68 4.96 4.92 158.82 214.29
Impairment of assets (net
of reversal) - - 44.30 - - - 15.00 - - - 59.30 -
Non-cash expenses other
than depreciation and
amortisation 2.42 0.09 0.67 2.53 - - 0.06 - 158.47 167.25 161.62 169.87
(b) Notes:
(i) Management has identifi ed three reportable business segments, namely:
- Inorganic chemicals: comprising soda ash, marine chemicals, caustic soda, cement, bulk chemicals and salt.
- Fertilisers: comprising fertilisers including urea and phosphatic.
- Other agri Inputs: comprising other agricultural inputs.
Segments have been identifi ed and reported taking into account the nature of products, the integration of manufacturing processes, the organisation structure and the internal fi nancial reporting systems.
(ii) Segment revenue, results, assets and liabilities include the respective amounts identifi able to each of the segments and amounts allocated on a reasonable basis.
NOTES forming part of the Financial Statements (contd.)
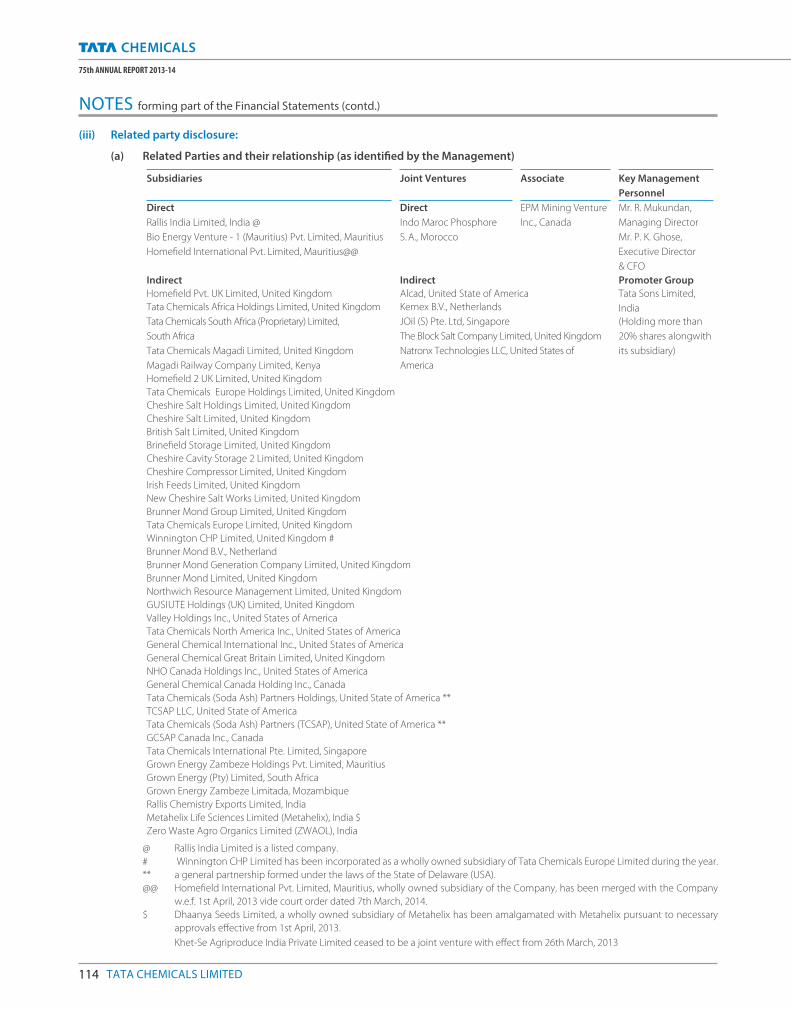
114 TATA CHEMICALS LIMITED
75th ANNUAL REPORT 2013-14
(iii) Related party disclosure:
(a) Related Parties and their relationship (as identifi ed by the Management)
Subsidiaries
Joint Ventures
Associate
Key Management
Personnel
Direct Direct EPM Mining Venture
Inc., Canada
Mr. R. Mukundan,
Managing Director
Mr. P. K. Ghose,
Executive Director
& CFO
Rallis India Limited, India @ Indo Maroc Phosphore
S. A., MoroccoBio Energy Venture - 1 (Mauritius) Pvt. Limited, Mauritius
Homefi eld International Pvt. Limited, Mauritius@@
Indirect Indirect Promoter Group
Homefi eld Pvt. UK Limited, United Kingdom Alcad, United State of America Tata Sons Limited,
IndiaTata Chemicals Africa Holdings Limited, United Kingdom Kemex B.V., Netherlands
Tata Chemicals South Africa (Proprietary) Limited,
South Africa
Tata Chemicals Magadi Limited, United Kingdom
Magadi Railway Company Limited, Kenya
JOil (S) Pte. Ltd, Singapore
The Block Salt Company Limited, United Kingdom
Natronx Technologies LLC, United States of
America
(Holding more than
20% shares alongwith
its subsidiary)
Homefi eld 2 UK Limited, United Kingdom
Tata Chemicals Europe Holdings Limited, United Kingdom
Cheshire Salt Holdings Limited, United Kingdom
Cheshire Salt Limited, United Kingdom
British Salt Limited, United Kingdom
Brinefi eld Storage Limited, United Kingdom
Cheshire Cavity Storage 2 Limited, United Kingdom
Cheshire Compressor Limited, United Kingdom
Irish Feeds Limited, United Kingdom
New Cheshire Salt Works Limited, United Kingdom
Brunner Mond Group Limited, United Kingdom
Tata Chemicals Europe Limited, United Kingdom
Winnington CHP Limited, United Kingdom #
Brunner Mond B.V., Netherland
Brunner Mond Generation Company Limited, United Kingdom
Brunner Mond Limited, United Kingdom
Northwich Resource Management Limited, United Kingdom
GUSIUTE Holdings (UK) Limited, United Kingdom
Valley Holdings Inc., United States of America
Tata Chemicals North America Inc., United States of America
General Chemical International Inc., United States of America
General Chemical Great Britain Limited, United Kingdom
NHO Canada Holdings Inc., United States of America
General Chemical Canada Holding Inc., Canada
Tata Chemicals (Soda Ash) Partners Holdings, United State of America **
TCSAP LLC, United State of America
Tata Chemicals (Soda Ash) Partners (TCSAP), United State of America **
GCSAP Canada Inc., Canada
Tata Chemicals International Pte. Limited, Singapore
Grown Energy Zambeze Holdings Pvt. Limited, Mauritius
Grown Energy (Pty) Limited, South Africa
Grown Energy Zambeze Limitada, Mozambique
Rallis Chemistry Exports Limited, India
Metahelix Life Sciences Limited (Metahelix), India $
Zero Waste Agro Organics Limited (ZWAOL), India
@ Rallis India Limited is a listed company.
# Winnington CHP Limited has been incorporated as a wholly owned subsidiary of Tata Chemicals Europe Limited during the year.
** a general partnership formed under the laws of the State of Delaware (USA).
@@ Homefi eld International Pvt. Limited, Mauritius, wholly owned subsidiary of the Company, has been merged with the Company
w.e.f. 1st April, 2013 vide court order dated 7th March, 2014.
$ Dhaanya Seeds Limited, a wholly owned subsidiary of Metahelix has been amalgamated with Metahelix pursuant to necessary
approvals eff ective from 1st April, 2013.
Khet-Se Agriproduce India Private Limited ceased to be a joint venture with eff ect from 26th March, 2013
NOTES forming part of the Financial Statements (contd.)
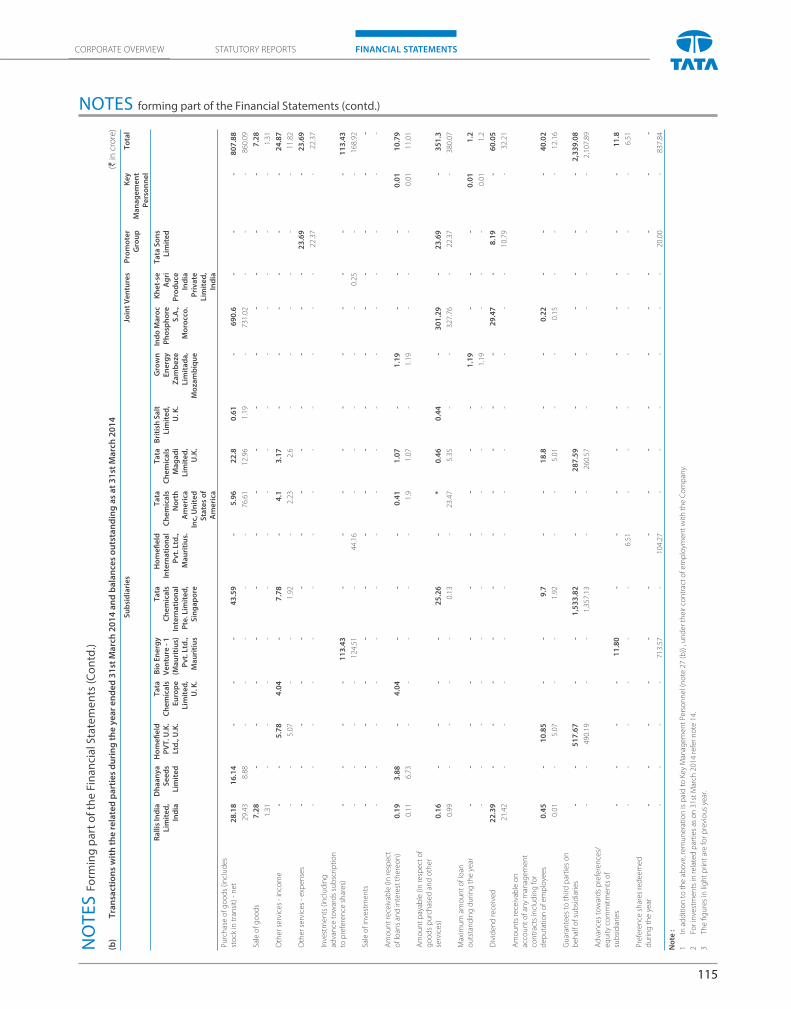
115
CORPORATE OVERVIEW FINANCIAL STATEMENTSSTATUTORY REPORTS
NOTES forming part of the Financial Statements (contd.)(b
) T
ran
sact
ion
s w
ith
th
e r
ela
ted
pa
rtie
s d
uri
ng
th
e y
ea
r e
nd
ed
31
st M
arc
h 2
01
4 a
nd
ba
lan
ces
ou
tsta
nd
ing
as
at
31
st M
arc
h 2
01
4
(` in
cro
re)
Su
bsi
dia
rie
sJo
int
Ve
ntu
res
Pro
mo
ter
Gro
up
Ke
y
Ma
na
ge
me
nt
Pe
rso
nn
el
To
tal
Ra
llis
Ind
ia
Lim
ite
d,
Ind
ia
Dh
aa
ny
a
Se
ed
s L
imit
ed
Ho
me
fi e
ld
PV
T. U
.K.
Ltd
., U
.K.
Ta
ta
Ch
em
ica
ls
Eu
rop
e
Lim
ite
d,
U. K
.
Bio
En
erg
y
Ve
ntu
re -
1
(Ma
uri
tiu
s)
Pv
t. L
td.,
Ma
uri
tiu
s
Ta
ta
Ch
em
ica
ls
Inte
rna
tio
na
l P
te. L
imit
ed
, S
ing
ap
ore
Ho
me
fi e
ld
Inte
rna
tio
na
l P
vt.
Ltd
., M
au
riti
us.
Ta
ta
Ch
em
ica
ls
No
rth
A
me
rica
In
c, U
nit
ed
S
tate
s o
f A
me
rica
Ta
ta
Ch
em
ica
ls
Ma
ga
di
Lim
ite
d,
U.K
.
Bri
tish
Sa
lt
Lim
ite
d,
U. K
.
Gro
wn
E
ne
rgy
Z
am
be
ze
Lim
ita
da
, M
oza
mb
iqu
e
Ind
o M
aro
c P
ho
sph
ore
S
.A.,
Mo
rocc
o.
Kh
et-
se
Ag
ri
Pro
du
ce
Ind
ia
Pri
va
te
Lim
ite
d,
Ind
ia
Ta
ta S
on
s L
imit
ed
Pu
rch
ase
of
go
od
s (in
clu
de
s st
ock
in t
ran
sit)
- n
et
28
.18
16
.14
--
-4
3.5
9-
5.9
62
2.8
0.6
1-
69
0.6
--
-8
07
.88
29
.43
8.8
8-
--
--
76
.61
12
.96
1.1
9-
73
1.0
2-
--
86
0.0
9
Sale
of
go
od
s7
.28
--
--
--
--
--
--
--
7.2
8
1.3
1-
--
--
--
--
--
--
-1
.31
Oth
er
serv
ice
s -
inco
me
--
5.7
84
.04
-7
.78
-4
.13
.17
--
--
--
24
.87
--
5.0
7-
-1
.92
-2
.23
2.6
--
--
--
11
.82
Oth
er
serv
ice
s -
exp
en
ses
--
--
--
--
--
--
-2
3.6
9-
23
.69
--
--
--
--
--
--
-2
2.3
7-
22
.37
Inve
stm
en
ts (
incl
ud
ing
ad
van
ce t
ow
ard
s su
bsc
rip
tio
n
to p
refe
ren
ce s
har
es)
--
--
11
3.4
3-
--
--
--
--
-1
13
.43
--
--
12
4.5
1-
44
.16
--
--
-0
.25
--
16
8.9
2
Sale
of
inve
stm
en
ts-
--
--
--
--
--
--
--
-
--
--
--
--
--
--
--
--
Am
ou
nt
rece
ivab
le (
in r
esp
ect
o
f lo
ans
and
inte
rest
th
ere
on
)0
.19
3.8
8-
4.0
4-
--
0.4
11
.07
-1
.19
--
-0
.01
10
.79
0.1
16
.73
--
--
-1
.91
.07
-1
.19
--
-0
.01
11
.01
Am
ou
nt
pay
able
(in
re
spe
ct o
f g
oo
ds
pu
rch
ase
d a
nd
oth
er
serv
ice
s)0
.16
--
--
25
.26
-*
0.4
60
.44
-3
01
.29
-2
3.6
9-
35
1.3
0.9
9-
--
-0
.13
-2
3.4
75
.35
--
32
7.7
6-
22
.37
-3
80
.07
Max
imu
m a
mo
un
t o
f lo
an
ou
tsta
nd
ing
du
rin
g t
he
ye
ar-
--
--
--
--
-1
.19
--
-0
.01
1.2
--
--
--
--
--
1.1
9-
--
0.0
11
.2
Div
ide
nd
re
ceiv
ed
22
.39
--
--
--
--
--
29
.47
-8
.19
-6
0.0
5
21
.42
--
--
--
--
--
--
10
.79
-3
2.2
1
Am
ou
nts
re
ceiv
able
on
ac
cou
nt
of
any
man
age
me
nt
con
trac
ts in
clu
din
g f
or
de
pu
tati
on
of
em
plo
yee
s0
.45
-1
0.8
5-
-9
.7-
-1
8.8
--
0.2
2-
--
40
.02
0.0
1-
5.0
7-
-1
.92
--
5.0
1-
-0
.15
--
-1
2.1
6
Gu
aran
tee
s to
th
ird
par
tie
s o
n
be
hal
f o
f su
bsi
dia
rie
s-
-5
17
.67
--
1,5
33
.82
--
28
7.5
9-
--
--
-2
,33
9.0
8
--
49
0.1
9-
-1
,35
7.1
3-
-2
60
.57
--
--
--
2,1
07
.89
Ad
van
ces
tow
ard
s p
refe
ren
ces/
eq
uit
y co
mm
itm
en
ts o
f su
bsi
dia
rie
s-
--
-1
1.8
0-
--
--
--
--
-1
1.8
--
--
--
6.5
1-
--
--
--
-6
.51
Pre
fere
nce
sh
are
s re
de
em
ed
d
uri
ng
th
e y
ear
--
--
--
--
--
--
--
--
--
--
71
3.5
7-
10
4.2
7-
--
--
-2
0.0
0-
83
7.8
4
No
te :
1
In a
dd
itio
n t
o t
he
ab
ove
, re
mu
ne
rati
on
is p
aid
to
Ke
y M
anag
em
en
t P
ers
on
ne
l (n
ote
27
(b
)) ,
un
de
r th
eir
co
ntr
act
of
em
plo
yme
nt
wit
h t
he
Co
mp
any.
2
For
inve
stm
en
ts in
re
late
d p
arti
es
as o
n 3
1st
Mar
ch 2
01
4 r
efe
r n
ote
14
.
3
The
fi g
ure
s in
lig
ht
pri
nt
are
fo
r p
revi
ou
s ye
ar.
NO
TE
S F
orm
ing
pa
rt o
f th
e F
ina
nci
al S
tate
me
nts
(Co
ntd
.)
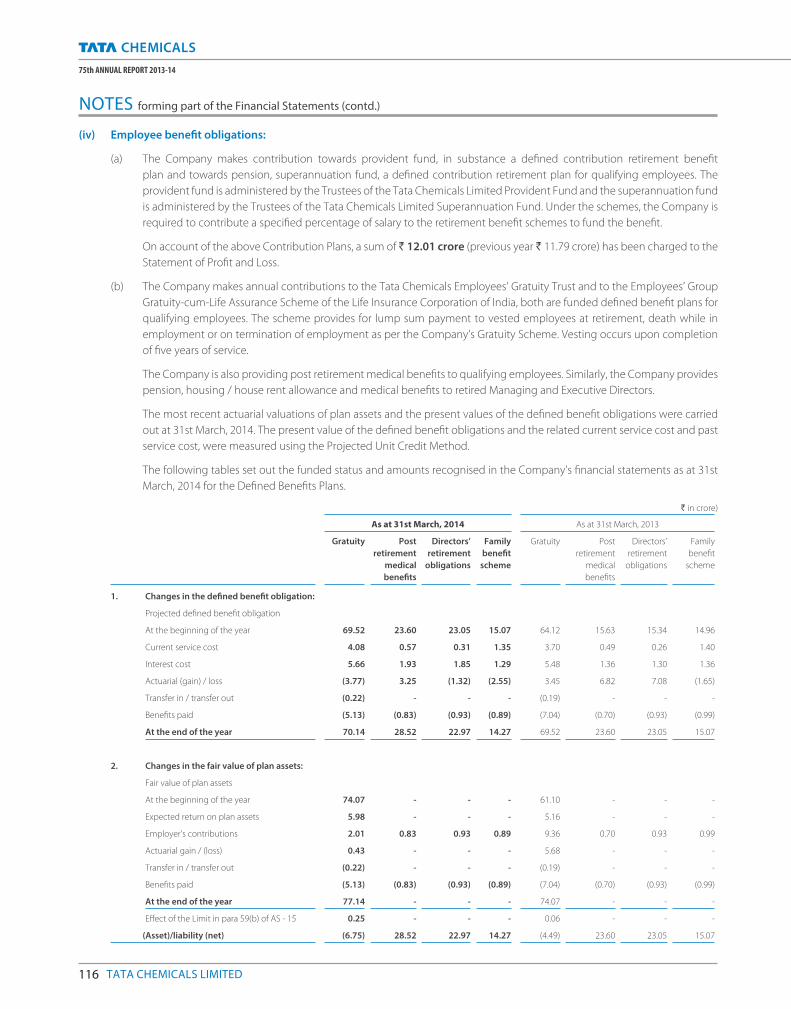
116 TATA CHEMICALS LIMITED
75th ANNUAL REPORT 2013-14
(iv) Employee benefi t obligations:
(a) The Company makes contribution towards provident fund, in substance a defi ned contribution retirement benefi t
plan and towards pension, superannuation fund, a defi ned contribution retirement plan for qualifying employees. The
provident fund is administered by the Trustees of the Tata Chemicals Limited Provident Fund and the superannuation fund
is administered by the Trustees of the Tata Chemicals Limited Superannuation Fund. Under the schemes, the Company is
required to contribute a specifi ed percentage of salary to the retirement benefi t schemes to fund the benefi t.
On account of the above Contribution Plans, a sum of ` 12.01 crore (previous year ` 11.79 crore) has been charged to the
Statement of Profi t and Loss.
(b) The Company makes annual contributions to the Tata Chemicals Employees’ Gratuity Trust and to the Employees’ Group
Gratuity-cum-Life Assurance Scheme of the Life Insurance Corporation of India, both are funded defi ned benefi t plans for
qualifying employees. The scheme provides for lump sum payment to vested employees at retirement, death while in
employment or on termination of employment as per the Company’s Gratuity Scheme. Vesting occurs upon completion
of fi ve years of service.
The Company is also providing post retirement medical benefi ts to qualifying employees. Similarly, the Company provides
pension, housing / house rent allowance and medical benefi ts to retired Managing and Executive Directors.
The most recent actuarial valuations of plan assets and the present values of the defi ned benefi t obligations were carried
out at 31st March, 2014. The present value of the defi ned benefi t obligations and the related current service cost and past
service cost, were measured using the Projected Unit Credit Method.
The following tables set out the funded status and amounts recognised in the Company’s fi nancial statements as at 31st
March, 2014 for the Defi ned Benefi ts Plans.
` in crore)
As at 31st March, 2014 As at 31st March, 2013
Gratuity Post
retirement
medical
benefi ts
Directors’
retirement
obligations
Family
benefi t
scheme
Gratuity Post
retirement
medical
benefi ts
Directors’
retirement
obligations
Family
benefi t
scheme
1. Changes in the defi ned benefi t obligation:
Projected defi ned benefi t obligation
At the beginning of the year 69.52 23.60 23.05 15.07 64.12 15.63 15.34 14.96
Current service cost 4.08 0.57 0.31 1.35 3.70 0.49 0.26 1.40
Interest cost 5.66 1.93 1.85 1.29 5.48 1.36 1.30 1.36
Actuarial (gain) / loss (3.77) 3.25 (1.32) (2.55) 3.45 6.82 7.08 (1.65)
Transfer in / transfer out (0.22) - - - (0.19) - - -
Benefi ts paid (5.13) (0.83) (0.93) (0.89) (7.04) (0.70) (0.93) (0.99)
At the end of the year 70.14 28.52 22.97 14.27 69.52 23.60 23.05 15.07
2. Changes in the fair value of plan assets:
Fair value of plan assets
At the beginning of the year 74.07 - - - 61.10 - - -
Expected return on plan assets 5.98 - - - 5.16 - - -
Employer’s contributions 2.01 0.83 0.93 0.89 9.36 0.70 0.93 0.99
Actuarial gain / (loss) 0.43 - - - 5.68 - - -
Transfer in / transfer out (0.22) - - - (0.19) - - -
Benefi ts paid (5.13) (0.83) (0.93) (0.89) (7.04) (0.70) (0.93) (0.99)
At the end of the year 77.14 - - - 74.07 - - -
Eff ect of the Limit in para 59(b) of AS - 15 0.25 - - - 0.06 - - -
(Asset)/liability (net) (6.75) 28.52 22.97 14.27 (4.49) 23.60 23.05 15.07
NOTES forming part of the Financial Statements (contd.)
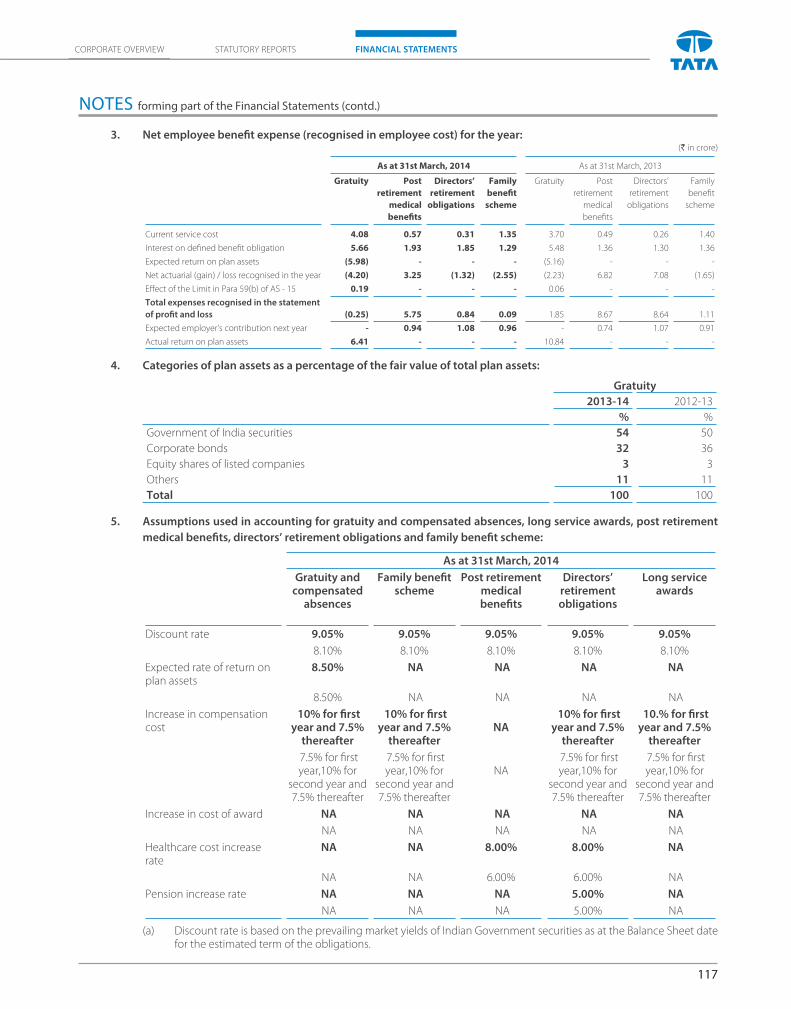
117
CORPORATE OVERVIEW FINANCIAL STATEMENTSSTATUTORY REPORTS
3. Net employee benefi t expense (recognised in employee cost) for the year:(` in crore)
As at 31st March, 2014 As at 31st March, 2013
Gratuity Post retirement
medical benefi ts
Directors’ retirement
obligations
Family benefi t scheme
Gratuity Post
retirement
medical
benefi ts
Directors’
retirement
obligations
Family
benefi t
scheme
Current service cost 4.08 0.57 0.31 1.35 3.70 0.49 0.26 1.40
Interest on defi ned benefi t obligation 5.66 1.93 1.85 1.29 5.48 1.36 1.30 1.36
Expected return on plan assets (5.98) - - - (5.16) - - -
Net actuarial (gain) / loss recognised in the year (4.20) 3.25 (1.32) (2.55) (2.23) 6.82 7.08 (1.65)
Eff ect of the Limit in Para 59(b) of AS - 15 0.19 - - - 0.06 - - -
Total expenses recognised in the statement
of profi t and loss (0.25) 5.75 0.84 0.09 1.85 8.67 8.64 1.11
Expected employer’s contribution next year - 0.94 1.08 0.96 - 0.74 1.07 0.91
Actual return on plan assets 6.41 - - - 10.84 - - -
4. Categories of plan assets as a percentage of the fair value of total plan assets:
Gratuity
2013-14 2012-13
% %
Government of India securities 54 50
Corporate bonds 32 36
Equity shares of listed companies 3 3
Others 11 11
Total 100 100
5. Assumptions used in accounting for gratuity and compensated absences, long service awards, post retirement
medical benefi ts, directors’ retirement obligations and family benefi t scheme:
As at 31st March, 2014
Gratuity and compensated
absences
Family benefi t scheme
Post retirement medical benefi ts
Directors’ retirement obligations
Long service awards
Discount rate 9.05% 9.05% 9.05% 9.05% 9.05%
8.10% 8.10% 8.10% 8.10% 8.10%
Expected rate of return on plan assets
8.50% NA NA NA NA
8.50% NA NA NA NA
Increase in compensation cost
10% for fi rst year and 7.5%
thereafter
10% for fi rst year and 7.5%
thereafter
NA
10% for fi rst year and 7.5%
thereafter
10.% for fi rst year and 7.5%
thereafter
7.5% for fi rst year,10% for
second year and 7.5% thereafter
7.5% for fi rst year,10% for
second year and 7.5% thereafter
NA
7.5% for fi rst year,10% for
second year and 7.5% thereafter
7.5% for fi rst year,10% for
second year and 7.5% thereafter
Increase in cost of award NA NA NA NA NA
NA NA NA NA NA
Healthcare cost increase rate
NA NA 8.00% 8.00% NA
NA NA 6.00% 6.00% NA
Pension increase rate NA NA NA 5.00% NA
NA NA NA 5.00% NA
(a) Discount rate is based on the prevailing market yields of Indian Government securities as at the Balance Sheet date for the estimated term of the obligations.
NOTES forming part of the Financial Statements (contd.)
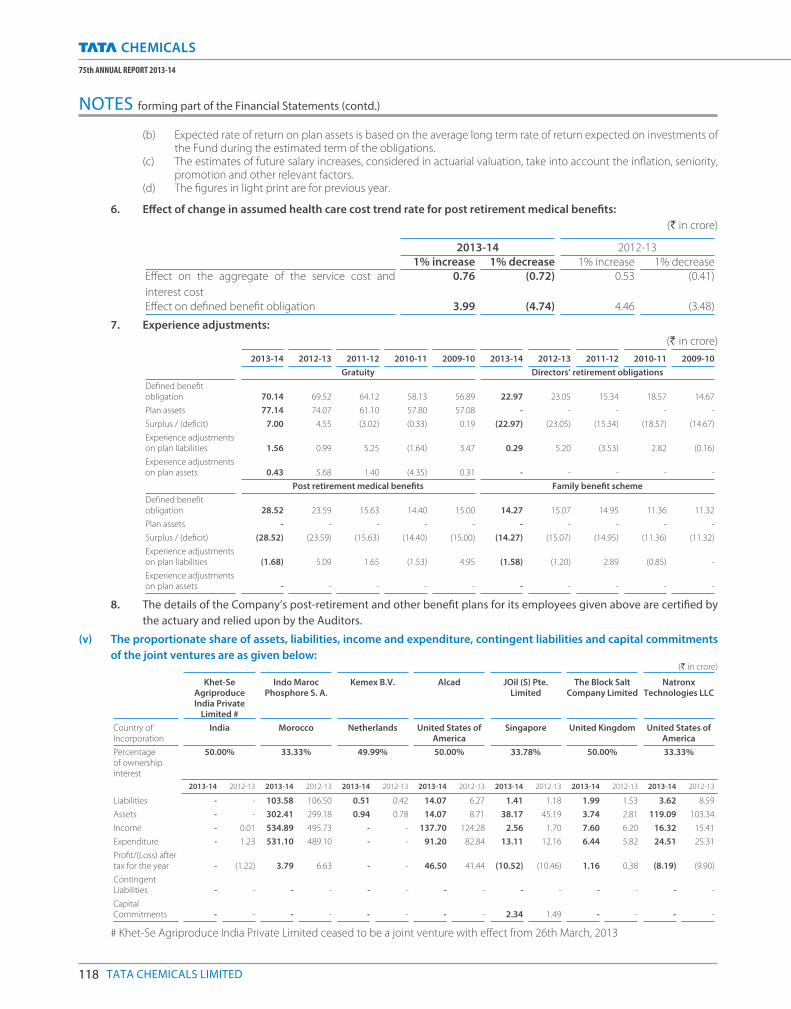
118 TATA CHEMICALS LIMITED
75th ANNUAL REPORT 2013-14
(b) Expected rate of return on plan assets is based on the average long term rate of return expected on investments of the Fund during the estimated term of the obligations.
(c) The estimates of future salary increases, considered in actuarial valuation, take into account the infl ation, seniority, promotion and other relevant factors.
(d) The fi gures in light print are for previous year.
6. Eff ect of change in assumed health care cost trend rate for post retirement medical benefi ts:
(` in crore)
2013-14 2012-13 1% increase 1% decrease 1% increase 1% decrease Eff ect on the aggregate of the service cost and
interest cost
0.76 (0.72) 0.53 (0.41)
Eff ect on defi ned benefi t obligation 3.99 (4.74) 4.46 (3.48)
7. Experience adjustments:
(` in crore)
2013-14 2012-13 2011-12 2010-11 2009-10 2013-14 2012-13 2011-12 2010-11 2009-10
Gratuity Directors’ retirement obligations
Defi ned benefi t obligation 70.14 69.52 64.12 58.13 56.89 22.97 23.05 15.34 18.57 14.67
Plan assets 77.14 74.07 61.10 57.80 57.08 - - - - -
Surplus / (defi cit) 7.00 4.55 (3.02) (0.33) 0.19 (22.97) (23.05) (15.34) (18.57) (14.67)
Experience adjustments on plan liabilities 1.56 0.99 5.25 (1.64) 3.47 0.29 5.20 (3.53) 2.82 (0.16)
Experience adjustments on plan assets 0.43 5.68 1.40 (4.35) 0.31 - - - - -
Post retirement medical benefi ts Family benefi t scheme
Defi ned benefi t obligation 28.52 23.59 15.63 14.40 15.00 14.27 15.07 14.95 11.36 11.32
Plan assets - - - - - - - - - -
Surplus / (defi cit) (28.52) (23.59) (15.63) (14.40) (15.00) (14.27) (15.07) (14.95) (11.36) (11.32)
Experience adjustments on plan liabilities (1.68) 5.09 1.65 (1.53) 4.95 (1.58) (1.20) 2.89 (0.85) -
Experience adjustments on plan assets - - - - - - - - - -
8. The details of the Company’s post-retirement and other benefi t plans for its employees given above are certifi ed by
the actuary and relied upon by the Auditors.
(v) The proportionate share of assets, liabilities, income and expenditure, contingent liabilities and capital commitments
of the joint ventures are as given below:(` in crore)
Khet-Se Agriproduce India Private
Limited #
Indo Maroc Phosphore S. A.
Kemex B.V. Alcad JOil (S) Pte. Limited
The Block Salt Company Limited
Natronx Technologies LLC
Country of Incorporation
India Morocco Netherlands United States of America
Singapore United Kingdom United States of America
Percentage of ownership interest
50.00% 33.33% 49.99% 50.00% 33.78% 50.00% 33.33%
2013-14 2012-13 2013-14 2012-13 2013-14 2012-13 2013-14 2012-13 2013-14 2012-13 2013-14 2012-13 2013-14 2012-13
Liabilities - - 103.58 106.50 0.51 0.42 14.07 6.27 1.41 1.18 1.99 1.53 3.62 8.59
Assets - - 302.41 299.18 0.94 0.78 14.07 8.71 38.17 45.19 3.74 2.81 119.09 103.34
Income - 0.01 534.89 495.73 - - 137.70 124.28 2.56 1.70 7.60 6.20 16.32 15.41
Expenditure - 1.23 531.10 489.10 - - 91.20 82.84 13.11 12.16 6.44 5.82 24.51 25.31
Profi t/(Loss) after tax for the year - (1.22) 3.79 6.63 - - 46.50 41.44 (10.52) (10.46) 1.16 0.38 (8.19) (9.90)
Contingent Liabilities - - - - - - - - - - - - - -
Capital Commitments - - - - - - - - 2.34 1.49 - - - -
# Khet-Se Agriproduce India Private Limited ceased to be a joint venture with eff ect from 26th March, 2013
NOTES forming part of the Financial Statements (contd.)
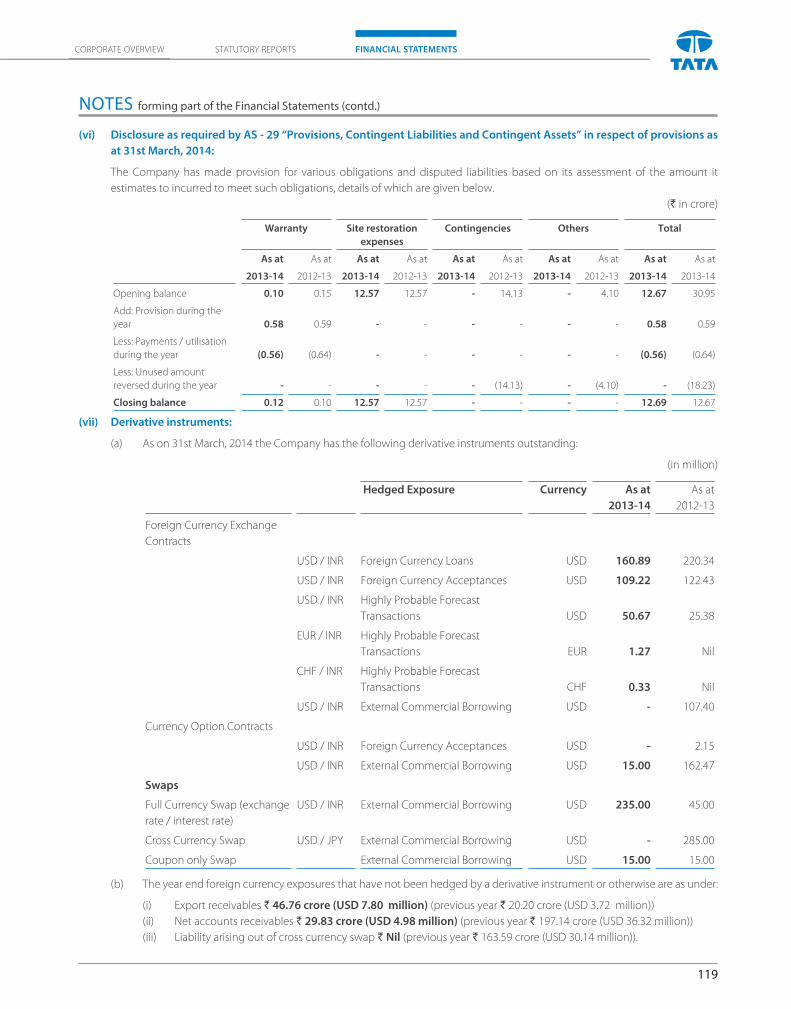
119
CORPORATE OVERVIEW FINANCIAL STATEMENTSSTATUTORY REPORTS
(vi) Disclosure as required by AS - 29 “Provisions, Contingent Liabilities and Contingent Assets” in respect of provisions as
at 31st March, 2014:
The Company has made provision for various obligations and disputed liabilities based on its assessment of the amount it
estimates to incurred to meet such obligations, details of which are given below.
(` in crore)
Warranty Site restoration
expenses
Contingencies Others Total
As at As at As at As at As at As at As at As at As at As at
2013-14 2012-13 2013-14 2012-13 2013-14 2012-13 2013-14 2012-13 2013-14 2013-14
Opening balance 0.10 0.15 12.57 12.57 - 14.13 - 4.10 12.67 30.95
Add: Provision during the
year 0.58 0.59 - - - - - - 0.58 0.59
Less: Payments / utilisation
during the year (0.56) (0.64) - - - - - - (0.56) (0.64)
Less: Unused amount
reversed during the year - - - - - (14.13) - (4.10) - (18.23)
Closing balance 0.12 0.10 12.57 12.57 - - - - 12.69 12.67
(vii) Derivative instruments:
(a) As on 31st March, 2014 the Company has the following derivative instruments outstanding:
(in million)
Hedged Exposure Currency As at
2013-14
As at
2012-13
Foreign Currency Exchange
Contracts
USD / INR Foreign Currency Loans USD 160.89 220.34
USD / INR Foreign Currency Acceptances USD 109.22 122.43
USD / INR Highly Probable Forecast
Transactions USD 50.67 25.38
EUR / INR Highly Probable Forecast
Transactions EUR 1.27 Nil
CHF / INR Highly Probable Forecast
Transactions CHF 0.33 Nil
USD / INR External Commercial Borrowing USD - 107.40
Currency Option Contracts
USD / INR Foreign Currency Acceptances USD - 2.15
USD / INR External Commercial Borrowing USD 15.00 162.47
Swaps
Full Currency Swap (exchange
rate / interest rate)
USD / INR External Commercial Borrowing USD 235.00 45.00
Cross Currency Swap USD / JPY External Commercial Borrowing USD - 285.00
Coupon only Swap External Commercial Borrowing USD 15.00 15.00
(b) The year end foreign currency exposures that have not been hedged by a derivative instrument or otherwise are as under:
(i) Export receivables ` 46.76 crore (USD 7.80 million) (previous year ` 20.20 crore (USD 3.72 million))
(ii) Net accounts receivables ` 29.83 crore (USD 4.98 million) (previous year ` 197.14 crore (USD 36.32 million))
(iii) Liability arising out of cross currency swap ` Nil (previous year ` 163.59 crore (USD 30.14 million)).
NOTES forming part of the Financial Statements (contd.)
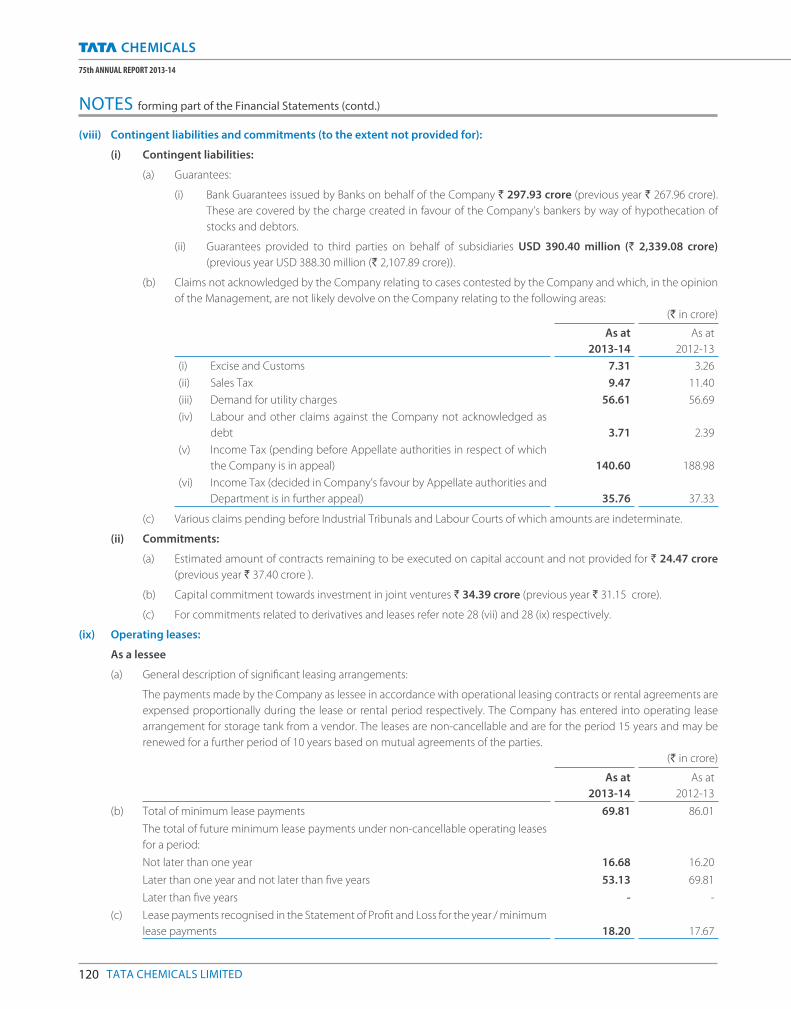
120 TATA CHEMICALS LIMITED
75th ANNUAL REPORT 2013-14
(viii) Contingent liabilities and commitments (to the extent not provided for):
(i) Contingent liabilities:
(a) Guarantees:
(i) Bank Guarantees issued by Banks on behalf of the Company ` 297.93 crore (previous year ` 267.96 crore).
These are covered by the charge created in favour of the Company’s bankers by way of hypothecation of
stocks and debtors.
(ii) Guarantees provided to third parties on behalf of subsidiaries USD 390.40 million (` 2,339.08 crore)
(previous year USD 388.30 million (` 2,107.89 crore)).
(b) Claims not acknowledged by the Company relating to cases contested by the Company and which, in the opinion
of the Management, are not likely devolve on the Company relating to the following areas:
(` in crore)
As at
2013-14
As at
2012-13
(i) Excise and Customs 7.31 3.26
(ii) Sales Tax 9.47 11.40
(iii) Demand for utility charges 56.61 56.69
(iv) Labour and other claims against the Company not acknowledged as
debt 3.71 2.39
(v) Income Tax (pending before Appellate authorities in respect of which
the Company is in appeal) 140.60 188.98
(vi) Income Tax (decided in Company’s favour by Appellate authorities and
Department is in further appeal) 35.76 37.33
(c) Various claims pending before Industrial Tribunals and Labour Courts of which amounts are indeterminate.
(ii) Commitments:
(a) Estimated amount of contracts remaining to be executed on capital account and not provided for ` 24.47 crore
(previous year ` 37.40 crore ).
(b) Capital commitment towards investment in joint ventures ` 34.39 crore (previous year ` 31.15 crore).
(c) For commitments related to derivatives and leases refer note 28 (vii) and 28 (ix) respectively.
(ix) Operating leases:
As a lessee
(a) General description of signifi cant leasing arrangements:
The payments made by the Company as lessee in accordance with operational leasing contracts or rental agreements are
expensed proportionally during the lease or rental period respectively. The Company has entered into operating lease
arrangement for storage tank from a vendor. The leases are non-cancellable and are for the period 15 years and may be
renewed for a further period of 10 years based on mutual agreements of the parties.
(` in crore)
As at
2013-14
As at
2012-13
(b) Total of minimum lease payments 69.81 86.01
The total of future minimum lease payments under non-cancellable operating leases
for a period:
Not later than one year 16.68 16.20
Later than one year and not later than fi ve years 53.13 69.81
Later than fi ve years - -
(c) Lease payments recognised in the Statement of Profi t and Loss for the year / minimum
lease payments 18.20 17.67
NOTES forming part of the Financial Statements (contd.)
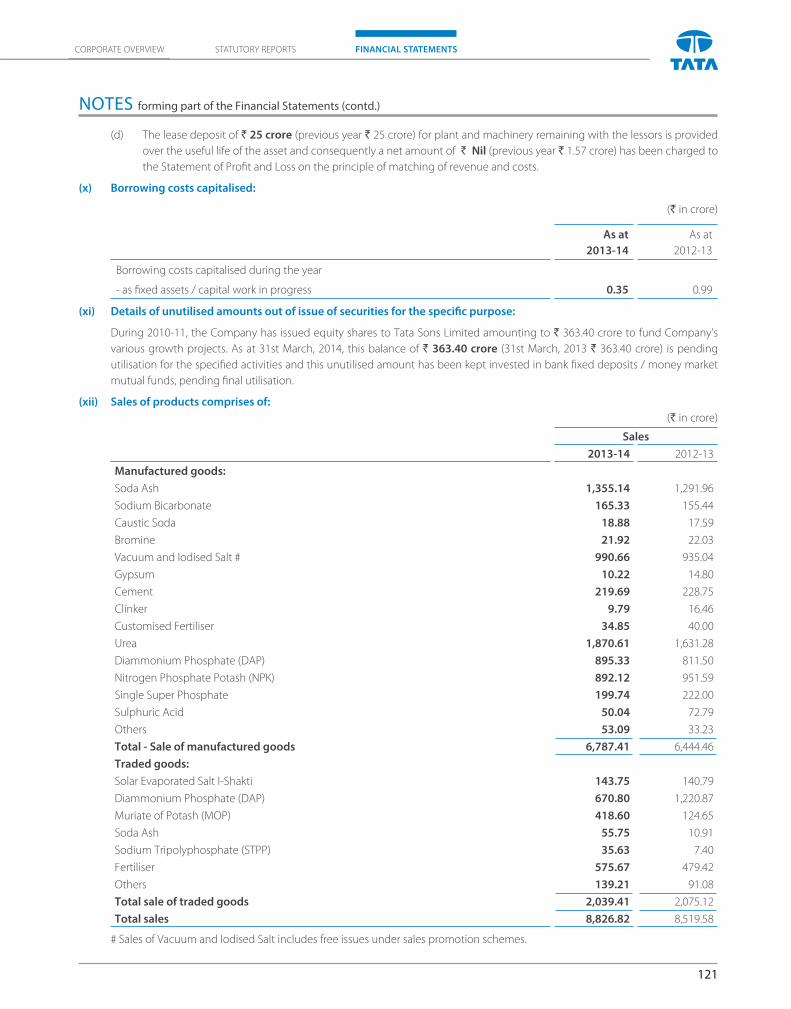
121
CORPORATE OVERVIEW FINANCIAL STATEMENTSSTATUTORY REPORTS
(d) The lease deposit of ` 25 crore (previous year ` 25 crore) for plant and machinery remaining with the lessors is provided
over the useful life of the asset and consequently a net amount of ` Nil (previous year ` 1.57 crore) has been charged to
the Statement of Profi t and Loss on the principle of matching of revenue and costs.
(x) Borrowing costs capitalised:
(` in crore)
As at
2013-14
As at
2012-13
Borrowing costs capitalised during the year
- as fi xed assets / capital work in progress 0.35 0.99
(xi) Details of unutilised amounts out of issue of securities for the specifi c purpose:
During 2010-11, the Company has issued equity shares to Tata Sons Limited amounting to ` 363.40 crore to fund Company’s
various growth projects. As at 31st March, 2014, this balance of ` 363.40 crore (31st March, 2013 ` 363.40 crore) is pending
utilisation for the specifi ed activities and this unutilised amount has been kept invested in bank fi xed deposits / money market
mutual funds, pending fi nal utilisation.
(xii) Sales of products comprises of:
(` in crore)
Sales
2013-14 2012-13
Manufactured goods:
Soda Ash 1,355.14 1,291.96
Sodium Bicarbonate 165.33 155.44
Caustic Soda 18.88 17.59
Bromine 21.92 22.03
Vacuum and Iodised Salt # 990.66 935.04
Gypsum 10.22 14.80
Cement 219.69 228.75
Clinker 9.79 16.46
Customised Fertiliser 34.85 40.00
Urea 1,870.61 1,631.28
Diammonium Phosphate (DAP) 895.33 811.50
Nitrogen Phosphate Potash (NPK) 892.12 951.59
Single Super Phosphate 199.74 222.00
Sulphuric Acid 50.04 72.79
Others 53.09 33.23
Total - Sale of manufactured goods 6,787.41 6,444.46
Traded goods:
Solar Evaporated Salt I-Shakti 143.75 140.79
Diammonium Phosphate (DAP) 670.80 1,220.87
Muriate of Potash (MOP) 418.60 124.65
Soda Ash 55.75 10.91
Sodium Tripolyphosphate (STPP) 35.63 7.40
Fertiliser 575.67 479.42
Others 139.21 91.08
Total sale of traded goods 2,039.41 2,075.12
Total sales 8,826.82 8,519.58
# Sales of Vacuum and Iodised Salt includes free issues under sales promotion schemes.
NOTES forming part of the Financial Statements (contd.)
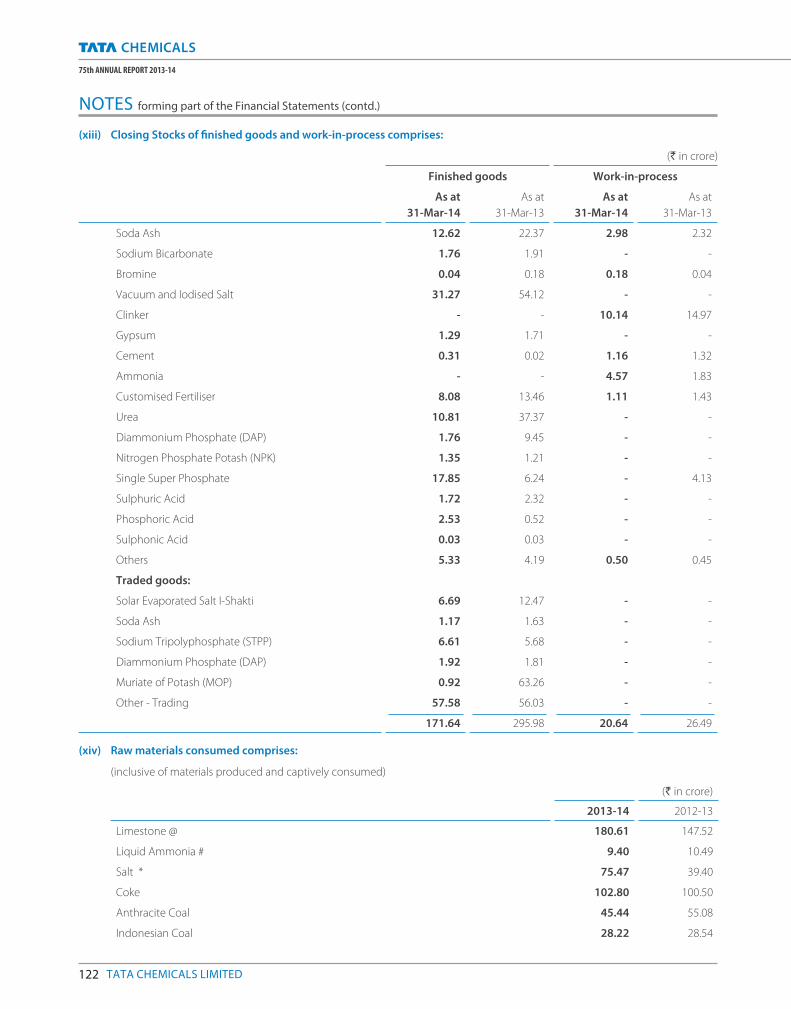
122 TATA CHEMICALS LIMITED
75th ANNUAL REPORT 2013-14
(xiii) Closing Stocks of fi nished goods and work-in-process comprises:
(` in crore)
Finished goods Work-in-process
As at
31-Mar-14
As at
31-Mar-13
As at
31-Mar-14
As at
31-Mar-13
Soda Ash 12.62 22.37 2.98 2.32
Sodium Bicarbonate 1.76 1.91 - -
Bromine 0.04 0.18 0.18 0.04
Vacuum and Iodised Salt 31.27 54.12 - -
Clinker - - 10.14 14.97
Gypsum 1.29 1.71 - -
Cement 0.31 0.02 1.16 1.32
Ammonia - - 4.57 1.83
Customised Fertiliser 8.08 13.46 1.11 1.43
Urea 10.81 37.37 - -
Diammonium Phosphate (DAP) 1.76 9.45 - -
Nitrogen Phosphate Potash (NPK) 1.35 1.21 - -
Single Super Phosphate 17.85 6.24 - 4.13
Sulphuric Acid 1.72 2.32 - -
Phosphoric Acid 2.53 0.52 - -
Sulphonic Acid 0.03 0.03 - -
Others 5.33 4.19 0.50 0.45
Traded goods:
Solar Evaporated Salt I-Shakti 6.69 12.47 - -
Soda Ash 1.17 1.63 - -
Sodium Tripolyphosphate (STPP) 6.61 5.68 - -
Diammonium Phosphate (DAP) 1.92 1.81 - -
Muriate of Potash (MOP) 0.92 63.26 - -
Other - Trading 57.58 56.03 - -
171.64 295.98 20.64 26.49
(xiv) Raw materials consumed comprises:
(inclusive of materials produced and captively consumed)
(` in crore)
2013-14 2012-13
Limestone @ 180.61 147.52
Liquid Ammonia # 9.40 10.49
Salt * 75.47 39.40
Coke 102.80 100.50
Anthracite Coal 45.44 55.08
Indonesian Coal 28.22 28.54
NOTES forming part of the Financial Statements (contd.)
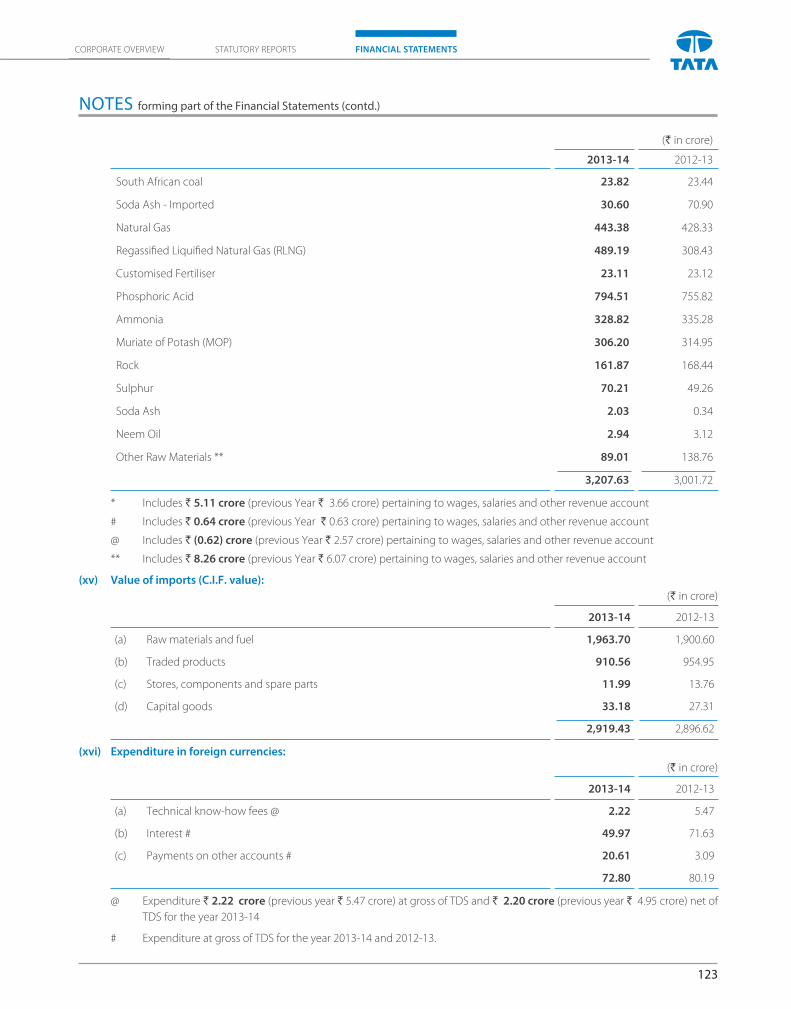
123
CORPORATE OVERVIEW FINANCIAL STATEMENTSSTATUTORY REPORTS
(` in crore)
2013-14 2012-13
South African coal 23.82 23.44
Soda Ash - Imported 30.60 70.90
Natural Gas 443.38 428.33
Regassifi ed Liquifi ed Natural Gas (RLNG) 489.19 308.43
Customised Fertiliser 23.11 23.12
Phosphoric Acid 794.51 755.82
Ammonia 328.82 335.28
Muriate of Potash (MOP) 306.20 314.95
Rock 161.87 168.44
Sulphur 70.21 49.26
Soda Ash 2.03 0.34
Neem Oil 2.94 3.12
Other Raw Materials ** 89.01 138.76
3,207.63 3,001.72
* Includes ` 5.11 crore (previous Year ` 3.66 crore) pertaining to wages, salaries and other revenue account
# Includes ` 0.64 crore (previous Year ` 0.63 crore) pertaining to wages, salaries and other revenue account
@ Includes ` (0.62) crore (previous Year ` 2.57 crore) pertaining to wages, salaries and other revenue account
** Includes ` 8.26 crore (previous Year ` 6.07 crore) pertaining to wages, salaries and other revenue account
(xv) Value of imports (C.I.F. value):
(` in crore)
2013-14 2012-13
(a) Raw materials and fuel 1,963.70 1,900.60
(b) Traded products 910.56 954.95
(c) Stores, components and spare parts 11.99 13.76
(d) Capital goods 33.18 27.31
2,919.43 2,896.62
(xvi) Expenditure in foreign currencies:
(` in crore)
2013-14 2012-13
(a) Technical know-how fees @ 2.22 5.47
(b) Interest # 49.97 71.63
(c) Payments on other accounts # 20.61 3.09
72.80 80.19
@ Expenditure ` 2.22 crore (previous year ` 5.47 crore) at gross of TDS and ` 2.20 crore (previous year ` 4.95 crore) net of
TDS for the year 2013-14
# Expenditure at gross of TDS for the year 2013-14 and 2012-13.
NOTES forming part of the Financial Statements (contd.)
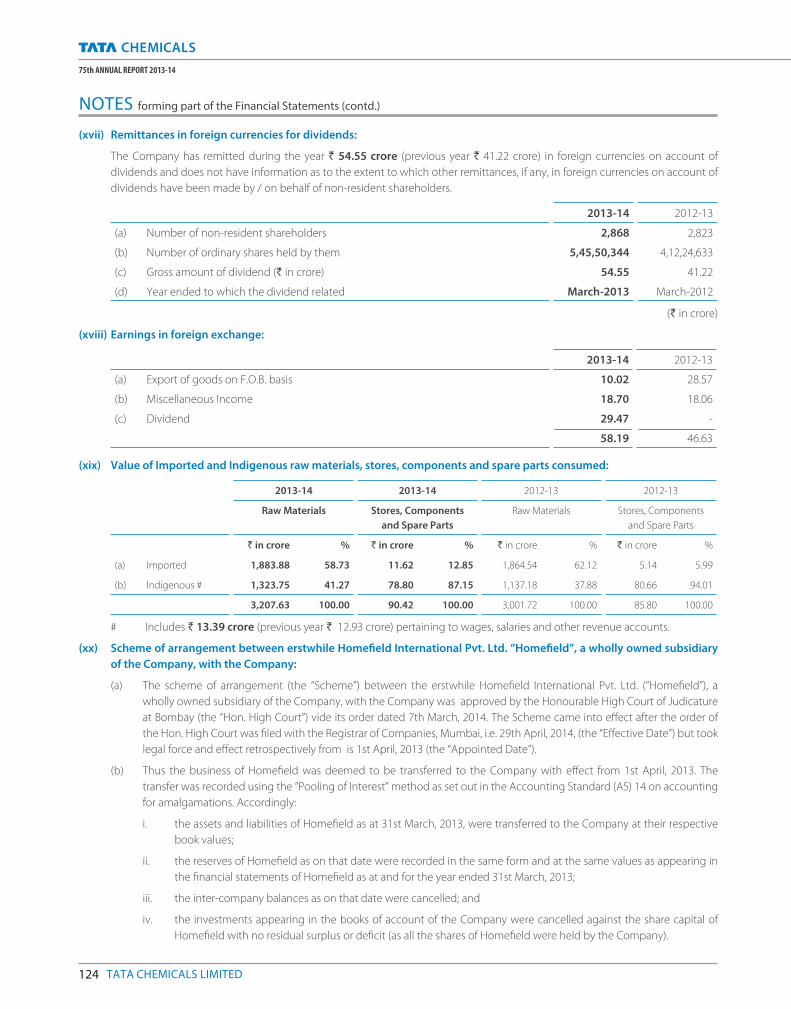
124 TATA CHEMICALS LIMITED
75th ANNUAL REPORT 2013-14
(xvii) Remittances in foreign currencies for dividends:
The Company has remitted during the year ` 54.55 crore (previous year ` 41.22 crore) in foreign currencies on account of
dividends and does not have information as to the extent to which other remittances, if any, in foreign currencies on account of
dividends have been made by / on behalf of non-resident shareholders.
2013-14 2012-13
(a) Number of non-resident shareholders 2,868 2,823
(b) Number of ordinary shares held by them 5,45,50,344 4,12,24,633
(c) Gross amount of dividend (` in crore) 54.55 41.22
(d) Year ended to which the dividend related March-2013 March-2012
(` in crore)
(xviii) Earnings in foreign exchange:
2013-14 2012-13
(a) Export of goods on F.O.B. basis 10.02 28.57
(b) Miscellaneous Income 18.70 18.06
(c) Dividend 29.47 -
58.19 46.63
(xix) Value of Imported and Indigenous raw materials, stores, components and spare parts consumed:
2013-14 2013-14 2012-13 2012-13
Raw Materials Stores, Components
and Spare Parts
Raw Materials Stores, Components
and Spare Parts
` in crore % ` in crore % ` in crore % ` in crore %
(a) Imported 1,883.88 58.73 11.62 12.85 1,864.54 62.12 5.14 5.99
(b) Indigenous # 1,323.75 41.27 78.80 87.15 1,137.18 37.88 80.66 94.01
3,207.63 100.00 90.42 100.00 3,001.72 100.00 85.80 100.00
# Includes ` 13.39 crore (previous year ` 12.93 crore) pertaining to wages, salaries and other revenue accounts.
(xx) Scheme of arrangement between erstwhile Homefi eld International Pvt. Ltd. ”Homefi eld”, a wholly owned subsidiary
of the Company, with the Company:
(a) The scheme of arrangement (the “Scheme”) between the erstwhile Homefi eld International Pvt. Ltd. (“Homefi eld”), a
wholly owned subsidiary of the Company, with the Company was approved by the Honourable High Court of Judicature
at Bombay (the “Hon. High Court”) vide its order dated 7th March, 2014. The Scheme came into eff ect after the order of
the Hon. High Court was fi led with the Registrar of Companies, Mumbai, i.e. 29th April, 2014, (the “Eff ective Date”) but took
legal force and eff ect retrospectively from is 1st April, 2013 (the “Appointed Date”).
(b) Thus the business of Homefi eld was deemed to be transferred to the Company with eff ect from 1st April, 2013. The
transfer was recorded using the “Pooling of Interest” method as set out in the Accounting Standard (AS) 14 on accounting
for amalgamations. Accordingly:
i. the assets and liabilities of Homefi eld as at 31st March, 2013, were transferred to the Company at their respective
book values;
ii. the reserves of Homefi eld as on that date were recorded in the same form and at the same values as appearing in
the fi nancial statements of Homefi eld as at and for the year ended 31st March, 2013;
iii. the inter-company balances as on that date were cancelled; and
iv. the investments appearing in the books of account of the Company were cancelled against the share capital of
Homefi eld with no residual surplus or defi cit (as all the shares of Homefi eld were held by the Company).
NOTES forming part of the Financial Statements (contd.)
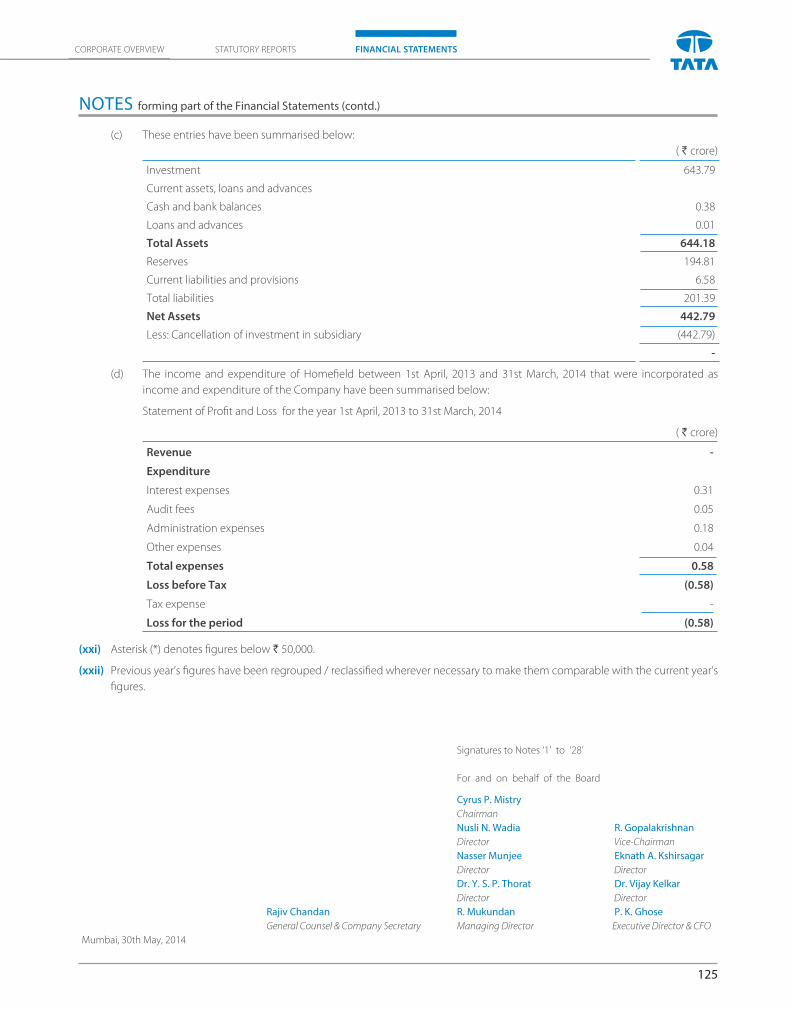
125
CORPORATE OVERVIEW FINANCIAL STATEMENTSSTATUTORY REPORTS
(c) These entries have been summarised below:
( ` crore)
Investment 643.79
Current assets, loans and advances
Cash and bank balances 0.38
Loans and advances 0.01
Total Assets 644.18
Reserves 194.81
Current liabilities and provisions 6.58
Total liabilities 201.39
Net Assets 442.79
Less: Cancellation of investment in subsidiary (442.79)
-
(d) The income and expenditure of Homefi eld between 1st April, 2013 and 31st March, 2014 that were incorporated as
income and expenditure of the Company have been summarised below:
Statement of Profi t and Loss for the year 1st April, 2013 to 31st March, 2014
( ` crore)
Revenue -
Expenditure
Interest expenses 0.31
Audit fees 0.05
Administration expenses 0.18
Other expenses 0.04
Total expenses 0.58
Loss before Tax (0.58)
Tax expense -
Loss for the period (0.58)
(xxi) Asterisk (*) denotes fi gures below ` 50,000.
(xxii) Previous year’s fi gures have been regrouped / reclassifi ed wherever necessary to make them comparable with the current year’s
fi gures.
Signatures to Notes ‘1’ to ‘28’
For and on behalf of the Board
Cyrus P. Mistry
Chairman
Nusli N. Wadia R. Gopalakrishnan
Director Vice-Chairman
Nasser Munjee Eknath A. Kshirsagar
Director Director
Dr. Y. S. P. Thorat Dr. Vijay Kelkar
Director Director
Rajiv Chandan R. Mukundan P. K. Ghose
General Counsel & Company Secretary Managing Director Executive Director & CFO
Mumbai, 30th May, 2014
NOTES forming part of the Financial Statements (contd.)
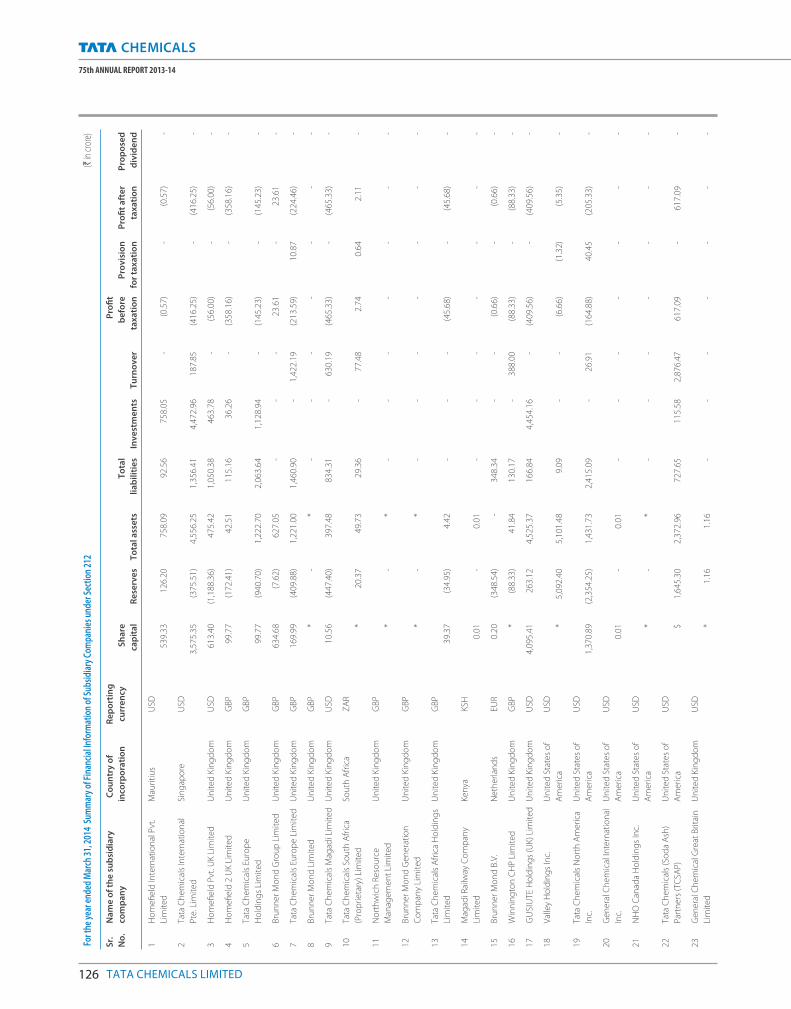
126 TATA CHEMICALS LIMITED
75th ANNUAL REPORT 2013-14
For t
he y
ear e
nded
Mar
ch 3
1, 2
014
Sum
mar
y of
Fin
anci
al In
form
atio
n of
Sub
sidi
ary
Com
pani
es u
nder
Sec
tion
212
(`
in c
rore
)
Sr.
No
.
Na
me
of
the
su
bsi
dia
ry
com
pa
ny
Co
un
try
of
inco
rpo
rati
on
Re
po
rtin
g
curr
en
cy S
ha
re
cap
ita
l R
ese
rve
s T
ota
l ass
ets
To
tal
lia
bil
itie
s In
ve
stm
en
ts
Tu
rno
ve
r
Pro
fi t
be
fore
tax
ati
on
Pro
vis
ion
for
tax
ati
on
Pro
fi t
aft
er
tax
ati
on
Pro
po
sed
div
ide
nd
1H
om
efi
eld
Inte
rnat
ion
al P
vt.
Lim
ite
d
Mau
riti
us
USD
53
9.3
3
12
6.2
0
75
8.0
9
92
.56
7
58
.05
-
(0
.57
) -
(0
.57
) -
2Ta
ta C
he
mic
als
Inte
rnat
ion
al
Pte
. Lim
ite
d
Sin
gap
ore
USD
3,5
75
.35
(3
75
.51
)4
,55
6.2
51
,35
6.4
1
4,4
72
.96
18
7.8
5
(41
6.2
5)
-
(41
6.2
5)
-
3H
om
efi
eld
Pvt
. UK
Lim
ite
dU
nit
ed
Kin
gd
om
USD
61
3.4
0
(1,1
88
.36
)4
75
.42
1
,05
0.3
8
46
3.7
8
-
(56
.00
) -
(5
6.0
0)
-
4H
om
efi
eld
2 U
K L
imit
ed
Un
ite
d K
ing
do
mG
BP
99
.77
(17
2.4
1)
42
.51
11
5.1
63
6.2
6 -
(3
58
.16
) -
(3
58
.16
) -
5Ta
ta C
he
mic
als
Euro
pe
Ho
ldin
gs
Lim
ite
d
Un
ite
d K
ing
do
mG
BP
99
.77
(9
40
.70
)1
,22
2.7
0 2
,06
3.6
41
,12
8.9
4 -
(1
45
.23
) -
(1
45
.23
) -
6B
run
ne
r M
on
d G
rou
p L
imit
ed
Un
ite
d K
ing
do
mG
BP
63
4.6
8
(7.6
2)
62
7.0
5 -
-
-
23
.61
-
23
.61
-
7Ta
ta C
he
mic
als
Euro
pe
Lim
ite
dU
nit
ed
Kin
gd
om
GB
P1
69
.99
(40
9.8
8)
1,2
21
.00
1
,46
0.9
0
-
1,4
22
.19
(2
13
.59
) 1
0.8
7
(22
4.4
6)
-
8B
run
ne
r M
on
d L
imit
ed
U
nit
ed
Kin
gd
om
GB
P *
-
* -
-
-
-
-
-
-
9Ta
ta C
he
mic
als
Mag
adi L
imit
ed
Un
ite
d K
ing
do
mU
SD1
0.5
6
(44
7.4
0)
39
7.4
8
83
4.3
1
-
63
0.1
9
(46
5.3
3)
-
(46
5.3
3)
-
10
Tata
Ch
em
ical
s So
uth
Afr
ica
(Pro
pri
eta
ry)
Lim
ite
d
Sou
th A
fric
aZ
AR
* 2
0.3
7
49
.73
29
.36
-
77
.48
2.7
4
0.6
4
2.1
1
-
11
No
rth
wic
h R
eso
urc
e
Man
age
me
nt
Lim
ite
d
Un
ite
d K
ing
do
mG
BP
* -
*
-
-
-
-
-
-
-
12
Bru
nn
er
Mo
nd
Ge
ne
rati
on
Co
mp
any
Lim
ite
d
Un
ite
d K
ing
do
mG
BP
* -
*
-
-
-
-
-
-
-
13
Tata
Ch
em
ical
s A
fric
a H
old
ing
s
Lim
ite
d
Un
ite
d K
ing
do
mG
BP
39
.37
(3
4.9
5)
4.4
2 -
-
-
(45
.68
) -
(4
5.6
8)
-
14
Mag
adi R
ailw
ay C
om
pan
y
Lim
ite
d
Ke
nya
KSH
0.0
1
-
0.0
1 -
-
-
-
-
-
-
15
Bru
nn
er
Mo
nd
B.V
.N
eth
erl
and
sEU
R0
.20
(34
8.5
4)
- 3
48
.34
-
-
(0.6
6)
-
(0.6
6)
-
16
Win
nin
gto
n C
HP
Lim
ite
dU
nit
ed
Kin
gd
om
GB
P*
(88
.33
) 4
1.8
4
13
0.1
7 -
3
88
.00
(88
.33
) -
(8
8.3
3)
-
17
GU
SIU
TE
Ho
ldin
gs
(UK
) Lim
ite
dU
nit
ed
Kin
gd
om
USD
4,0
95
.41
2
63
.12
4
,52
5.3
7
16
6.8
4
4,4
54
.16
-
(4
09
.56
) -
(4
09
.56
) -
18
Val
ley
Ho
ldin
gs
Inc.
Un
ite
d S
tate
s o
f
Am
eri
ca
USD
* 5
,09
2.4
0
5,1
01
.48
9
.09
-
-
(6
.66
)(1
.32
)(5
.35
) -
19
Tata
Ch
em
ical
s N
ort
h A
me
rica
Inc.
Un
ite
d S
tate
s o
f
Am
eri
ca
USD
1,3
70
.89
(2,3
54
.25
) 1
,43
1.7
3
2,4
15
.09
-
2
6.9
1
(16
4.8
8)
40
.45
(2
05
.33
) -
20
Ge
ne
ral C
he
mic
al In
tern
atio
nal
Inc.
Un
ite
d S
tate
s o
f
Am
eri
ca
USD
0.0
1-
0.0
1
-
-
-
-
-
-
-
21
NH
O C
anad
a H
old
ing
s In
c.U
nit
ed
Sta
tes
of
Am
eri
ca
USD
*-
* -
-
-
-
-
-
-
22
Tata
Ch
em
ical
s (S
od
a A
sh)
Par
tne
rs (
TCSA
P)
Un
ite
d S
tate
s o
f
Am
eri
ca
USD
$ 1
,64
5.3
0
2,3
72
.96
7
27
.65
1
15
.58
2
,87
6.4
7
61
7.0
9
-
61
7.0
9
-
23
Ge
ne
ral C
he
mic
al G
reat
Bri
tain
Lim
ite
d
Un
ite
d K
ing
do
mU
SD
* 1
.16
1
.16
-
-
-
-
-
-
-
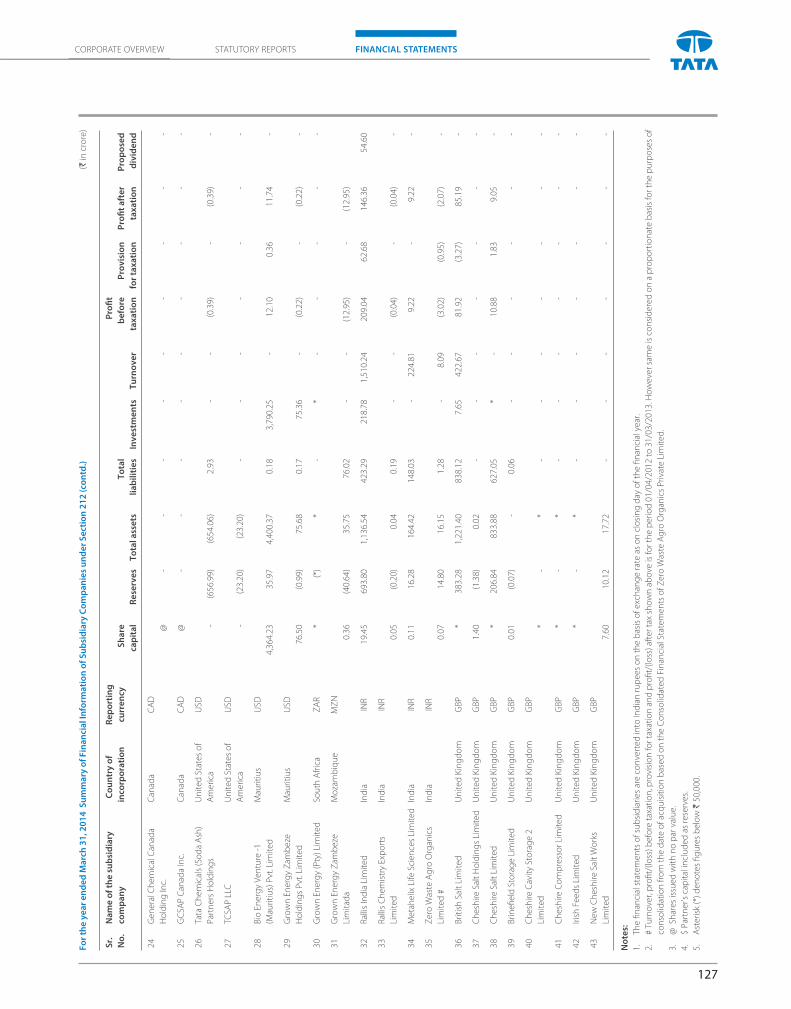
127
CORPORATE OVERVIEW FINANCIAL STATEMENTSSTATUTORY REPORTS
Sr.
No
.
Na
me
of
the
su
bsi
dia
ry
com
pa
ny
Co
un
try
of
inco
rpo
rati
on
Re
po
rtin
g
curr
en
cy S
ha
re
cap
ita
l R
ese
rve
s T
ota
l ass
ets
To
tal
lia
bil
itie
s In
ve
stm
en
ts
Tu
rno
ve
r
Pro
fi t
be
fore
tax
ati
on
Pro
vis
ion
for
tax
ati
on
Pro
fi t
aft
er
tax
ati
on
Pro
po
sed
div
ide
nd
24
Ge
ne
ral C
he
mic
al C
anad
a
Ho
ldin
g In
c.
Can
ada
CA
D
@ -
-
-
-
-
-
-
-
-
25
GC
SAP
Can
ada
Inc.
Can
ada
CA
D@
-
-
-
-
-
-
-
-
-
26
Tata
Ch
em
ical
s (S
od
a A
sh)
Par
tne
rs H
old
ing
s
Un
ite
d S
tate
s o
f
Am
eri
ca
USD
-
(65
6.9
9)
(65
4.0
6)
2.9
3
-
-
(0.3
9)
-
(0.3
9)
-
27
TCSA
P L
LCU
nit
ed
Sta
tes
of
Am
eri
ca
USD
-
(23
.20
)(2
3.2
0)
-
-
-
-
-
-
-
28
Bio
En
erg
y V
en
ture
-1
(Mau
riti
us)
Pvt
. Lim
ite
d
Mau
riti
us
USD
4,3
64
.23
3
5.9
7
4,4
00
.37
0
.18
3
,79
0.2
5
-
12
.10
0
.36
1
1.7
4
-
29
Gro
wn
En
erg
y Z
amb
eze
Ho
ldin
gs
Pvt
. Lim
ite
d
Mau
riti
us
USD
76
.50
(0
.99
)7
5.6
8
0.1
7
75
.36
-
(0
.22
) -
(0
.22
) -
30
Gro
wn
En
erg
y (P
ty)
Lim
ite
dSo
uth
Afr
ica
ZA
R *
(*)
*
-
* -
-
-
-
-
31
Gro
wn
En
erg
y Z
amb
eze
Lim
itad
a
Mo
zam
biq
ue
MZ
N
0.3
6
(40
.64
) 3
5.7
5
76
.02
-
-
(12
.95
) -
(1
2.9
5)
32
Ral
lis In
dia
Lim
ite
dIn
dia
INR
19
.45
6
93
.80
1
,13
6.5
4
42
3.2
9
21
8.7
8
1,5
10
.24
2
09
.04
6
2.6
8
14
6.3
6
54
.60
33
Ral
lis C
he
mis
try
Exp
ort
s
Lim
ite
d
Ind
iaIN
R
0.0
5
(0.2
0)
0.0
4
0.1
9
-
-
(0.0
4)
-
(0.0
4)
-
34
Me
tah
elix
Life
Sci
en
ces
Lim
ite
dIn
dia
INR
0.1
1
16
.28
1
64
.42
1
48
.03
-
2
24
.81
9
.22
-
9
.22
-
35
Ze
ro W
aste
Ag
ro O
rgan
ics
Lim
ite
d #
Ind
iaIN
R
0.0
7
14
.80
1
6.1
5
1.2
8
-
8.0
9
(3.0
2)
(0.9
5)
(2.0
7)
-
36
Bri
tish
Sal
t Li
mit
ed
Un
ite
d K
ing
do
mG
BP
*
38
3.2
8
1,2
21
.40
8
38
.12
7
.65
4
22
.67
8
1.9
2
(3.2
7)
85
.19
-
37
Ch
esh
ire
Sal
t H
old
ing
s Li
mit
ed
Un
ite
d K
ing
do
mG
BP
1.4
0(1
.38
) 0
.02
-
-
-
-
-
-
-
38
Ch
esh
ire
Sal
t Li
mit
ed
Un
ite
d K
ing
do
mG
BP
*
20
6.8
4
83
3.8
8
62
7.0
5
* -
1
0.8
8
1.8
3
9.0
5
-
39
Bri
ne
fi e
ld S
tora
ge
Lim
ite
dU
nit
ed
Kin
gd
om
GB
P0
.01
(0
.07
) -
0
.06
-
-
-
-
-
-
40
Ch
esh
ire
Cav
ity
Sto
rag
e 2
Lim
ite
d
Un
ite
d K
ing
do
mG
BP
* -
*
-
-
-
-
-
-
-
41
Ch
esh
ire
Co
mp
ress
or
Lim
ite
dU
nit
ed
Kin
gd
om
GB
P *
-
* -
-
-
-
-
-
-
42
Iris
h F
ee
ds
Lim
ite
dU
nit
ed
Kin
gd
om
GB
P *
-
* -
-
-
-
-
-
-
43
Ne
w C
he
shir
e S
alt
Wo
rks
Lim
ite
d
Un
ite
d K
ing
do
mG
BP
7.6
0
10
.12
17
.72
-
-
-
--
- -
No
tes:
1.
The
fi n
anci
al s
tate
me
nts
of
sub
sid
iari
es
are
co
nve
rte
d in
to In
dia
n r
up
ee
s o
n t
he
bas
is o
f e
xch
ang
e r
ate
as
on
clo
sin
g d
ay o
f th
e fi
nan
cial
ye
ar.
2.
# Tu
rno
ver,
pro
fi t/
(loss
) be
fore
tax
atio
n, p
rovi
sio
n fo
r ta
xati
on
an
d p
rofi
t/(lo
ss) a
fte
r ta
x sh
ow
n a
bo
ve is
for
the
pe
rio
d 0
1/0
4/2
01
2 t
o 3
1/0
3/2
01
3. H
ow
eve
r sa
me
is c
on
sid
ere
d o
n a
pro
po
rtio
nat
e b
asis
for
the
pu
rpo
ses
of
con
solid
atio
n f
rom
th
e d
ate
of
acq
uis
itio
n b
ase
d o
n t
he
Co
nso
lidat
ed
Fin
anci
al S
tate
me
nts
of
Ze
ro W
aste
Ag
ro O
rgan
ics
Pri
vate
Lim
ite
d.
3.
@ S
har
es
issu
ed
wit
h n
o p
ar v
alu
e.
4.
$ P
artn
er’s
cap
ital
incl
ud
ed
as
rese
rve
s.
5.
Ast
eri
sk (
*) d
en
ote
s fi
gu
res
be
low
` 5
0,0
00
.
Fo
r th
e y
ea
r e
nd
ed
Ma
rch
31
, 20
14
Su
mm
ary
of
Fin
an
cia
l In
form
ati
on
of
Su
bsi
dia
ry C
om
pa
nie
s u
nd
er
Se
ctio
n 2
12
(co
ntd
.)
(` in
cro
re)
128 TATA CHEMICALS LIMITED
75th ANNUAL REPORT 2013-14
INDEPENDENT AUDITORS’ REPORT
To The Board of Directors of
TATA CHEMICALS LIMITED
Report on the Consolidated Financial Statements
We have audited the accompanying consolidated fi nancial
statements of TATA CHEMICALS LIMITED (the “Company”), its
subsidiaries and jointly controlled entities (the Company, its
subsidiaries and jointly controlled entities constitute the ”Group”),
which comprise the Consolidated Balance Sheet as at 31st
March, 2014, the Consolidated Statement of Profi t and Loss and
the Consolidated Cash Flow Statement for the year then ended,
and a summary of the signifi cant accounting policies and other
explanatory information.
Management’s Responsibility for the Consolidated Financial
Statements
The Company’s Management is responsible for the preparation
of these consolidated fi nancial statements that give a true and
fair view of the consolidated fi nancial position, consolidated
fi nancial performance and consolidated cash fl ows of the Group
in accordance with the accounting principles generally accepted
in India. This responsibility includes the design, implementation
and maintenance of internal control relevant to the preparation
and presentation of the consolidated fi nancial statements that
give a true and fair view and are free from material misstatement,
whether due to fraud or error.
Auditors’ Responsibility
Our responsibility is to express an opinion on these consolidated
fi nancial statements based on our audit. We conducted our
audit in accordance with the Standards on Auditing issued by
the Institute of Chartered Accountants of India. Those Standards
require that we comply with ethical requirements and plan and
perform the audit to obtain reasonable assurance about whether
the consolidated fi nancial statements are free from material
misstatement.
An audit involves performing procedures to obtain audit evidence
about the amounts and the disclosures in the consolidated
fi nancial statements. The procedures selected depend on the
auditor’s judgment, including the assessment of the risks of
material misstatement of the consolidated fi nancial statements,
whether due to fraud or error. In making those risk assessments,
the auditor considers internal control relevant to the Company’s
preparation and presentation of the consolidated fi nancial
statements that give a true and fair view in order to design audit
procedures that are appropriate in the circumstances, but not
for the purpose of expressing an opinion on the eff ectiveness
of the Company’s internal control. An audit also includes
evaluating the appropriateness of the accounting policies used
and the reasonableness of the accounting estimates made by the
Management, as well as evaluating the overall presentation of the
consolidated fi nancial statements.
We believe that the audit evidence we have obtained is suffi cient
and appropriate to provide a basis for our audit opinion.
Opinion
In our opinion and to the best of our information and according
to the explanations given to us, and based on the consideration
of the reports of the other auditors on the fi nancial statements /
fi nancial information of the subsidiaries and jointly controlled
entities and based on the consideration of fi nancial information
of an associate based on management accounts referred to
below in the Other Matter paragraph, the aforesaid consolidated
fi nancial statements give a true and fair view in conformity with
the accounting principles generally accepted in India:
(a) in the case of the Consolidated Balance Sheet, of the state
of aff airs of the Group as at 31st March, 2014;
(b) in the case of the Consolidated Statement of Profi t and
Loss, of the loss of the Group for the year ended on that
date; and
(c) in the case of the Consolidated Cash Flow Statement, of
the cash fl ows of the Group for the year ended on that
date.
Emphasis of Matter
We draw attention to Note 29(iv)(d) to the Consolidated fi nancial
statements which describes accounting of actuarial gains and
losses on employee pension funds of overseas subsidiaries in
“Reserves and Surplus” in accordance with the generally accepted
accounting principles applicable in the country of incorporation
for the reasons stated therein, as against such gains and losses
being accounted in the Consolidated Statement of Profi t and
Loss as per the generally accepted accounting principles in India.
Had the Group followed the practice of recognising such gains
and losses in the Consolidated Statement of Profi t and Loss, the
Consolidated Net Loss before tax and Consolidated Net Loss after
tax after the minority interest of the Group for the year ended
129
CORPORATE OVERVIEW FINANCIAL STATEMENTSSTATUTORY REPORTS
31st March, 2014 would have been higher by ` 140.95 crore and
` 77.36 crore respectively.
Our opinion is not qualifi ed in respect of this matter.
Other Matter
We did not audit the fi nancial statements / fi nancial information of
thirty one subsidiaries and four jointly controlled entities, whose
fi nancial statements / fi nancial information refl ect total assets of
` 3,197.82 crore as at 31st March, 2014, total revenues of ̀ 2,825.51
crore and net cash fl ows amounting to ` 114.93 crore for the year
ended on that date, as considered in the consolidated fi nancial
statements. These fi nancial statements / fi nancial information
have been audited by other auditors whose reports have been
furnished to us by the Management and our opinion, in so far as
it relates to the amounts and disclosures included in respect of
these subsidiaries and jointly controlled entities, is based solely on
the reports of the other auditors.
The consolidated fi nancial information also includes the Group’s
share of net loss of ` 3.33 crore for the year ended 31st March,
2014, as considered in the consolidated fi nancial statements, in
respect of an associate, whose fi nancial information is based on
the management accounts.
Our opinion is not qualifi ed in respect of this matter.
For DELOITTE HASKINS & SELLS LLP
Chartered Accountants
(Firm’s Registration No. 117366W / W-100018)
Sanjiv V. Pilgaonkar
(Partner)
(Membership No. 039826)
MUMBAI, 30th May, 2014
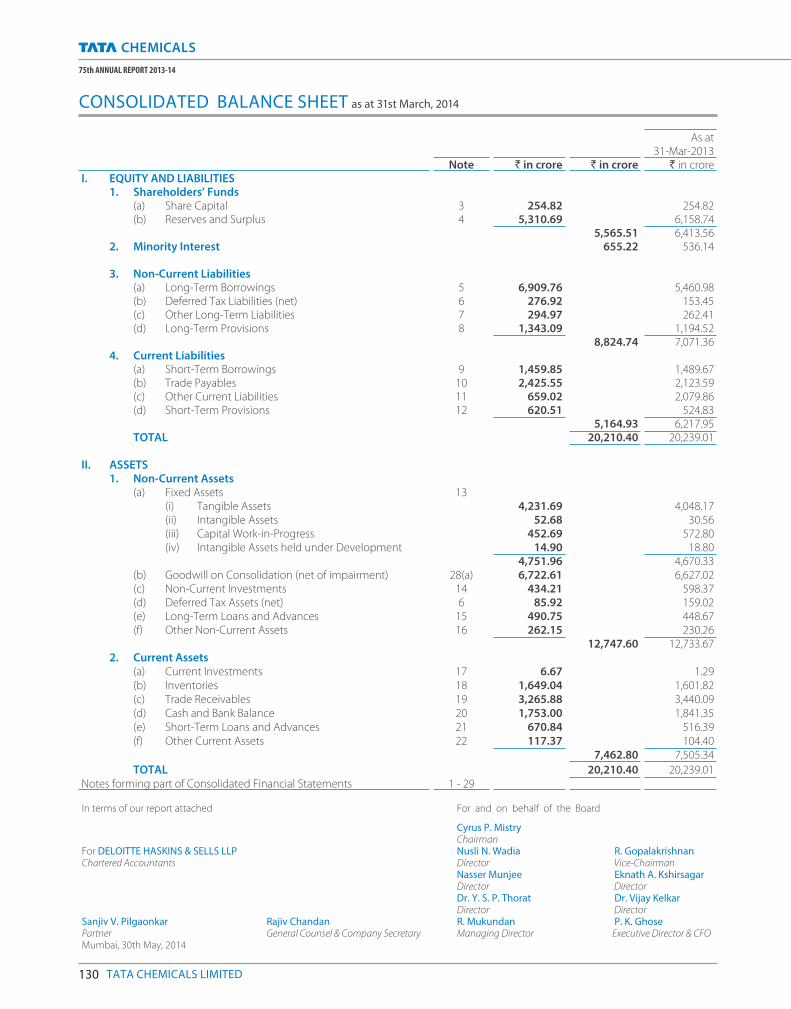
130 TATA CHEMICALS LIMITED
75th ANNUAL REPORT 2013-14
As at 31-Mar-2013
Note ` in crore ` in crore ` in croreI. EQUITY AND LIABILITIES
1. Shareholders’ Funds(a) Share Capital 3 254.82 254.82 (b) Reserves and Surplus 4 5,310.69 6,158.74
5,565.51 6,413.56 2. Minority Interest 655.22 536.14
3. Non-Current Liabilities(a) Long-Term Borrowings 5 6,909.76 5,460.98 (b) Deferred Tax Liabilities (net) 6 276.92 153.45 (c) Other Long-Term Liabilities 7 294.97 262.41 (d) Long-Term Provisions 8 1,343.09 1,194.52
8,824.74 7,071.36 4. Current Liabilities
(a) Short-Term Borrowings 9 1,459.85 1,489.67 (b) Trade Payables 10 2,425.55 2,123.59 (c) Other Current Liabilities 11 659.02 2,079.86 (d) Short-Term Provisions 12 620.51 524.83
5,164.93 6,217.95 TOTAL 20,210.40 20,239.01
II. ASSETS1. Non-Current Assets
(a) Fixed Assets 13 (i) Tangible Assets 4,231.69 4,048.17 (ii) Intangible Assets 52.68 30.56 (iii) Capital Work-in-Progress 452.69 572.80 (iv) Intangible Assets held under Development 14.90 18.80
4,751.96 4,670.33 (b) Goodwill on Consolidation (net of impairment) 28(a) 6,722.61 6,627.02 (c) Non-Current Investments 14 434.21 598.37 (d) Deferred Tax Assets (net) 6 85.92 159.02 (e) Long-Term Loans and Advances 15 490.75 448.67 (f) Other Non-Current Assets 16 262.15 230.26
12,747.60 12,733.67 2. Current Assets
(a) Current Investments 17 6.67 1.29 (b) Inventories 18 1,649.04 1,601.82 (c) Trade Receivables 19 3,265.88 3,440.09 (d) Cash and Bank Balance 20 1,753.00 1,841.35 (e) Short-Term Loans and Advances 21 670.84 516.39 (f) Other Current Assets 22 117.37 104.40
7,462.80 7,505.34
TOTAL 20,210.40 20,239.01 Notes forming part of Consolidated Financial Statements 1 - 29
In terms of our report attached For and on behalf of the Board
Cyrus P. Mistry Chairman
For DELOITTE HASKINS & SELLS LLP Nusli N. Wadia R. Gopalakrishnan Chartered Accountants Director Vice-Chairman
Nasser Munjee Eknath A. Kshirsagar Director Director Dr. Y. S. P. Thorat Dr. Vijay Kelkar Director Director
Sanjiv V. Pilgaonkar Rajiv Chandan R. Mukundan P. K. Ghose Partner General Counsel & Company Secretary Managing Director Executive Director & CFO Mumbai, 30th May, 2014
CONSOLIDATED BALANCE SHEET as at 31st March, 2014
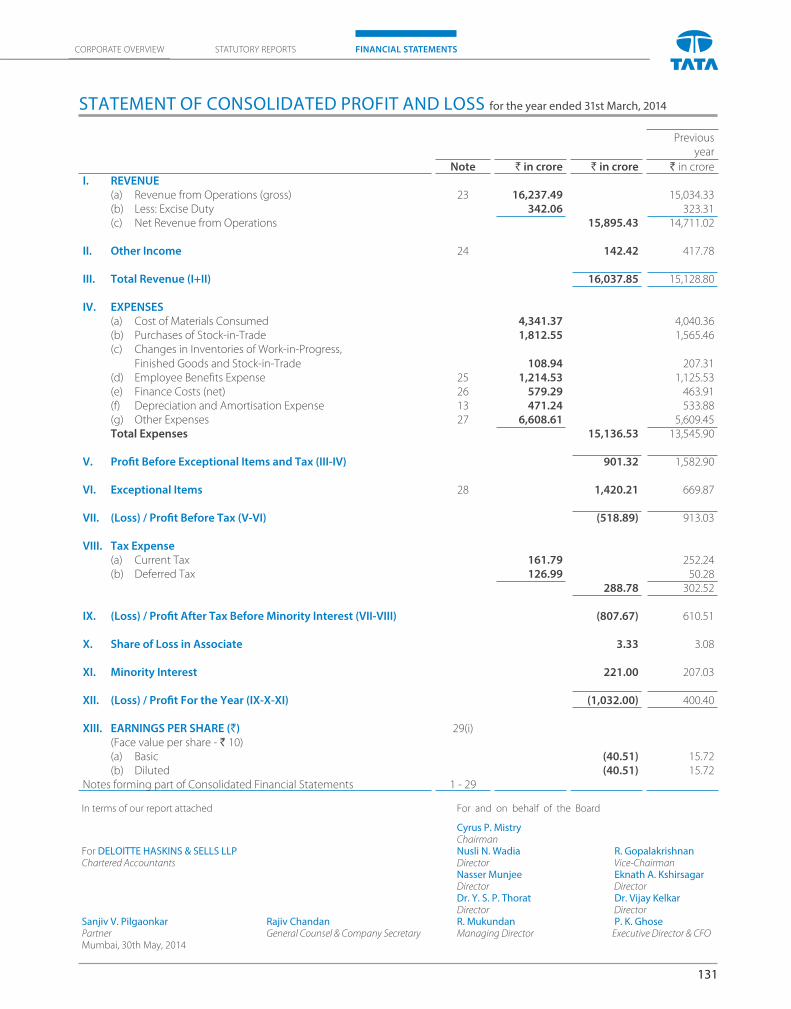
131
CORPORATE OVERVIEW FINANCIAL STATEMENTSSTATUTORY REPORTS
In terms of our report attached For and on behalf of the Board
Cyrus P. Mistry Chairman
For DELOITTE HASKINS & SELLS LLP Nusli N. Wadia R. Gopalakrishnan Chartered Accountants Director Vice-Chairman
Nasser Munjee Eknath A. Kshirsagar Director Director Dr. Y. S. P. Thorat Dr. Vijay Kelkar Director Director
Sanjiv V. Pilgaonkar Rajiv Chandan R. Mukundan P. K. Ghose Partner General Counsel & Company Secretary Managing Director Executive Director & CFO Mumbai, 30th May, 2014
Previous year
Note ` in crore ` in crore ` in croreI. REVENUE
(a) Revenue from Operations (gross) 23 16,237.49 15,034.33 (b) Less: Excise Duty 342.06 323.31 (c) Net Revenue from Operations 15,895.43 14,711.02
II. Other Income 24 142.42 417.78
III. Total Revenue (I+II) 16,037.85 15,128.80
IV. EXPENSES(a) Cost of Materials Consumed 4,341.37 4,040.36 (b) Purchases of Stock-in-Trade 1,812.55 1,565.46 (c) Changes in Inventories of Work-in-Progress,
Finished Goods and Stock-in-Trade 108.94 207.31 (d) Employee Benefi ts Expense 25 1,214.53 1,125.53 (e) Finance Costs (net) 26 579.29 463.91 (f) Depreciation and Amortisation Expense 13 471.24 533.88 (g) Other Expenses 27 6,608.61 5,609.45 Total Expenses 15,136.53 13,545.90
V. Profi t Before Exceptional Items and Tax (III-IV) 901.32 1,582.90
VI. Exceptional Items 28 1,420.21 669.87
VII. (Loss) / Profi t Before Tax (V-VI) (518.89) 913.03
VIII. Tax Expense(a) Current Tax 161.79 252.24 (b) Deferred Tax 126.99 50.28
288.78 302.52
IX. (Loss) / Profi t After Tax Before Minority Interest (VII-VIII) (807.67) 610.51
X. Share of Loss in Associate 3.33 3.08
XI. Minority Interest 221.00 207.03
XII. (Loss) / Profi t For the Year (IX-X-XI) (1,032.00) 400.40
XIII. EARNINGS PER SHARE (`) 29(i)(Face value per share - ` 10)(a) Basic (40.51) 15.72 (b) Diluted (40.51) 15.72
Notes forming part of Consolidated Financial Statements 1 - 29
STATEMENT OF CONSOLIDATED PROFIT AND LOSS for the year ended 31st March, 2014
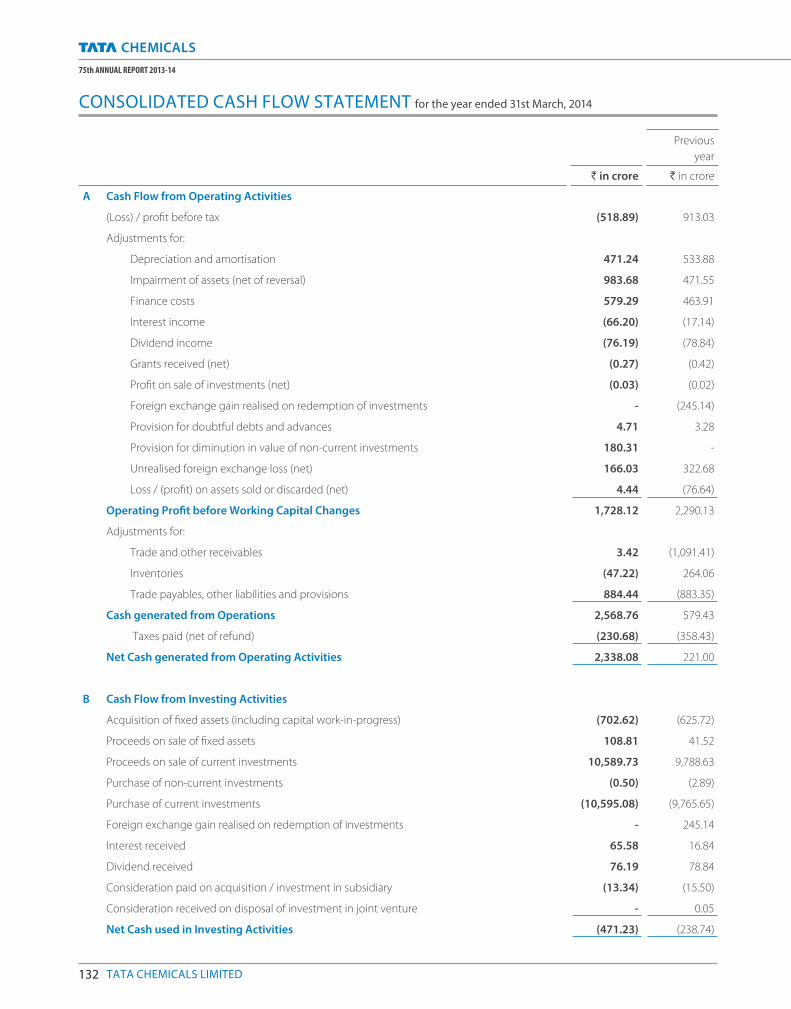
132 TATA CHEMICALS LIMITED
75th ANNUAL REPORT 2013-14
Previous
year
` in crore ` in crore
A Cash Flow from Operating Activities
(Loss) / profi t before tax (518.89) 913.03
Adjustments for:
Depreciation and amortisation 471.24 533.88
Impairment of assets (net of reversal) 983.68 471.55
Finance costs 579.29 463.91
Interest income (66.20) (17.14)
Dividend income (76.19) (78.84)
Grants received (net) (0.27) (0.42)
Profi t on sale of investments (net) (0.03) (0.02)
Foreign exchange gain realised on redemption of investments - (245.14)
Provision for doubtful debts and advances 4.71 3.28
Provision for diminution in value of non-current investments 180.31 -
Unrealised foreign exchange loss (net) 166.03 322.68
Loss / (profi t) on assets sold or discarded (net) 4.44 (76.64)
Operating Profi t before Working Capital Changes 1,728.12 2,290.13
Adjustments for:
Trade and other receivables 3.42 (1,091.41)
Inventories (47.22) 264.06
Trade payables, other liabilities and provisions 884.44 (883.35)
Cash generated from Operations 2,568.76 579.43
Taxes paid (net of refund) (230.68) (358.43)
Net Cash generated from Operating Activities 2,338.08 221.00
B Cash Flow from Investing Activities
Acquisition of fi xed assets (including capital work-in-progress) (702.62) (625.72)
Proceeds on sale of fi xed assets 108.81 41.52
Proceeds on sale of current investments 10,589.73 9,788.63
Purchase of non-current investments (0.50) (2.89)
Purchase of current investments (10,595.08) (9,765.65)
Foreign exchange gain realised on redemption of investments - 245.14
Interest received 65.58 16.84
Dividend received 76.19 78.84
Consideration paid on acquisition / investment in subsidiary (13.34) (15.50)
Consideration received on disposal of investment in joint venture - 0.05
Net Cash used in Investing Activities (471.23) (238.74)
CONSOLIDATED CASH FLOW STATEMENT for the year ended 31st March, 2014
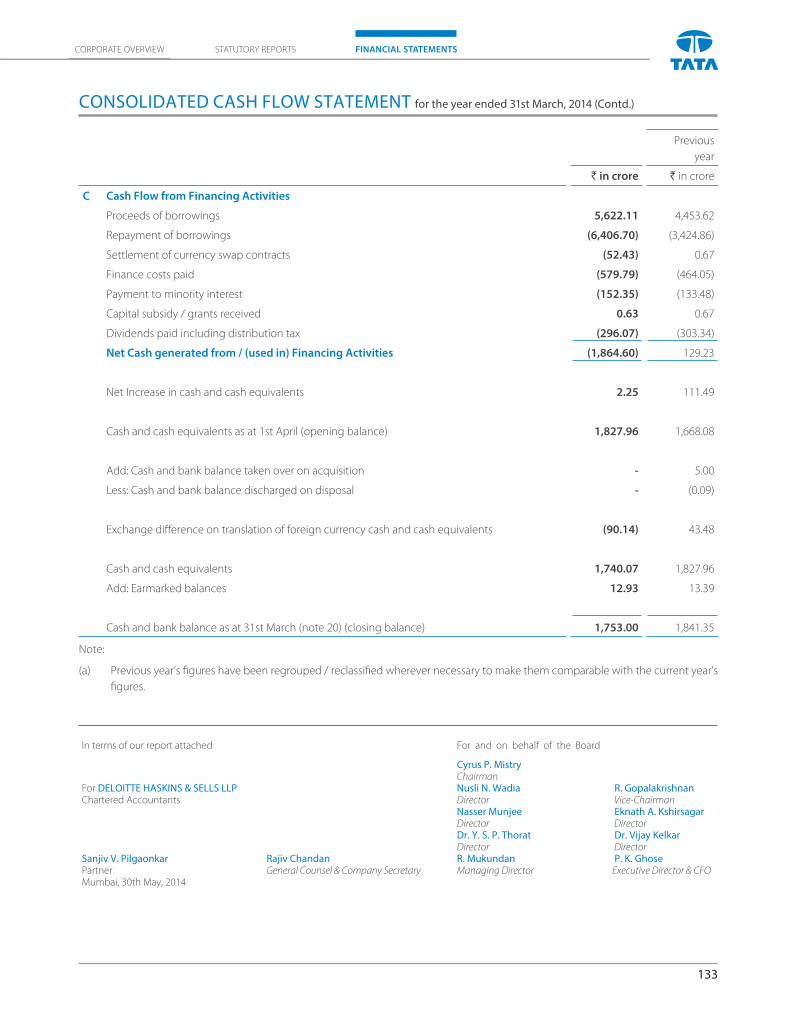
133
CORPORATE OVERVIEW FINANCIAL STATEMENTSSTATUTORY REPORTS
Previous
year
` in crore ` in crore
C Cash Flow from Financing Activities
Proceeds of borrowings 5,622.11 4,453.62
Repayment of borrowings (6,406.70) (3,424.86)
Settlement of currency swap contracts (52.43) 0.67
Finance costs paid (579.79) (464.05)
Payment to minority interest (152.35) (133.48)
Capital subsidy / grants received 0.63 0.67
Dividends paid including distribution tax (296.07) (303.34)
Net Cash generated from / (used in) Financing Activities (1,864.60) 129.23
Net Increase in cash and cash equivalents 2.25 111.49
Cash and cash equivalents as at 1st April (opening balance) 1,827.96 1,668.08
Add: Cash and bank balance taken over on acquisition - 5.00
Less: Cash and bank balance discharged on disposal - (0.09)
Exchange diff erence on translation of foreign currency cash and cash equivalents (90.14) 43.48
Cash and cash equivalents 1,740.07 1,827.96
Add: Earmarked balances 12.93 13.39
Cash and bank balance as at 31st March (note 20) (closing balance) 1,753.00 1,841.35
Note:
(a) Previous year’s fi gures have been regrouped / reclassifi ed wherever necessary to make them comparable with the current year’s
fi gures.
In terms of our report attached For and on behalf of the Board
Cyrus P. Mistry Chairman
For DELOITTE HASKINS & SELLS LLP Nusli N. Wadia R. Gopalakrishnan Chartered Accountants Director Vice-Chairman
Nasser Munjee Eknath A. Kshirsagar Director Director Dr. Y. S. P. Thorat Dr. Vijay Kelkar Director Director
Sanjiv V. Pilgaonkar Rajiv Chandan R. Mukundan P. K. Ghose Partner General Counsel & Company Secretary Managing Director Executive Director & CFO Mumbai, 30th May, 2014
CONSOLIDATED CASH FLOW STATEMENT for the year ended 31st March, 2014 (Contd.)
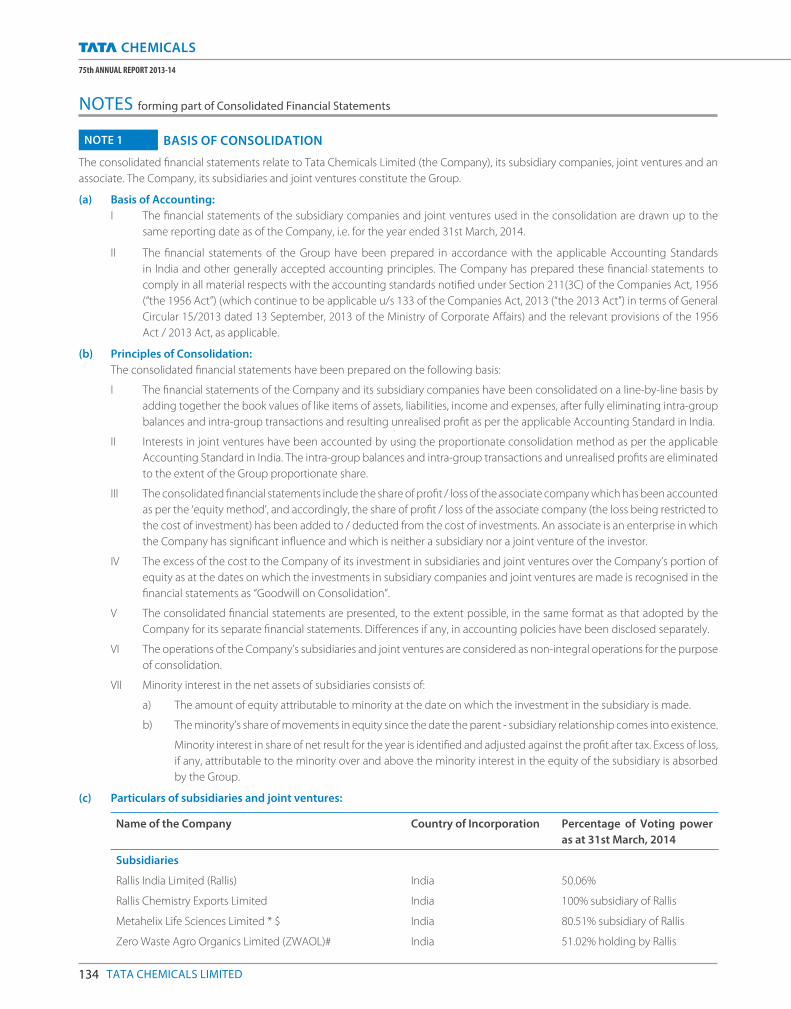
134 TATA CHEMICALS LIMITED
75th ANNUAL REPORT 2013-14
NOTE 1 BASIS OF CONSOLIDATION
The consolidated fi nancial statements relate to Tata Chemicals Limited (the Company), its subsidiary companies, joint ventures and an
associate. The Company, its subsidiaries and joint ventures constitute the Group.
(a) Basis of Accounting:
I The fi nancial statements of the subsidiary companies and joint ventures used in the consolidation are drawn up to the
same reporting date as of the Company, i.e. for the year ended 31st March, 2014.
II The fi nancial statements of the Group have been prepared in accordance with the applicable Accounting Standards
in India and other generally accepted accounting principles. The Company has prepared these fi nancial statements to
comply in all material respects with the accounting standards notifi ed under Section 211(3C) of the Companies Act, 1956
(“the 1956 Act”) (which continue to be applicable u/s 133 of the Companies Act, 2013 (“the 2013 Act”) in terms of General
Circular 15/2013 dated 13 September, 2013 of the Ministry of Corporate Aff airs) and the relevant provisions of the 1956
Act / 2013 Act, as applicable.
(b) Principles of Consolidation:
The consolidated fi nancial statements have been prepared on the following basis:
I The fi nancial statements of the Company and its subsidiary companies have been consolidated on a line-by-line basis by
adding together the book values of like items of assets, liabilities, income and expenses, after fully eliminating intra-group
balances and intra-group transactions and resulting unrealised profi t as per the applicable Accounting Standard in India.
II Interests in joint ventures have been accounted by using the proportionate consolidation method as per the applicable
Accounting Standard in India. The intra-group balances and intra-group transactions and unrealised profi ts are eliminated
to the extent of the Group proportionate share.
III The consolidated fi nancial statements include the share of profi t / loss of the associate company which has been accounted
as per the ‘equity method’, and accordingly, the share of profi t / loss of the associate company (the loss being restricted to
the cost of investment) has been added to / deducted from the cost of investments. An associate is an enterprise in which
the Company has signifi cant infl uence and which is neither a subsidiary nor a joint venture of the investor.
IV The excess of the cost to the Company of its investment in subsidiaries and joint ventures over the Company’s portion of
equity as at the dates on which the investments in subsidiary companies and joint ventures are made is recognised in the
fi nancial statements as “Goodwill on Consolidation”.
V The consolidated fi nancial statements are presented, to the extent possible, in the same format as that adopted by the
Company for its separate fi nancial statements. Diff erences if any, in accounting policies have been disclosed separately.
VI The operations of the Company’s subsidiaries and joint ventures are considered as non-integral operations for the purpose
of consolidation.
VII Minority interest in the net assets of subsidiaries consists of:
a) The amount of equity attributable to minority at the date on which the investment in the subsidiary is made.
b) The minority’s share of movements in equity since the date the parent - subsidiary relationship comes into existence.
Minority interest in share of net result for the year is identifi ed and adjusted against the profi t after tax. Excess of loss,
if any, attributable to the minority over and above the minority interest in the equity of the subsidiary is absorbed
by the Group.
(c) Particulars of subsidiaries and joint ventures:
Name of the Company Country of Incorporation Percentage of Voting power
as at 31st March, 2014
Subsidiaries
Rallis India Limited (Rallis) India 50.06%
Rallis Chemistry Exports Limited India 100% subsidiary of Rallis
Metahelix Life Sciences Limited * $ India 80.51% subsidiary of Rallis
Zero Waste Agro Organics Limited (ZWAOL)# India 51.02% holding by Rallis
NOTES forming part of Consolidated Financial Statements
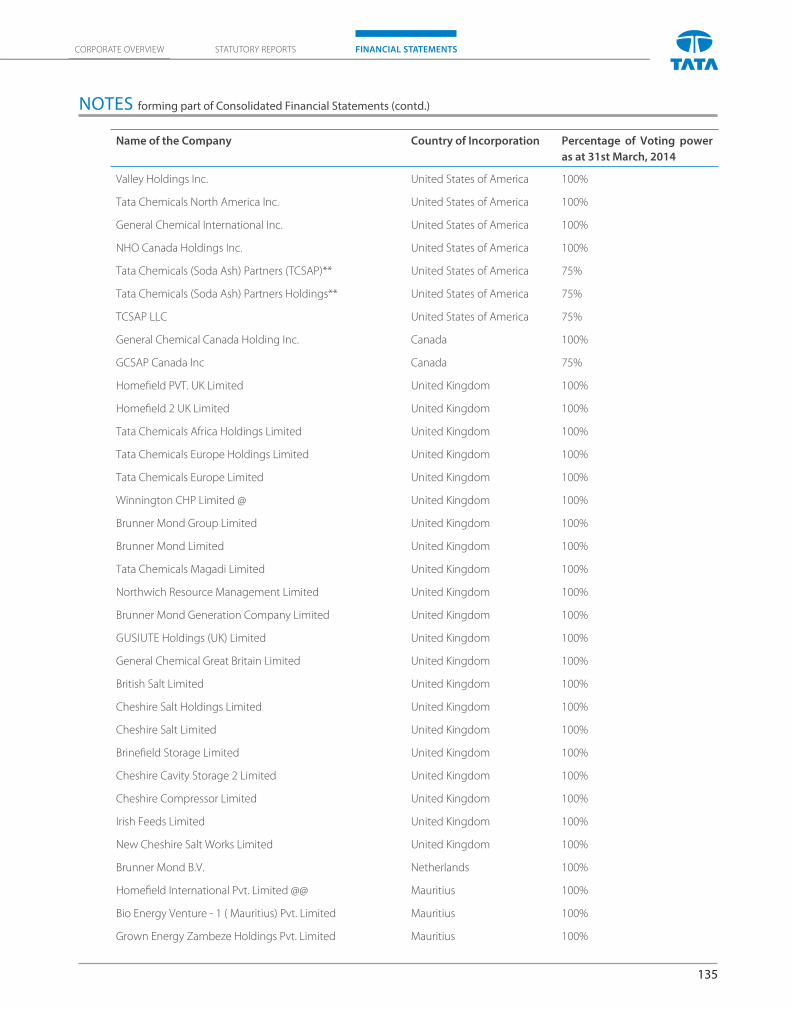
135
CORPORATE OVERVIEW FINANCIAL STATEMENTSSTATUTORY REPORTS
Name of the Company Country of Incorporation Percentage of Voting power
as at 31st March, 2014
Valley Holdings Inc. United States of America 100%
Tata Chemicals North America Inc. United States of America 100%
General Chemical International Inc. United States of America 100%
NHO Canada Holdings Inc. United States of America 100%
Tata Chemicals (Soda Ash) Partners (TCSAP)** United States of America 75%
Tata Chemicals (Soda Ash) Partners Holdings** United States of America 75%
TCSAP LLC United States of America 75%
General Chemical Canada Holding Inc. Canada 100%
GCSAP Canada Inc Canada 75%
Homefi eld PVT. UK Limited United Kingdom 100%
Homefi eld 2 UK Limited United Kingdom 100%
Tata Chemicals Africa Holdings Limited United Kingdom 100%
Tata Chemicals Europe Holdings Limited United Kingdom 100%
Tata Chemicals Europe Limited United Kingdom 100%
Winnington CHP Limited @ United Kingdom 100%
Brunner Mond Group Limited United Kingdom 100%
Brunner Mond Limited United Kingdom 100%
Tata Chemicals Magadi Limited United Kingdom 100%
Northwich Resource Management Limited United Kingdom 100%
Brunner Mond Generation Company Limited United Kingdom 100%
GUSIUTE Holdings (UK) Limited United Kingdom 100%
General Chemical Great Britain Limited United Kingdom 100%
British Salt Limited United Kingdom 100%
Cheshire Salt Holdings Limited United Kingdom 100%
Cheshire Salt Limited United Kingdom 100%
Brinefi eld Storage Limited United Kingdom 100%
Cheshire Cavity Storage 2 Limited United Kingdom 100%
Cheshire Compressor Limited United Kingdom 100%
Irish Feeds Limited United Kingdom 100%
New Cheshire Salt Works Limited United Kingdom 100%
Brunner Mond B.V. Netherlands 100%
Homefi eld International Pvt. Limited @@ Mauritius 100%
Bio Energy Venture - 1 ( Mauritius) Pvt. Limited Mauritius 100%
Grown Energy Zambeze Holdings Pvt. Limited Mauritius 100%
NOTES forming part of Consolidated Financial Statements (contd.)
136 TATA CHEMICALS LIMITED
75th ANNUAL REPORT 2013-14
Name of the Company Country of Incorporation Percentage of Voting power
as at 31st March, 2014
Tata Chemicals International Pte. Limited Singapore 100%
Tata Chemicals South Africa (Proprietary) Limited South Africa 100%
Grown Energy (Pty) Limited South Africa 100%
Magadi Railway Company Limited Kenya 100%
Grown Energy Zambeze Limitada Mozambique 95%
* During the year Rallis has acquired additional equity shares, consequent to which share has increased to 80.51% from
77.02% in previous year.
# Rallis has acquired additional equity shares, consequent to which share has increased to 51.02% from 22.81% in ZWAOL during the year.
@ Winnington CHP Limited has been incorporated as a wholly owned subsidiary of Tata Chemicals Europe Limited during the year.
@@ Homefi eld International Pvt. Limited, Mauritius, wholly owned subsidiary of the Company, has been merged with the Company
w.e.f. 1st April, 2013 vide court order dated 7th March, 2014.
$ Dhaanya Seeds Limited, a wholly owned subsidiary of Metahelix has been amalgamated with Metahelix pursuant to necessary approvals
eff ective from 1st April, 2013.
** a general partnership formed under the laws of the State of Delaware (USA)
Joint Ventures
Alcad United States of America 50% is holding by TCSA
The Block Salt Company Limited United Kingdom New Cheshire Salt Works Limited holds 50%
Kemex B.V. Netherlands 49.99%
JOil (S) Pte. Ltd and its subsidiaries Singapore 33.78%
Indo Maroc Phosphore S. A. Morocco 33.33%
Natronx Technologies LLC United States of America TCSAP holds 33.33%
Khet-Se Agriproduce India Private Limited#
Associate
EPM Mining Ventures Inc. Canada 25.70%
Promoter Group
Tata Sons Limited India Holding more than 20% shares alongwith
its subsidiary
# Khet-Se Agriproduce India Private Limited ceased to be a Joint Venture with eff ect from 26th March, 2013
NOTE 2 SIGNIFICANT ACCOUNTING POLICIES:
(a) Basis of Accounting
The accounts of the Group are prepared under the historical cost convention using the accrual method of accounting.
The fi nancial statements of the Group have been prepared in accordance with generally accepted accounting principles in
India (Indian GAAP) to comply with the Accounting Standards notifi ed under Section 211(3C) of the Companies Act, 1956 (“the
1956 Act”) (which continue to be applicable u/s 133 of the Companies Act, 2013 (“the 2013 Act”) in terms of General Circular
15/2013 dated 13 September, 2013 of the Ministry of Corporate Aff airs) and the relevant provisions of the 1956 Act / 2013 Act, as
applicable. The accounts of the Group are prepared under the historical cost convention using the accrual method of accounting.
The accounting policies adopted in the preparation of fi nancial statements are consistent with those of the previous year.
NOTES forming part of Consolidated Financial Statements (contd.)
137
CORPORATE OVERVIEW FINANCIAL STATEMENTSSTATUTORY REPORTS
(b) Use of Estimates
The presentation of the fi nancial statements in conformity with Indian GAAP requires the Management to make estimates and
assumptions that aff ect the reported amounts of assets and liabilities, revenues and expenses and disclosure of contingent
liabilities. Management believes that the estimates used in the preparation of the fi nancial statements are prudent and reasonable,
future results could diff er, the diff erences between the actual results and the estimates are recognised in the period in which the
results are known / materialise.
(c) Tangible and Intangible Fixed Assets
Tangible fi xed assets are carried at original cost net of taxes / duties, credits availed, if any, less depreciation and impairment loss.
The cost of fi xed assets includes interest on borrowings attributable to acquisition of qualifying fi xed assets up to the date of
commissioning of the assets and other incidental expenses incurred up to that date. Machinery spares whose use is expected to
be irregular are capitalised and depreciated over the useful life of the principal item of asset. Subsequent expenditure relating
to the fi xed assets is capitalised only if such expenditure results in an increase in the future benefi ts from such assets beyond its
previously assessed standard of performance.
Fixed Assets acquired and put to use for projects are capitalised and depreciation thereon is included in project cost till
commissioning of the project.
Fixed Assets retired from active use and held for sale are stated at lower of their net book value and net realisable value and are
disclosed separately in the Consolidated Balance Sheet.
Intangibles assets
Computer software, patents, Intellectual Property Rights (IPR), trademarks, licenses and other intangibles of similar nature are
initially recognised at cost. Intangible assets are amortised using straight line method over their estimated useful lives / period of
contractual rights or ten years whichever is lower and are tested for any impairment.
Biological assets
Biological assets are recognised when the Group controls the asset as a result of past events, it is probable that future
economic benefi ts associated with the asset will fl ow to the enterprise, and the fair value or cost of the asset can be measured
reliably.
In cases whereby the fair value of biological assets cannot be estimated reliably, biological assets are measured at their cost less
any accumulated depreciation and any accumulated impairment losses. Once the fair value of such a biological asset becomes
reliably measurable, the asset is measured at its fair value less estimated point-of-sale costs.
(d) Capital Work-in-Progress
Projects under commissioning and other capital work-in-progress are carried at cost, comprising direct cost, related incidental
expenses and attributable interest (net of impairment).
(e) Depreciation and Amortisation
(i) Depreciation on fi xed assets is provided at the rates determined on straight line method over the useful life estimated
by the Management or on the basis of depreciation rates prescribed under respective domestic laws, whichever is
higher, except for mines, machinery and equipment of a subsidiary, which are depreciated using the units-of-production
method. Approximately 9% of the net block of machinery and equipment of the Group (previous year 7%) and 100% of
the net block of mines and quarries of the Group (previous year 100%) are depreciated using the units-of-production
method.
(ii) Leasehold land is amortised over the duration of the lease.
(iii) Capital assets whose ownership does not vest in the Company are depreciated over their estimated useful life.
(f) Impairment of Tangible and Intangible Fixed Assets
The carrying values of assets / cash generating units at each Balance Sheet date are reviewed for impairment of assets. If any
indication of such impairment exists, the recoverable amount of such assets is estimated and impairment is recognised, if the
carrying amount of these assets exceeds their recoverable amount. The recoverable amount is the greater of the net selling
NOTES forming part of Consolidated Financial Statements (contd.)
138 TATA CHEMICALS LIMITED
75th ANNUAL REPORT 2013-14
price and their value in use. Value in use is arrived at by discounting the future cash fl ows to their present value based on an
appropriate discount factor. When there is indication that an impairment loss recognised for an asset in prior accounting periods
no longer exists or may have decreased, such reversal of impairment loss is recognised in the Consolidated Statement of Profi t
and Loss.
(g) Investments
Long-term investments are carried individually at cost less provision for diminution, other than temporary, in the value of such
investments. Current investments are carried individually, at lower of cost and fair value. Cost of investments includes acquisition
charges such as brokerage, fees and duties.
(h) Inventories
Inventories are valued at the lower of cost on weighted average basis (except two foreign subsidiaries and two JVs which are
on FIFO basis constituting 10% (previous year 10%) of the total inventory value) and net realisable value after providing for
obsolescence and other losses, where considered necessary. Cost includes all charges in bringing the goods to their present
location and condition, including octroi and other levies, transit insurance and receiving charges. Work in process and fi nished
goods include appropriate proportion of overheads and, where applicable, excise duty. Net realisable value is the estimated
selling price in the ordinary course of business, less estimated costs of completion and estimated costs necessary to make the
sale.
(i) Revenue Recognition
Sales of Goods
Sales are recognised, net of returns including estimated returns where applicable, and trade discounts, sales tax and value
added tax, on dispatch of goods to customers. In respect of Urea, sales are recognised based on provisional rates of group
concession as notifi ed under the New Pricing Scheme. Equated freight claims and escalation claims for Urea sales are estimated
by the Management based on the norms prescribed or notifi ed under the said Scheme. In case of complex fertilisers, sales
include price concession, as notifi ed under the Concession Scheme, or as estimated by the Management based on the norms
prescribed.
Income from Services
Revenues from contracts priced on a time and material basis are recognised when services are rendered and related costs are
incurred. Foreseeable losses on such contracts are recognised when probable.
(j) Other Income
Interest income is accounted on accrual basis. Dividend income is accounted for when the right to receive income is
established.
(k) Insurance Claims
Insurance claims are accounted for on the basis of claims admitted / expected to be admitted and to the extent that there is no
uncertainty in receiving the claims.
(l) Research and Development Expenses
Revenue expenditure pertaining to research and development is charged to the Consolidated Statement of Profi t and Loss.
Expenditure on tangible/intangible fi xed assets used in research and development is capitalised.
(m) Leases
Lease arrangements where the risks and rewards incidental to ownership of an asset substantially vest with the lessor are
recognised as operating leases. Lease rentals under operating leases are recognised in the Consolidated Statement of Profi t and
Loss on a straight-line basis.
(n) Debenture Issues Expenses
Debenture issue expenses and redemption premium are adjusted against the Securities Premium Account as permissible under
Section 78(2) of the Companies Act, 1956.
NOTES forming part of Consolidated Financial Statements (contd.)
139
CORPORATE OVERVIEW FINANCIAL STATEMENTSSTATUTORY REPORTS
(o) Employee Benefi ts
(A) In respect of the Company and Indian consolidating entities
Employee benefi ts consist of provident fund, superannuation fund, gratuity fund, compensated absences, long service
awards, post retirement medical benefi ts, directors’ retirement obligations and family benefi t scheme.
(i) Post-employment benefi t plans
Payments to defi ned contribution retirement benefi t schemes for eligible employees in the form of Superannuation
Fund are charged as an expense as they fall due.
For defi ned benefi t schemes in the form of gratuity fund, post retirement medical benefi ts, directors’ pension
liabilities and family benefi t scheme, the cost of providing benefi ts is determined using the Projected Unit Credit
Method, with actuarial valuations being carried out at each Balance Sheet date. Actuarial gains and losses are
recognised in the Consolidated Statement of Profi t and Loss for the period in which they occur. Past service cost
is recognised immediately to the extent that the benefi ts are already vested, and otherwise is amortised on a
straight-line basis over the average period until the benefi ts become vested. The retirement benefi t obligation
recognised in the Consolidated Balance Sheet represents the present value of the defi ned benefi t obligation as
adjusted for unrecognised past service cost and as reduced by the fair value of scheme assets. Any asset resulting
from this calculation is limited to past service cost plus the present value of available refunds and reductions in
future contributions to the schemes.
The Company makes contribution towards provident fund, in substance a defi ned contribution retirement benefi t
plan. The provident fund is administered by the Trustees of the Tata Chemicals Limited Provident Fund. The Rules
of the Company’s Provident Fund administered by a Trust, require that if the Board of Trustees are unable to pay
interest at the rate declared by the Employees’ Provident Fund by the Government under para 60 of the Employees’
Provident Fund Scheme, 1952 for the reason that the return on investment is less or for any other reason, then the
defi ciency shall be made good by the Company. Having regard to the assets of the Fund and the return on the
investments, the Company does not expect any defi ciency as at the year end.
Family Benefi t Scheme is an unfunded defi ned benefi t plan. The benefi ts of the plan accrue to eligible employees
at the time of death or permanent disablement while in service, either as a result of an injury or as certifi ed by the
Company’s Medical Board. The monthly payment to dependents of the deceased / disabled employee under the
plan equals 100% of the last drawn basic salary in case of Management and Offi cer cadre employees and 100% of
the last drawn basic salary plus dearness allowance and fi xed additional dearness allowance for employees in the
workmen category. The Company accounts for the liability for family benefi t scheme payable in future based on an
independent actuarial valuation carried out at each Balance Sheet date.
(ii) Short-term employee benefi ts
The undiscounted amount of short-term employee benefi ts expected to be paid in exchange for the services
rendered by employees is recognised during the period when the employee renders the service. These benefi ts
include compensated absences such as paid annual leave and performance incentives.
The cost of compensated absences is accounted as under:
(a) In case of accumulated compensated absences, when employees render service that increase their
entitlement of future compensated absences; and
(b) In case of non - accumulating compensated absence, when the absences occur.
(iii) Long-term employee benefi ts
Compensated absences which are not expected to occur within twelve months after the end of the period in which
the employee renders the related services are recognised as a liability at the present value of the defi ned benefi t
obligation at the Balance Sheet date. Long Service Awards are recognised as a liability at the present value of the
defi ned benefi t obligation at the Balance Sheet date.
(B) In respect of overseas subsidiaries and joint ventures
The liabilities for employee benefi ts are determined and accounted as per the regulations and principles followed in the
respective countries (note 29 (iv)).
NOTES forming part of Consolidated Financial Statements (contd.)
140 TATA CHEMICALS LIMITED
75th ANNUAL REPORT 2013-14
The actuarial gains and losses on the funds for employee benefi ts (pension plans) of the overseas subsidiaries have been
accounted in “Reserves and Surplus” in the consolidated fi nancial statements in accordance with the generally accepted
accounting principles applicable and followed in the respective country of incorporation instead of the practice followed
under Indian GAAP.
(p) Employee Separation Compensation
(i) Compensation payable to employees who have opted for retirement under “Early Separation Scheme” is amortised over
the period for which benefi t is expected. The liability has been calculated on the basis of net present value of the future
payments of pension.
(ii) Liability under “Early Separation Scheme” is computed and accounted at the net present value.
(iii) Compensation paid / payable to employees who have opted for retirement under Voluntary Retirement Scheme including
ex-gratia is charged to Consolidated Statement of Profi t and Loss in the year of separation.
(q) Finance costs
Costs in connection with the borrowing of funds to the extent not directly related to the acquisition of fi xed assets are amortised
and charged to Consolidated Statement of Profi t and Loss, over the tenure of the loan. Interest on borrowed money, allocated to
and utilised for qualifying fi xed assets, pertaining to the period upto the date of capitalisation is added to the cost of the assets.
Borrowing cost includes interest, amortisation of ancillary costs incurred in connection with the arrangement of borrowings and
exchange diff erences arising from foreign currency borrowings to the extent they are regarded as an adjustment to the interest
cost.
(r) Foreign Currency Transactions and Translation
(i) Foreign currency transactions (other than derivatives) of the Company and its net investment in non-integral foreign
operations are recorded on initial recognition in the reporting currency, using the exchange rate at the date of the
transaction. Foreign currency monetary assets and liabilities (other than derivatives) of the Company and its net investment
in non-integral foreign operations as at the Balance Sheet date are restated at the year end rates and the resultant net
gains or losses are recognised as income or expense in the Consolidated Statement of Profi t and Loss in the year in which
they arise. The exchange diff erences on long term loans to non-integral foreign operations are accumulated in a foreign
currency translation reserve, until disposal / recovery of the net investment.
During the year ended 31st March, 2012, the Company had exercised the option granted vide notifi cation F.No.17/133/2008/
CL-V dated 29th December, 2011 issued by the Ministry of Corporate Aff airs and accordingly, the exchange diff erences
arising on revaluation of long term foreign currency monetary items have been recognised over the shorter of the loan
repayment period and 31st March, 2020. The unamortised balance is presented as “Foreign Currency Monetary Item
Translation Diff erence Account” net of tax eff ect thereon.
(ii) Premium / discount on forward exchange contracts, related to monetary items which are not intended for trading or
speculation purposes, are amortised over the period of the contract.
(s) Derivative Contracts
The Group enters into derivative contracts in the nature of full currency swaps, interest rate swaps, currency options, forward
contracts and commodity hedges with an intention to hedge its existing assets and liabilities, raw material requirements and fi rm
commitments, and highly probable transactions. Derivative contracts which are closely linked to the underlying transaction are
recognised in accordance with the contract terms and accounted as per the policy stated for foreign currency transactions and
translation. All other contracts are marked-to-market and losses are recognised in the Consolidated Statement of Profi t and Loss.
Gains arising on the same are not recognised on grounds of prudence.
(t) Government Grants
Government grants and subsidies are recognised when there is reasonable assurance that the Company will comply with the
conditions attached to them and the grants / subsidy will be received. Government grants whose primary condition is that the
NOTES forming part of Consolidated Financial Statements (contd.)
141
CORPORATE OVERVIEW FINANCIAL STATEMENTSSTATUTORY REPORTS
company should purchase, construct or otherwise acquire capital assets are presented by deducting them from the carrying
value of the assets. The grant is recognised as income over the life of the depreciable assets by way of a reduced depreciation
charge. Other government grants and subsidies are recognised as income over the periods necessary to match them with the
costs which they are intended to compensate on a systematic basis.
(u) Segment Reporting
The Company identifi es primary segments based on the dominant source, nature of risks and returns and the internal organisation.
The operating segments are the segments for which separate fi nancial information is available and for which operating profi t/
loss amounts are evaluated regularly by the executive Management in deciding how to allocate resources and in assessing
performance.
The accounting policies adopted for segment reporting are in line with the accounting policies of the Company. Segment
revenue, segment expenses, segment assets and segment liabilities have been identifi ed to segments on the basis of their
relationship to the operating activities of the segment. Inter Segment revenue is accounted on the basis of transactions which are
primarily determined based on market / fair value factors. Revenue, expenses, assets and liabilities which relate to the Company
as a whole and are not allocable to segments on reasonable basis have been included under “unallocated revenue / expenses /
assets / liabilities”.
(v) Taxes on Income
Current Tax is the amount of tax payable on the taxable income for the year as determined in accordance with the provisions of
the Income Tax Act, 1961, except for the overseas subsidiaries and joint ventures where current tax provision is determined based
on the local tax laws.
Deferred tax is recognised for all timing diff erences, being the diff erences between the taxable income and the accounting
income that originate in one period and are capable of reversal in one or more subsequent periods.
Deferred Tax Assets in respect of unabsorbed depreciation and carry forward of losses are recognised if there is virtual certainty
that there will be suffi cient future taxable income available to realise such losses. Other Deferred Tax Assets are recognised if
there is reasonable certainty that there will be suffi cient future taxable income to realise such assets.
(w) Provisions and Contingencies
A provision is recognised when the Company has a present obligation as a result of past events and it is probable that an outfl ow
of resources will be required to settle the obligation, in respect of which a reliable estimate can be made. Provisions (excluding
retirement benefi ts) are not discounted to their present value and are determined based on best estimate required to settle the
obligation at the Balance Sheet date. These are reviewed at each Balance Sheet date and adjusted to refl ect the current best
estimates.
(x) Goodwill on Consolidation
Goodwill on Consolidation represents the diff erence between the Group’s share in the net worth of the investee company at the
time of acquisition and the cost of investment made. The said goodwill is not amortised; however, it is tested for impairment at
each Balance Sheet date and impairment loss, if any, is provided for.
(y) Cash Flow Statement
Cash fl ows are reported using the indirect method, whereby profi t / (loss) before extraordinary items and tax is adjusted
for the eff ects of transactions of non-cash nature and any deferrals or accruals of past or future cash receipts or payments.
The cash fl ows from operating, investing and fi nancing activities of the Company are segregated based on the available
information.
(z) Cash and Cash Equivalents
Cash comprises cash on hand and demand deposits with banks. Cash equivalents are short-term balances (with an original
maturity of three months or less from the date of acquisition), and highly liquid time deposits that are readily convertible into
known amounts of cash and which are subject to insignifi cant risk of changes in value.
NOTES forming part of Consolidated Financial Statements (contd.)
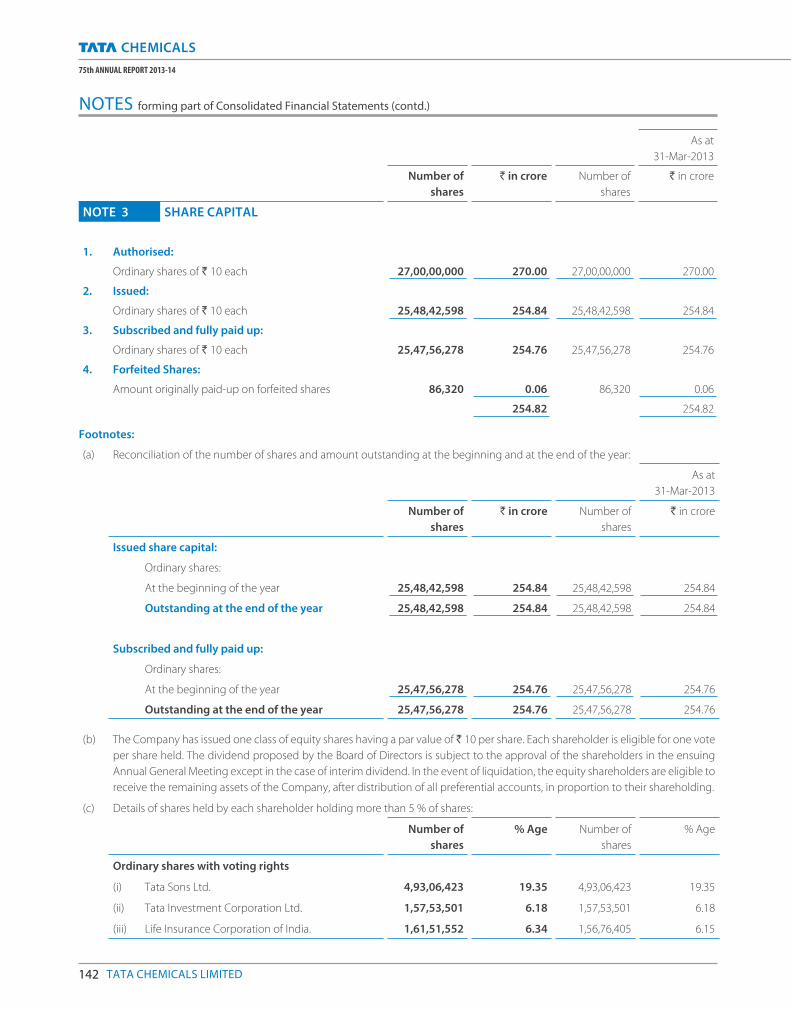
142 TATA CHEMICALS LIMITED
75th ANNUAL REPORT 2013-14
As at
31-Mar-2013
Number of
shares
` in crore Number of
shares
` in crore
NOTE 3 SHARE CAPITAL
1. Authorised:
Ordinary shares of ` 10 each 27,00,00,000 270.00 27,00,00,000 270.00
2. Issued:
Ordinary shares of ` 10 each 25,48,42,598 254.84 25,48,42,598 254.84
3. Subscribed and fully paid up:
Ordinary shares of ` 10 each 25,47,56,278 254.76 25,47,56,278 254.76
4. Forfeited Shares:
Amount originally paid-up on forfeited shares 86,320 0.06 86,320 0.06
254.82 254.82
Footnotes:
(a) Reconciliation of the number of shares and amount outstanding at the beginning and at the end of the year:
As at
31-Mar-2013
Number of
shares
` in crore Number of
shares
` in crore
Issued share capital:
Ordinary shares:
At the beginning of the year 25,48,42,598 254.84 25,48,42,598 254.84
Outstanding at the end of the year 25,48,42,598 254.84 25,48,42,598 254.84
Subscribed and fully paid up:
Ordinary shares:
At the beginning of the year 25,47,56,278 254.76 25,47,56,278 254.76
Outstanding at the end of the year 25,47,56,278 254.76 25,47,56,278 254.76
(b) The Company has issued one class of equity shares having a par value of ` 10 per share. Each shareholder is eligible for one vote
per share held. The dividend proposed by the Board of Directors is subject to the approval of the shareholders in the ensuing
Annual General Meeting except in the case of interim dividend. In the event of liquidation, the equity shareholders are eligible to
receive the remaining assets of the Company, after distribution of all preferential accounts, in proportion to their shareholding.
(c) Details of shares held by each shareholder holding more than 5 % of shares:
Number of
shares
% Age Number of
shares
% Age
Ordinary shares with voting rights
(i) Tata Sons Ltd. 4,93,06,423 19.35 4,93,06,423 19.35
(ii) Tata Investment Corporation Ltd. 1,57,53,501 6.18 1,57,53,501 6.18
(iii) Life Insurance Corporation of India. 1,61,51,552 6.34 1,56,76,405 6.15
NOTES forming part of Consolidated Financial Statements (contd.)
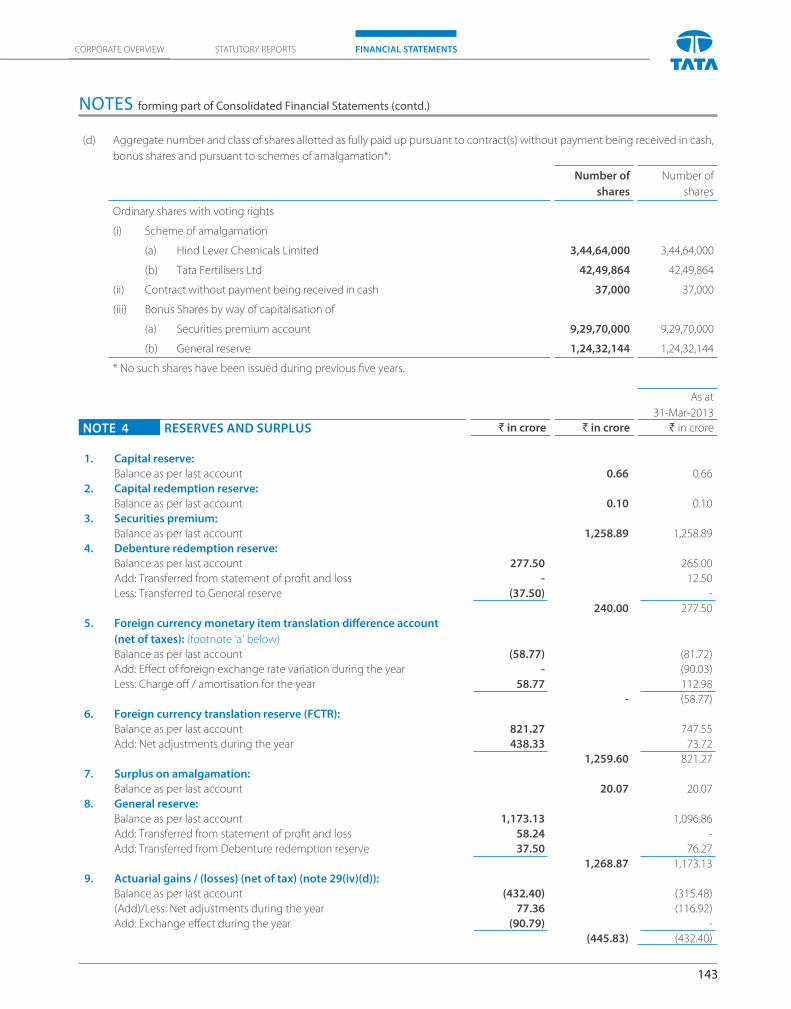
143
CORPORATE OVERVIEW FINANCIAL STATEMENTSSTATUTORY REPORTS
(d) Aggregate number and class of shares allotted as fully paid up pursuant to contract(s) without payment being received in cash,
bonus shares and pursuant to schemes of amalgamation*:
Number of
shares
Number of
shares
Ordinary shares with voting rights
(i) Scheme of amalgamation
(a) Hind Lever Chemicals Limited 3,44,64,000 3,44,64,000
(b) Tata Fertilisers Ltd 42,49,864 42,49,864
(ii) Contract without payment being received in cash 37,000 37,000
(iii) Bonus Shares by way of capitalisation of
(a) Securities premium account 9,29,70,000 9,29,70,000
(b) General reserve 1,24,32,144 1,24,32,144
* No such shares have been issued during previous fi ve years.
As at
31-Mar-2013
NOTE 4 RESERVES AND SURPLUS ` in crore ` in crore ` in crore
1. Capital reserve:
Balance as per last account 0.66 0.66
2. Capital redemption reserve:
Balance as per last account 0.10 0.10
3. Securities premium:
Balance as per last account 1,258.89 1,258.89
4. Debenture redemption reserve:
Balance as per last account 277.50 265.00
Add: Transferred from statement of profi t and loss - 12.50
Less: Transferred to General reserve (37.50) -
240.00 277.50
5. Foreign currency monetary item translation diff erence account
(net of taxes): (footnote ‘a’ below)
Balance as per last account (58.77) (81.72)
Add: Eff ect of foreign exchange rate variation during the year - (90.03)
Less: Charge off / amortisation for the year 58.77 112.98
- (58.77)
6. Foreign currency translation reserve (FCTR):
Balance as per last account 821.27 747.55
Add: Net adjustments during the year 438.33 73.72
1,259.60 821.27
7. Surplus on amalgamation:
Balance as per last account 20.07 20.07
8. General reserve:
Balance as per last account 1,173.13 1,096.86
Add: Transferred from statement of profi t and loss 58.24 -
Add: Transferred from Debenture redemption reserve 37.50 76.27
1,268.87 1,173.13
9. Actuarial gains / (losses) (net of tax) (note 29(iv)(d)):
Balance as per last account (432.40) (315.48)
(Add)/Less: Net adjustments during the year 77.36 (116.92)
Add: Exchange eff ect during the year (90.79) -
(445.83) (432.40)
NOTES forming part of Consolidated Financial Statements (contd.)
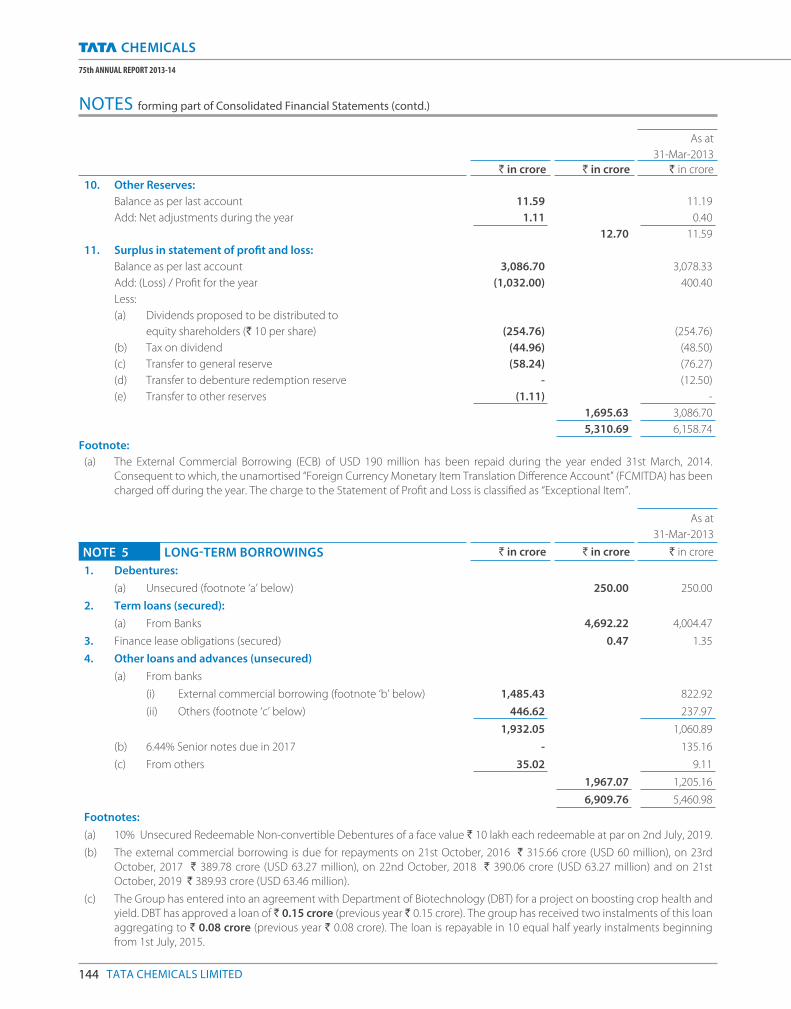
144 TATA CHEMICALS LIMITED
75th ANNUAL REPORT 2013-14
As at
31-Mar-2013
` in crore ` in crore ` in crore
10. Other Reserves:
Balance as per last account 11.59 11.19
Add: Net adjustments during the year 1.11 0.40
12.70 11.59
11. Surplus in statement of profi t and loss:
Balance as per last account 3,086.70 3,078.33
Add: (Loss) / Profi t for the year (1,032.00) 400.40
Less:
(a) Dividends proposed to be distributed to
equity shareholders (` 10 per share) (254.76) (254.76)
(b) Tax on dividend (44.96) (48.50)
(c) Transfer to general reserve (58.24) (76.27)
(d) Transfer to debenture redemption reserve - (12.50)
(e) Transfer to other reserves (1.11) -
1,695.63 3,086.70
5,310.69 6,158.74
Footnote:
(a) The External Commercial Borrowing (ECB) of USD 190 million has been repaid during the year ended 31st March, 2014.
Consequent to which, the unamortised “Foreign Currency Monetary Item Translation Diff erence Account” (FCMITDA) has been
charged off during the year. The charge to the Statement of Profi t and Loss is classifi ed as “Exceptional Item”.
As at
31-Mar-2013
NOTE 5 LONG-TERM BORROWINGS ` in crore ` in crore ` in crore
1. Debentures:
(a) Unsecured (footnote ‘a’ below) 250.00 250.00
2. Term loans (secured):
(a) From Banks 4,692.22 4,004.47
3. Finance lease obligations (secured) 0.47 1.35
4. Other loans and advances (unsecured)
(a) From banks
(i) External commercial borrowing (footnote ‘b’ below) 1,485.43 822.92
(ii) Others (footnote ‘c’ below) 446.62 237.97
1,932.05 1,060.89
(b) 6.44% Senior notes due in 2017 - 135.16
(c) From others 35.02 9.11
1,967.07 1,205.16
6,909.76 5,460.98
Footnotes:
(a) 10% Unsecured Redeemable Non-convertible Debentures of a face value ` 10 lakh each redeemable at par on 2nd July, 2019.
(b) The external commercial borrowing is due for repayments on 21st October, 2016 ` 315.66 crore (USD 60 million), on 23rd
October, 2017 ` 389.78 crore (USD 63.27 million), on 22nd October, 2018 ` 390.06 crore (USD 63.27 million) and on 21st
October, 2019 ` 389.93 crore (USD 63.46 million).
(c) The Group has entered into an agreement with Department of Biotechnology (DBT) for a project on boosting crop health and
yield. DBT has approved a loan of ` 0.15 crore (previous year ` 0.15 crore). The group has received two instalments of this loan
aggregating to ` 0.08 crore (previous year ` 0.08 crore). The loan is repayable in 10 equal half yearly instalments beginning
from 1st July, 2015.
NOTES forming part of Consolidated Financial Statements (contd.)
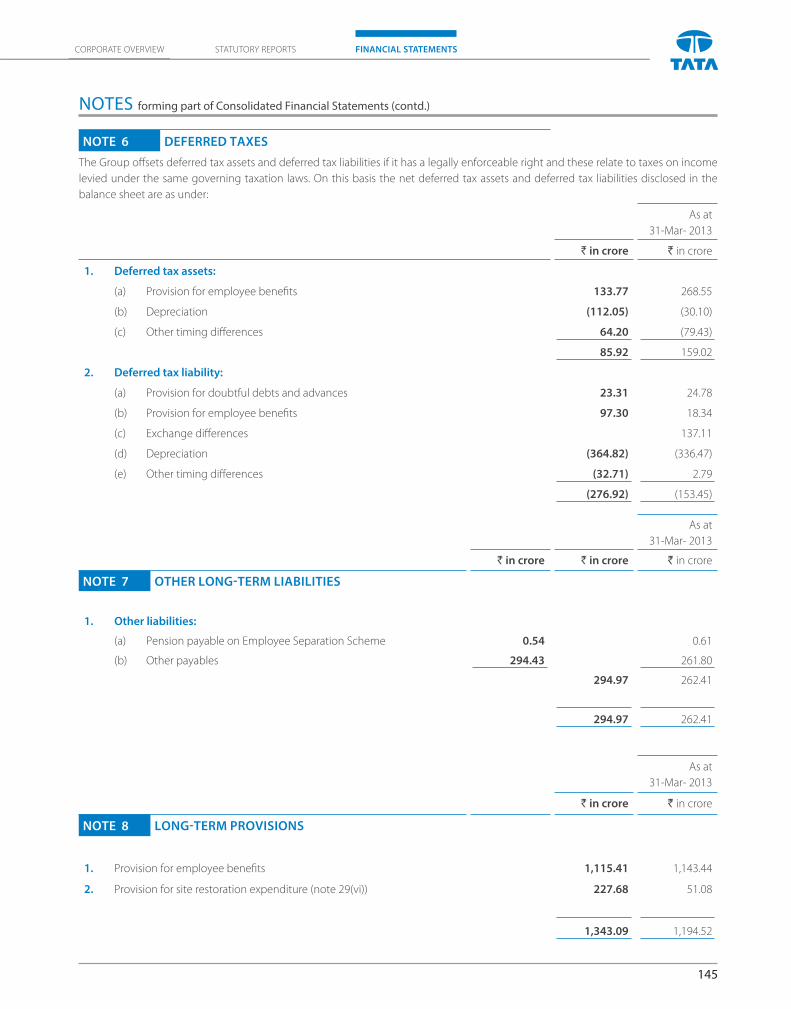
145
CORPORATE OVERVIEW FINANCIAL STATEMENTSSTATUTORY REPORTS
NOTE 6 DEFERRED TAXES
The Group off sets deferred tax assets and deferred tax liabilities if it has a legally enforceable right and these relate to taxes on income
levied under the same governing taxation laws. On this basis the net deferred tax assets and deferred tax liabilities disclosed in the
balance sheet are as under:
As at
31-Mar- 2013
` in crore ` in crore
1. Deferred tax assets:
(a) Provision for employee benefi ts 133.77 268.55
(b) Depreciation (112.05) (30.10)
(c) Other timing diff erences 64.20 (79.43)
85.92 159.02
2. Deferred tax liability:
(a) Provision for doubtful debts and advances 23.31 24.78
(b) Provision for employee benefi ts 97.30 18.34
(c) Exchange diff erences 137.11
(d) Depreciation (364.82) (336.47)
(e) Other timing diff erences (32.71) 2.79
(276.92) (153.45)
As at
31-Mar- 2013
` in crore ` in crore ` in crore
NOTE 7 OTHER LONG-TERM LIABILITIES
1. Other liabilities:
(a) Pension payable on Employee Separation Scheme 0.54 0.61
(b) Other payables 294.43 261.80
294.97 262.41
294.97 262.41
As at
31-Mar- 2013
` in crore ` in crore
NOTE 8 LONG-TERM PROVISIONS
1. Provision for employee benefi ts 1,115.41 1,143.44
2. Provision for site restoration expenditure (note 29(vi)) 227.68 51.08
1,343.09 1,194.52
NOTES forming part of Consolidated Financial Statements (contd.)
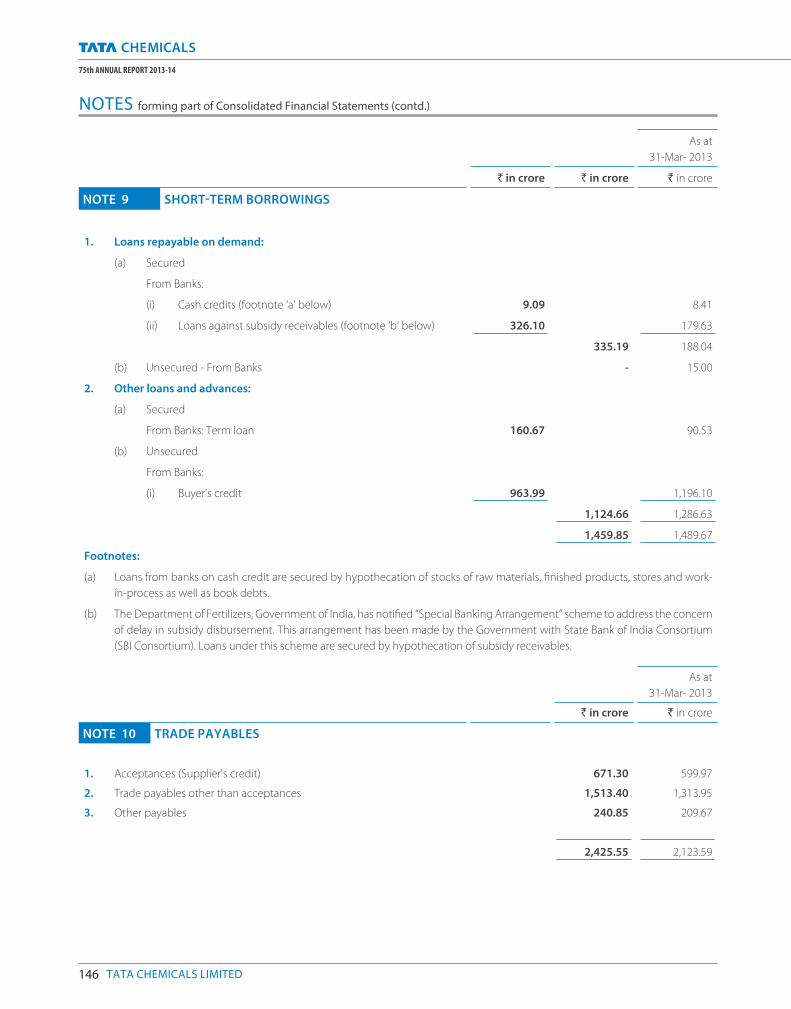
146 TATA CHEMICALS LIMITED
75th ANNUAL REPORT 2013-14
As at
31-Mar- 2013
` in crore ` in crore ` in crore
NOTE 9 SHORT-TERM BORROWINGS
1. Loans repayable on demand:
(a) Secured
From Banks:
(i) Cash credits (footnote ‘a’ below) 9.09 8.41
(ii) Loans against subsidy receivables (footnote ‘b’ below) 326.10 179.63
335.19 188.04
(b) Unsecured - From Banks - 15.00
2. Other loans and advances:
(a) Secured
From Banks: Term loan 160.67 90.53
(b) Unsecured
From Banks:
(i) Buyer’s credit 963.99 1,196.10
1,124.66 1,286.63
1,459.85 1,489.67
Footnotes:
(a) Loans from banks on cash credit are secured by hypothecation of stocks of raw materials, fi nished products, stores and work-
in-process as well as book debts.
(b) The Department of Fertilizers, Government of India, has notifi ed “Special Banking Arrangement” scheme to address the concern
of delay in subsidy disbursement. This arrangement has been made by the Government with State Bank of India Consortium
(SBI Consortium). Loans under this scheme are secured by hypothecation of subsidy receivables.
As at
31-Mar- 2013
` in crore ` in crore
NOTE 10 TRADE PAYABLES
1. Acceptances (Supplier's credit) 671.30 599.97
2. Trade payables other than acceptances 1,513.40 1,313.95
3. Other payables 240.85 209.67
2,425.55 2,123.59
NOTES forming part of Consolidated Financial Statements (contd.)
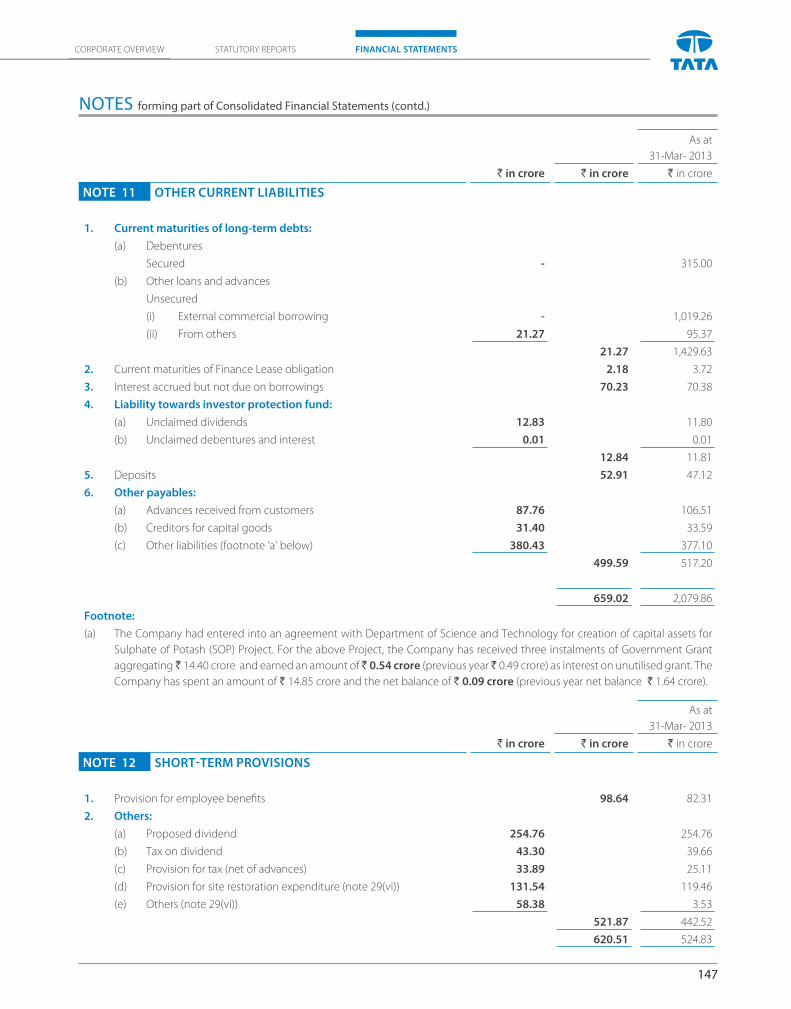
147
CORPORATE OVERVIEW FINANCIAL STATEMENTSSTATUTORY REPORTS
As at
31-Mar- 2013
` in crore ` in crore ` in crore
NOTE 11 OTHER CURRENT LIABILITIES
1. Current maturities of long-term debts:
(a) Debentures
Secured - 315.00
(b) Other loans and advances
Unsecured
(i) External commercial borrowing - 1,019.26
(ii) From others 21.27 95.37
21.27 1,429.63
2. Current maturities of Finance Lease obligation 2.18 3.72
3. Interest accrued but not due on borrowings 70.23 70.38
4. Liability towards investor protection fund:
(a) Unclaimed dividends 12.83 11.80
(b) Unclaimed debentures and interest 0.01 0.01
12.84 11.81
5. Deposits 52.91 47.12
6. Other payables:
(a) Advances received from customers 87.76 106.51
(b) Creditors for capital goods 31.40 33.59
(c) Other liabilities (footnote ‘a’ below) 380.43 377.10
499.59 517.20
659.02 2,079.86
Footnote:
(a) The Company had entered into an agreement with Department of Science and Technology for creation of capital assets for
Sulphate of Potash (SOP) Project. For the above Project, the Company has received three instalments of Government Grant
aggregating ̀ 14.40 crore and earned an amount of ̀ 0.54 crore (previous year ̀ 0.49 crore) as interest on unutilised grant. The
Company has spent an amount of ` 14.85 crore and the net balance of ` 0.09 crore (previous year net balance ` 1.64 crore).
As at
31-Mar- 2013
` in crore ` in crore ` in crore
NOTE 12 SHORT-TERM PROVISIONS
1. Provision for employee benefi ts 98.64 82.31
2. Others:
(a) Proposed dividend 254.76 254.76
(b) Tax on dividend 43.30 39.66
(c) Provision for tax (net of advances) 33.89 25.11
(d) Provision for site restoration expenditure (note 29(vi)) 131.54 119.46
(e) Others (note 29(vi)) 58.38 3.53
521.87 442.52
620.51 524.83
NOTES forming part of Consolidated Financial Statements (contd.)
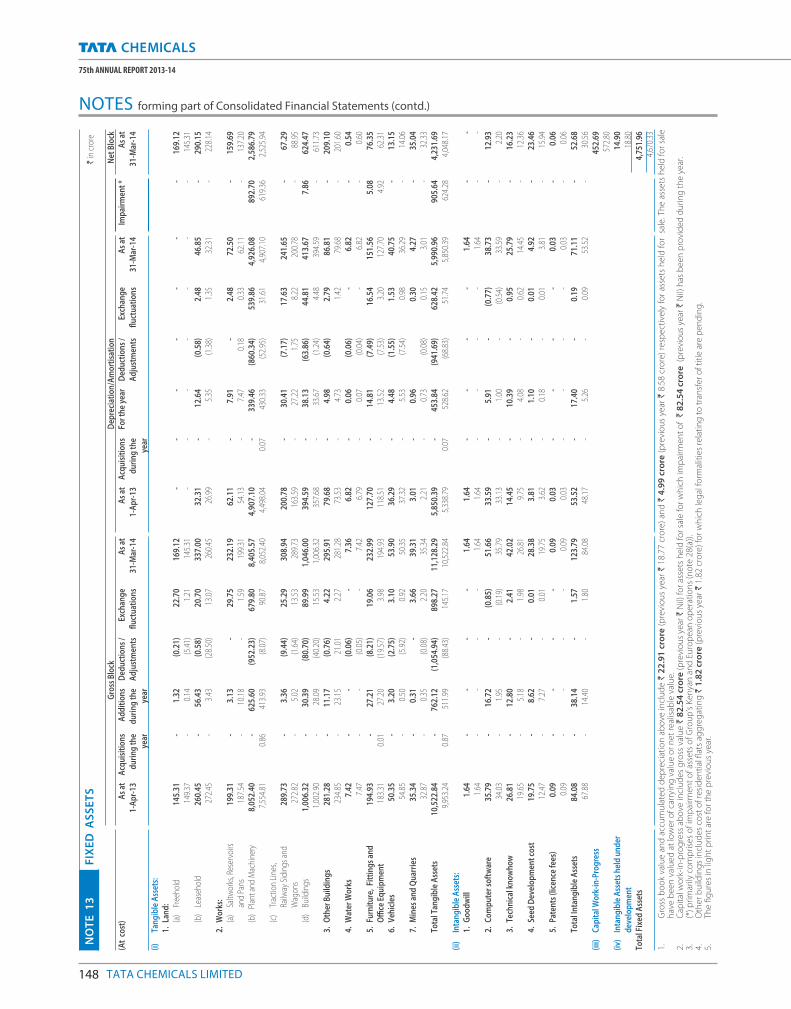
148 TATA CHEMICALS LIMITED
75th ANNUAL REPORT 2013-14
NO
TE
13
FIX
ED
AS
SE
TS
`
in c
rore
Gro
ss B
lock
D
epre
ciat
ion
/Am
orti
sati
onN
et B
lock
(At
cost
) A
s at
1-A
pr-
13
Acq
uisi
tion
s
dur
ing
the
year
Ad
dit
ion
s
dur
ing
the
year
Ded
ucti
ons
/
Ad
just
men
ts
Exch
ang
e
fl uct
uati
ons
As
at
31-M
ar-1
4
As
at
1-A
pr-
13
Acq
uisi
tion
s
dur
ing
the
year
For t
he
year
Ded
ucti
ons
/
Ad
just
men
ts
Exch
ang
e
fl uct
uati
ons
As
at
31-M
ar-1
4
Imp
airm
ent *
As
at
31-M
ar-1
4
(i)Ta
ng
ible
Ass
ets:
1.La
nd
:(a
) Fr
eeho
ld 1
45.3
1 -
1.3
2 (0
.21)
22.
70
169
.12
--
--
--
- 1
69.1
2 1
49.3
7 -
0.1
4 (5
.41)
1.2
1 1
45.3
1 -
--
--
--
145
.31
(b)
Leas
ehol
d 2
60.4
5 -
56.
43
(0.5
8) 2
0.70
3
37.0
0 3
2.31
-
12.
64
(0.5
8) 2
.48
46.
85
- 2
90.1
5 2
72.4
5 -
3.4
3 (2
8.50
) 1
3.07
2
60.4
5 2
6.99
-
5.3
5 (1
.38)
1.3
5 3
2.31
-
228
.14
2.W
orks
:(a
) Sa
ltwor
ks, R
eser
voirs
199
.31
- 3
.13
- 2
9.75
2
32.1
9 6
2.11
-
7.9
1 -
2.4
8 7
2.50
-
159
.69
an
d Pa
ns 1
87.5
4 -
10.
18
- 1
.59
199
.31
54.
13
- 7
.47
0.1
8 0
.33
62.
11
- 1
37.2
0 (b
) P
lant
and
Mac
hine
ry 8
,052
.40
- 6
25.6
0 (9
52.2
3) 6
79.8
0 8
,405
.57
4,9
07.1
0 -
339
.46
(860
.34)
539
.86
4,9
26.0
8 8
92.7
0 2
,586
.79
7,5
54.8
1 0
.86
413
.93
(8.0
7) 9
0.87
8
,052
.40
4,4
98.0
4 0
.07
430
.33
(52.
95)
31.
61
4,9
07.1
0 6
19.3
6 2
,525
.94
(c)
Trac
tion
Line
s,
Railw
ay S
idin
gs a
nd 2
89.7
3 -
3.3
6 (9
.44)
25.
29
308
.94
200
.78
- 3
0.41
(7
.17)
17.
63
241
.65
- 6
7.29
Wag
ons
272
.82
- 5
.02
(1.6
4) 1
3.53
2
89.7
3 1
63.5
9 -
27.
22
1.7
5 8
.22
200
.78
- 8
8.95
(d
) Bu
ildin
gs 1
,006
.32
- 3
0.39
(8
0.70
) 8
9.99
1
,046
.00
394
.59
- 3
8.13
(6
3.86
) 4
4.81
4
13.6
7 7
.86
624
.47
1,0
02.9
0 -
28.
09
(40.
20)
15.
53
1,0
06.3
2 3
57.6
8 -
33.
67
(1.2
4) 4
.48
394
.59
- 6
11.7
3 3.
Oth
er B
uild
ing
s 2
81.2
8 -
11.
17
(0.7
6) 4
.22
295
.91
79.
68
- 4
.98
(0.6
4) 2
.79
86.
81
- 2
09.1
0 2
34.8
5 -
23.
15
21.
01
2.2
7 2
81.2
8 7
3.53
-
4.7
3 1
.42
79.
68
- 2
01.6
0 4.
Wat
er W
orks
7.4
2 -
- (0
.06)
- 7
.36
6.8
2 -
0.0
6 (0
.06)
- 6
.82
- 0
.54
7.4
7 -
- (0
.05)
- 7
.42
6.7
9 -
0.0
7 (0
.04)
- 6
.82
- 0
.60
5.Fu
rnit
ure,
Fit
tin
gs
and
194
.93
- 2
7.21
(8
.21)
19.
06
232
.99
127
.70
- 1
4.81
(7
.49)
16.
54
151
.56
5.0
8 7
6.35
O
ffi c
e Eq
uip
men
t 1
83.3
1 0
.01
27.
20
(19.
57)
3.9
8 1
94.9
3 1
18.5
1 -
13.
52
(7.5
3) 3
.20
127
.70
4.9
2 6
2.31
6.
Veh
icle
s 5
0.35
-
3.2
0 (2
.75)
3.1
0 5
3.90
3
6.29
-
4.4
8 (1
.55)
1.5
3 4
0.75
-
13.
15
54.
85
- 0
.50
(5.9
2) 0
.92
50.
35
37.
32
- 5
.53
(7.5
4) 0
.98
36.
29
- 1
4.06
7.
Min
es a
nd
Qua
rrie
s 3
5.34
-
0.3
1 -
3.6
6 3
9.31
3
.01
- 0
.96
0.3
0 4
.27
- 3
5.04
3
2.87
-
0.3
5 (0
.08)
2.2
0 3
5.34
2
.21
- 0
.73
(0.0
8) 0
.15
3.0
1 -
32.
33
Tota
l Tan
gib
le A
sset
s10
,522
.84
- 7
62.1
2 (1
,054
.94)
898
.27
11,
128.
29
5,8
50.3
9 -
453
.84
(941
.69)
628
.42
5,9
90.9
6 9
05.6
4 4
,231
.69
9,9
53.2
4 0
.87
511
.99
(88.
43)
145
.17
10,
522.
84
5,3
38.7
9 0
.07
528
.62
(68.
83)
51.
74
5,8
50.3
9 6
24.2
8 4
,048
.17
(ii)
Inta
ng
ible
Ass
ets:
1.G
ood
will
1.6
4 -
--
- 1
.64
1.6
4 -
--
- 1
.64
--
1.6
4 -
--
- 1
.64
1.6
4 -
--
- 1
.64
--
2.C
omp
uter
sof
twar
e 3
5.79
-
16.
72
- (0
.85)
51.
66
33.
59
- 5
.91
- (0
.77)
38.
73
- 1
2.93
3
4.03
-
1.9
5 -
(0.1
9) 3
5.79
3
3.13
-
1.0
0 -
(0.5
4) 3
3.59
-
2.2
0 3.
Tech
nic
al k
now
how
26.
81
- 1
2.80
-
2.4
1 4
2.02
1
4.45
-
10.
39
- 0
.95
25.
79
- 1
6.23
1
9.65
-
5.1
8 -
1.9
8 2
6.81
9
.75
- 4
.08
- 0
.62
14.
45
- 1
2.36
4.
Seed
Dev
elop
men
t cos
t 1
9.75
-
8.6
2 -
0.0
1 2
8.38
3
.81
- 1
.10
- 0
.01
4.9
2 -
23.
46
12.
47
- 7
.27
- 0
.01
19.
75
3.6
2 -
0.1
8 -
0.0
1 3
.81
- 1
5.94
5.
Pate
nts
(lic
ence
fees
) 0
.09
--
--
0.0
9 0
.03
--
--
0.0
3 -
0.0
6 0
.09
--
--
0.0
9 0
.03
--
--
0.0
3 -
0.0
6 To
tal I
nta
ng
ible
Ass
ets
84.
08
- 3
8.14
-
1.5
7 1
23.7
9 5
3.52
-
17.
40
- 0
.19
71.
11
- 5
2.68
6
7.88
-
14.
40
- 1
.80
84.
08
48.
17
- 5
.26
- 0
.09
53.
52
- 3
0.56
(ii
i)C
apit
al W
ork-
in-P
rog
ress
452
.69
572
.80
(iv)
Inta
ng
ible
Ass
ets
hel
d u
nd
er
dev
elop
men
t
14.
90
18.
80
Tota
l Fix
ed A
sset
s 4
,751
.96
4,6
70.3
3
1.
Gro
ss b
oo
k va
lue
an
d a
ccu
mu
late
d d
ep
reci
atio
n a
bo
ve in
clu
de
` 2
2.9
1 c
rore
(p
revi
ou
s ye
ar `
18
.77
cro
re)
and
` 4
.99
cro
re (
pre
vio
us
year
` 8
.58
cro
re)
resp
ect
ive
ly f
or
asse
ts h
eld
fo
r s
ale
. Th
e a
sse
ts h
eld
fo
r sa
le
hav
e b
ee
n v
alu
ed
at
low
er
of
carr
yin
g v
alu
e o
r n
et
real
isab
le v
alu
e.
2.
Cap
ital
wo
rk-i
n-p
rog
ress
ab
ove
incl
ud
es
gro
ss v
alu
e `
82
.54
cro
re (
pre
vio
us
year
` N
il) f
or
asse
ts h
eld
fo
r sa
le f
or
wh
ich
imp
airm
en
t o
f `
82
.54
cro
re (
pre
vio
us
year
` N
il) h
as b
ee
n p
rovi
de
d d
uri
ng
th
e y
ear
. 3
. (*
) p
rim
arily
co
mp
rise
s o
f im
pai
rme
nt
of
asse
ts o
f G
rou
p’s
Ke
nya
n a
nd
Eu
rop
ean
op
era
tio
ns
(no
te 2
8(a
)).
4.
Oth
er
bu
ildin
gs
incl
ud
es
cost
of
resi
de
nti
al fl
ats
agg
reg
atin
g `
1.8
2 c
rore
(p
revi
ou
s ye
ar `
1.8
2 c
rore
) fo
r w
hic
h le
gal
fo
rmal
itie
s re
lati
ng
to
tra
nsf
er
of
titl
e a
re p
en
din
g.
5.
The
fi g
ure
s in
lig
ht
pri
nt
are
fo
r th
e p
revi
ou
s ye
ar.
NOTES forming part of Consolidated Financial Statements (contd.)
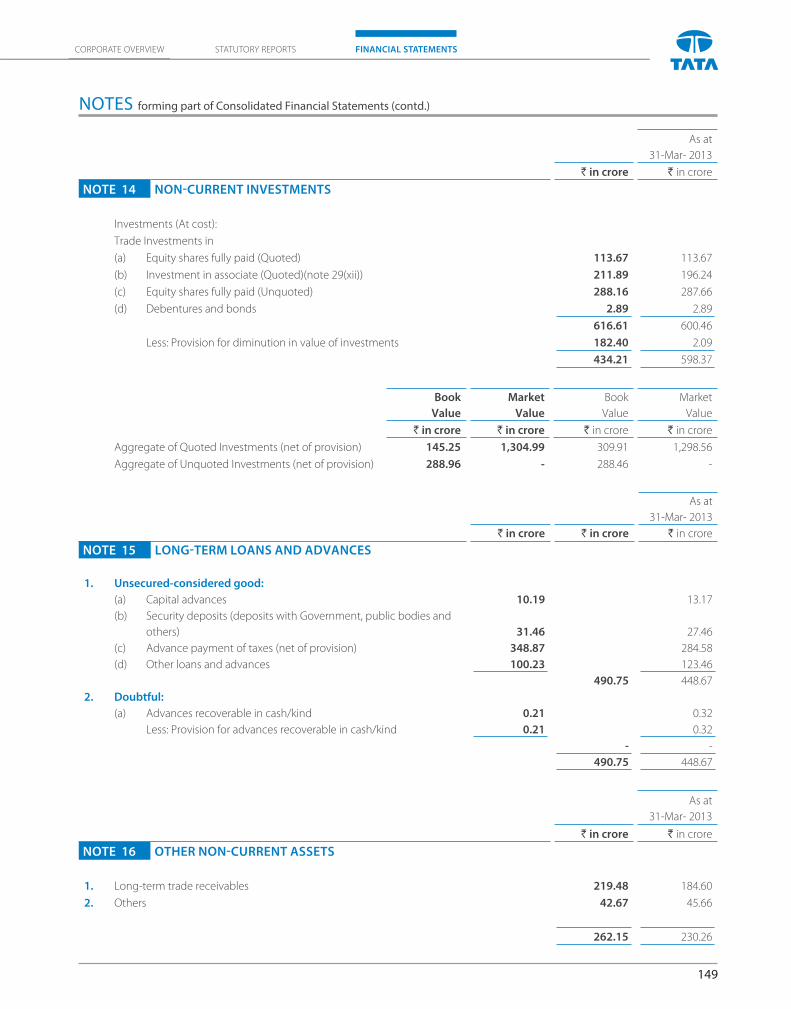
149
CORPORATE OVERVIEW FINANCIAL STATEMENTSSTATUTORY REPORTS
As at
31-Mar- 2013
` in crore ` in crore
NOTE 14 NON-CURRENT INVESTMENTS
Investments (At cost):
Trade Investments in
(a) Equity shares fully paid (Quoted) 113.67 113.67
(b) Investment in associate (Quoted)(note 29(xii)) 211.89 196.24
(c) Equity shares fully paid (Unquoted) 288.16 287.66
(d) Debentures and bonds 2.89 2.89
616.61 600.46
Less: Provision for diminution in value of investments 182.40 2.09
434.21 598.37
Book
Value
Market
Value
Book
Value
Market
Value
` in crore ` in crore ` in crore ` in crore
Aggregate of Quoted Investments (net of provision) 145.25 1,304.99 309.91 1,298.56
Aggregate of Unquoted Investments (net of provision) 288.96 - 288.46 -
As at
31-Mar- 2013
` in crore ` in crore ` in crore
NOTE 15 LONG-TERM LOANS AND ADVANCES
1. Unsecured-considered good:
(a) Capital advances 10.19 13.17
(b) Security deposits (deposits with Government, public bodies and
others) 31.46 27.46
(c) Advance payment of taxes (net of provision) 348.87 284.58
(d) Other loans and advances 100.23 123.46
490.75 448.67
2. Doubtful:
(a) Advances recoverable in cash/kind 0.21 0.32
Less: Provision for advances recoverable in cash/kind 0.21 0.32
- -
490.75 448.67
As at
31-Mar- 2013
` in crore ` in crore
NOTE 16 OTHER NON-CURRENT ASSETS
1. Long-term trade receivables 219.48 184.60
2. Others 42.67 45.66
262.15 230.26
NOTES forming part of Consolidated Financial Statements (contd.)
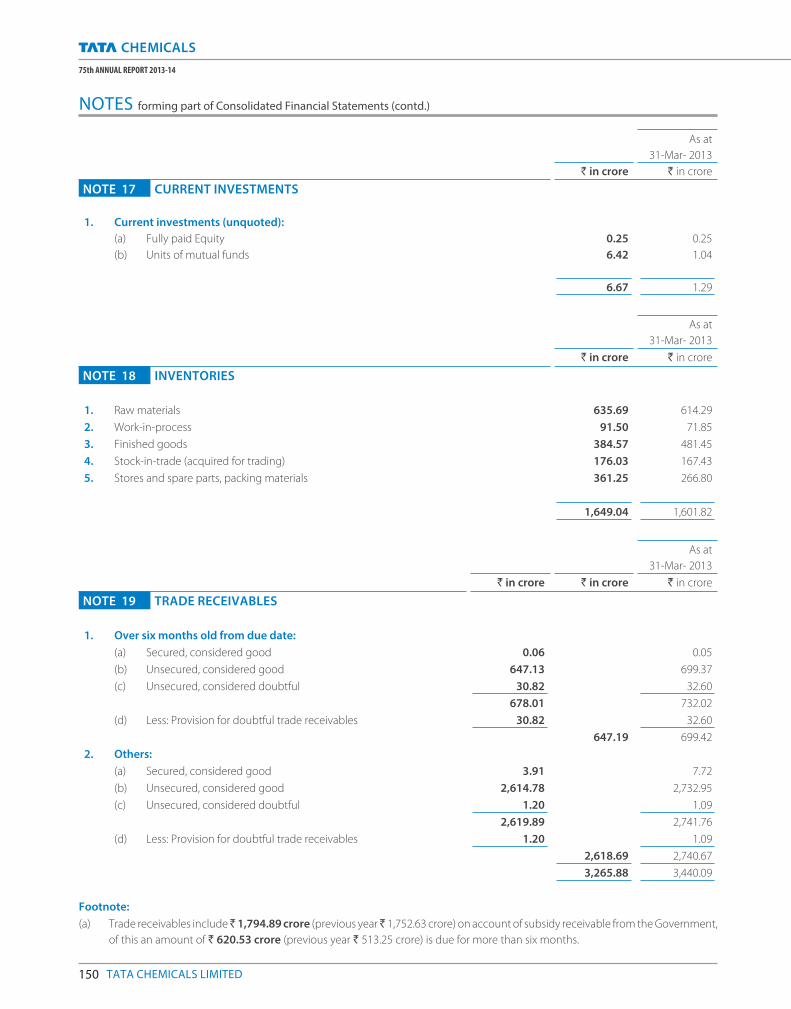
150 TATA CHEMICALS LIMITED
75th ANNUAL REPORT 2013-14
As at
31-Mar- 2013
` in crore ` in crore
NOTE 17 CURRENT INVESTMENTS
1. Current investments (unquoted):
(a) Fully paid Equity 0.25 0.25
(b) Units of mutual funds 6.42 1.04
6.67 1.29
As at
31-Mar- 2013
` in crore ` in crore
NOTE 18 INVENTORIES
1. Raw materials 635.69 614.29
2. Work-in-process 91.50 71.85
3. Finished goods 384.57 481.45
4. Stock-in-trade (acquired for trading) 176.03 167.43
5. Stores and spare parts, packing materials 361.25 266.80
1,649.04 1,601.82
As at
31-Mar- 2013
` in crore ` in crore ` in crore
NOTE 19 TRADE RECEIVABLES
1. Over six months old from due date:
(a) Secured, considered good 0.06 0.05
(b) Unsecured, considered good 647.13 699.37
(c) Unsecured, considered doubtful 30.82 32.60
678.01 732.02
(d) Less: Provision for doubtful trade receivables 30.82 32.60
647.19 699.42
2. Others:
(a) Secured, considered good 3.91 7.72
(b) Unsecured, considered good 2,614.78 2,732.95
(c) Unsecured, considered doubtful 1.20 1.09
2,619.89 2,741.76
(d) Less: Provision for doubtful trade receivables 1.20 1.09
2,618.69 2,740.67
3,265.88 3,440.09
Footnote:
(a) Trade receivables include ̀ 1,794.89 crore (previous year ̀ 1,752.63 crore) on account of subsidy receivable from the Government,
of this an amount of ` 620.53 crore (previous year ` 513.25 crore) is due for more than six months.
NOTES forming part of Consolidated Financial Statements (contd.)
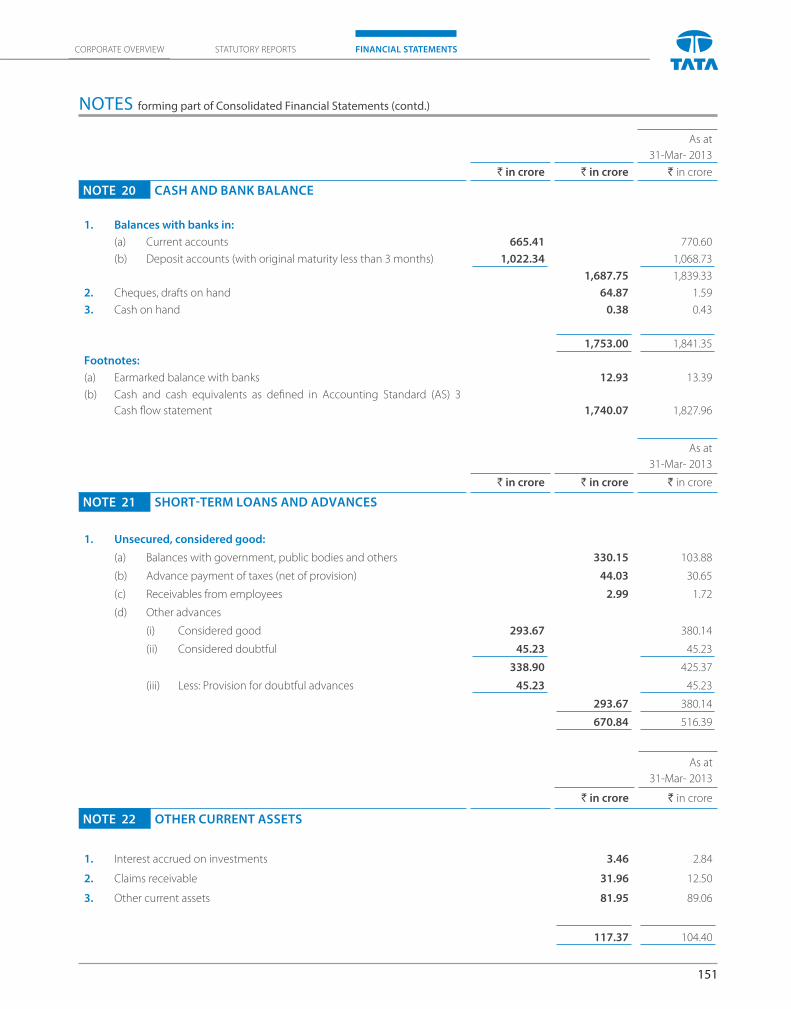
151
CORPORATE OVERVIEW FINANCIAL STATEMENTSSTATUTORY REPORTS
As at
31-Mar- 2013
` in crore ` in crore ` in crore
NOTE 20 CASH AND BANK BALANCE
1. Balances with banks in:
(a) Current accounts 665.41 770.60
(b) Deposit accounts (with original maturity less than 3 months) 1,022.34 1,068.73
1,687.75 1,839.33
2. Cheques, drafts on hand 64.87 1.59
3. Cash on hand 0.38 0.43
1,753.00 1,841.35
Footnotes:
(a) Earmarked balance with banks 12.93 13.39
(b) Cash and cash equivalents as defi ned in Accounting Standard (AS) 3
Cash fl ow statement 1,740.07 1,827.96
As at
31-Mar- 2013
` in crore ` in crore ` in crore
NOTE 21 SHORT-TERM LOANS AND ADVANCES
1. Unsecured, considered good:
(a) Balances with government, public bodies and others 330.15 103.88
(b) Advance payment of taxes (net of provision) 44.03 30.65
(c) Receivables from employees 2.99 1.72
(d) Other advances
(i) Considered good 293.67 380.14
(ii) Considered doubtful 45.23 45.23
338.90 425.37
(iii) Less: Provision for doubtful advances 45.23 45.23
293.67 380.14
670.84 516.39
As at
31-Mar- 2013
` in crore ` in crore
NOTE 22 OTHER CURRENT ASSETS
1. Interest accrued on investments 3.46 2.84
2. Claims receivable 31.96 12.50
3. Other current assets 81.95 89.06
117.37 104.40
NOTES forming part of Consolidated Financial Statements (contd.)
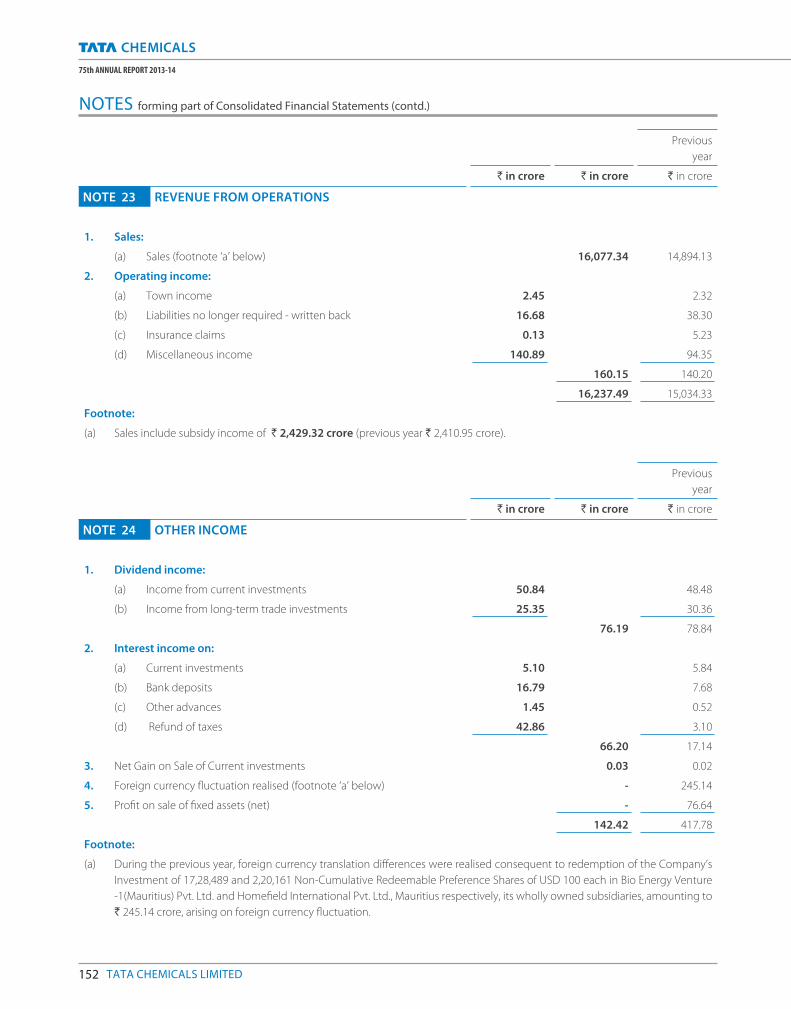
152 TATA CHEMICALS LIMITED
75th ANNUAL REPORT 2013-14
Previous
year
` in crore ` in crore ` in crore
NOTE 23 REVENUE FROM OPERATIONS
1. Sales:
(a) Sales (footnote ‘a’ below) 16,077.34 14,894.13
2. Operating income:
(a) Town income 2.45 2.32
(b) Liabilities no longer required - written back 16.68 38.30
(c) Insurance claims 0.13 5.23
(d) Miscellaneous income 140.89 94.35
160.15 140.20
16,237.49 15,034.33
Footnote:
(a) Sales include subsidy income of ` 2,429.32 crore (previous year ` 2,410.95 crore).
Previous
year
` in crore ` in crore ` in crore
NOTE 24 OTHER INCOME
1. Dividend income:
(a) Income from current investments 50.84 48.48
(b) Income from long-term trade investments 25.35 30.36
76.19 78.84
2. Interest income on:
(a) Current investments 5.10 5.84
(b) Bank deposits 16.79 7.68
(c) Other advances 1.45 0.52
(d) Refund of taxes 42.86 3.10
66.20 17.14
3. Net Gain on Sale of Current investments 0.03 0.02
4. Foreign currency fl uctuation realised (footnote ‘a’ below) - 245.14
5. Profi t on sale of fi xed assets (net) - 76.64
142.42 417.78
Footnote:
(a) During the previous year, foreign currency translation diff erences were realised consequent to redemption of the Company’s
Investment of 17,28,489 and 2,20,161 Non-Cumulative Redeemable Preference Shares of USD 100 each in Bio Energy Venture
-1(Mauritius) Pvt. Ltd. and Homefi eld International Pvt. Ltd., Mauritius respectively, its wholly owned subsidiaries, amounting to
` 245.14 crore, arising on foreign currency fl uctuation.
NOTES forming part of Consolidated Financial Statements (contd.)
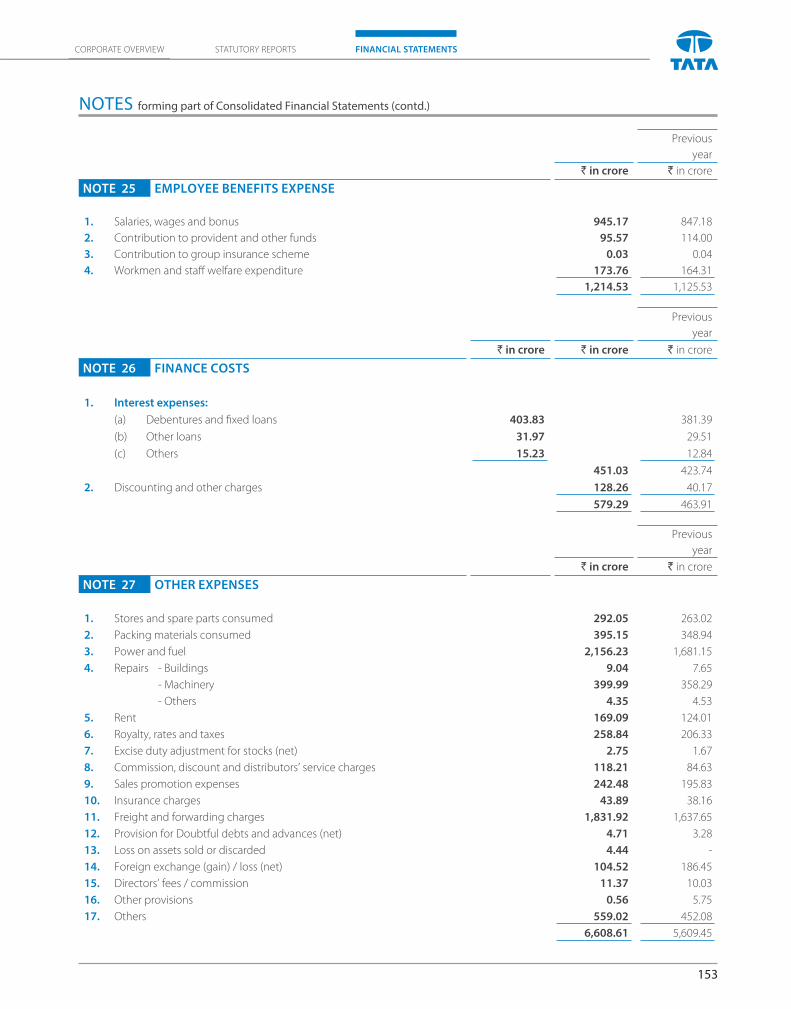
153
CORPORATE OVERVIEW FINANCIAL STATEMENTSSTATUTORY REPORTS
Previous
year
` in crore ` in crore
NOTE 25 EMPLOYEE BENEFITS EXPENSE
1. Salaries, wages and bonus 945.17 847.18
2. Contribution to provident and other funds 95.57 114.00
3. Contribution to group insurance scheme 0.03 0.04
4. Workmen and staff welfare expenditure 173.76 164.31
1,214.53 1,125.53
Previous
year
` in crore ` in crore ` in crore
NOTE 26 FINANCE COSTS
1. Interest expenses:
(a) Debentures and fi xed loans 403.83 381.39
(b) Other loans 31.97 29.51
(c) Others 15.23 12.84
451.03 423.74
2. Discounting and other charges 128.26 40.17
579.29 463.91
Previous
year
` in crore ` in crore
NOTE 27 OTHER EXPENSES
1. Stores and spare parts consumed 292.05 263.02
2. Packing materials consumed 395.15 348.94
3. Power and fuel 2,156.23 1,681.15
4. Repairs - Buildings 9.04 7.65
- Machinery 399.99 358.29
- Others 4.35 4.53
5. Rent 169.09 124.01
6. Royalty, rates and taxes 258.84 206.33
7. Excise duty adjustment for stocks (net) 2.75 1.67
8. Commission, discount and distributors’ service charges 118.21 84.63
9. Sales promotion expenses 242.48 195.83
10. Insurance charges 43.89 38.16
11. Freight and forwarding charges 1,831.92 1,637.65
12. Provision for Doubtful debts and advances (net) 4.71 3.28
13. Loss on assets sold or discarded 4.44 -
14. Foreign exchange (gain) / loss (net) 104.52 186.45
15. Directors’ fees / commission 11.37 10.03
16. Other provisions 0.56 5.75
17. Others 559.02 452.08
6,608.61 5,609.45
NOTES forming part of Consolidated Financial Statements (contd.)
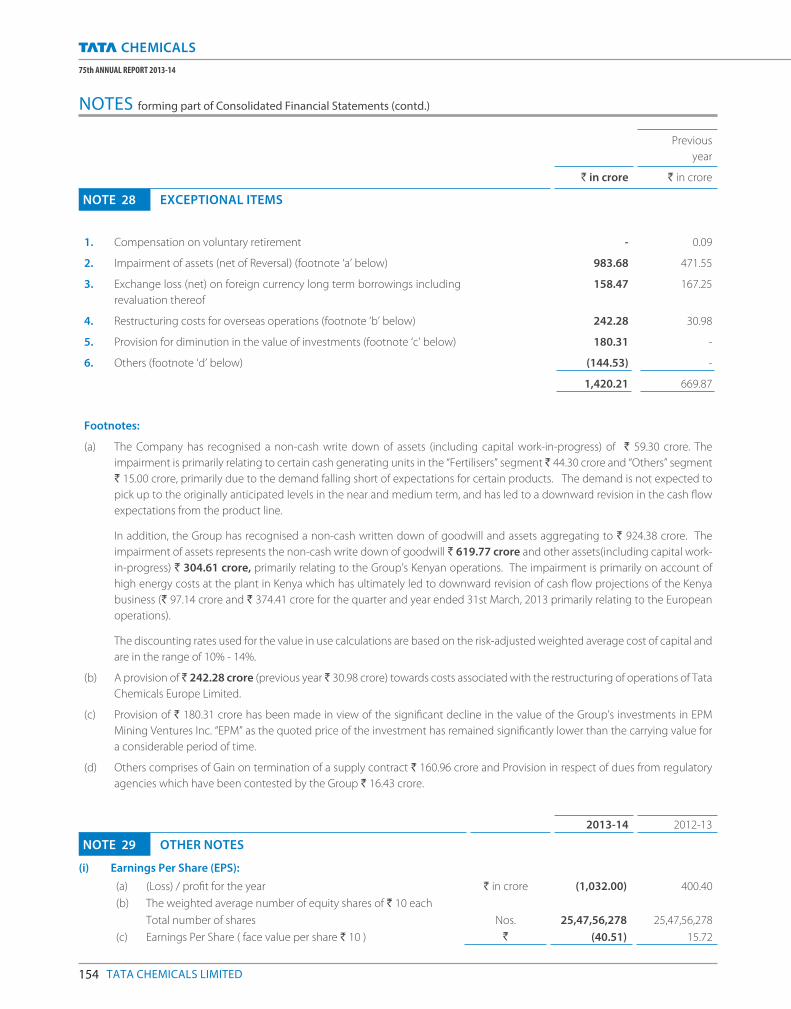
154 TATA CHEMICALS LIMITED
75th ANNUAL REPORT 2013-14
Previous
year
` in crore ` in crore
NOTE 28 EXCEPTIONAL ITEMS
1. Compensation on voluntary retirement - 0.09
2. Impairment of assets (net of Reversal) (footnote ‘a’ below) 983.68 471.55
3. Exchange loss (net) on foreign currency long term borrowings including
revaluation thereof
158.47 167.25
4. Restructuring costs for overseas operations (footnote ‘b’ below) 242.28 30.98
5. Provision for diminution in the value of investments (footnote ‘c’ below) 180.31 -
6. Others (footnote ‘d’ below) (144.53) -
1,420.21 669.87
Footnotes:
(a) The Company has recognised a non-cash write down of assets (including capital work-in-progress) of ` 59.30 crore. The
impairment is primarily relating to certain cash generating units in the “Fertilisers” segment ` 44.30 crore and “Others” segment
` 15.00 crore, primarily due to the demand falling short of expectations for certain products. The demand is not expected to
pick up to the originally anticipated levels in the near and medium term, and has led to a downward revision in the cash fl ow
expectations from the product line.
In addition, the Group has recognised a non-cash written down of goodwill and assets aggregating to ` 924.38 crore. The
impairment of assets represents the non-cash write down of goodwill ` 619.77 crore and other assets(including capital work-
in-progress) ` 304.61 crore, primarily relating to the Group’s Kenyan operations. The impairment is primarily on account of
high energy costs at the plant in Kenya which has ultimately led to downward revision of cash fl ow projections of the Kenya
business (` 97.14 crore and ` 374.41 crore for the quarter and year ended 31st March, 2013 primarily relating to the European
operations).
The discounting rates used for the value in use calculations are based on the risk-adjusted weighted average cost of capital and
are in the range of 10% - 14%.
(b) A provision of ̀ 242.28 crore (previous year ̀ 30.98 crore) towards costs associated with the restructuring of operations of Tata
Chemicals Europe Limited.
(c) Provision of ` 180.31 crore has been made in view of the signifi cant decline in the value of the Group’s investments in EPM
Mining Ventures Inc. “EPM” as the quoted price of the investment has remained signifi cantly lower than the carrying value for
a considerable period of time.
(d) Others comprises of Gain on termination of a supply contract ` 160.96 crore and Provision in respect of dues from regulatory
agencies which have been contested by the Group ` 16.43 crore.
2013-14 2012-13
NOTE 29 OTHER NOTES
(i) Earnings Per Share (EPS):
(a) (Loss) / profi t for the year ` in crore (1,032.00) 400.40
(b) The weighted average number of equity shares of ` 10 each
Total number of shares Nos. 25,47,56,278 25,47,56,278
(c) Earnings Per Share ( face value per share ` 10 ) ` (40.51) 15.72
NOTES forming part of Consolidated Financial Statements (contd.)
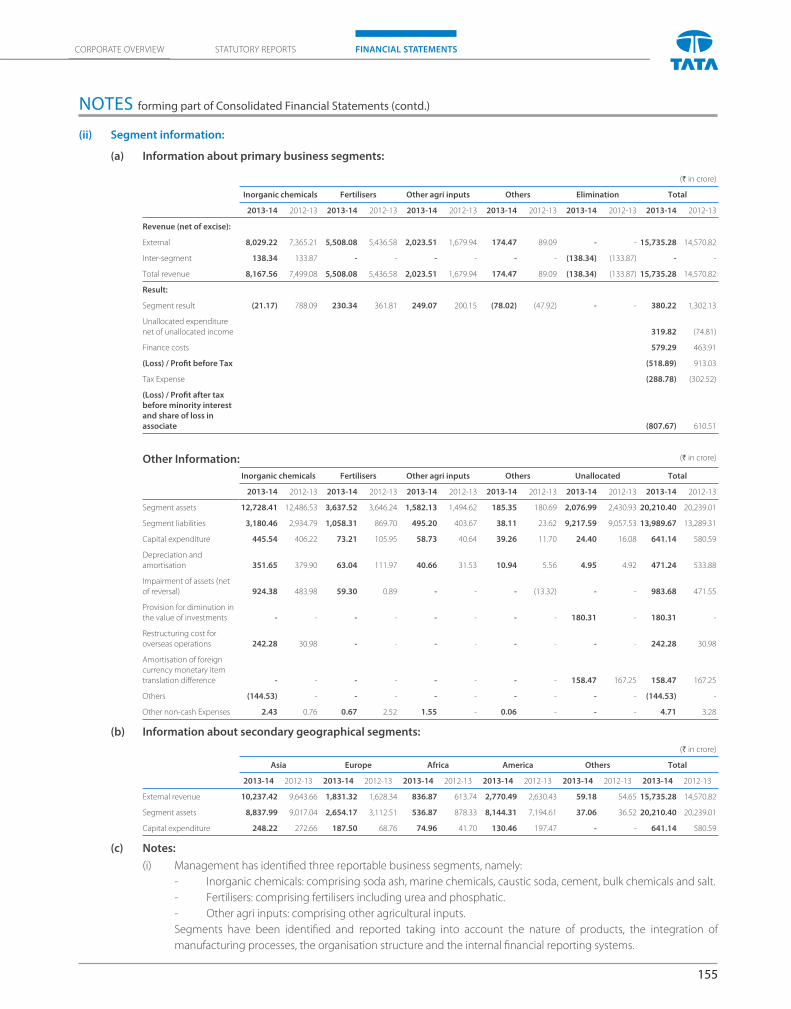
155
CORPORATE OVERVIEW FINANCIAL STATEMENTSSTATUTORY REPORTS
(ii) Segment information:
(a) Information about primary business segments:
(` in crore)
Inorganic chemicals Fertilisers Other agri inputs Others Elimination Total
2013-14 2012-13 2013-14 2012-13 2013-14 2012-13 2013-14 2012-13 2013-14 2012-13 2013-14 2012-13
Revenue (net of excise):
External 8,029.22 7,365.21 5,508.08 5,436.58 2,023.51 1,679.94 174.47 89.09 - - 15,735.28 14,570.82
Inter-segment 138.34 133.87 - - - - - - (138.34) (133.87) - -
Total revenue 8,167.56 7,499.08 5,508.08 5,436.58 2,023.51 1,679.94 174.47 89.09 (138.34) (133.87) 15,735.28 14,570.82
Result:
Segment result (21.17) 788.09 230.34 361.81 249.07 200.15 (78.02) (47.92) - - 380.22 1,302.13
Unallocated expenditure
net of unallocated income 319.82 (74.81)
Finance costs 579.29 463.91
(Loss) / Profi t before Tax (518.89) 913.03
Tax Expense (288.78) (302.52)
(Loss) / Profi t after tax
before minority interest
and share of loss in
associate (807.67) 610.51
Other Information: (` in crore)
Inorganic chemicals Fertilisers Other agri inputs Others Unallocated Total
2013-14 2012-13 2013-14 2012-13 2013-14 2012-13 2013-14 2012-13 2013-14 2012-13 2013-14 2012-13
Segment assets 12,728.41 12,486.53 3,637.52 3,646.24 1,582.13 1,494.62 185.35 180.69 2,076.99 2,430.93 20,210.40 20,239.01
Segment liabilities 3,180.46 2,934.79 1,058.31 869.70 495.20 403.67 38.11 23.62 9,217.59 9,057.53 13,989.67 13,289.31
Capital expenditure 445.54 406.22 73.21 105.95 58.73 40.64 39.26 11.70 24.40 16.08 641.14 580.59
Depreciation and
amortisation 351.65 379.90 63.04 111.97 40.66 31.53 10.94 5.56 4.95 4.92 471.24 533.88
Impairment of assets (net
of reversal) 924.38 483.98 59.30 0.89 - - - (13.32) - - 983.68 471.55
Provision for diminution in
the value of investments - - - - - - - - 180.31 - 180.31 -
Restructuring cost for
overseas operations 242.28 30.98 - - - - - - - - 242.28 30.98
Amortisation of foreign
currency monetary item
translation diff erence - - - - - - - - 158.47 167.25 158.47 167.25
Others (144.53) - - - - - - - - - (144.53) -
Other non-cash Expenses 2.43 0.76 0.67 2.52 1.55 - 0.06 - - - 4.71 3.28
(b) Information about secondary geographical segments:
(` in crore)
Asia Europe Africa America Others Total
2013-14 2012-13 2013-14 2012-13 2013-14 2012-13 2013-14 2012-13 2013-14 2012-13 2013-14 2012-13
External revenue 10,237.42 9,643.66 1,831.32 1,628.34 836.87 613.74 2,770.49 2,630.43 59.18 54.65 15,735.28 14,570.82
Segment assets 8,837.99 9,017.04 2,654.17 3,112.51 536.87 878.33 8,144.31 7,194.61 37.06 36.52 20,210.40 20,239.01
Capital expenditure 248.22 272.66 187.50 68.76 74.96 41.70 130.46 197.47 - - 641.14 580.59
(c) Notes:
(i) Management has identifi ed three reportable business segments, namely:
- Inorganic chemicals: comprising soda ash, marine chemicals, caustic soda, cement, bulk chemicals and salt.
- Fertilisers: comprising fertilisers including urea and phosphatic.
- Other agri inputs: comprising other agricultural inputs.
Segments have been identifi ed and reported taking into account the nature of products, the integration of
manufacturing processes, the organisation structure and the internal fi nancial reporting systems.
NOTES forming part of Consolidated Financial Statements (contd.)
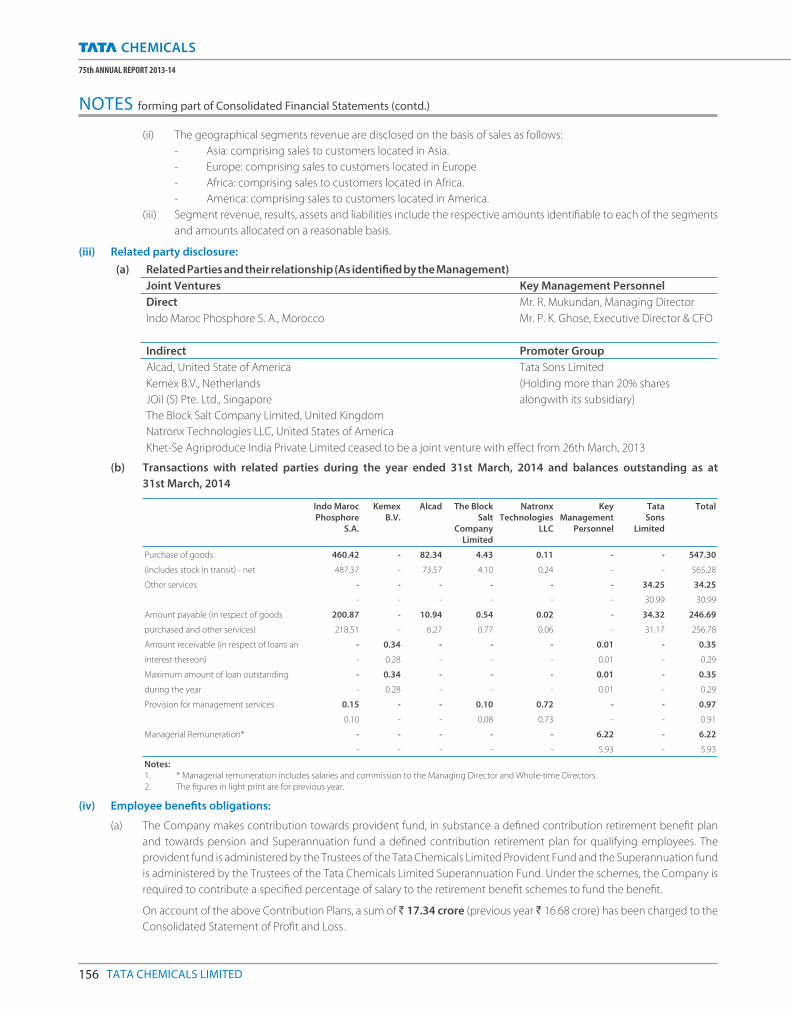
156 TATA CHEMICALS LIMITED
75th ANNUAL REPORT 2013-14
(ii) The geographical segments revenue are disclosed on the basis of sales as follows:
- Asia: comprising sales to customers located in Asia.
- Europe: comprising sales to customers located in Europe
- Africa: comprising sales to customers located in Africa.
- America: comprising sales to customers located in America.
(iii) Segment revenue, results, assets and liabilities include the respective amounts identifi able to each of the segments
and amounts allocated on a reasonable basis.
(iii) Related party disclosure:
(a) Related Parties and their relationship (As identifi ed by the Management)
Joint Ventures Key Management Personnel
Direct Mr. R. Mukundan, Managing Director
Indo Maroc Phosphore S. A., Morocco Mr. P. K. Ghose, Executive Director & CFO
Indirect Promoter Group
Alcad, United State of America Tata Sons Limited
Kemex B.V., Netherlands
JOil (S) Pte. Ltd., Singapore
The Block Salt Company Limited, United Kingdom
Natronx Technologies LLC, United States of America
(Holding more than 20% shares
alongwith its subsidiary)
Khet-Se Agriproduce India Private Limited ceased to be a joint venture with eff ect from 26th March, 2013
(b) Transactions with related parties during the year ended 31st March, 2014 and balances outstanding as at
31st March, 2014
Indo Maroc
Phosphore
S.A.
Kemex
B.V.
Alcad The Block
Salt
Company
Limited
Natronx
Technologies
LLC
Key
Management
Personnel
Tata
Sons
Limited
Total
Purchase of goods 460.42 - 82.34 4.43 0.11 - - 547.30
(includes stock in transit) - net 487.37 - 73.57 4.10 0.24 - - 565.28
Other services - - - - - - 34.25 34.25
- - - - - - 30.99 30.99
Amount payable (in respect of goods 200.87 - 10.94 0.54 0.02 - 34.32 246.69
purchased and other services) 218.51 - 6.27 0.77 0.06 - 31.17 256.78
Amount receivable (in respect of loans an - 0.34 - - - 0.01 - 0.35
interest thereon) - 0.28 - - - 0.01 - 0.29
Maximum amount of loan outstanding - 0.34 - - - 0.01 - 0.35
during the year - 0.28 - - - 0.01 - 0.29
Provision for management services 0.15 - - 0.10 0.72 - - 0.97
0.10 - - 0.08 0.73 - - 0.91
Managerial Remuneration* - - - - - 6.22 - 6.22
- - - - - 5.93 - 5.93
Notes:
1. * Managerial remuneration includes salaries and commission to the Managing Director and Whole-time Directors.
2. The fi gures in light print are for previous year.
(iv) Employee benefi ts obligations:
(a) The Company makes contribution towards provident fund, in substance a defi ned contribution retirement benefi t plan
and towards pension and Superannuation fund a defi ned contribution retirement plan for qualifying employees. The
provident fund is administered by the Trustees of the Tata Chemicals Limited Provident Fund and the Superannuation fund
is administered by the Trustees of the Tata Chemicals Limited Superannuation Fund. Under the schemes, the Company is
required to contribute a specifi ed percentage of salary to the retirement benefi t schemes to fund the benefi t.
On account of the above Contribution Plans, a sum of ` 17.34 crore (previous year ` 16.68 crore) has been charged to the
Consolidated Statement of Profi t and Loss.
NOTES forming part of Consolidated Financial Statements (contd.)
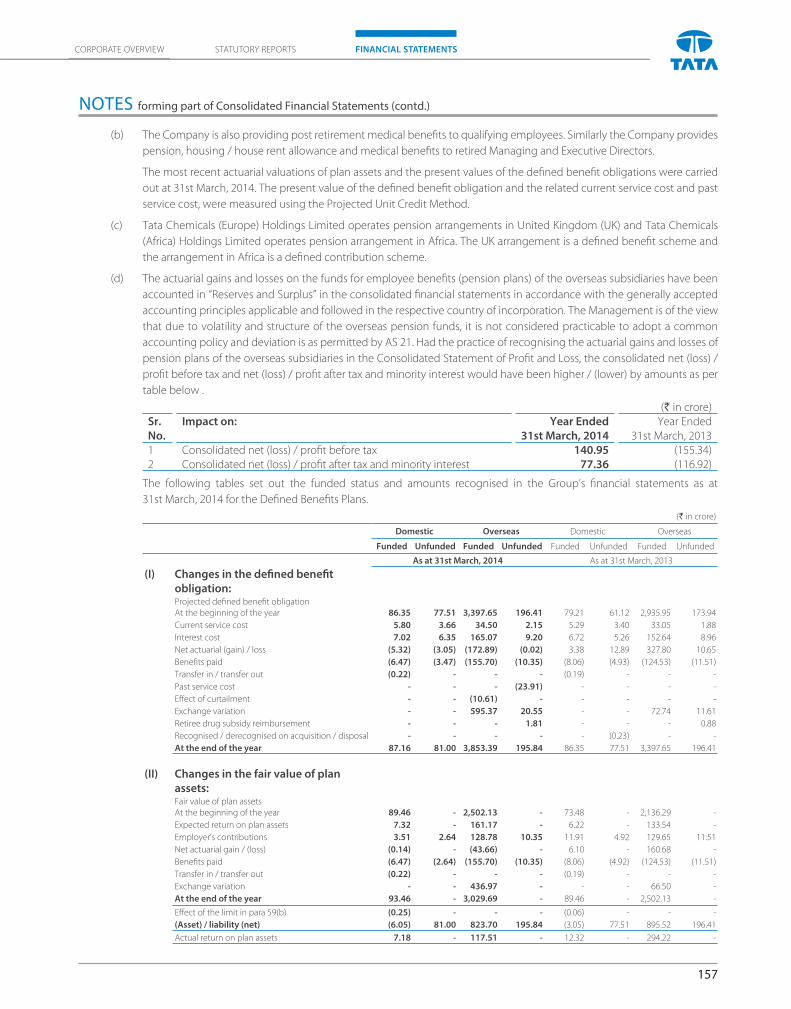
157
CORPORATE OVERVIEW FINANCIAL STATEMENTSSTATUTORY REPORTS
(b) The Company is also providing post retirement medical benefi ts to qualifying employees. Similarly the Company provides
pension, housing / house rent allowance and medical benefi ts to retired Managing and Executive Directors.
The most recent actuarial valuations of plan assets and the present values of the defi ned benefi t obligations were carried
out at 31st March, 2014. The present value of the defi ned benefi t obligation and the related current service cost and past
service cost, were measured using the Projected Unit Credit Method.
(c) Tata Chemicals (Europe) Holdings Limited operates pension arrangements in United Kingdom (UK) and Tata Chemicals
(Africa) Holdings Limited operates pension arrangement in Africa. The UK arrangement is a defi ned benefi t scheme and
the arrangement in Africa is a defi ned contribution scheme.
(d) The actuarial gains and losses on the funds for employee benefi ts (pension plans) of the overseas subsidiaries have been
accounted in “Reserves and Surplus” in the consolidated fi nancial statements in accordance with the generally accepted
accounting principles applicable and followed in the respective country of incorporation. The Management is of the view
that due to volatility and structure of the overseas pension funds, it is not considered practicable to adopt a common
accounting policy and deviation is as permitted by AS 21. Had the practice of recognising the actuarial gains and losses of
pension plans of the overseas subsidiaries in the Consolidated Statement of Profi t and Loss, the consolidated net (loss) /
profi t before tax and net (loss) / profi t after tax and minority interest would have been higher / (lower) by amounts as per
table below .
(` in crore)Sr.
No.
Impact on: Year Ended
31st March, 2014
Year Ended
31st March, 20131 Consolidated net (loss) / profi t before tax 140.95 (155.34)2 Consolidated net (loss) / profi t after tax and minority interest 77.36 (116.92)
The following tables set out the funded status and amounts recognised in the Group’s fi nancial statements as at
31st March, 2014 for the Defi ned Benefi ts Plans.
(` in crore)
Domestic Overseas Domestic Overseas
Funded Unfunded Funded Unfunded Funded Unfunded Funded Unfunded
As at 31st March, 2014 As at 31st March, 2013
(I) Changes in the defi ned benefi t
obligation:Projected defi ned benefi t obligation
At the beginning of the year 86.35 77.51 3,397.65 196.41 79.21 61.12 2,935.95 173.94
Current service cost 5.80 3.66 34.50 2.15 5.29 3.40 33.05 1.88
Interest cost 7.02 6.35 165.07 9.20 6.72 5.26 152.64 8.96
Net actuarial (gain) / loss (5.32) (3.05) (172.89) (0.02) 3.38 12.89 327.80 10.65
Benefi ts paid (6.47) (3.47) (155.70) (10.35) (8.06) (4.93) (124.53) (11.51)
Transfer in / transfer out (0.22) - - - (0.19) - - -
Past service cost - - - (23.91) - - - -
Eff ect of curtailment - - (10.61) - - - - -
Exchange variation - - 595.37 20.55 - - 72.74 11.61
Retiree drug subsidy reimbursement - - - 1.81 - - - 0.88
Recognised / derecognised on acquisition / disposal - - - - - (0.23) - -
At the end of the year 87.16 81.00 3,853.39 195.84 86.35 77.51 3,397.65 196.41
(II) Changes in the fair value of plan
assets:Fair value of plan assets
At the beginning of the year 89.46 - 2,502.13 - 73.48 - 2,136.29 -
Expected return on plan assets 7.32 - 161.17 - 6.22 - 133.54 -
Employer’s contributions 3.51 2.64 128.78 10.35 11.91 4.92 129.65 11.51
Net actuarial gain / (loss) (0.14) - (43.66) - 6.10 - 160.68 -
Benefi ts paid (6.47) (2.64) (155.70) (10.35) (8.06) (4.92) (124.53) (11.51)
Transfer in / transfer out (0.22) - - - (0.19) - - -
Exchange variation - - 436.97 - - - 66.50 -
At the end of the year 93.46 - 3,029.69 - 89.46 - 2,502.13 -
Eff ect of the limit in para 59(b) (0.25) - - - (0.06) - - -
(Asset) / liability (net) (6.05) 81.00 823.70 195.84 (3.05) 77.51 895.52 196.41
Actual return on plan assets 7.18 - 117.51 - 12.32 - 294.22 -
NOTES forming part of Consolidated Financial Statements (contd.)
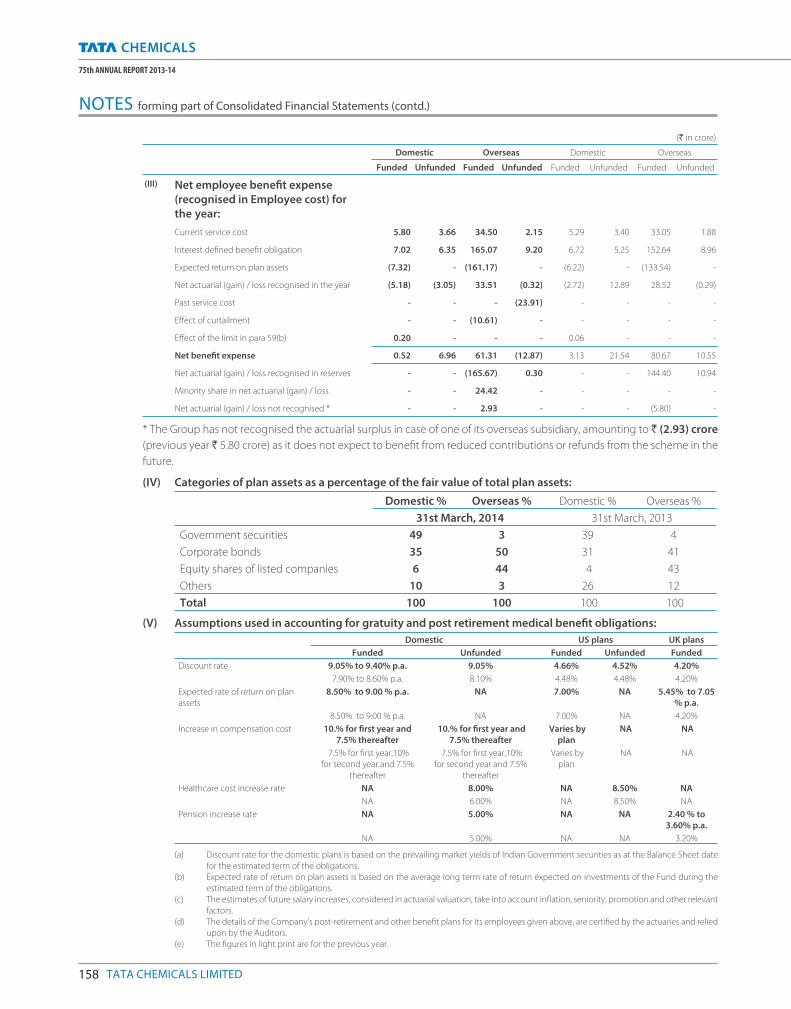
158 TATA CHEMICALS LIMITED
75th ANNUAL REPORT 2013-14
(` in crore)
Domestic Overseas Domestic Overseas
Funded Unfunded Funded Unfunded Funded Unfunded Funded Unfunded
(III) Net employee benefi t expense
(recognised in Employee cost) for
the year:
Current service cost 5.80 3.66 34.50 2.15 5.29 3.40 33.05 1.88
Interest defi ned benefi t obligation 7.02 6.35 165.07 9.20 6.72 5.25 152.64 8.96
Expected return on plan assets (7.32) - (161.17) - (6.22) - (133.54) -
Net actuarial (gain) / loss recognised in the year (5.18) (3.05) 33.51 (0.32) (2.72) 12.89 28.52 (0.29)
Past service cost - - - (23.91) - - - -
Eff ect of curtailment - - (10.61) - - - - -
Eff ect of the limit in para 59(b) 0.20 - - - 0.06 - - -
Net benefi t expense 0.52 6.96 61.31 (12.87) 3.13 21.54 80.67 10.55
Net actuarial (gain) / loss recognised in reserves - - (165.67) 0.30 - - 144.40 10.94
Minority share in net actuarial (gain) / loss - - 24.42 - - - - -
Net actuarial (gain) / loss not recognised * - - 2.93 - - - (5.80) -
* The Group has not recognised the actuarial surplus in case of one of its overseas subsidiary, amounting to ` (2.93) crore
(previous year ` 5.80 crore) as it does not expect to benefi t from reduced contributions or refunds from the scheme in the
future.
(IV) Categories of plan assets as a percentage of the fair value of total plan assets:
Domestic % Overseas % Domestic % Overseas %
31st March, 2014 31st March, 2013
Government securities 49 3 39 4
Corporate bonds 35 50 31 41
Equity shares of listed companies 6 44 4 43
Others 10 3 26 12
Total 100 100 100 100
(V) Assumptions used in accounting for gratuity and post retirement medical benefi t obligations:
Domestic US plans UK plans
Funded Unfunded Funded Unfunded Funded
Discount rate 9.05% to 9.40% p.a. 9.05% 4.66% 4.52% 4.20%
7.90% to 8.60% p.a. 8.10% 4.48% 4.48% 4.20%
Expected rate of return on plan
assets
8.50% to 9.00 % p.a. NA 7.00% NA 5.45% to 7.05
% p.a.
8.50% to 9.00 % p.a. NA 7.00% NA 4.20%
Increase in compensation cost 10.% for fi rst year and
7.5% thereafter
10.% for fi rst year and
7.5% thereafter
Varies by
plan
NA NA
7.5% for fi rst year,10%
for second year and 7.5%
thereafter
7.5% for fi rst year,10%
for second year and 7.5%
thereafter
Varies by
plan
NA NA
Healthcare cost increase rate NA 8.00% NA 8.50% NA
NA 6.00% NA 8.50% NA
Pension increase rate NA 5.00% NA NA 2.40 % to
3.60% p.a.
NA 5.00% NA NA 3.20%
(a) Discount rate for the domestic plans is based on the prevailing market yields of Indian Government securities as at the Balance Sheet date
for the estimated term of the obligations.
(b) Expected rate of return on plan assets is based on the average long term rate of return expected on investments of the Fund during the
estimated term of the obligations.
(c) The estimates of future salary increases, considered in actuarial valuation, take into account infl ation, seniority, promotion and other relevant
factors.
(d) The details of the Company’s post-retirement and other benefi t plans for its employees given above, are certifi ed by the actuaries and relied
upon by the Auditors.
(e) The fi gures in light print are for the previous year.
NOTES forming part of Consolidated Financial Statements (contd.)
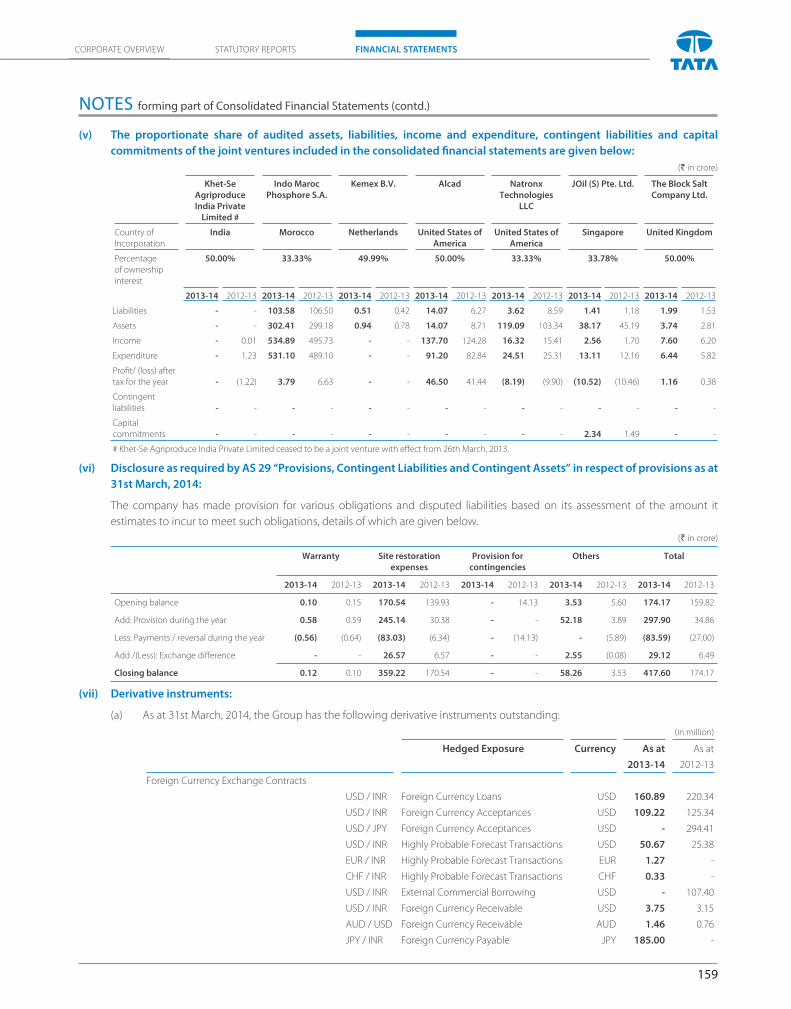
159
CORPORATE OVERVIEW FINANCIAL STATEMENTSSTATUTORY REPORTS
(v) The proportionate share of audited assets, liabilities, income and expenditure, contingent liabilities and capital
commitments of the joint ventures included in the consolidated fi nancial statements are given below:
(` in crore)
Khet-Se
Agriproduce
India Private
Limited #
Indo Maroc
Phosphore S.A.
Kemex B.V. Alcad Natronx
Technologies
LLC
JOil (S) Pte. Ltd. The Block Salt
Company Ltd.
Country of
Incorporation
India Morocco Netherlands United States of
America
United States of
America
Singapore United Kingdom
Percentage
of ownership
interest
50.00% 33.33% 49.99% 50.00% 33.33% 33.78% 50.00%
2013-14 2012-13 2013-14 2012-13 2013-14 2012-13 2013-14 2012-13 2013-14 2012-13 2013-14 2012-13 2013-14 2012-13
Liabilities - - 103.58 106.50 0.51 0.42 14.07 6.27 3.62 8.59 1.41 1.18 1.99 1.53
Assets - - 302.41 299.18 0.94 0.78 14.07 8.71 119.09 103.34 38.17 45.19 3.74 2.81
Income - 0.01 534.89 495.73 - - 137.70 124.28 16.32 15.41 2.56 1.70 7.60 6.20
Expenditure - 1.23 531.10 489.10 - - 91.20 82.84 24.51 25.31 13.11 12.16 6.44 5.82
Profi t/ (loss) after
tax for the year - (1.22) 3.79 6.63 - - 46.50 41.44 (8.19) (9.90) (10.52) (10.46) 1.16 0.38
Contingent
liabilities - - - - - - - - - - - - - -
Capital
commitments - - - - - - - - - - 2.34 1.49 - -
# Khet-Se Agriproduce India Private Limited ceased to be a joint venture with eff ect from 26th March, 2013.
(vi) Disclosure as required by AS 29 “Provisions, Contingent Liabilities and Contingent Assets” in respect of provisions as at
31st March, 2014:
The company has made provision for various obligations and disputed liabilities based on its assessment of the amount it
estimates to incur to meet such obligations, details of which are given below.
(` in crore)
Warranty Site restoration
expenses
Provision for
contingencies
Others Total
2013-14 2012-13 2013-14 2012-13 2013-14 2012-13 2013-14 2012-13 2013-14 2012-13
Opening balance 0.10 0.15 170.54 139.93 - 14.13 3.53 5.60 174.17 159.82
Add: Provision during the year 0.58 0.59 245.14 30.38 - - 52.18 3.89 297.90 34.86
Less: Payments / reversal during the year (0.56) (0.64) (83.03) (6.34) - (14.13) - (5.89) (83.59) (27.00)
Add /(Less): Exchange diff erence - - 26.57 6.57 - - 2.55 (0.08) 29.12 6.49
Closing balance 0.12 0.10 359.22 170.54 - - 58.26 3.53 417.60 174.17
(vii) Derivative instruments:
(a) As at 31st March, 2014, the Group has the following derivative instruments outstanding:
(in million)
Hedged Exposure Currency
As at
2013-14
As at
2012-13
Foreign Currency Exchange Contracts
USD / INR Foreign Currency Loans USD 160.89 220.34
USD / INR Foreign Currency Acceptances USD 109.22 125.34
USD / JPY Foreign Currency Acceptances USD - 294.41
USD / INR Highly Probable Forecast Transactions USD 50.67 25.38
EUR / INR Highly Probable Forecast Transactions EUR 1.27 -
CHF / INR Highly Probable Forecast Transactions CHF 0.33 -
USD / INR External Commercial Borrowing USD - 107.40
USD / INR Foreign Currency Receivable USD 3.75 3.15
AUD / USD Foreign Currency Receivable AUD 1.46 0.76
JPY / INR Foreign Currency Payable JPY 185.00 -
NOTES forming part of Consolidated Financial Statements (contd.)
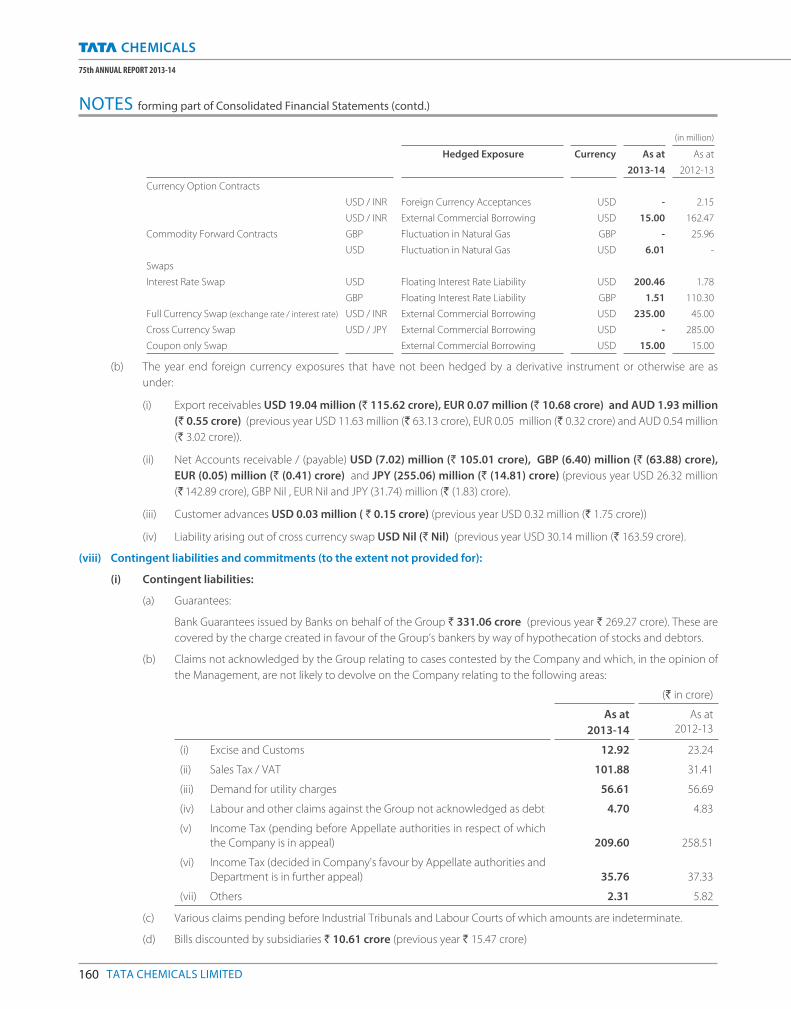
160 TATA CHEMICALS LIMITED
75th ANNUAL REPORT 2013-14
(in million)
Hedged Exposure Currency
As at
2013-14
As at
2012-13
Currency Option Contracts
USD / INR Foreign Currency Acceptances USD - 2.15
USD / INR External Commercial Borrowing USD 15.00 162.47
Commodity Forward Contracts GBP Fluctuation in Natural Gas GBP - 25.96
USD Fluctuation in Natural Gas USD 6.01 -
Swaps
Interest Rate Swap USD Floating Interest Rate Liability USD 200.46 1.78
GBP Floating Interest Rate Liability GBP 1.51 110.30
Full Currency Swap (exchange rate / interest rate) USD / INR External Commercial Borrowing USD 235.00 45.00
Cross Currency Swap USD / JPY External Commercial Borrowing USD - 285.00
Coupon only Swap External Commercial Borrowing USD 15.00 15.00
(b) The year end foreign currency exposures that have not been hedged by a derivative instrument or otherwise are as
under:
(i) Export receivables USD 19.04 million (` 115.62 crore), EUR 0.07 million (` 10.68 crore) and AUD 1.93 million
(` 0.55 crore) (previous year USD 11.63 million (` 63.13 crore), EUR 0.05 million (` 0.32 crore) and AUD 0.54 million
(` 3.02 crore)).
(ii) Net Accounts receivable / (payable) USD (7.02) million (` 105.01 crore), GBP (6.40) million (` (63.88) crore),
EUR (0.05) million (` (0.41) crore) and JPY (255.06) million (` (14.81) crore) (previous year USD 26.32 million
(` 142.89 crore), GBP Nil , EUR Nil and JPY (31.74) million (` (1.83) crore).
(iii) Customer advances USD 0.03 million ( ` 0.15 crore) (previous year USD 0.32 million (` 1.75 crore))
(iv) Liability arising out of cross currency swap USD Nil (` Nil) (previous year USD 30.14 million (` 163.59 crore).
(viii) Contingent liabilities and commitments (to the extent not provided for):
(i) Contingent liabilities:
(a) Guarantees:
Bank Guarantees issued by Banks on behalf of the Group ` 331.06 crore (previous year ` 269.27 crore). These are
covered by the charge created in favour of the Group’s bankers by way of hypothecation of stocks and debtors.
(b) Claims not acknowledged by the Group relating to cases contested by the Company and which, in the opinion of
the Management, are not likely to devolve on the Company relating to the following areas:
(` in crore)
As at
2013-14
As at
2012-13
(i) Excise and Customs 12.92 23.24
(ii) Sales Tax / VAT 101.88 31.41
(iii) Demand for utility charges 56.61 56.69
(iv) Labour and other claims against the Group not acknowledged as debt 4.70 4.83
(v) Income Tax (pending before Appellate authorities in respect of which
the Company is in appeal) 209.60 258.51
(vi) Income Tax (decided in Company's favour by Appellate authorities and
Department is in further appeal) 35.76 37.33
(vii) Others 2.31 5.82
(c) Various claims pending before Industrial Tribunals and Labour Courts of which amounts are indeterminate.
(d) Bills discounted by subsidiaries ` 10.61 crore (previous year ` 15.47 crore)
NOTES forming part of Consolidated Financial Statements (contd.)
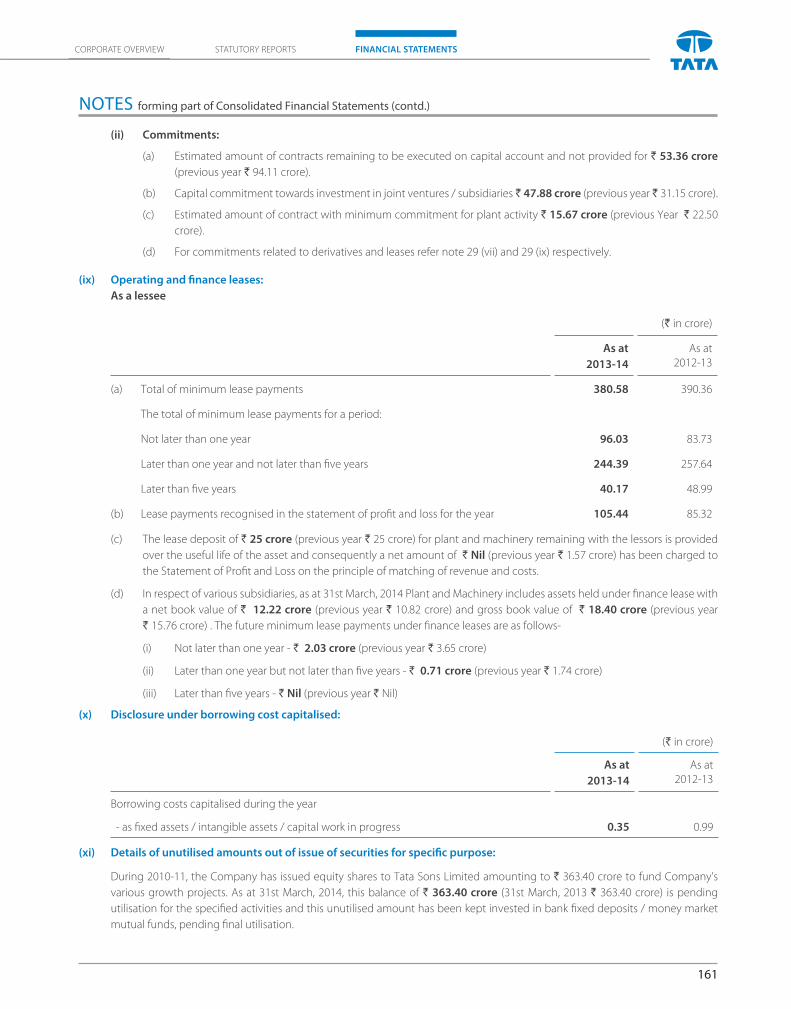
161
CORPORATE OVERVIEW FINANCIAL STATEMENTSSTATUTORY REPORTS
(ii) Commitments:
(a) Estimated amount of contracts remaining to be executed on capital account and not provided for ` 53.36 crore
(previous year ` 94.11 crore).
(b) Capital commitment towards investment in joint ventures / subsidiaries ` 47.88 crore (previous year ` 31.15 crore).
(c) Estimated amount of contract with minimum commitment for plant activity ` 15.67 crore (previous Year ` 22.50
crore).
(d) For commitments related to derivatives and leases refer note 29 (vii) and 29 (ix) respectively.
(ix) Operating and fi nance leases:
As a lessee
(` in crore)
As at
2013-14
As at
2012-13
(a) Total of minimum lease payments 380.58 390.36
The total of minimum lease payments for a period:
Not later than one year 96.03 83.73
Later than one year and not later than fi ve years 244.39 257.64
Later than fi ve years 40.17 48.99
(b) Lease payments recognised in the statement of profi t and loss for the year 105.44 85.32
(c) The lease deposit of ` 25 crore (previous year ` 25 crore) for plant and machinery remaining with the lessors is provided
over the useful life of the asset and consequently a net amount of ` Nil (previous year ` 1.57 crore) has been charged to
the Statement of Profi t and Loss on the principle of matching of revenue and costs.
(d) In respect of various subsidiaries, as at 31st March, 2014 Plant and Machinery includes assets held under fi nance lease with
a net book value of ` 12.22 crore (previous year ` 10.82 crore) and gross book value of ` 18.40 crore (previous year
` 15.76 crore) . The future minimum lease payments under fi nance leases are as follows-
(i) Not later than one year - ` 2.03 crore (previous year ` 3.65 crore)
(ii) Later than one year but not later than fi ve years - ` 0.71 crore (previous year ` 1.74 crore)
(iii) Later than fi ve years - ` Nil (previous year ` Nil)
(x) Disclosure under borrowing cost capitalised:
(` in crore)
As at
2013-14
As at
2012-13
Borrowing costs capitalised during the year
- as fi xed assets / intangible assets / capital work in progress 0.35 0.99
(xi) Details of unutilised amounts out of issue of securities for specifi c purpose:
During 2010-11, the Company has issued equity shares to Tata Sons Limited amounting to ` 363.40 crore to fund Company’s
various growth projects. As at 31st March, 2014, this balance of ` 363.40 crore (31st March, 2013 ` 363.40 crore) is pending
utilisation for the specifi ed activities and this unutilised amount has been kept invested in bank fi xed deposits / money market
mutual funds, pending fi nal utilisation.
NOTES forming part of Consolidated Financial Statements (contd.)
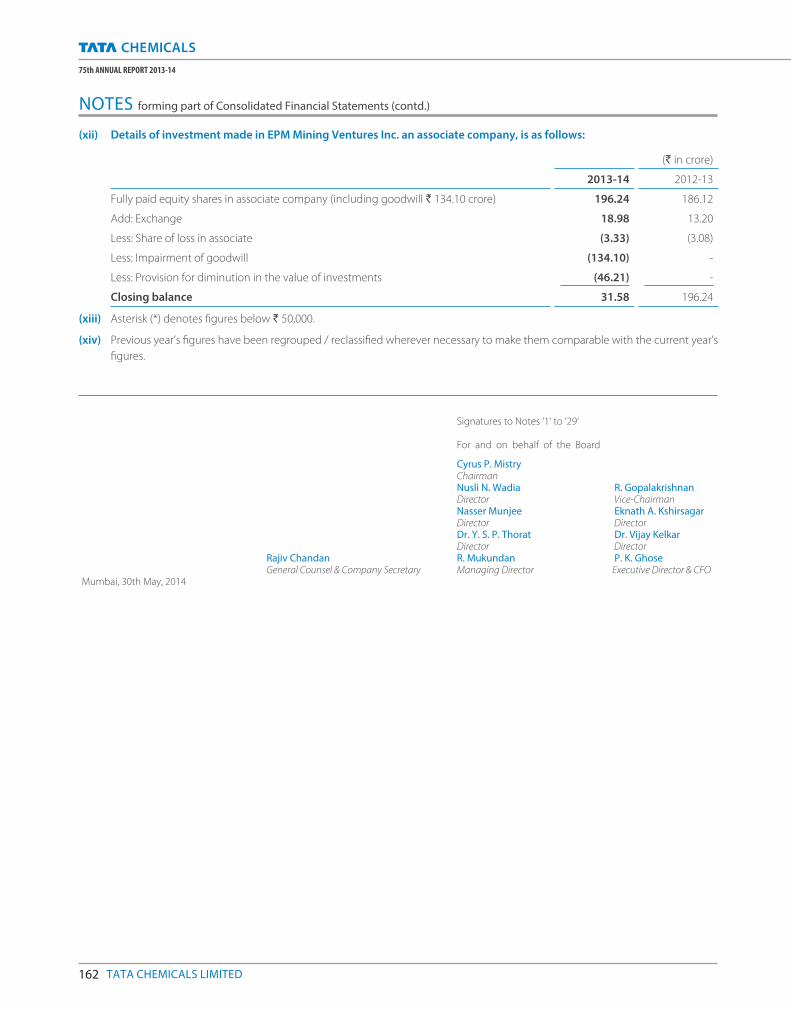
162 TATA CHEMICALS LIMITED
75th ANNUAL REPORT 2013-14
(xii) Details of investment made in EPM Mining Ventures Inc. an associate company, is as follows:
(` in crore)
2013-14 2012-13
Fully paid equity shares in associate company (including goodwill ` 134.10 crore) 196.24 186.12
Add: Exchange 18.98 13.20
Less: Share of loss in associate (3.33) (3.08)
Less: Impairment of goodwill (134.10) -
Less: Provision for diminution in the value of investments (46.21) -
Closing balance 31.58 196.24
(xiii) Asterisk (*) denotes fi gures below ` 50,000.
(xiv) Previous year’s fi gures have been regrouped / reclassifi ed wherever necessary to make them comparable with the current year’s
fi gures.
Signatures to Notes ‘1‘ to ‘29‘
For and on behalf of the Board
Cyrus P. Mistry Chairman Nusli N. Wadia R. Gopalakrishnan Director Vice-Chairman Nasser Munjee Eknath A. Kshirsagar Director Director Dr. Y. S. P. Thorat Dr. Vijay Kelkar Director Director
Rajiv Chandan R. Mukundan P. K. Ghose General Counsel & Company Secretary Managing Director Executive Director & CFO
Mumbai, 30th May, 2014
NOTES forming part of Consolidated Financial Statements (contd.)
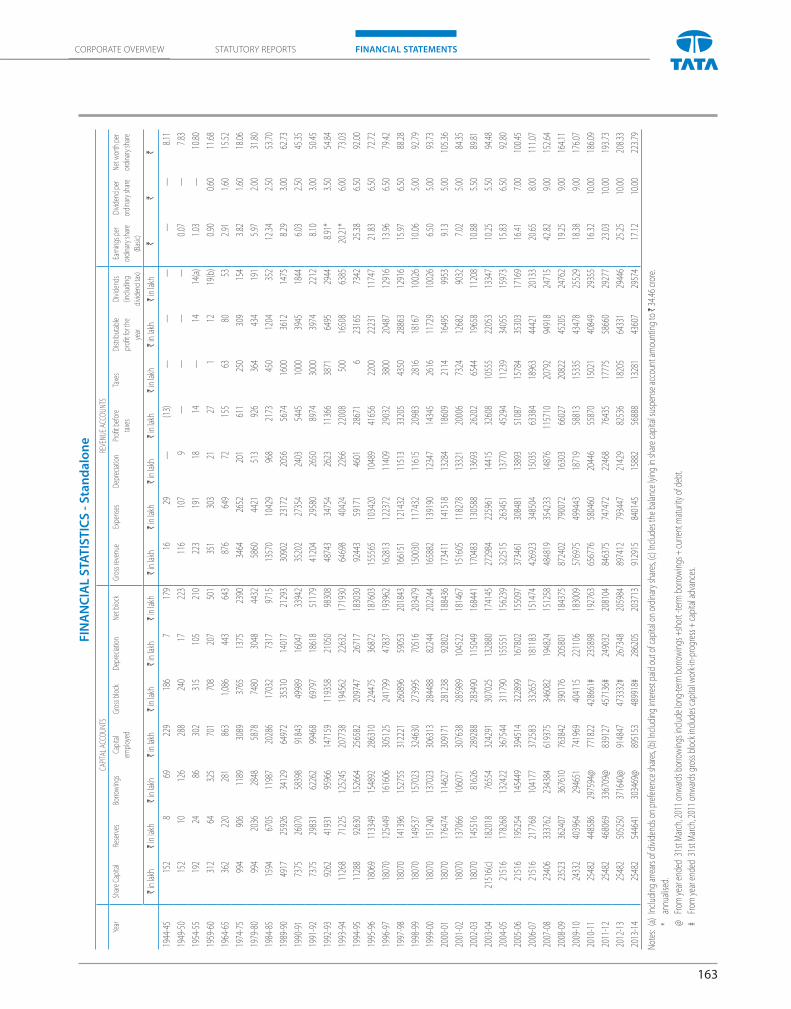
163
CORPORATE OVERVIEW FINANCIAL STATEMENTSSTATUTORY REPORTS
FIN
AN
CIA
L S
TAT
IST
ICS
- S
tan
da
lon
e
CAPI
TAL
ACCO
UNTS
REVE
NUE
ACCO
UNTS
Year
Shar
e Ca
pita
lRe
serv
esBo
rrow
ings
Capi
tal
empl
oyed
Gros
s blo
ckD
epre
ciat
ion
Net b
lock
Gros
s rev
enue
Expe
nses
Dep
reci
atio
nPr
ofi t
befo
re
taxe
s
Taxe
sD
istrib
utab
le
profi
t fo
r the
year
Div
iden
ds
(incl
udin
g
divi
dend
tax)
Earn
ings
per
ordi
nary
shar
e
(Bas
ic)
Div
iden
d pe
r
ordi
nary
shar
e
Net w
orth
per
ordi
nary
shar
e
` in
lakh
`
in la
kh
` in
lakh
`
in la
kh
` in
lakh
`
in la
kh
` in
lakh
`
in la
kh
` in
lakh
`
in la
kh
` in
lakh
`
in la
kh
` in
lakh
`
in la
kh
``
`
1944
-45
152
8
6
9 2
29
186
7
1
79
16
29
—
(13)
—
—
—
—
—
8.1
1
1949
-50
152
1
0 1
26
288
2
40
17
223
1
16
107
9
—
—
—
—
0
.07
—
7.8
3
1954
-55
192
2
4 8
6 3
02
315
1
05
210
2
23
191
1
8 1
4 —
1
4 1
4(a)
1
.03
—
10.
80
1959
-60
312
6
4 3
25
701
7
08
207
5
01
351
3
03
21
27
1
12
19(
b)
0.9
0 0
.60
11.
68
1964
-65
362
2
20
281
8
63
1,0
86
443
6
43
876
6
49
72
155
6
3 8
0 5
3 2
.91
1.6
0 1
5.52
1974
-75
994
906
1189
3089
3765
1375
2390
3464
2652
201
611
250
309
154
3.8
2 1
.60
18.
06
1979
-80
994
2036
2848
5878
7480
3048
4432
5860
4421
513
926
364
434
191
5.9
7 2
.00
31.
80
1984
-85
1594
6705
1198
720
286
1703
273
1797
1513
570
1042
996
821
7345
012
0435
2 1
2.34
2
.50
53.
70
1989
-90
4917
2592
634
129
6497
235
310
1401
721
293
3090
223
172
2056
5674
1600
3612
1475
8.2
9 3
.00
62.
73
1990
-91
7375
2607
058
398
9184
349
989
1604
733
942
3520
227
354
2403
5445
1000
3945
1844
6.0
3 2
.50
45.
35
1991
-92
7375
2983
162
262
9946
869
797
1861
851
179
4120
429
580
2650
8974
3000
3974
2212
8.1
0 3
.00
50.
45
1992
-93
9262
4193
195
966
1471
5911
9358
2105
098
308
4874
334
754
2623
1136
638
7164
9529
44 8
.91*
3
.50
54.
84
1993
-94
1126
871
225
1252
4520
7738
1945
6222
632
1719
3064
698
4042
422
6622
008
500
1650
863
85 2
0.21
* 6
.00
73.
03
1994
-95
1128
892
630
1526
6425
6582
2097
4726
717
1830
3092
443
5917
146
0128
671
623
165
7342
25.
38
6.5
0 9
2.00
1995
-96
1806
911
3349
1548
9228
6310
2244
7536
872
1876
0315
5565
1034
2010
489
4165
622
0022
231
1174
7 2
1.83
6
.50
72.
72
1996
-97
1807
012
5449
1616
0630
5125
2417
9947
837
1939
6216
2813
1223
7211
409
2903
238
0020
487
1291
6 1
3.96
6
.50
79.
42
1997
-98
1807
014
1396
1527
5531
2221
2608
9659
053
2018
4316
6151
1214
3211
513
3320
543
5028
863
1291
6 1
5.97
6
.50
88.
28
1998
-99
1807
014
9537
1570
2332
4630
2739
9570
516
2034
7915
0030
1174
3211
615
2098
328
1618
167
1002
6 1
0.06
5
.00
92.
79
1999
-00
1807
015
1240
1370
2330
6313
2844
8882
244
2022
4416
5882
1391
9012
347
1434
526
1611
729
1002
6 6
.50
5.0
0 9
3.73
2000
-01
1807
017
6474
1146
2730
9171
2812
3892
802
1884
3617
3411
1415
1813
284
1860
921
1416
495
9953
9.1
3 5
.00
105
.36
2001
-02
1807
013
7066
1060
7130
7638
2859
8910
4522
1814
6715
1605
1182
7813
321
2000
673
2412
682
9032
7.0
2 5
.00
84.
35
2002
-03
1807
014
5516
8162
628
9288
2834
9011
5049
1684
4117
0483
1305
8813
693
2620
265
4419
658
1120
8 1
0.88
5
.50
89.
81
2003
-04
2151
6(c)
1820
1876
554
3242
9130
7025
1328
8017
4145
2729
8422
5961
1441
532
608
1055
522
053
1334
7 1
0.25
5
.50
94.
48
2004
-05
2151
617
8268
1324
2236
7544
3117
9015
5551
1562
3932
2515
2634
5113
770
4529
411
239
3405
515
973
15.
83
6.5
0 9
2.80
2005
-06
2151
619
5254
1454
4939
4514
3228
9916
7802
1550
9737
3461
3084
8113
893
5108
715
784
3530
317
169
16.
41
7.0
0 1
00.4
5
2006
-07
2151
621
7768
1041
7737
2583
3326
5718
1183
1514
7442
6923
3485
0415
035
6338
418
963
4442
120
133
20.
65
8.0
0 1
11.0
7
2007
-08
2340
633
3762
2343
8461
9375
3460
8219
4824
1512
5848
4819
3542
3314
876
1157
1020
792
9491
824
715
42.
82
9.0
0 1
52.6
4
2008
-09
2352
336
2407
3676
1076
3842
3901
7620
5801
1843
7587
2402
7900
7216
303
6602
720
822
4520
524
762
19.
25
9.0
0 1
64.1
1
2009
-10
2433
240
3964
2946
5174
1969
4041
1522
1106
1830
0957
6975
4994
4318
719
5881
315
335
4347
825
529
18.
38
9.0
0 1
76.0
7
2010
-11
2548
244
8586
2975
94@
7718
2242
8661
#23
5898
1927
6365
6776
5804
6020
446
5587
015
021
4084
929
355
16.
32
10.
00
186
.09
2011
-12
2548
246
8069
3367
09@
8391
2745
7136
#24
9032
2081
0484
6375
7474
7222
468
7643
517
775
5866
029
277
23.
03
10.
00
193
.73
2012
-13
2548
250
5250
3716
40@
9148
4747
3332
#26
7348
2059
8489
7412
7934
4721
429
8253
618
205
6433
129
446
25.
25
10.
00
208
.33
2013
-14
2548
254
4641
3034
69@
8951
5348
9918
#28
6205
2037
1391
2915
8401
4515
882
5688
813
281
4360
729
574
17.
12
10.
00
223
.79
Note
s: (a
) In
clud
ing
arre
ars o
f div
iden
ds o
n pr
efer
ence
shar
es, (
b) In
clud
ing
inte
rest
pai
d ou
t of c
apita
l on
ordi
nary
shar
es, (
c) In
clud
es th
e ba
lanc
e ly
ing
in sh
are
capi
tal s
uspe
nse
acco
unt a
mou
ntin
g to
` 3
4.46
cro
re.
*
annu
alise
d.
@
Fr
om y
ear e
nded
31s
t Mar
ch, 2
011
onw
ards
bor
row
ings
incl
ude
long
-term
bor
row
ings
+sh
ort -
term
bor
row
ings
+ c
urre
nt m
atur
ity o
f deb
t.
#
From
yea
r end
ed 3
1st M
arch
, 201
1 on
war
ds g
ross
blo
ck in
clud
es c
apita
l wor
k-in
-pro
gres
s + c
apita
l adv
ance
s.
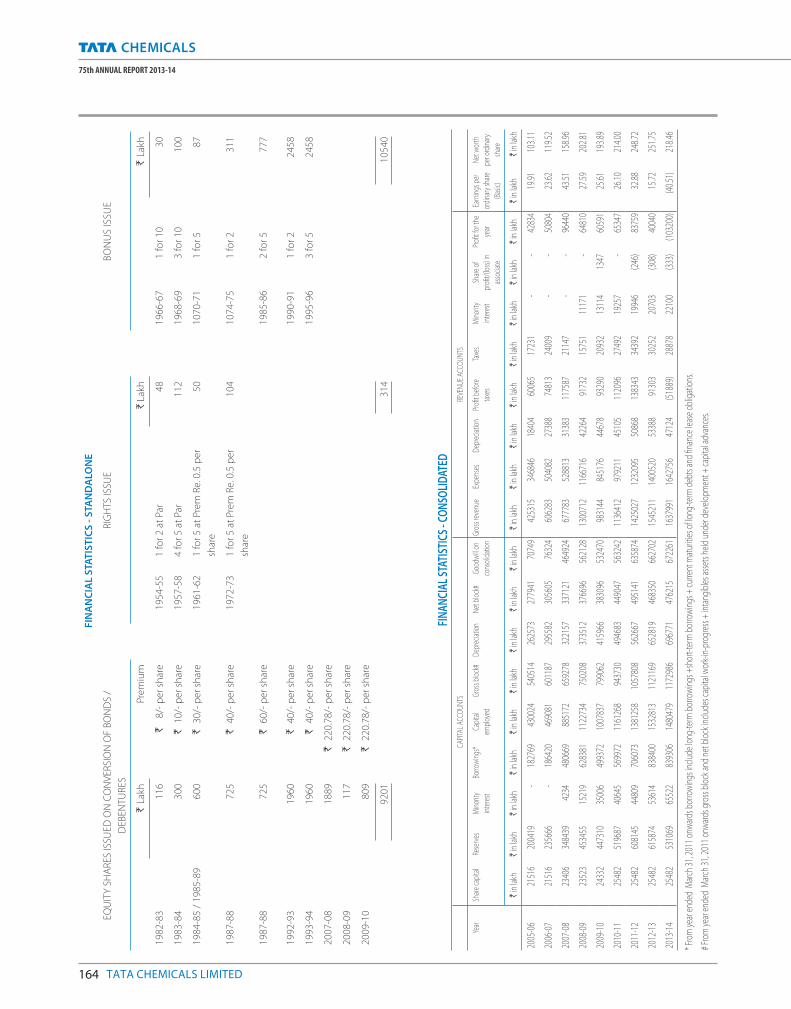
164 TATA CHEMICALS LIMITED
75th ANNUAL REPORT 2013-14
FIN
AN
CIA
L S
TAT
IST
ICS
- S
TAN
DA
LON
E
EQU
ITY
SH
AR
ES IS
SUED
ON
CO
NV
ERSI
ON
OF
BO
ND
S /
DEB
ENTU
RES
RIG
HTS
ISSU
EB
ON
US
ISS
UE
` La
khP
rem
ium
` La
kh`
Lakh
19
82
-83
11
6`
8/-
pe
r sh
are
19
54
-55
1 fo
r 2
at
Par
48
19
66
-67
1 fo
r 1
03
0
19
83
-84
30
0`
10
/- p
er
shar
e1
95
7-5
84
for
5 a
t Pa
r1
12
19
68
-69
3 fo
r 1
01
00
19
84
-85
/ 1
98
5-8
96
00
` 3
0/-
pe
r sh
are
19
61
-62
1 fo
r 5
at
Pre
m R
e. 0
.5 p
er
shar
e
50
10
70
-71
1 fo
r 5
87
19
87
-88
72
5`
40
/- p
er
shar
e1
97
2-7
31
for
5 a
t P
rem
Re.
0.5
pe
r
shar
e
10
41
07
4-7
51
for
23
11
19
87
-88
72
5`
60
/- p
er
shar
e1
98
5-8
62
for
57
77
19
92
-93
19
60
` 4
0/-
pe
r sh
are
19
90
-91
1 fo
r 2
24
58
19
93
-94
19
60
` 4
0/-
pe
r sh
are
19
95
-96
3 fo
r 5
24
58
20
07
-08
18
89
` 2
20
.78
/- p
er
shar
e
20
08
-09
11
7`
22
0.7
8/-
pe
r sh
are
20
09
-10
80
9`
22
0.7
8/-
pe
r sh
are
92
01
31
41
05
40
FIN
ANCI
AL S
TATI
STIC
S - C
ON
SOLI
DAT
EDCA
PITA
L AC
COUN
TSRE
VENU
E AC
COUN
TS
Year
Shar
e ca
pita
lRe
serv
esM
inor
ity
inte
rest
Borro
win
gs*
Capi
tal
empl
oyed
Gros
s blo
ck#
Dep
reci
atio
nNe
t blo
ck#
Good
will
on
cons
olid
atio
n
Gros
s rev
enue
Expe
nses
Dep
reci
atio
nPr
ofi t
befo
re
taxe
s
Taxe
sM
inor
ity
inte
rest
Shar
e of
profi
t/(lo
ss) i
n
asso
ciat
e
Profi
t fo
r the
year
Earn
ings
per
ordi
nary
shar
e
(Bas
ic)
Net w
orth
per o
rdin
ary
shar
e
` in
lakh
`
in la
kh
` in
lakh
` in
lakh
`
in la
kh
` in
lakh
`
in la
kh
` in
lakh
`
in la
kh
` in
lakh
`
in la
kh
` in
lakh
`
in la
kh
` in
lakh
`
in la
kh`
in la
kh
` in
lakh
` in
lakh
` in
lakh
2005
-06
2151
620
0419
- 18
2769
4300
2454
0514
2625
7327
7941
7074
942
5315
3468
4618
404
6006
517
231
- -
4283
419
.91
103.
11
2006
-07
2151
623
5666
- 18
6420
4690
8160
1187
2955
8230
5605
7632
460
6283
5040
8227
388
7481
324
009
- -
5080
423
.62
119.
52
2007
-08
2340
634
8439
4234
4806
6988
5172
6592
7832
2157
3371
2146
4924
6777
8352
8813
3138
311
7587
2114
7 -
- 96
440
43.5
115
8.96
2008
-09
2352
345
3455
1521
962
8381
1122
734
7502
0837
3512
3766
9656
2128
1300
712
1166
716
4226
491
732
1575
111
171
- 64
810
27.5
920
2.81
2009
-10
2433
244
7310
3500
649
9372
1007
837
7990
6241
5966
3830
9653
2470
9831
4484
5176
4467
893
290
2093
213
114
1347
6059
125
.61
193.
89
2010
-11
2548
251
9687
4064
556
9972
1161
268
9437
3049
4683
4490
4756
3242
1136
412
9792
1145
105
1120
9627
492
1925
7 -
6534
726
.10
214.
00
2011
-12
2548
260
8145
4480
970
6073
1381
258
1057
808
5626
6749
5141
6358
7414
2502
712
3209
550
868
1383
4334
392
1994
6 (2
46)
8375
932
.88
248.
72
2012
-13
2548
261
5874
5361
483
8400
1532
813
1121
169
6528
1946
8350
6627
0215
4521
114
0052
053
388
9130
330
252
2070
3 (3
08)
4004
015
.72
251.
75
2013
-14
2548
253
1069
6552
283
9306
1480
479
1172
986
6967
7147
6215
6722
6116
3799
116
4275
647
124
(518
89)
2887
822
100
(333
)(1
0320
0)(4
0.51
)21
8.46
* Fro
m y
ear e
nded
Mar
ch 3
1, 2
011
onw
ards
bor
row
ings
incl
ude
long
-term
bor
row
ings
+sh
ort-t
erm
bor
row
ings
+ c
urre
nt m
atur
ities
of l
ong-
term
deb
ts a
nd fi
nanc
e le
ase
oblig
atio
ns.
# Fr
om y
ear e
nded
Mar
ch 3
1, 2
011
onw
ards
gro
ss b
lock
and
net
blo
ck in
clud
es c
apita
l wor
k-in
-pro
gres
s + in
tang
ible
s ass
ets h
eld
unde
r dev
elop
men
t + c
apita
l adv
ance
s.

Notes

Notes
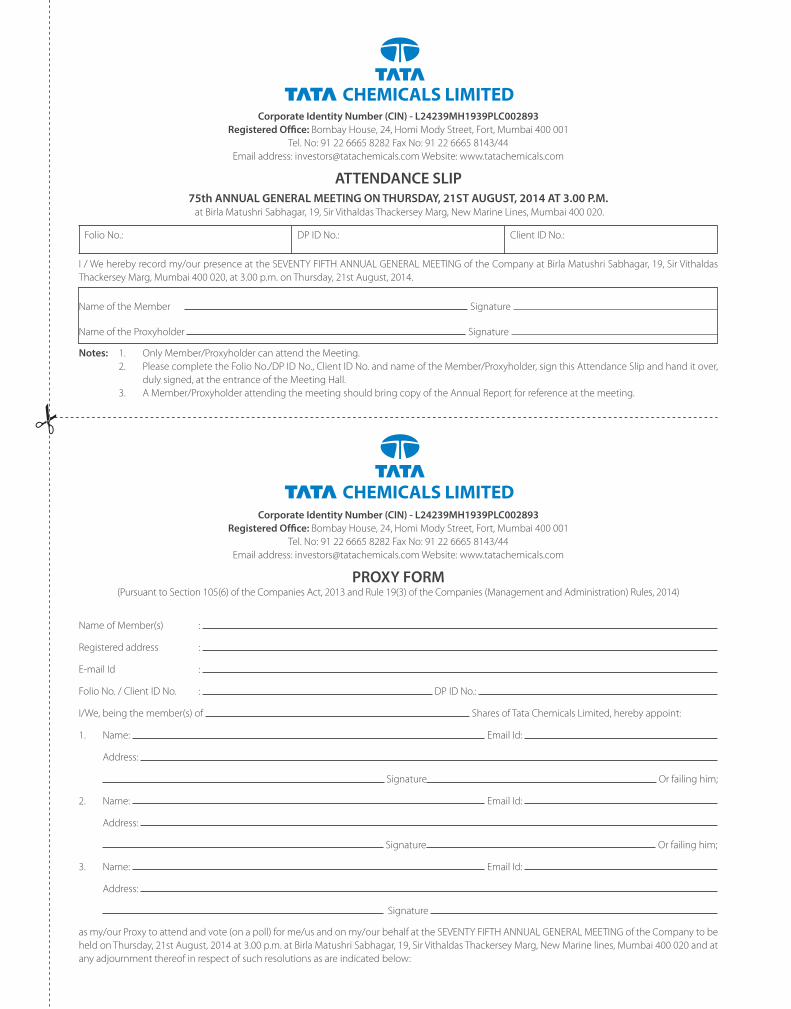
Corporate Identity Number (CIN) - L24239MH1939PLC002893
Registered Office: Bombay House, 24, Homi Mody Street, Fort, Mumbai 400 001
Tel. No: 91 22 6665 8282 Fax No: 91 22 6665 8143/44
Email address: [email protected] Website: www.tatachemicals.com
ATTENDANCE SLIP75th ANNUAL GENERAL MEETING ON THURSDAY, 21ST AUGUST, 2014 AT 3.00 P.M. at Birla Matushri Sabhagar, 19, Sir Vithaldas Thackersey Marg, New Marine Lines, Mumbai 400 020.
Folio No.: DP ID No.: Client ID No.:
I / We hereby record my/our presence at the SEVENTY FIFTH ANNUAL GENERAL MEETING of the Company at Birla Matushri Sabhagar, 19, Sir Vithaldas
Thackersey Marg, Mumbai 400 020, at 3.00 p.m. on Thursday, 21st August, 2014.
Name of the Member Signature
Name of the Proxyholder Signature
Notes: 1. Only Member/Proxyholder can attend the Meeting.
2. Please complete the Folio No./DP ID No., Client ID No. and name of the Member/Proxyholder, sign this Attendance Slip and hand it over,
duly signed, at the entrance of the Meeting Hall.
3. A Member/Proxyholder attending the meeting should bring copy of the Annual Report for reference at the meeting.
Corporate Identity Number (CIN) - L24239MH1939PLC002893
Registered Office: Bombay House, 24, Homi Mody Street, Fort, Mumbai 400 001
Tel. No: 91 22 6665 8282 Fax No: 91 22 6665 8143/44
Email address: [email protected] Website: www.tatachemicals.com
PROXY FORM(Pursuant to Section 105(6) of the Companies Act, 2013 and Rule 19(3) of the Companies (Management and Administration) Rules, 2014)
Name of Member(s) :
Registered address :
E-mail Id :
Folio No. / Client ID No. : DP ID No.:
I/We, being the member(s) of Shares of Tata Chemicals Limited, hereby appoint:
1. Name: Email Id:
Address:
Signature Or failing him;
2. Name: Email Id:
Address:
Signature Or failing him;
3. Name: Email Id:
Address:
Signature
as my/our Proxy to attend and vote (on a poll) for me/us and on my/our behalf at the SEVENTY FIFTH ANNUAL GENERAL MEETING of the Company to be
held on Thursday, 21st August, 2014 at 3.00 p.m. at Birla Matushri Sabhagar, 19, Sir Vithaldas Thackersey Marg, New Marine lines, Mumbai 400 020 and at
any adjournment thereof in respect of such resolutions as are indicated below:
�
Sr. No. Resolutions
1. Adoption of Statement of Profi t and Loss, Balance Sheet, Reports of Board of Directors and Auditors for the year ended
31st March, 2014
2. Declaration of dividend on Ordinary Shares for the Financial Year 2013 – 14
3. Re-appointment of Mr. R. Gopalakrishnan, who retires by rotation
4. Appoint Auditors and fi x their remuneration
5. Appointment of Mr. Nusli Wadia as an Independent Director of the Company
6. Appointment of Mr. Nasser Munjee as an Independent Director of the Company
7. Appointment of Mr. Eknath Kshirsagar as an Independent Director of the Company
8. Appointment of Dr. Y. S. P. Thorat as an Independent Director of the Company
9. Appointment of Dr. Vijay Kelkar as an Independent Director of the Company
10. Re-appointment of Mr. R. Mukundan as Managing Director of the Company
11. Re-appointment of Mr. P. K. Ghose as an Executive Director and CFO of the Company
12. Ratifi cation of Remuneration of Cost Auditors
13. Approve borrowing limits of the Company
14. Creation of Charge on the assets of the Company
15. Off er or invitation to subscribe to Non-Convertible Debentures on Private Placement
Signed this day of 2014
Signature of the shareholder Signature of Proxyholder(s)
Note: 1. This Form in order to be eff ective should be duly completed and deposited at the Registered Offi ce of the Company at Bombay House, 24,
Homi Mody Street, Fort, Mumbai 400 001, not less than 48 hours before the commencement of the Meeting.
2. A proxy need not be a member of the Company.
3. For the Resolutions, Explanatory Statement and Notes, please refer to the Notice of the SEVENTY FIFTH ANNUAL GENERAL MEETING of the
Company.
Affi x
Revenue
Stamp
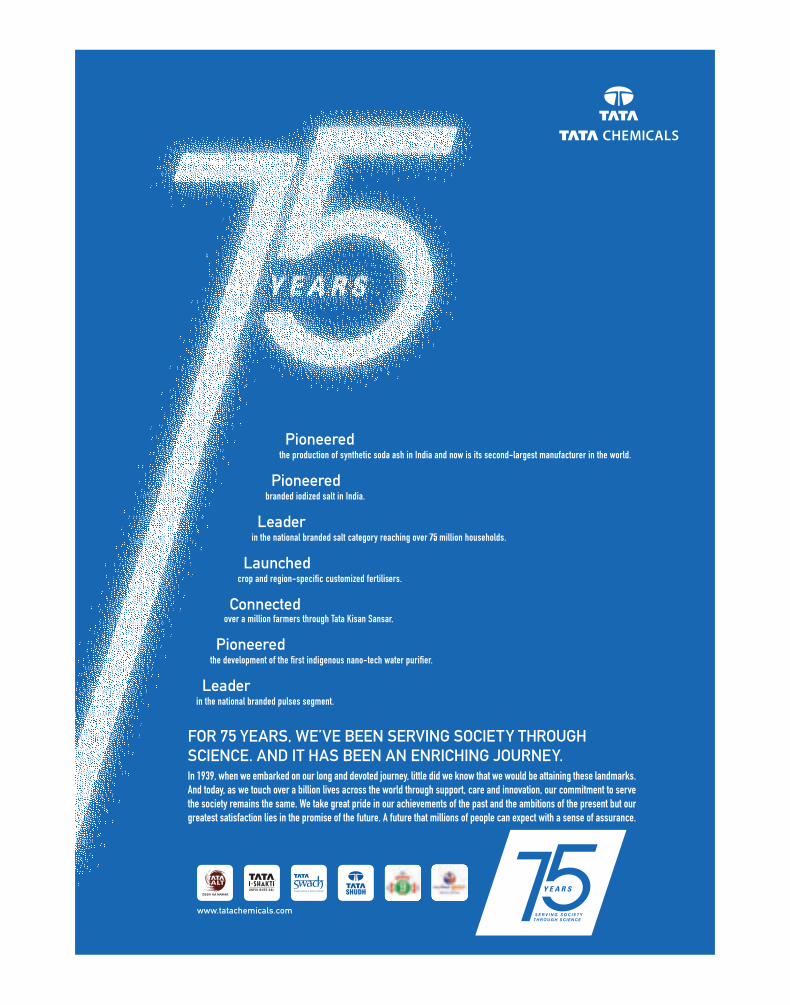
CHEMICALS LIMITEDRegistered Office:Bombay House, 24, Homi Mody Street, Fort, Mumbai 400001 IndiaT: +91 22 6665 8282 F: +91 22 6665 8143/44www.tatachemicals.com CIN: L24239MH1939PLC002893
www.humantouchofchemistry.com www.tcsrd.comwww.facebook.com/TataChemicals www.facebook.com/humantouchofchemistry