Embed Size (px)
Citation preview
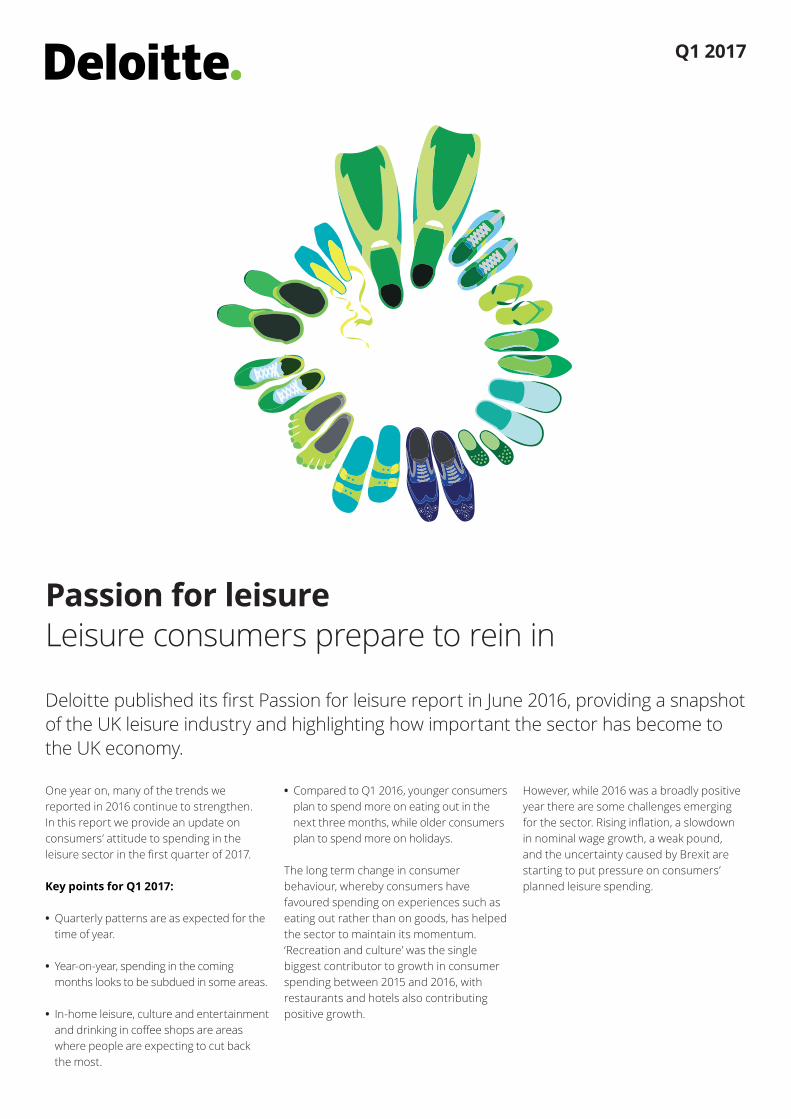
Passion for leisureLeisure consumers prepare to rein in
Deloitte published its first Passion for leisure report in June 2016, providing a snapshot of the UK leisure industry and highlighting how important the sector has become to the UK economy.
One year on, many of the trends we reported in 2016 continue to strengthen. In this report we provide an update on consumers’ attitude to spending in the leisure sector in the first quarter of 2017.
Key points for Q1 2017:
• Quarterly patterns are as expected for the time of year.
• Year‑on‑year, spending in the coming months looks to be subdued in some areas.
• In‑home leisure, culture and entertainment and drinking in coffee shops are areas where people are expecting to cut back the most.
• Compared to Q1 2016, younger consumers plan to spend more on eating out in the next three months, while older consumers plan to spend more on holidays.
The long term change in consumer behaviour, whereby consumers have favoured spending on experiences such as eating out rather than on goods, has helped the sector to maintain its momentum. ‘Recreation and culture’ was the single biggest contributor to growth in consumer spending between 2015 and 2016, with restaurants and hotels also contributing positive growth.
However, while 2016 was a broadly positive year there are some challenges emerging for the sector. Rising inflation, a slowdown in nominal wage growth, a weak pound, and the uncertainty caused by Brexit are starting to put pressure on consumers’ planned leisure spending.
Q1 2017
Are consumers reluctant to sacrifice
the pub andeating out?
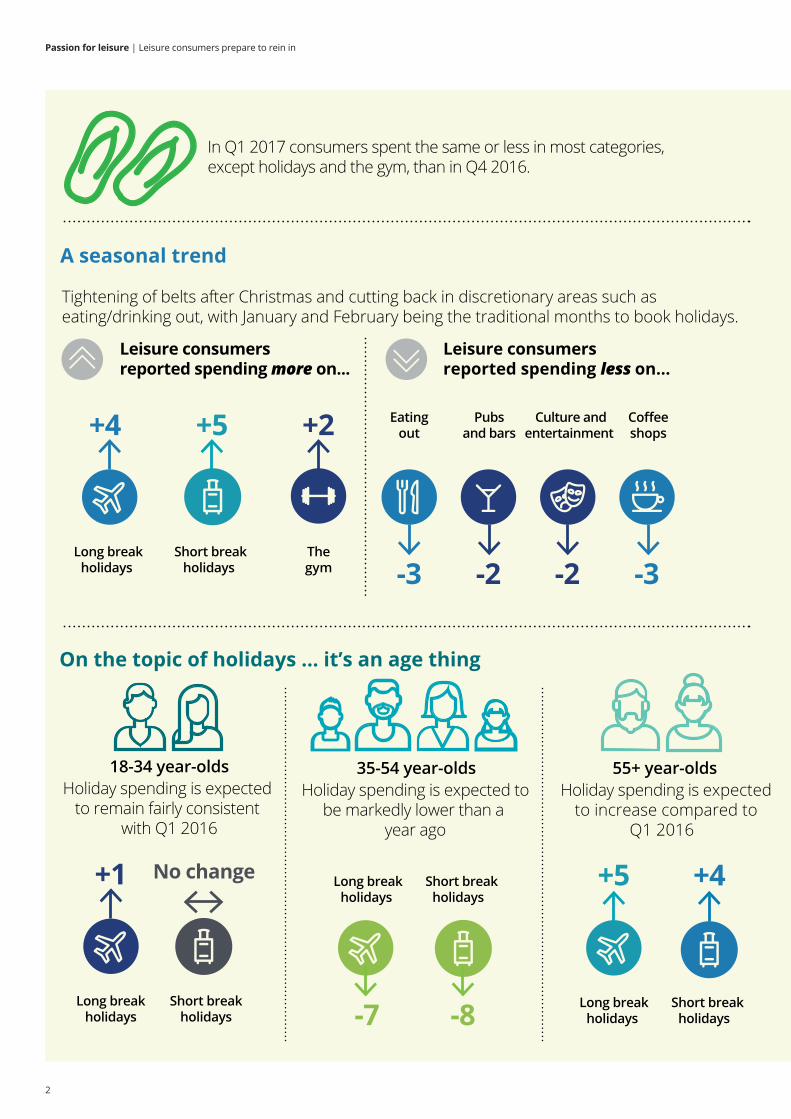
A seasonal trend
In Q1 2017 consumers spent the same or less in most categories,except holidays and the gym, than in Q4 2016.
Short breakholidays
Long breakholidays
Tightening of belts after Christmas and cutting back in discretionary areas such as eating/drinking out, with January and February being the traditional months to book holidays.
Leisure consumersreported spending more on...
Leisure consumersreported spending less on...
Long breakholidays
+4 +5 +2 Eatingout
-3
Coffeeshops
-3
Pubsand bars
-2
Culture andentertainment
-2
On the topic of holidays ... it’s an age thing
18-34 year-oldsHoliday spending is expected
to remain fairly consistent with Q1 2016
Holiday spending is expected tobe markedly lower than a
year ago
35-54 year-olds 55+ year-oldsHoliday spending is expected
to increase compared toQ1 2016
Long break holidays
+1
Short break holidays
No change Long breakholidays
Short breakholidays
-8
+5 +4
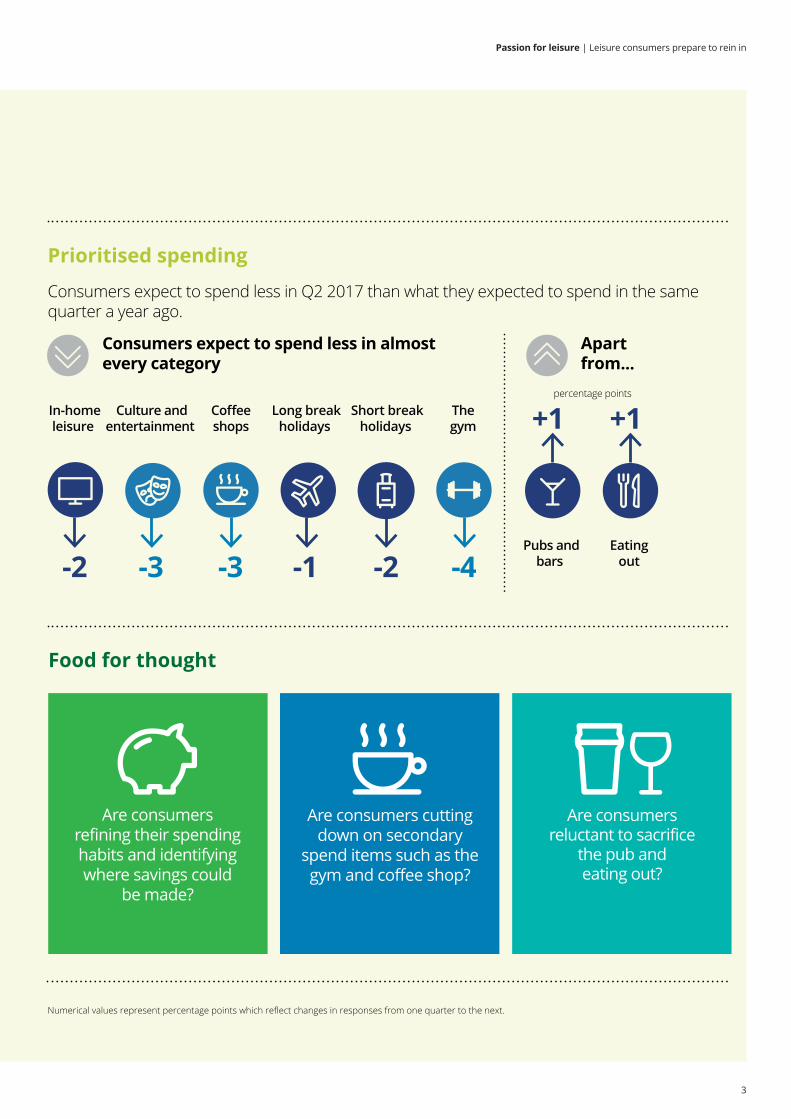
Prioritised spending
Consumers expect to spend less in Q2 2017 than what they expected to spend in the same quarter a year ago.
Consumers expect to spend less in almost every category
Apartfrom...
Food for thought
Numerical values represent percentage points which reflect changes in responses from one quarter to the next.-7
Short breakholidays
Thegym
In-homeleisure
-2
Long breakholidays
-1
Culture andentertainment
-3
Coffeeshops
-3
Short breakholidays
-2
Thegym
-4Pubs and
bars
+1 percentage points
Eatingout
+1
Are consumers refining their spendinghabits and identifyingwhere savings could
be made?
Are consumers cuttingdown on secondary
spend items such as thegym and coffee shop?
2
Passion for leisure | Leisure consumers prepare to rein in
Are consumers reluctant to sacrifice
the pub andeating out?
A seasonal trend
In Q1 2017 consumers spent the same or less in most categories,except holidays and the gym, than in Q4 2016.
Short breakholidays
Long breakholidays
Tightening of belts after Christmas and cutting back in discretionary areas such as eating/drinking out, with January and February being the traditional months to book holidays.
Leisure consumersreported spending more on...
Leisure consumersreported spending less on...
Long breakholidays
+4 +5 +2 Eatingout
-3
Coffeeshops
-3
Pubsand bars
-2
Culture andentertainment
-2
On the topic of holidays ... it’s an age thing
18-34 year-oldsHoliday spending is expected
to remain fairly consistent with Q1 2016
Holiday spending is expected tobe markedly lower than a
year ago
35-54 year-olds 55+ year-oldsHoliday spending is expected
to increase compared toQ1 2016
Long break holidays
+1
Short break holidays
No change Long breakholidays
Short breakholidays
-8
+5 +4
Prioritised spending
Consumers expect to spend less in Q2 2017 than what they expected to spend in the same quarter a year ago.
Consumers expect to spend less in almost every category
Apartfrom...
Food for thought
Numerical values represent percentage points which reflect changes in responses from one quarter to the next.-7
Short breakholidays
Thegym
In-homeleisure
-2
Long breakholidays
-1
Culture andentertainment
-3
Coffeeshops
-3
Short breakholidays
-2
Thegym
-4Pubs and
bars
+1 percentage points
Eatingout
+1
Are consumers refining their spendinghabits and identifyingwhere savings could
be made?
Are consumers cuttingdown on secondary
spend items such as thegym and coffee shop?
3
Passion for leisure | Leisure consumers prepare to rein in
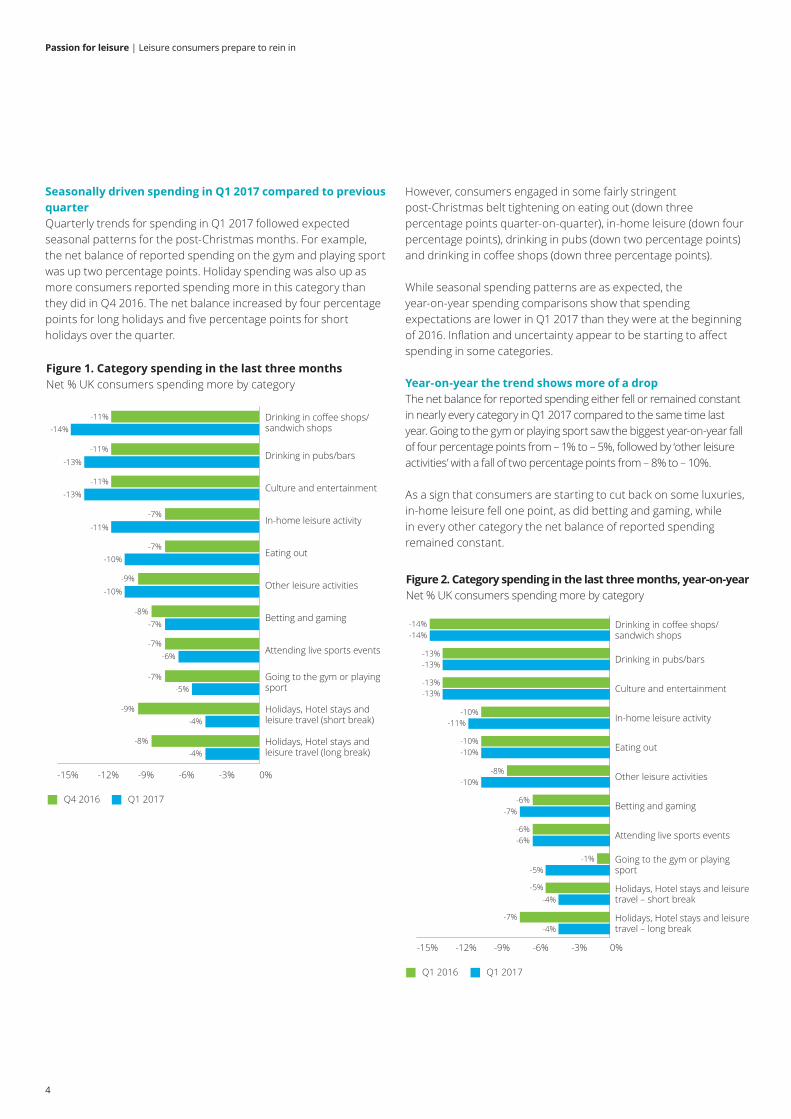
Seasonally driven spending in Q1 2017 compared to previous quarterQuarterly trends for spending in Q1 2017 followed expected seasonal patterns for the post‑Christmas months. For example, the net balance of reported spending on the gym and playing sport was up two percentage points. Holiday spending was also up as more consumers reported spending more in this category than they did in Q4 2016. The net balance increased by four percentage points for long holidays and five percentage points for short holidays over the quarter.
Figure 1. Category spending in the last three monthsNet % UK consumers spending more by category
-15% -12% -9% -6% -3% 0%
Holidays, Hotel stays andleisure travel (long break)
Holidays, Hotel stays andleisure travel (short break)
Going to the gym or playingsport
Attending live sports events
Betting and gaming
Other leisure activities
Eating out
In-home leisure activity
Culture and entertainment
Drinking in pubs/bars
Drinking in coffee shops/sandwich shops
Q4 2016 Q1 2017
-14%
-13%
-13%
-11%
-11%
-11%
-11%
-10%
-10%
-8%
-8%
-9%
-9%
-6%
-4%
-4%
-5%
-7%
-7%
-7%
-7%
-7%
Figure 2. Category spending in the last three months, year-on-yearNet % UK consumers spending more by category
-15% -12% -9% -6% -3% 0%
Holidays, Hotel stays and leisure travel – long break
Holidays, Hotel stays and leisure travel – short break
Going to the gym or playing sport
Attending live sports events
Betting and gaming
Other leisure activities
Eating out
In-home leisure activity
Culture and entertainment
Drinking in pubs/bars
Drinking in coffee shops/sandwich shops
Q1 2016 Q1 2017
-14%-14%
-13%-13%
-13%-13%
-10%-11%
-10%-10%
-10%-8%
-6%
-1%
-6%-6%
-5%
-5%-4%
-4%
-7%
-7%
However, consumers engaged in some fairly stringent post‑Christmas belt tightening on eating out (down three percentage points quarter‑on‑quarter), in‑home leisure (down four percentage points), drinking in pubs (down two percentage points) and drinking in coffee shops (down three percentage points).
While seasonal spending patterns are as expected, the year‑on‑year spending comparisons show that spending expectations are lower in Q1 2017 than they were at the beginning of 2016. Inflation and uncertainty appear to be starting to affect spending in some categories.
Year‑on‑year the trend shows more of a dropThe net balance for reported spending either fell or remained constant in nearly every category in Q1 2017 compared to the same time last year. Going to the gym or playing sport saw the biggest year‑on‑year fall of four percentage points from – 1% to – 5%, followed by ‘other leisure activities’ with a fall of two percentage points from – 8% to – 10%.
As a sign that consumers are starting to cut back on some luxuries, in‑home leisure fell one point, as did betting and gaming, while in every other category the net balance of reported spending remained constant.
4
Passion for leisure | Leisure consumers prepare to rein in
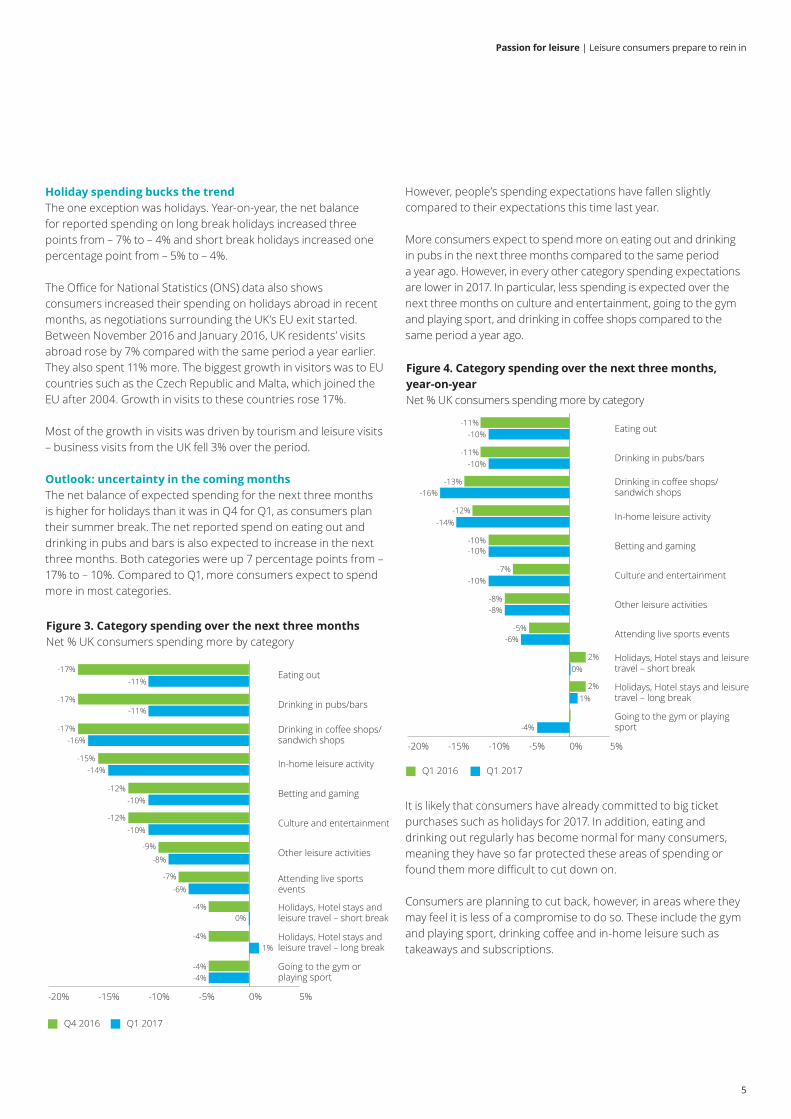
Figure 3. Category spending over the next three months Net % UK consumers spending more by category
-20% -15% -10% -5% 0% 5%
Going to the gym or playing sport
Holidays, Hotel stays and leisure travel – long break
Holidays, Hotel stays and leisure travel – short break
Attending live sports events
Other leisure activities
Culture and entertainment
Betting and gaming
In-home leisure activity
Drinking in coffee shops/sandwich shops
Drinking in pubs/bars
Eating out
Q1 2017
-11%
-11%
-10%
-10%
-7%
-4%
-4%
-4%-4%
1%
-6%
0%
-9%
-8%
-12%
-12%
-15%-14%
-17%
-17%
-17%-16%
Q4 2016
Figure 4. Category spending over the next three months, year-on-year Net % UK consumers spending more by category
-20% -15% -10% -5% 0% 5%
Going to the gym or playing sport
Holidays, Hotel stays and leisure travel – long break
Holidays, Hotel stays and leisure travel – short break
Attending live sports events
Other leisure activities
Culture and entertainment
Betting and gaming
In-home leisure activity
Drinking in coffee shops/sandwich shops
Drinking in pubs/bars
Eating out
Q1 2016 Q1 2017
-11%-10%
-11%-10%
-13%
-14%
-10%
-10%
-10%
-7%
-8%
-5%
-4%
2%
2%
0%
1%
-8%
-6%
-12%
-16%
Holiday spending bucks the trendThe one exception was holidays. Year‑on‑year, the net balance for reported spending on long break holidays increased three points from – 7% to – 4% and short break holidays increased one percentage point from – 5% to – 4%.
The Office for National Statistics (ONS) data also shows consumers increased their spending on holidays abroad in recent months, as negotiations surrounding the UK’s EU exit started. Between November 2016 and January 2016, UK residents’ visits abroad rose by 7% compared with the same period a year earlier. They also spent 11% more. The biggest growth in visitors was to EU countries such as the Czech Republic and Malta, which joined the EU after 2004. Growth in visits to these countries rose 17%.
Most of the growth in visits was driven by tourism and leisure visits – business visits from the UK fell 3% over the period.
Outlook: uncertainty in the coming monthsThe net balance of expected spending for the next three months is higher for holidays than it was in Q4 for Q1, as consumers plan their summer break. The net reported spend on eating out and drinking in pubs and bars is also expected to increase in the next three months. Both categories were up 7 percentage points from – 17% to – 10%. Compared to Q1, more consumers expect to spend more in most categories.
However, people’s spending expectations have fallen slightly compared to their expectations this time last year.
More consumers expect to spend more on eating out and drinking in pubs in the next three months compared to the same period a year ago. However, in every other category spending expectations are lower in 2017. In particular, less spending is expected over the next three months on culture and entertainment, going to the gym and playing sport, and drinking in coffee shops compared to the same period a year ago.
It is likely that consumers have already committed to big ticket purchases such as holidays for 2017. In addition, eating and drinking out regularly has become normal for many consumers, meaning they have so far protected these areas of spending or found them more difficult to cut down on.
Consumers are planning to cut back, however, in areas where they may feel it is less of a compromise to do so. These include the gym and playing sport, drinking coffee and in‑home leisure such as takeaways and subscriptions.
5
Passion for leisure | Leisure consumers prepare to rein in
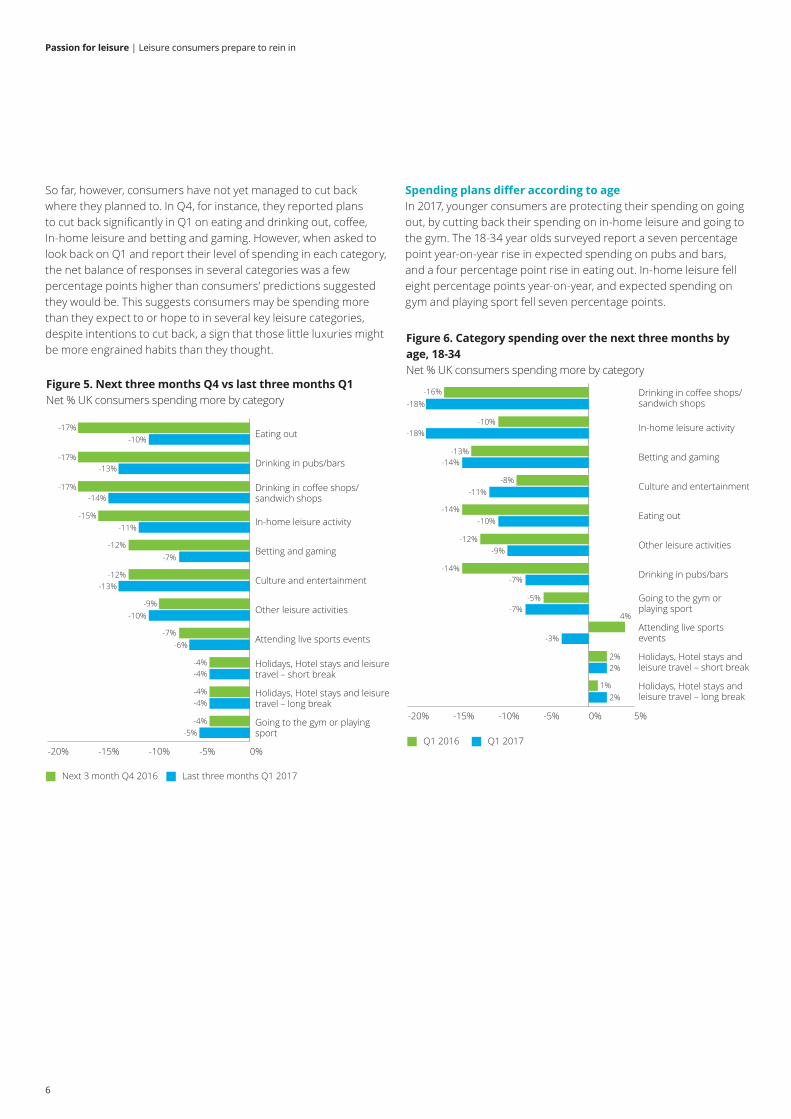
Spending plans differ according to ageIn 2017, younger consumers are protecting their spending on going out, by cutting back their spending on in‑home leisure and going to the gym. The 18‑34 year olds surveyed report a seven percentage point year‑on‑year rise in expected spending on pubs and bars, and a four percentage point rise in eating out. In‑home leisure fell eight percentage points year‑on‑year, and expected spending on gym and playing sport fell seven percentage points.
Figure 5. Next three months Q4 vs last three months Q1 Net % UK consumers spending more by category
-20% -15% -10% -5% 0%
Going to the gym or playing sport
Holidays, Hotel stays and leisure travel – long break
Holidays, Hotel stays and leisure travel – short break
Attending live sports events
Other leisure activities
Culture and entertainment
Betting and gaming
In-home leisure activity
Drinking in coffee shops/sandwich shops
Drinking in pubs/bars
Eating out
Next 3 month Q4 2016 Last three months Q1 2017
-17%
-17%
-17%
-10%
-10%
-11%
-12%
-12%
-7%
-7%-6%
-4%-4%
-4%-4%
-4%-5%
-9%
-13%
-13%
-14%
-15%
Figure 6. Category spending over the next three months by age, 18-34 Net % UK consumers spending more by category
-20% -15% -10% -5% 0% 5%
Holidays, Hotel stays and leisure travel – long break
Holidays, Hotel stays and leisure travel – short break
Attending live sports events
Going to the gym or playing sport
Drinking in pubs/bars
Other leisure activities
Eating out
Culture and entertainment
Betting and gaming
In-home leisure activity
Drinking in coffee shops/sandwich shops
Q1 2016 Q1 2017
-16%
-18%
-18%
-10%
-10%
-9%
-8%
-7%
-7%-5%
-3%
4%
2%
1%2%
2%
-11%
-12%
-13%
-14%
-14%
-14%
So far, however, consumers have not yet managed to cut back where they planned to. In Q4, for instance, they reported plans to cut back significantly in Q1 on eating and drinking out, coffee, In‑home leisure and betting and gaming. However, when asked to look back on Q1 and report their level of spending in each category, the net balance of responses in several categories was a few percentage points higher than consumers’ predictions suggested they would be. This suggests consumers may be spending more than they expect to or hope to in several key leisure categories, despite intentions to cut back, a sign that those little luxuries might be more engrained habits than they thought.
6
Passion for leisure | Leisure consumers prepare to rein in
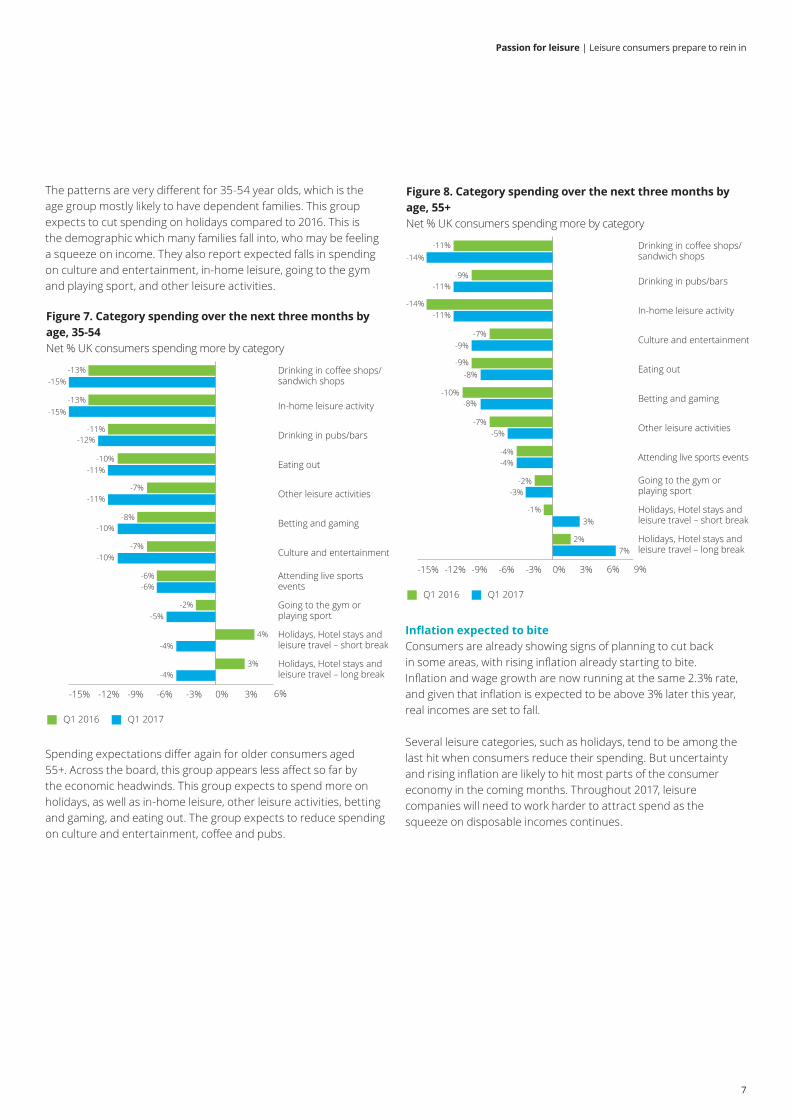
Figure 8. Category spending over the next three months by age, 55+ Net % UK consumers spending more by category
-15% -12% -9% -6% -3% 0% 3% 6% 9%
Holidays, Hotel stays and leisure travel – long break
Holidays, Hotel stays and leisure travel – short break
Going to the gym or playing sport
Attending live sports events
Other leisure activities
Betting and gaming
Eating out
Culture and entertainment
In-home leisure activity
Drinking in pubs/bars
Drinking in coffee shops/sandwich shops
Q1 2016 Q1 2017
-11%
-11%-9%
-9%
-9%
-7%
-8%
-8%
-7%-5%
-4%-4%
-2%-3%
-1%3%
2%7%
-11%
-10%
-14%
-14%
Figure 7. Category spending over the next three months by age, 35-54 Net % UK consumers spending more by category
-15% -12% -9% -6% -3% 0% 3% 6%
Holidays, Hotel stays and leisure travel – long break
Holidays, Hotel stays and leisure travel – short break
Going to the gym or playing sport
Attending live sports events
Culture and entertainment
Betting and gaming
Other leisure activities
Eating out
Drinking in pubs/bars
In-home leisure activity
Drinking in coffee shops/sandwich shops
Q1 2016 Q1 2017
-13%
-13%
-11%
-11%
-12%
-10%
-10%
-10%
-7%
-8%
-7%
-6%-6%
-2%-5%
-4%4%
3%-4%
-11%
-15%
-15%
The patterns are very different for 35‑54 year olds, which is the age group mostly likely to have dependent families. This group expects to cut spending on holidays compared to 2016. This is the demographic which many families fall into, who may be feeling a squeeze on income. They also report expected falls in spending on culture and entertainment, in‑home leisure, going to the gym and playing sport, and other leisure activities.
Spending expectations differ again for older consumers aged 55+. Across the board, this group appears less affect so far by the economic headwinds. This group expects to spend more on holidays, as well as in‑home leisure, other leisure activities, betting and gaming, and eating out. The group expects to reduce spending on culture and entertainment, coffee and pubs.
Inflation expected to biteConsumers are already showing signs of planning to cut back in some areas, with rising inflation already starting to bite. Inflation and wage growth are now running at the same 2.3% rate, and given that inflation is expected to be above 3% later this year, real incomes are set to fall.
Several leisure categories, such as holidays, tend to be among the last hit when consumers reduce their spending. But uncertainty and rising inflation are likely to hit most parts of the consumer economy in the coming months. Throughout 2017, leisure companies will need to work harder to attract spend as the squeeze on disposable incomes continues.
7
Passion for leisure | Leisure consumers prepare to rein in

Deloitte refers to one or more of Deloitte Touche Tohmatsu Limited (“DTTL”), a UK private company limited by guarantee, and its network of member firms, each of which is a legally separate and independent entity. Please see www.deloitte.co.uk/about for a detailed description of the legal structure of DTTL and its member firms.
Deloitte LLP is the United Kingdom member firm of DTTL.
This publication has been written in general terms and therefore cannot be relied on to cover specific situations; application of the principles set out will depend upon the particular circumstances involved and we recommend that you obtain professional advice before acting or refraining from acting on any of the contents of this publication. Deloitte LLP would be pleased to advise readers on how to apply the principles set out in this publication to their specific circumstances. Deloitte LLP accepts no duty of care or liability for any loss occasioned to any person acting or refraining from action as a result of any material in this publication.
© 2017 Deloitte LLP. All rights reserved.
Deloitte LLP is a limited liability partnership registered in England and Wales with registered number OC303675 and its registered office at 2 New Street Square, London EC4A 3BZ, United Kingdom. Tel: +44 (0) 20 7936 3000 Fax: +44 (0) 20 7583 1198.
Designed and produced by The Creative Studio at Deloitte, London. J12092
Contacts
Simon OatenPartnerHospitality & Leisure020 7007 [email protected]
Alistair PritchardPartnerTravel & Aviation07710 [email protected]
Ed JenkinsDirectorHospitality & Leisure020 7007 [email protected]