Embed Size (px)
Citation preview
Muon radiography of the Puy de Dôme: status and prospects
Pasquale Noli1 on behalf of the MURAVES collaboration
INTERNATIONAL WORKSHOP ON MUON & GEO-RADIATION PHYSICS FOR EARTH STUDIES
Tokyo November 12 2014
1 INFN-Naples Italy

Summury● Puy de Dome measurement campaign.● Analysis status:
● Statistic; ● Tracking algorithm.
● Results:● Transmission measurement;● comparison w.r.t Monte Carlo.

Puy de Dome
At present, resistive and gravimetry tomography have already been extensively applied on the Puy de Dôme.Both techniques confirm that the dome has a complex internal structure. The presence of large zones of low resistivity agrees with the assumed presence of a significant amount of water in porous altered lava. High resistivity domains fit with older basaltic cones covered by Puy de Dôme products, which existence was already demonstrated by field observation.
Didier Miallier et all.IAVCEI 2013
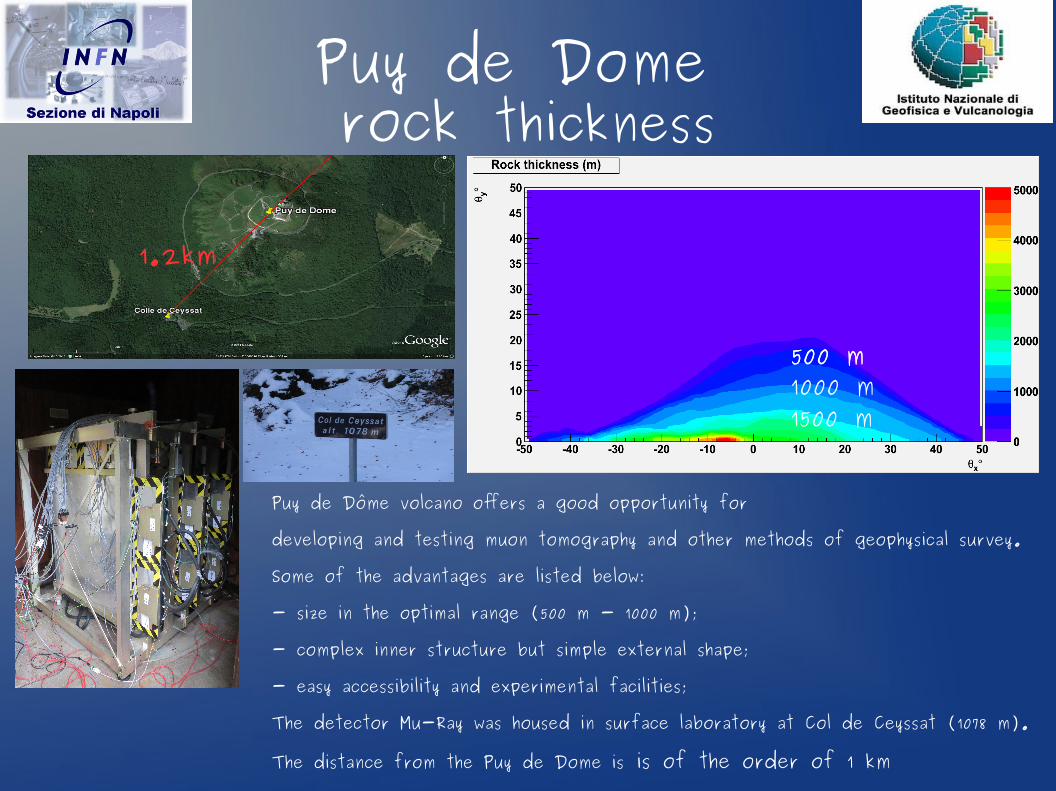
Puy de Dome rock thickness
500 m1000 m500 m
1500 m
1.2km
Puy de Dôme volcano offers a good opportunity for
developing and testing muon tomography and other methods of geophysical survey.
Some of the advantages are listed below:
- size in the optimal range (500 m - 1000 m);
- complex inner structure but simple external shape;
- easy accessibility and experimental facilities;
The detector Mu-Ray was housed in surface laboratory at Col de Ceyssat (1078 m).
The distance from the Puy de Dome is is of the order of 1 km

Puy de Dome measurement campaign
The measurement campaign was performed in the frame of a collaboration between the MURAY and TOMUVOL experiments.
Starting from 29 June to 30 November 2013 we acquired:
● 13 days for the calibration, pointing to the free sky(3.5 M triggers):
29 June 2 July, 22November 30 November;→ →
● 92 days pointing to Puy de Dome(24 M triggers):4 July 15 November→ *
*Due to a black-out at the end of July and summer holidays, we did not acquire during 22July 3 →September.
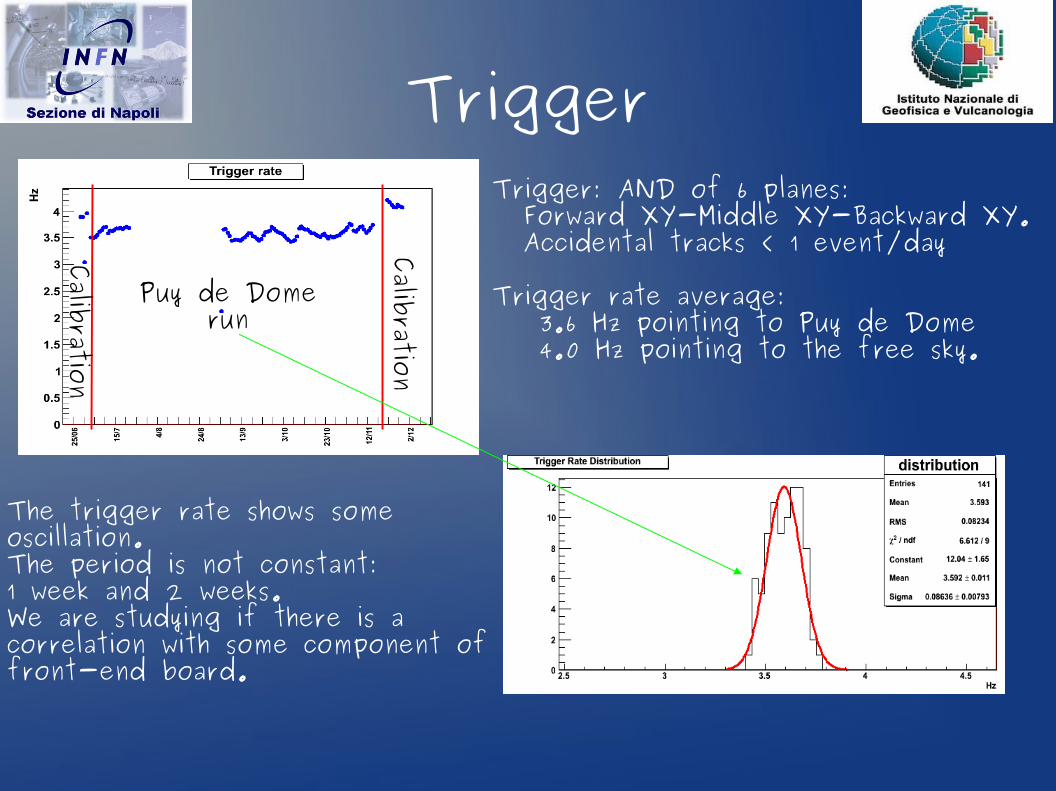
Trigger
Calibr ation
Cali bration
Puy de Domerun
Trigger: AND of 6 planes: Forward XY-Middle XY-Backward XY. Accidental tracks < 1 event/day
Trigger rate average:3.6 Hz pointing to Puy de Dome4.0 Hz pointing to the free sky.
The trigger rate shows some oscillation.The period is not constant:1 week and 2 weeks. We are studying if there is a correlation with some component of front-end board.

Trigger vs Board Frequencies
The trigger rate is not correlatedwith boards activity (Or32*).
OR32 Board 2
The board activity is related to SiPMs dark rate. We have two differen groups of SiPMs. They had different working points. All board show the some trend.
OR32: logic OR of all 32 SiPMs haused in the same connector and read by the same slave board.
Trigger
OR32

Clustering
Adjacent bars with E>5 form a cluster. Mean cluster size 1.4 . The Hit position is the center of the cluster.
E= Adc counts – Pedestal counts*Rms pedestal distribution
* random trigger acquisition with SiPMs ON: Dark rate.
Define the parameter E related to energy release in the scintillator bar.
Particle
E>5
Red: Random trigger Black: Cosmics
ADC counts

TrackingX and Y views independent
Sort in descending order the cluster of each plane respect to E variable.
For each couple of Forward and Backward planes cluster we extrapolate a position in the Middle plane.
If there is a cluster in a range of 2 strip width, we make a linear fit and we build a track candidate.
We associated at each track candidate the E value of minimum between the three clusters that form it.
The best track candidate of view is the one with max of minimum E.
A track is the couple of best track candidate X and Y.
Tracking efficiency : 92% Forward PlaneMiddle Plane
Backward Plane

Golden TrackGolden track:
Isolation: no other cluster not associated to a track with E > 20 Cluster size < 5 χ2 < 5 E of minimum cluster of track ∈ [20, 120]
Golden track effeciency: 47%
11.4 Million(*) golden tracksForward -Backward
(*) Only Puy de Dome tracks.Calibration 1.7 M. Total 13.1 M tracks

Golden Track vs Trigger
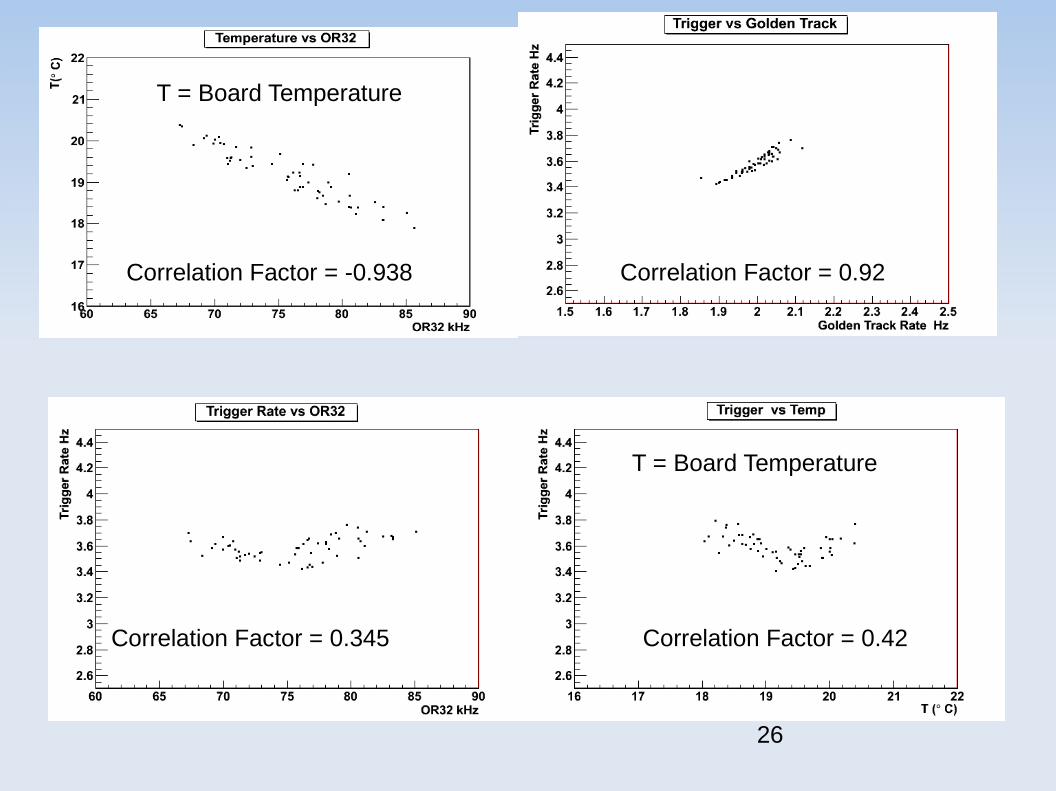
Trigger and Golden Track rate are correlated.
Correlation factor = 0.92
The comparison between Trigger and Golden Tracks rate, shows that we triggered on physical particles.
The two distributions show the same trend.

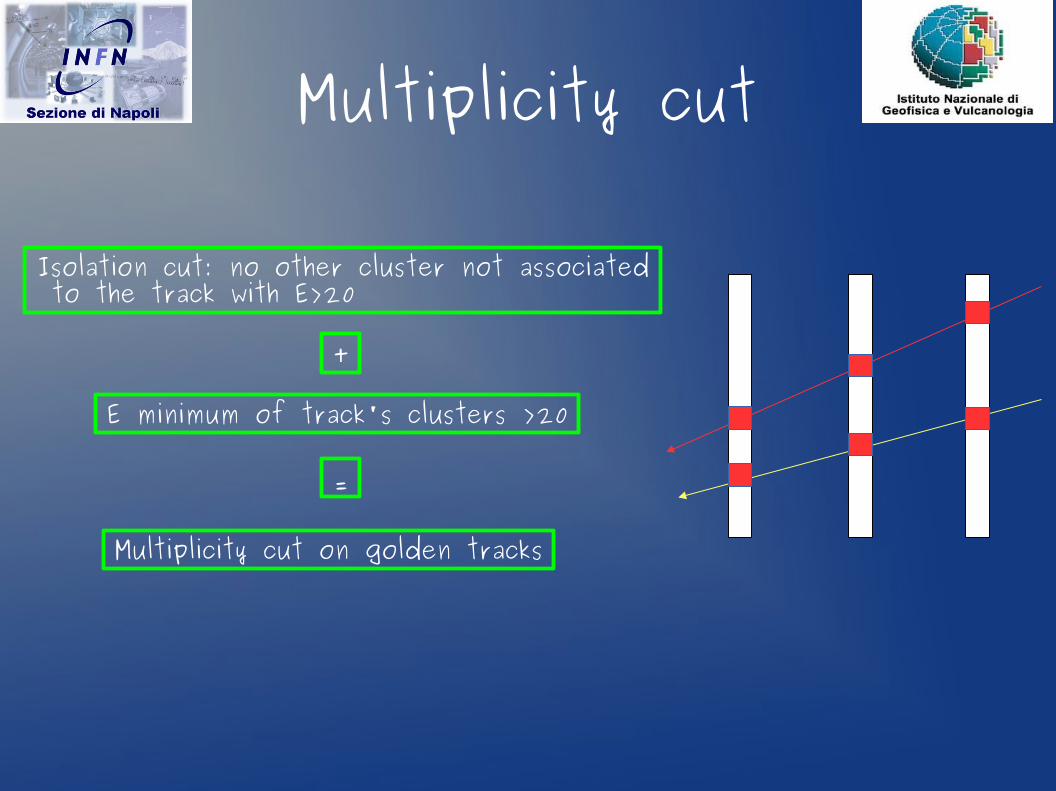
Multiplicity cut
Isolation cut: no other cluster not associated to the track with E>20
E minimum of track's clusters >20
+
=Multiplicity cut on golden tracks
Multiplicity cut
Isolation cut: no other cluster not associated to the track with E>20
E minimum of track's clusters >20
+
=Multiplicity cut on golden tracks

Multiplicity cut
Isolation cut: no other cluster not associated to the track with E>20
E minimum of track's clusters >20
+
=Multiplicity cut on golden tracks
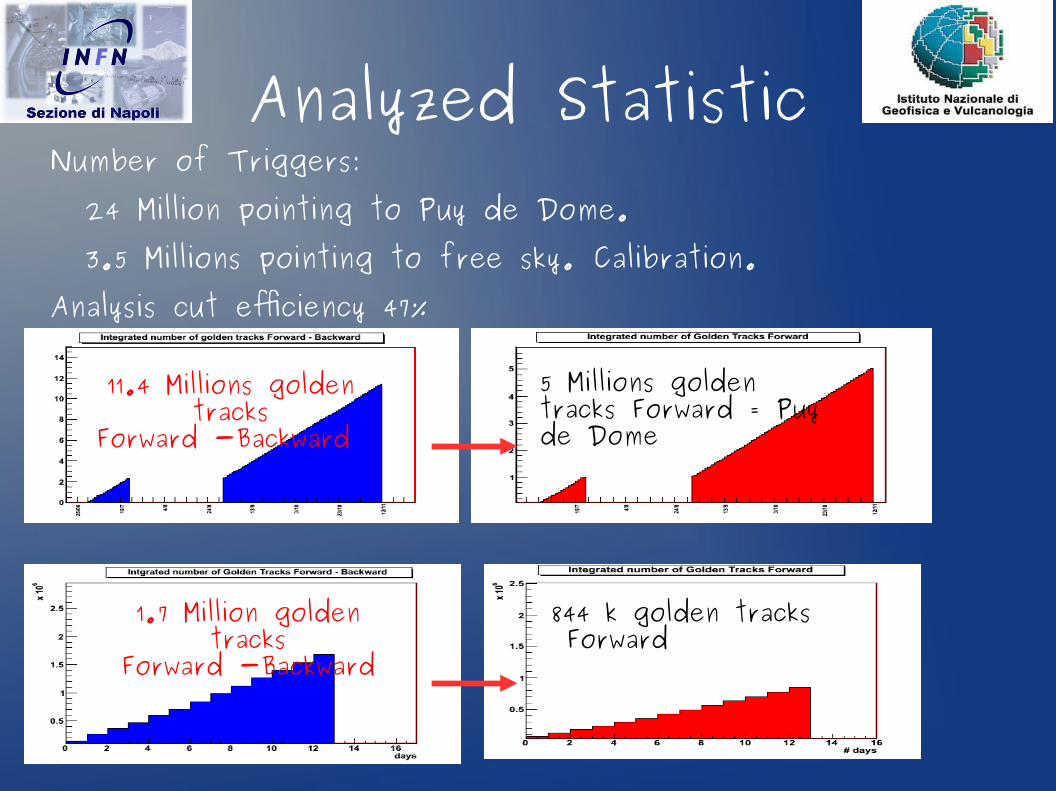
Analyzed StatisticNumber of Triggers: 24 Million pointing to Puy de Dome. 3.5 Millions pointing to free sky. Calibration. Analysis cut efficiency 47%
844 k golden tracks Forward
1.7 Million golden tracks
Forward -Backward
5 Millions golden tracks Forward = Puy de Dome
11.4 Millions golden tracks
Forward -Backward

Not Isolated and Isolated tracks
1) χ2 < 5
2)E of m
ini mum
clus ter of trac k
>20 a .u.
Golden tracksAll tracks
The isolation appears more importantin the mountain region.The ratio decreases to about 50- 60%.
With Isolation cutWithout Isolation cut
50% - 60%

Calibration run:Not Isolated and Isolated
tracks.
1) χ2 < 5
2)E of m
ini mum
clus ter of trac k
>20 a .u.
Without Isolation cut With Isolation cut
Golden tracksAll tracks
80% - 90%
In this case the ratio is of the order 80-90 %.
Flat Background? The mountain is a huge absorber and a flat background becomes more important in the mountain shadow respect to free sky.
The mountain region has multi-tracks events?
Other?

Transmission
10-2 - 10-3 10-1 - 10-2
The Monte Carlo Transmission is in average one orderof magnitude smaller respect to the measured. This plot shows that measure is dominated by residual Background.
Very important: in this measurement campaign the detectorwas on surface (no Shield).

Noise region. Comparison w.r.t. Mone Carlo
500 m1000 m500 m
1500 mNoise region
Define a noise region:Rock thickness > 1500 m
MeasuredGolden rate Forward tracks
in noise region. The integral of Monte Carlo rate in the is 2 order of magnitudesmaller respect to the measured.There is a residual background tosubtract.
Expected = 78µHz

ConclusionsWe integrated about 27 M of triggers.The detector acquired for a long period without problems.
The trigger rate shows some oscillations but they are not correlated with the dark rate of SiPMs.
The golden rate tracks is correlated with trigger rate.The Transmission measure is not available.There is a residual background that have to be understood.
In this campaign the electronic didn't allow the Time Of Flight measurement.
The MURAVES detector will allow the time of flight measurement.

Thank youfor the attention

SPARE

Tracking and analysis cut efficiencies
Free sky Puy de dome
Cut # N entries
Ef Ef rel N entries
Ef Ef rel
Trigger 1 1000000
- - 6252584
- -
Not corrupetd 2 999142 99.91%
- 6240210
99.80%
-
Traccia x&y 3 923917 92.39%
92.24%
5770902
92.29%
92.47%
Not Ass E >20*
4 758596 75.85%
82.10%
4768603
76.22%
82.63%
20 <Emin < 120**
5 599973 59.99%
79.10%
3830314
61.25%
80.03%
Chi2< 5 && ClusterSize <5
6 463406 46.34%
72.38%
2974669
47.58%
76.62%
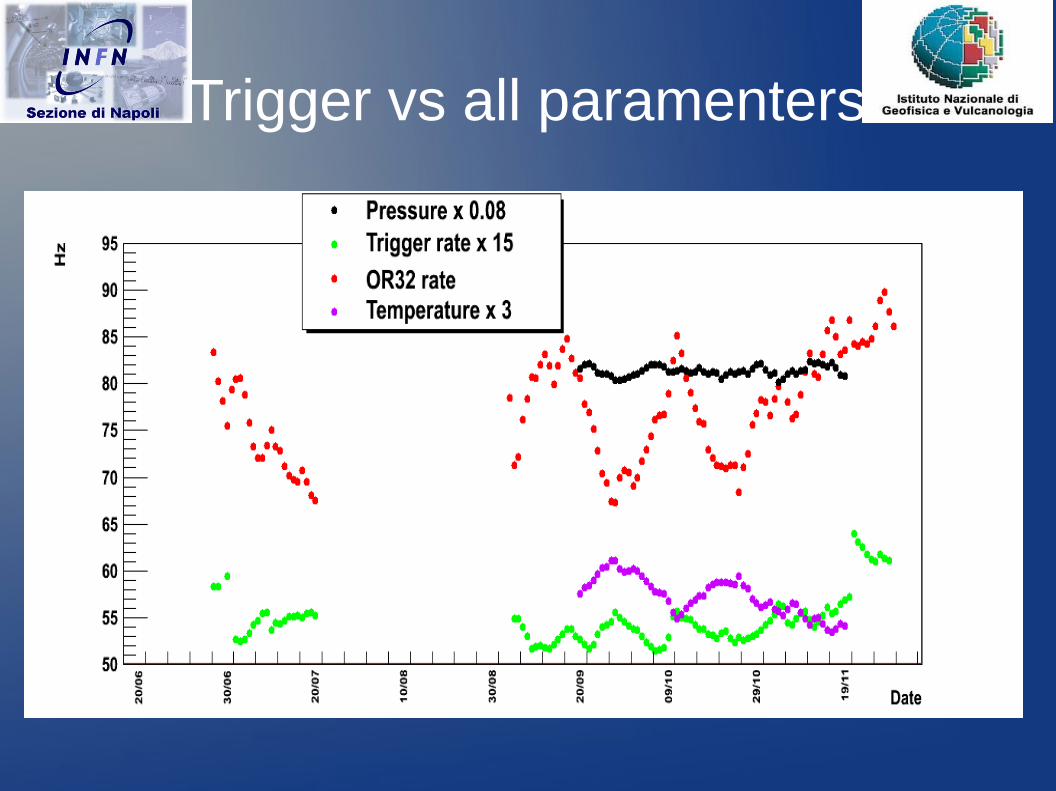
Trigger vs all paramenters
26
Correlation Factor = 0.345 Correlation Factor = 0.42
T = Board Temperature
Correlation Factor = -0.938 Correlation Factor = 0.92
T = Board Temperature

27
TempEx = External Temperature TempS = Board Temperature
Correlation Factor = 0.89Correlation Factor = 0.938
Correlation Factor = -0.06

Effective surface