Embed Size (px)
Citation preview
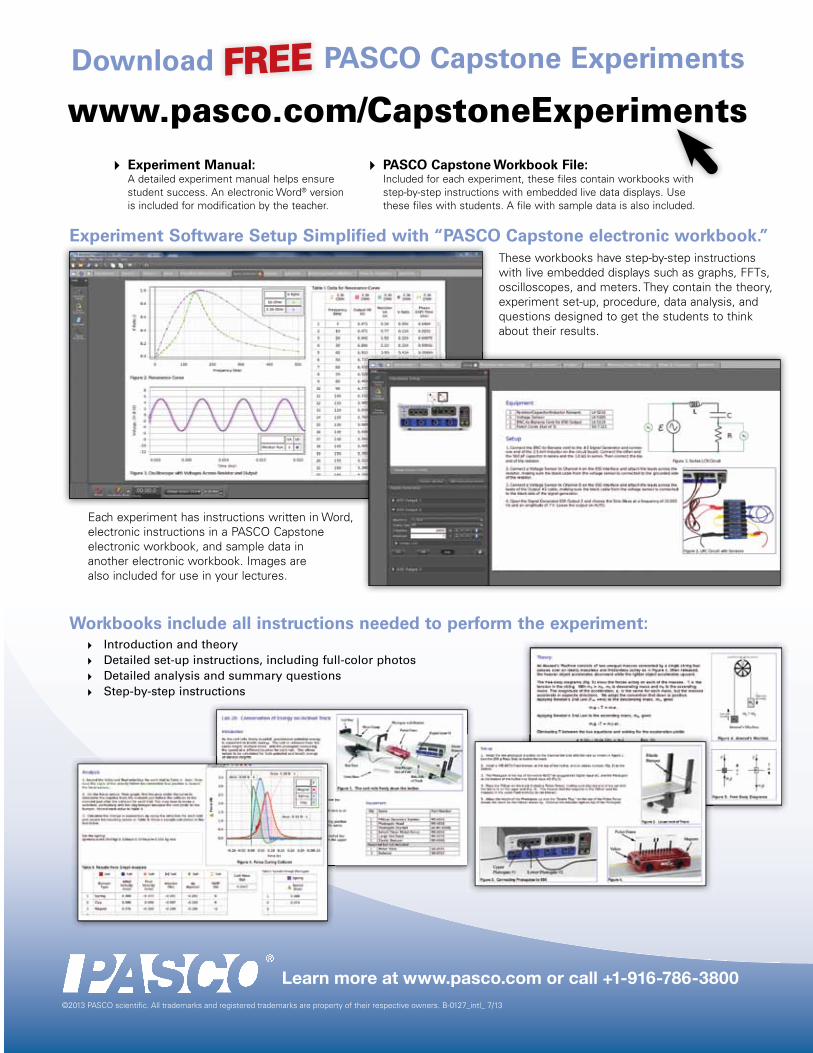
These workbooks have step-by-step instructions with live embedded displays such as graphs, FFTs, oscilloscopes, and meters. They contain the theory, experiment set-up, procedure, data analysis, and questions designed to get the students to think about their results.
Each experiment has instructions written in Word, electronic instructions in a PASCO Capstone electronic workbook, and sample data in another electronic workbook. Images are also included for use in your lectures.
A Introduction and theoryA Detailed set-up instructions, including full-color photosA Detailed analysis and summary questionsA Step-by-step instructions
Workbooks include all instructions needed to perform the experiment:
Experiment Software Setup Simplified with “PASCO Capstone electronic workbook.”
A Experiment Manual: A detailed experiment manual helps ensure student success. An electronic Word® version is included for modification by the teacher.
Try it!Download a FREE
60-day trial at
pasco.com/capstonepasco.com/capstone
A PASCO Capstone Workbook File: Included for each experiment, these files contain workbooks with step-by-step instructions with embedded live data displays. Use these files with students. A file with sample data is also included.
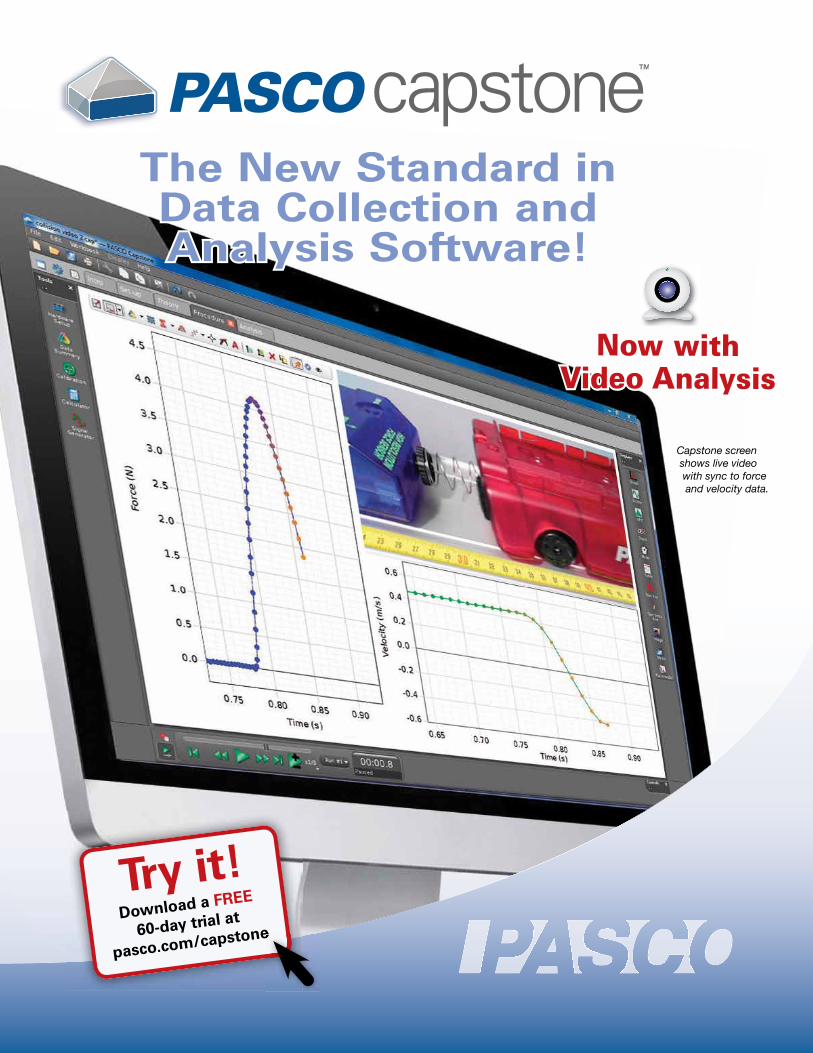
Capstone screen shows live video with sync to force and velocity data.
©2013 PASCO scientific. All trademarks and registered trademarks are property of their respective owners. B-0127_intl_ 7/13
Learn more at www.pasco.com or call +1-916-786-3800
2 3Learn more at www.pasco.com/capstone or call +1-916-786-3800 Download a FREE 60-day trial — www.pasco.com/capstone
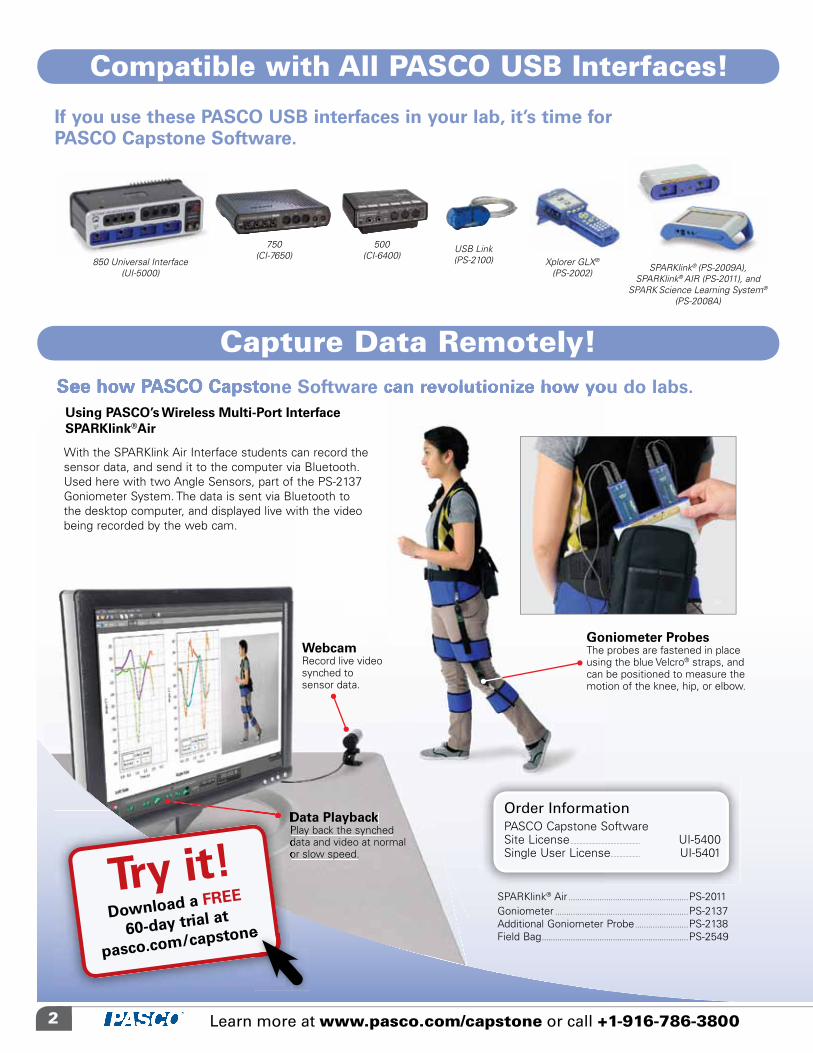
Video AnalysisIf you use these PASCO USB interfaces in your lab, it’s time for PASCO Capstone Software.
See how PASCO Capstone Software can revolutionize how you do labs.
850 Universal Interface (UI-5000)
750 (CI-7650)
500 (CI-6400)
USB Link (PS-2100) Xplorer GLX®
(PS-2002) SPARKlink® (PS-2009A),SPARKlink® AIR (PS-2011), and
SPARK Science Learning System®
(PS-2008A)
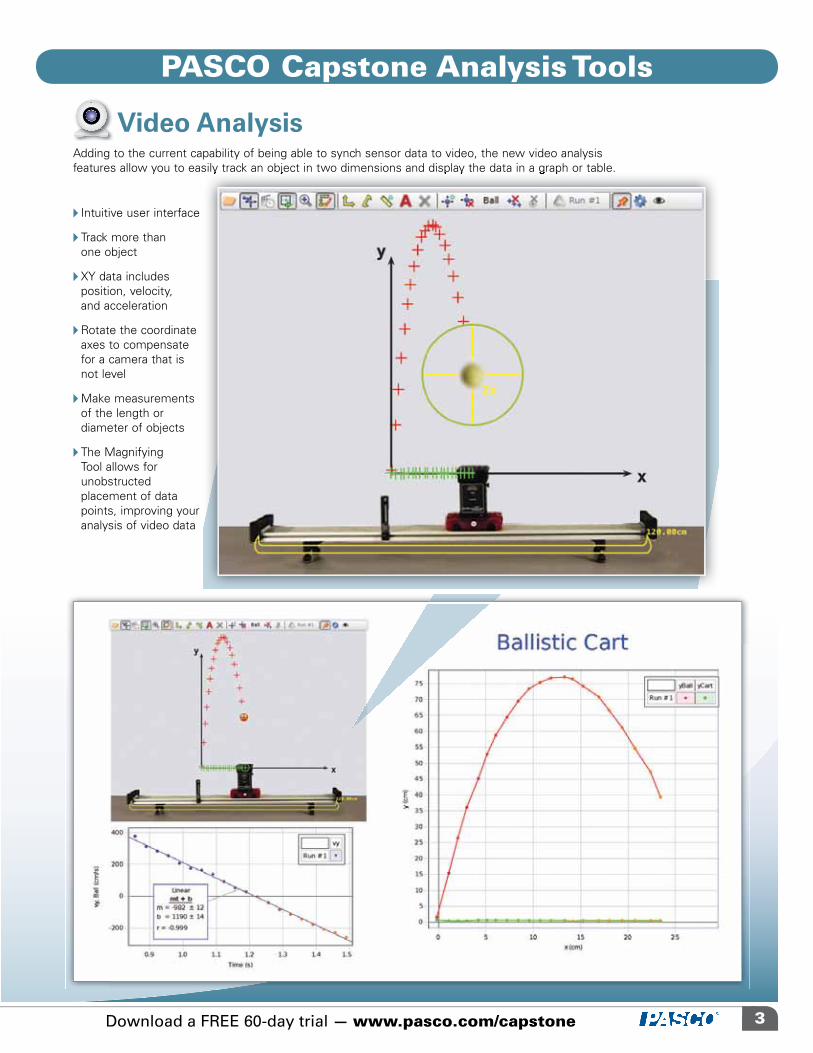
Adding to the current capability of being able to synch sensor data to video, the new video analysis features allow you to easily track an object in two dimensions and display the data in a graph or table.
A Intuitive user interface
A Track more thanone object
A XY data includesposition, velocity, and acceleration
A Rotate the coordinate axes to compensate for a camera that is not level
A Make measurements of the length or diameter of objects
A The Magnifying Tool allows for unobstructed placement of data points, improving your analysis of video data
See how PASCO Capstone Software can revolutionize how you do labs.See how PASCO Capstone Software can revolutionize how you do labs.See how PASCO Capstone Software can revolutionize how you do labs.Using PASCO’s Wireless Multi-Port InterfaceSPARKlink®Air
WebcamRecord live video synched to sensor data.
Data Playback Play back the synched data and video at normal or slow speed.
Goniometer Probes The probes are fastened in place using the blue Velcro® straps, and can be positioned to measure the motion of the knee, hip, or elbow.
With the SPARKlink Air Interface students can record the sensor data, and send it to the computer via Bluetooth. Used here with two Angle Sensors, part of the PS-2137 Goniometer System. The data is sent via Bluetooth to the desktop computer, and displayed live with the video being recorded by the web cam.
Order InformationPASCO Capstone Software Site License ............................................... UI-5400Single User License .................... UI-5401
SPARKlink® Air ......................................................PS-2011 Goniometer ............................................................PS-2137 Additional Goniometer Probe ........................PS-2138 Field Bag ..................................................................PS-2549
Data Playback Play back the synched data and video at normal or slow speed.
Try it!Download a FREE
60-day trial at
pasco.com/capstonepasco.com/capstone
PASCO Capstone Analysis Tools
Capture Data Remotely!
2 3Learn more at www.pasco.com/capstone or call +1-916-786-3800 Download a FREE 60-day trial — www.pasco.com/capstone
Video AnalysisIf you use these PASCO USB interfaces in your lab, it’s time for PASCO Capstone Software.
See how PASCO Capstone Software can revolutionize how you do labs.
850 Universal Interface (UI-5000)
750 (CI-7650)
500 (CI-6400)
USB Link (PS-2100) Xplorer GLX®
(PS-2002) SPARKlink® (PS-2009A),SPARKlink® AIR (PS-2011), and
SPARK Science Learning System®
(PS-2008A)
Adding to the current capability of being able to synch sensor data to video, the new video analysis features allow you to easily track an object in two dimensions and display the data in a graph or table.
A Intuitive user interface
A Track more thanone object
A XY data includesposition, velocity, and acceleration
A Rotate the coordinate axes to compensate for a camera that is not level
A Make measurements of the length or diameter of objects
A The Magnifying Tool allows for unobstructed placement of data points, improving your analysis of video data
Using PASCO’s Wireless Multi-Port InterfaceSPARKlink®Air
WebcamRecord live video synched to sensor data.
Data Playback Play back the synched data and video at normal or slow speed.
Goniometer Probes The probes are fastened in place using the blue Velcro® straps, and can be positioned to measure the motion of the knee, hip, or elbow.
With the SPARKlink Air Interface students can record the sensor data, and send it to the computer via Bluetooth. Used here with two Angle Sensors, part of the PS-2137 Goniometer System. The data is sent via Bluetooth to the desktop computer, and displayed live with the video being recorded by the web cam.
Order InformationPASCO Capstone Software Site License ............................................... UI-5400Single User License .................... UI-5401
SPARKlink® Air ......................................................PS-2011 Goniometer ............................................................PS-2137 Additional Goniometer Probe ........................PS-2138 Field Bag ..................................................................PS-2549
Try it!Download a FREE
60-day trial at
pasco.com/capstone
PASCO Capstone Analysis Tools
Capture Data Remotely!
features allow you to easily track an object in two dimensions and display the data in a graph or table.
4 5Download a FREE 60-day trial — www.pasco.com/capstone
Capture and Synch Video to Data
Any webcam can be used as a “video sensor” to record movies at the same time as data.
Exclude or Delete Data Points from AnalysisIf there is a lag between when you start recording and the point in your data set where the action begins, you can exclude the data points at the beginning so they are not included in the range when you press the scale-to-fit button and are not considered in analysis such as curve fits and statistics.
A Temporarily exclude errant data points from curve fits and then re-include them to see the difference in the curve fit.
A Delete extraneous data at the beginning or end of a run.
Highlight the points you want to exclude.
Excluded points are shown here as gray X’s.
After excluding extraneous leading and trailing data, the excluded points will be ignored when you push auto-scale.
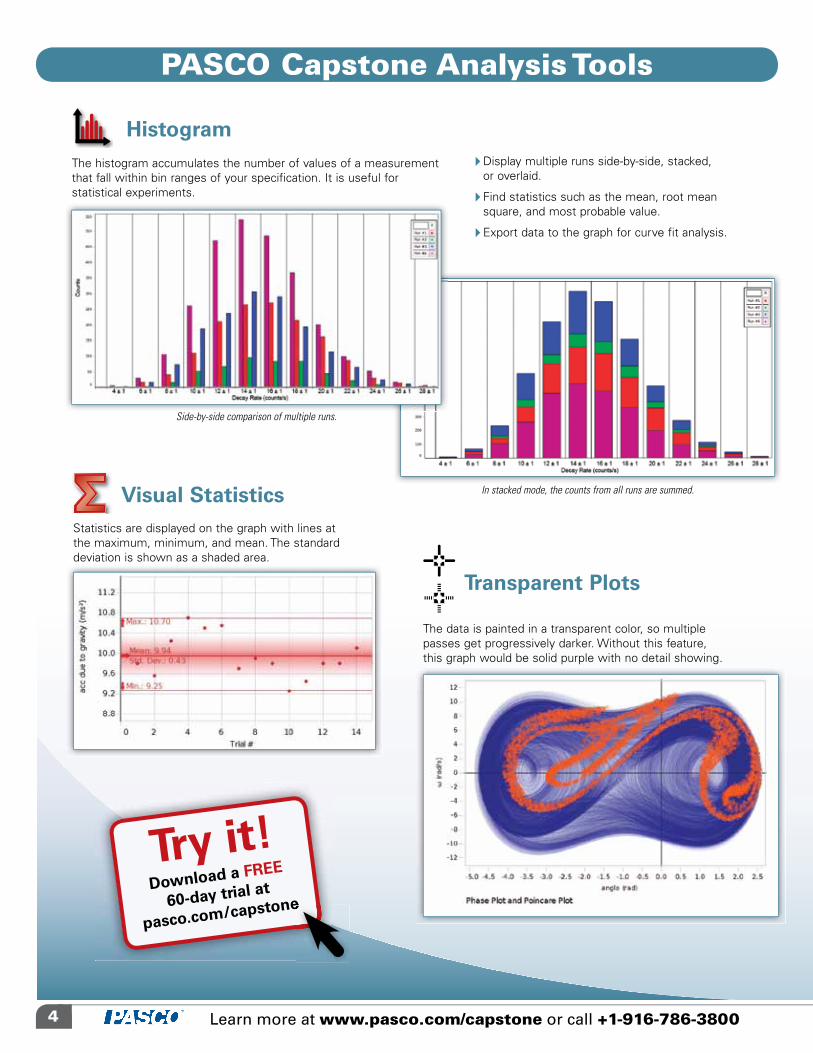
The histogram accumulates the number of values of a measurement that fall within bin ranges of your specification. It is useful for statistical experiments.
A Display multiple runs side-by-side, stacked, or overlaid.
A Find statistics such as the mean, root mean square, and most probable value.
A Export data to the graph for curve fit analysis.
Side-by-side comparison of multiple runs.
In stacked mode, the counts from all runs are summed.
Histogram
Visual StatisticsStatistics are displayed on the graph with lines at the maximum, minimum, and mean. The standard deviation is shown as a shaded area.
Transparent Plots
The data is painted in a transparent color, so multiple passes get progressively darker. Without this feature, this graph would be solid purple with no detail showing.
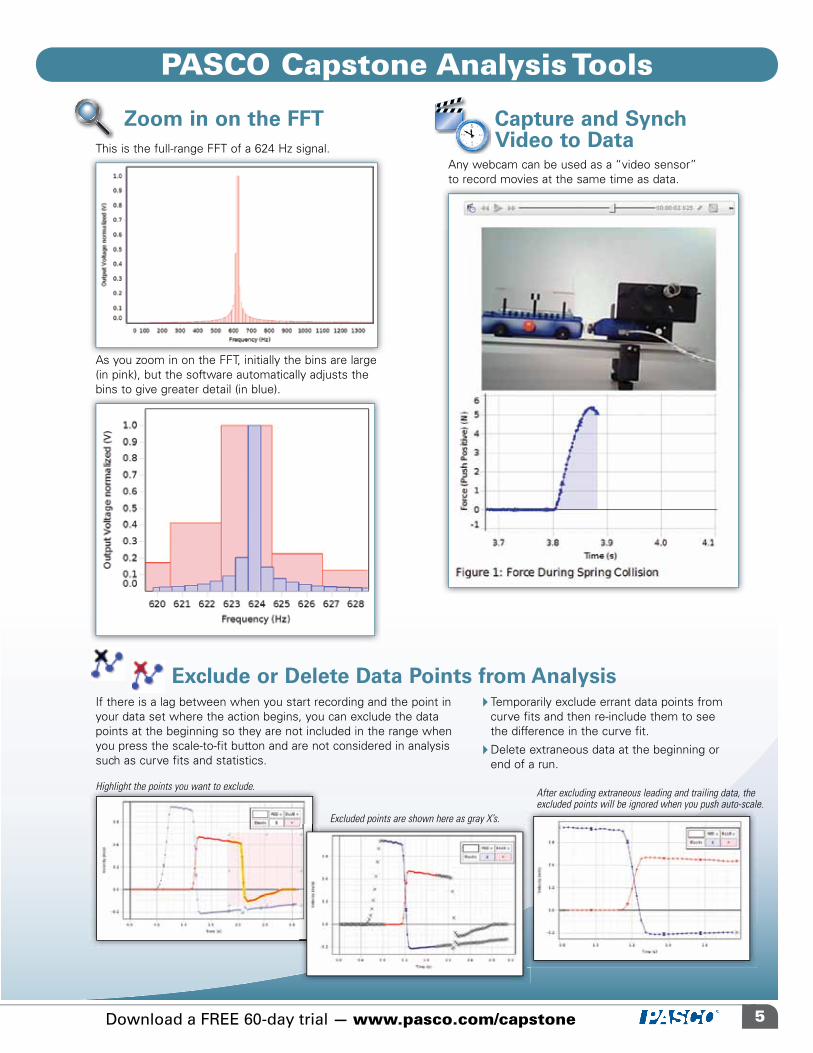
Zoom in on the FFTThis is the full-range FFT of a 624 Hz signal.
As you zoom in on the FFT, initially the bins are large (in pink), but the software automatically adjusts the bins to give greater detail (in blue).
PASCO Capstone Analysis ToolsPASCO Capstone Analysis Tools
Try it!Download a FREE
60-day trial at
pasco.com/capstonepasco.com/capstone
Learn more at www.pasco.com/capstone or call +1-916-786-3800
4 5Download a FREE 60-day trial — www.pasco.com/capstone
Capture and Synch Video to Data
Any webcam can be used as a “video sensor” to record movies at the same time as data.
Exclude or Delete Data Points from AnalysisIf there is a lag between when you start recording and the point in your data set where the action begins, you can exclude the data points at the beginning so they are not included in the range when you press the scale-to-fit button and are not considered in analysis such as curve fits and statistics.
A Temporarily exclude errant data points from curve fits and then re-include them to see the difference in the curve fit.
A Delete extraneous data at the beginning or end of a run.
Highlight the points you want to exclude.
Excluded points are shown here as gray X’s.
After excluding extraneous leading and trailing data, the excluded points will be ignored when you push auto-scale.
The histogram accumulates the number of values of a measurement that fall within bin ranges of your specification. It is useful for statistical experiments.
A Display multiple runs side-by-side, stacked, or overlaid.
A Find statistics such as the mean, root mean square, and most probable value.
A Export data to the graph for curve fit analysis.
Side-by-side comparison of multiple runs.
In stacked mode, the counts from all runs are summed.
Histogram
Visual StatisticsStatistics are displayed on the graph with lines at the maximum, minimum, and mean. The standard deviation is shown as a shaded area.
Transparent Plots
The data is painted in a transparent color, so multiple passes get progressively darker. Without this feature, this graph would be solid purple with no detail showing.
Zoom in on the FFTThis is the full-range FFT of a 624 Hz signal.
As you zoom in on the FFT, initially the bins are large (in pink), but the software automatically adjusts the bins to give greater detail (in blue).
PASCO Capstone Analysis ToolsPASCO Capstone Analysis Tools
Try it!Download a FREE
60-day trial at
pasco.com/capstone
Learn more at www.pasco.com/capstone or call +1-916-786-3800
6 7Download a FREE 60-day trial — www.pasco.com/capstone
PASCO Capstone™ Software
Order Information PASCO Capstone Software Site License ......................................................................................UI-5400Single User License ............................................................UI-5401
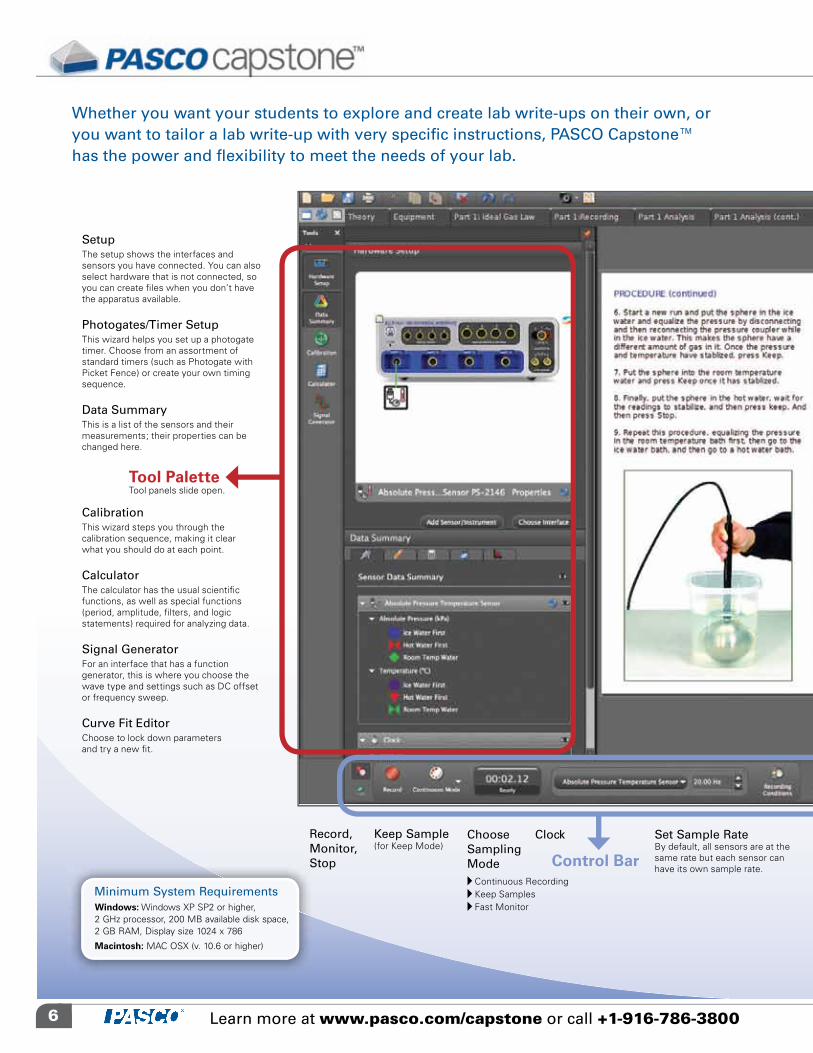
Whether you want your students to explore and create lab write-ups on their own, or you want to tailor a lab write-up with very specific instructions, PASCO Capstone™has the power and flexibility to meet the needs of your lab.
SetupThe setup shows the interfaces and sensors you have connected. You can also select hardware that is not connected, so you can create files when you don’t have the apparatus available.
Photogates/Timer SetupThis wizard helps you set up a photogate timer. Choose from an assortment of standard timers (such as Photogate with Picket Fence) or create your own timing sequence.
Data SummaryThis is a list of the sensors and their measurements; their properties can be changed here.
CalibrationThis wizard steps you through the calibration sequence, making it clear what you should do at each point.
CalculatorThe calculator has the usual scientific functions, as well as special functions (period, amplitude, filters, and logic statements) required for analyzing data.
Signal GeneratorFor an interface that has a function generator, this is where you choose the wave type and settings such as DC offset or frequency sweep.
Curve Fit EditorChoose to lock down parameters and try a new fit.
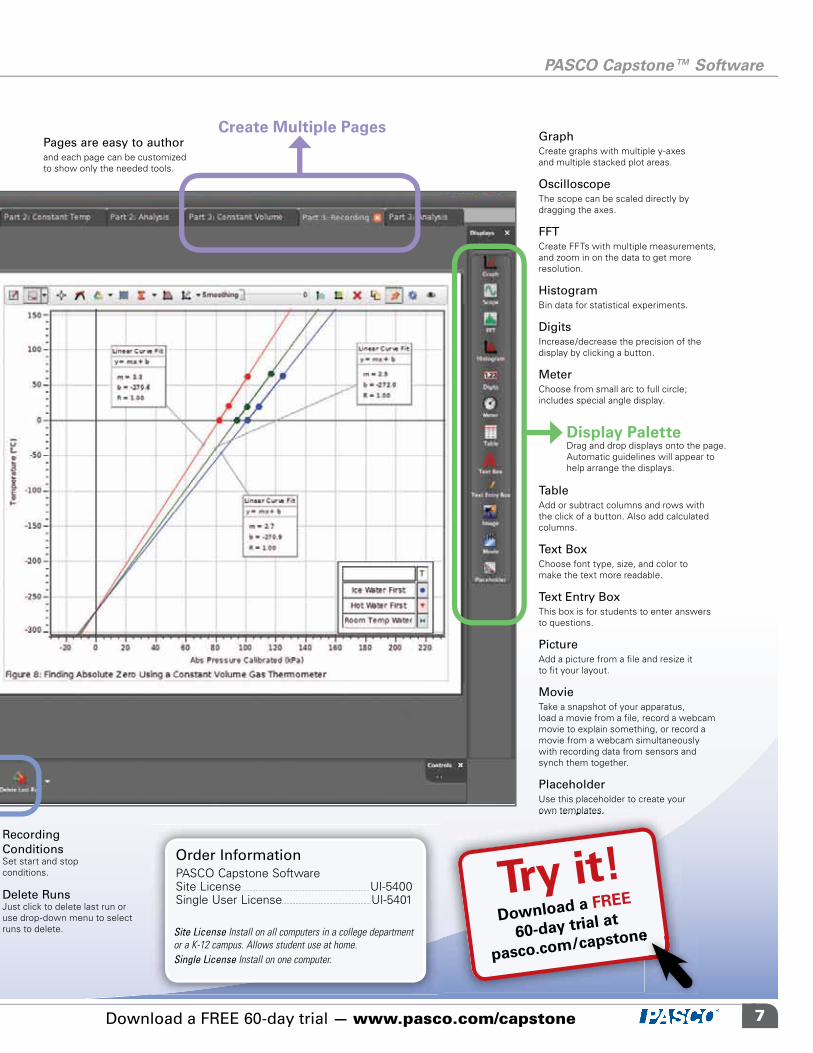
GraphCreate graphs with multiple y-axes and multiple stacked plot areas.
OscilloscopeThe scope can be scaled directly by dragging the axes.
FFTCreate FFTs with multiple measurements, and zoom in on the data to get more resolution.
HistogramBin data for statistical experiments.
DigitsIncrease/decrease the precision of the display by clicking a button.
MeterChoose from small arc to full circle; includes special angle display.
TableAdd or subtract columns and rows with the click of a button. Also add calculated columns.
Text BoxChoose font type, size, and color to make the text more readable.
Text Entry BoxThis box is for students to enter answers to questions.
PictureAdd a picture from a file and resize it to fit your layout.
MovieTake a snapshot of your apparatus,load a movie from a file, record a webcam movie to explain something, or record a movie from a webcam simultaneously with recording data from sensors and synch them together.
PlaceholderUse this placeholder to create your own templates.
Tool PaletteTool panels slide open.
Display PaletteDrag and drop displays onto the page. Automatic guidelines will appear to help arrange the displays.
Control Bar
Record,Monitor,Stop
ChooseSamplingModeA Continuous RecordingA Keep SamplesA Fast Monitor
Set Sample RateBy default, all sensors are at the same rate but each sensor can have its own sample rate.
Recording ConditionsSet start and stop conditions.
Delete RunsJust click to delete last run or use drop-down menu to select runs to delete.
Clock
Create Multiple Pages
Keep Sample(for Keep Mode)
Site License Install on all computers in a college department or a K-12 campus. Allows student use at home.Single License Install on one computer.
Pages are easy to authorand each page can be customized to show only the needed tools.
Windows: Windows XP SP2 or higher, 2 GHz processor, 200 MB available disk space, 2 GB RAM, Display size 1024 x 786
Macintosh: MAC OSX (v. 10.6 or higher)
Minimum System Requirements Try it!Download a FREE
60-day trial at
pasco.com/capstone
Learn more at www.pasco.com/capstone or call +1-916-786-3800
6 7Download a FREE 60-day trial — www.pasco.com/capstone
PASCO Capstone™ Software
Order Information PASCO Capstone Software Site License ......................................................................................UI-5400Single User License ............................................................UI-5401
Whether you want your students to explore and create lab write-ups on their own, or you want to tailor a lab write-up with very specific instructions, PASCO Capstone™has the power and flexibility to meet the needs of your lab.
SetupThe setup shows the interfaces and sensors you have connected. You can also select hardware that is not connected, so you can create files when you don’t have the apparatus available.
Photogates/Timer SetupThis wizard helps you set up a photogate timer. Choose from an assortment of standard timers (such as Photogate with Picket Fence) or create your own timing sequence.
Data SummaryThis is a list of the sensors and their measurements; their properties can be changed here.
CalibrationThis wizard steps you through the calibration sequence, making it clear what you should do at each point.
CalculatorThe calculator has the usual scientific functions, as well as special functions (period, amplitude, filters, and logic statements) required for analyzing data.
Signal GeneratorFor an interface that has a function generator, this is where you choose the wave type and settings such as DC offset or frequency sweep.
Curve Fit EditorChoose to lock down parameters and try a new fit.
GraphCreate graphs with multiple y-axes and multiple stacked plot areas.
OscilloscopeThe scope can be scaled directly by dragging the axes.
FFTCreate FFTs with multiple measurements, and zoom in on the data to get more resolution.
HistogramBin data for statistical experiments.
DigitsIncrease/decrease the precision of the display by clicking a button.
MeterChoose from small arc to full circle; includes special angle display.
TableAdd or subtract columns and rows with the click of a button. Also add calculated columns.
Text BoxChoose font type, size, and color to make the text more readable.
Text Entry BoxThis box is for students to enter answers to questions.
PictureAdd a picture from a file and resize it to fit your layout.
MovieTake a snapshot of your apparatus,load a movie from a file, record a webcam movie to explain something, or record a movie from a webcam simultaneously with recording data from sensors and synch them together.
PlaceholderUse this placeholder to create your own templates.
Tool PaletteTool panels slide open.
Display PaletteDrag and drop displays onto the page. Automatic guidelines will appear to help arrange the displays.
Control Bar
Record,Monitor,Stop
ChooseSamplingModeA Continuous RecordingA Keep SamplesA Fast Monitor
Set Sample RateBy default, all sensors are at the same rate but each sensor can have its own sample rate.
Recording ConditionsSet start and stop conditions.
Delete RunsJust click to delete last run or use drop-down menu to select runs to delete.
Clock
Create Multiple Pages
Keep Sample(for Keep Mode)
Site License Install on all computers in a college department or a K-12 campus. Allows student use at home.Single License Install on one computer.
Pages are easy to authorand each page can be customized to show only the needed tools.
Windows: Windows XP SP2 or higher, 2 GHz processor, 200 MB available disk space, 2 GB RAM, Display size 1024 x 786
Macintosh: MAC OSX (v. 10.6 or higher)
Minimum System Requirements
own templates.
Try it!Download a FREE
60-day trial at
pasco.com/capstonepasco.com/capstone
Learn more at www.pasco.com/capstone or call +1-916-786-3800
8 9Download a FREE 60-day trial — www.pasco.com/capstone
Import and Exporttxt, csv data files.Open GLX, DataStudio files. Import Movies, Images, and VideosUse any PASCO USB Interface outside the lab to collect data and then return to the lab computer to analyze the data in PASCO Capstone. All PASCO interfaces have their own special data file format which can now be opened in PASCO Capstone.
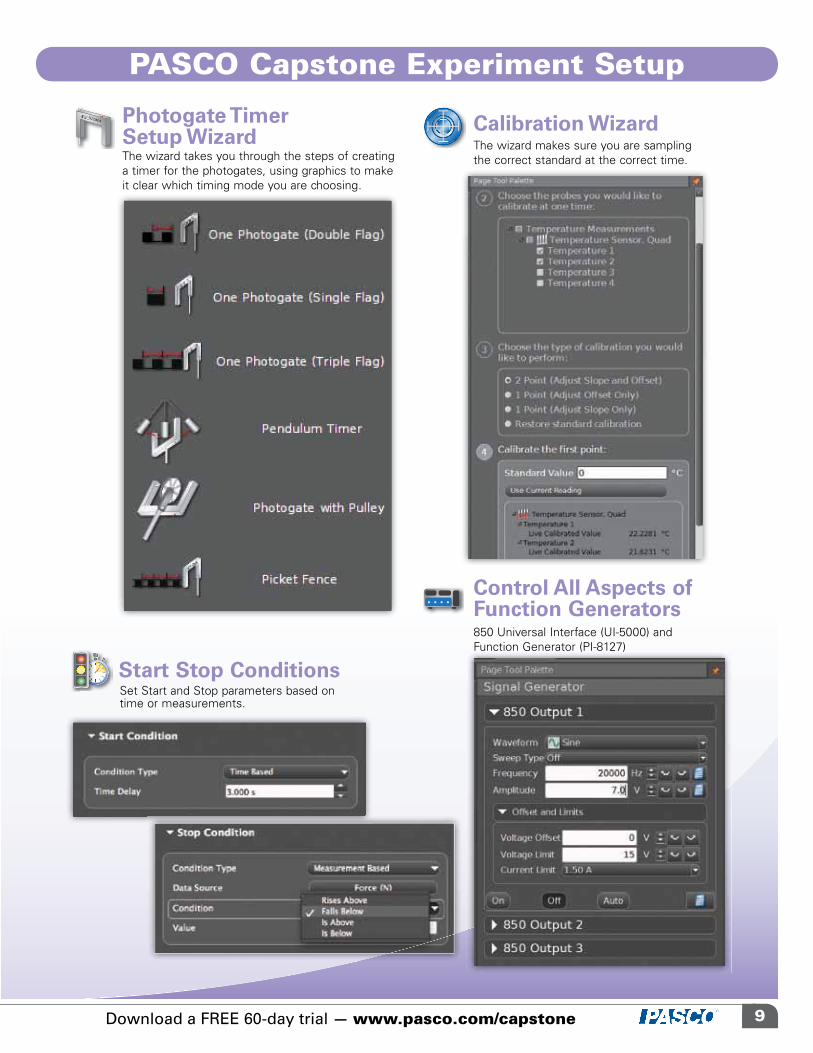
Set Start and Stop parameters based on time or measurements.
Start Stop Conditions
Control All Aspects of Function Generators
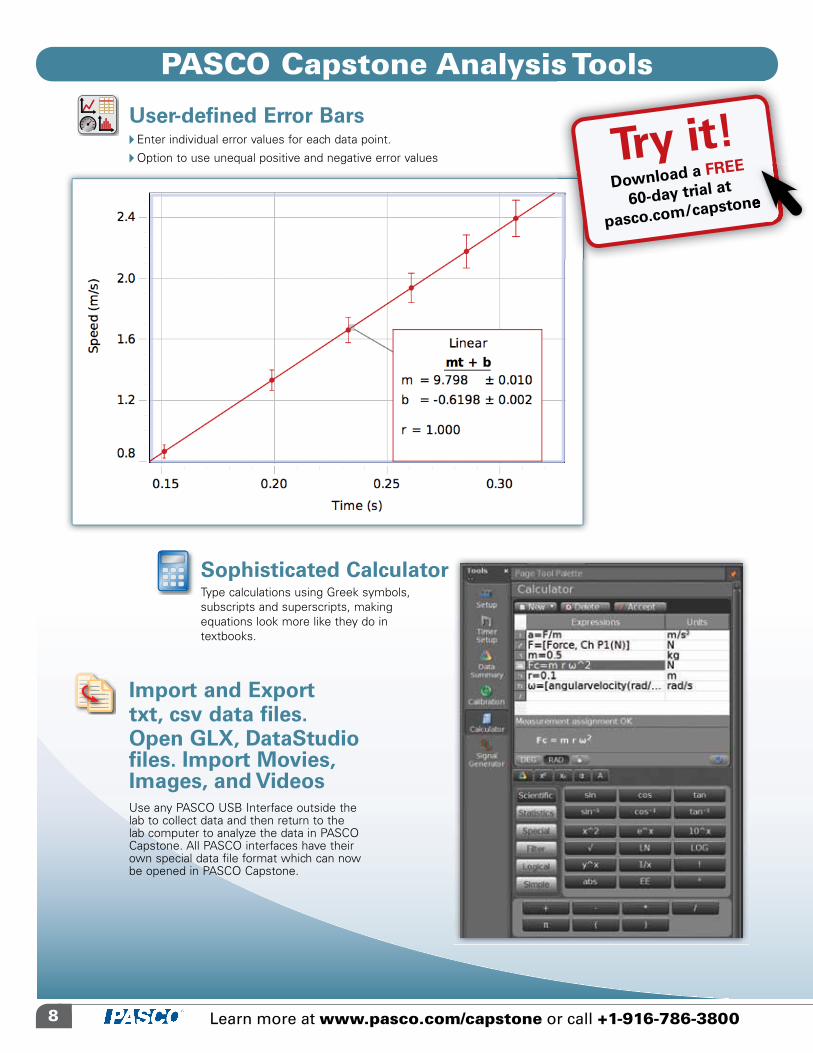
User-defined Error BarsA Enter individual error values for each data point.
A Option to use unequal positive and negative error values The wizard takes you through the steps of creating a timer for the photogates, using graphics to make it clear which timing mode you are choosing.
850 Universal Interface (UI-5000) and Function Generator (PI-8127)
Photogate Timer Setup Wizard
Calibration WizardThe wizard makes sure you are sampling the correct standard at the correct time.
PASCO Capstone Experiment SetupPASCO Capstone Analysis Tools
Sophisticated CalculatorType calculations using Greek symbols, subscripts and superscripts, making equations look more like they do in textbooks.
Try it!Download a FREE
60-day trial at
pasco.com/capstonepasco.com/capstone
Learn more at www.pasco.com/capstone or call +1-916-786-3800
8 9Download a FREE 60-day trial — www.pasco.com/capstone
Import and Exporttxt, csv data files.Open GLX, DataStudio files. Import Movies, Images, and VideosUse any PASCO USB Interface outside the lab to collect data and then return to the lab computer to analyze the data in PASCO Capstone. All PASCO interfaces have their own special data file format which can now be opened in PASCO Capstone.
Set Start and Stop parameters based on time or measurements.
Start Stop Conditions
Control All Aspects of Function Generators
User-defined Error BarsA Enter individual error values for each data point.
A Option to use unequal positive and negative error values The wizard takes you through the steps of creating a timer for the photogates, using graphics to make it clear which timing mode you are choosing.
850 Universal Interface (UI-5000) and Function Generator (PI-8127)
Photogate Timer Setup Wizard
Calibration WizardThe wizard makes sure you are sampling the correct standard at the correct time.
PASCO Capstone Experiment SetupPASCO Capstone Analysis Tools
Sophisticated CalculatorType calculations using Greek symbols, subscripts and superscripts, making equations look more like they do in textbooks.
Try it!Download a FREE
60-day trial at
pasco.com/capstone
Learn more at www.pasco.com/capstone or call +1-916-786-3800
10 11Download a FREE 60-day trial — www.pasco.com/capstone
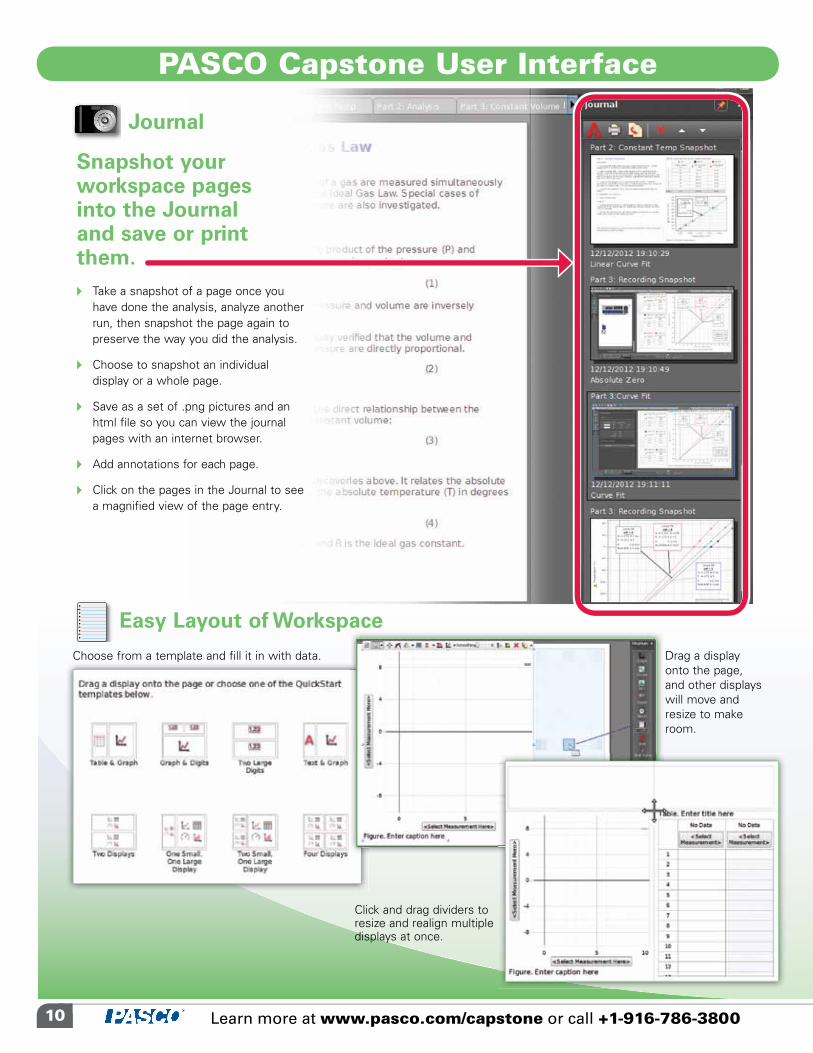
Easy Layout of Workspace
Choose from a template and fill it in with data. Drag a display onto the page, and other displays will move and resize to make room.
Click and drag dividers to resize and realign multiple displays at once.
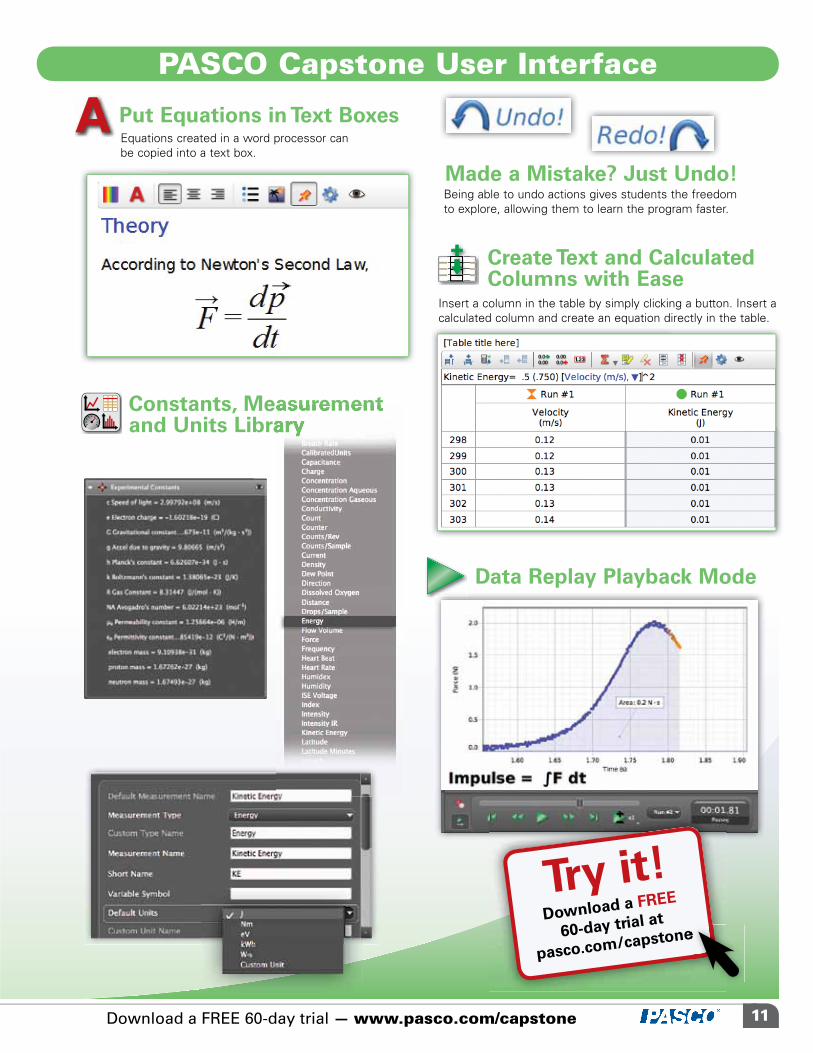
Create Text and Calculated Columns with Ease
Insert a column in the table by simply clicking a button. Insert a calculated column and create an equation directly in the table.
Being able to undo actions gives students the freedom to explore, allowing them to learn the program faster.
Snapshot your workspace pages into the Journal and save or print them. A Take a snapshot of a page once you
have done the analysis, analyze another run, then snapshot the page again to preserve the way you did the analysis.
A Choose to snapshot an individualdisplay or a whole page.
A Save as a set of .png pictures and an html file so you can view the journal pages with an internet browser.
A Add annotations for each page.
A Click on the pages in the Journal to see a magnified view of the page entry.
Journal
PASCO Capstone User Interface PASCO Capstone User Interface
Made a Mistake? Just Undo!
Equations created in a word processor can be copied into a text box.
Put Equations in Text Boxes
Data Replay Playback Mode
Constants, Measurement and Units Library
Try it!Download a FREE
60-day trial at
pasco.com/capstone
Learn more at www.pasco.com/capstone or call +1-916-786-3800
10 11Download a FREE 60-day trial — www.pasco.com/capstone
Easy Layout of Workspace
Choose from a template and fill it in with data. Drag a display onto the page, and other displays will move and resize to make room.
Click and drag dividers to resize and realign multiple displays at once.
Create Text and Calculated Columns with Ease
Insert a column in the table by simply clicking a button. Insert a calculated column and create an equation directly in the table.
Being able to undo actions gives students the freedom to explore, allowing them to learn the program faster.
Snapshot your workspace pages into the Journal and save or print them. A Take a snapshot of a page once you
have done the analysis, analyze another run, then snapshot the page again to preserve the way you did the analysis.
A Choose to snapshot an individualdisplay or a whole page.
A Save as a set of .png pictures and an html file so you can view the journal pages with an internet browser.
A Add annotations for each page.
A Click on the pages in the Journal to see a magnified view of the page entry.
Journal
PASCO Capstone User Interface PASCO Capstone User Interface
Made a Mistake? Just Undo!
Equations created in a word processor can be copied into a text box.
Put Equations in Text Boxes
Data Replay Playback Mode
Constants, Measurement and Units Library
Try it!Download a FREE
60-day trial at
pasco.com/capstonepasco.com/capstone
Constants, Measurement and Units Library
Learn more at www.pasco.com/capstone or call +1-916-786-3800
These workbooks have step-by-step instructions with live embedded displays such as graphs, FFTs, oscilloscopes, and meters. They contain the theory, experiment set-up, procedure, data analysis, and questions designed to get the students to think about their results.
Each experiment has instructions written in Word, electronic instructions in a PASCO Capstone electronic workbook, and sample data in another electronic workbook. Images are also included for use in your lectures.
A Introduction and theoryA Detailed set-up instructions, including full-color photosA Detailed analysis and summary questionsA Step-by-step instructions
Workbooks include all instructions needed to perform the experiment:
Experiment Software Setup Simplified with “PASCO Capstone electronic workbook.”
A Experiment Manual: A detailed experiment manual helps ensure student success. An electronic Word® version is included for modification by the teacher.
Try it!Download a FREE
60-day trial at
pasco.com/capstone
A PASCO Capstone Workbook File: Included for each experiment, these files contain workbooks with step-by-step instructions with embedded live data displays. Use these files with students. A file with sample data is also included.
Capstone screen shows live video with sync to force and velocity data.
©2013 PASCO scientific. All trademarks and registered trademarks are property of their respective owners. B-0127_intl_ 7/13
Learn more at www.pasco.com or call +1-916-786-3800