Embed Size (px)
Citation preview
PASADENA STREETCAR FEASIBILITY STUDY
Executive Summary

Project Background
Sponsors:
Pasadena Center Operating Company
City of Pasadena
Old Pasadena Management District
Playhouse District Association
South Lake Avenue Business District
Paseo Colorado Holdings, Ltd.
Study initiated August 2009 Addresses streetcar alignment
concepts and financial feasibility Streetcar hoped to address
challenges: Improving non-auto circulation
between districts Increasing retail competitiveness Reducing parking needs

Consultant Team
Firm Expertise
Strategic Economics Urban economic analysis
Shiels Obletz Johnsen Streetcar construction, funding, and operations
Reconnecting America Transit-oriented development research and technical assistance
Moule & Polyzoides Urban design/planning and local context
Iteris Transportation analysis/engineering and local context

Study Components An evaluation of current and future demographics in the Central
District Evaluation of retail market conditions, hotel/conference/tourism
conditions, employment in the Central District, and development opportunities
Summaries of potential funding mechanisms Case studies of other streetcar cities A preliminary evaluation of system construction and operating
costs and design issues that included parking and transportation An assessment of potential economic benefits of the streetcar An economic value analysis of the cost to properties proximate
to the route Recommendations for financial strategies to fund the streetcar

Study Area and Alignment Concept

Streetcar Basics System
Local circulator only…a “walk extender”
Short distances, closely spaced stops, slower speeds
Permanence and convenience drive development and investment along route
“Development-oriented transit” Vehicles
Electric rail vehicles Smaller than light rail Modern, vintage, or vintage replica
Top: Modern streetcar in SeattleMiddle: Vintage streetcar in San Francisco
Bottom: Vintage replica streetcar in CharlotteSource: Center for Transit-Oriented Development

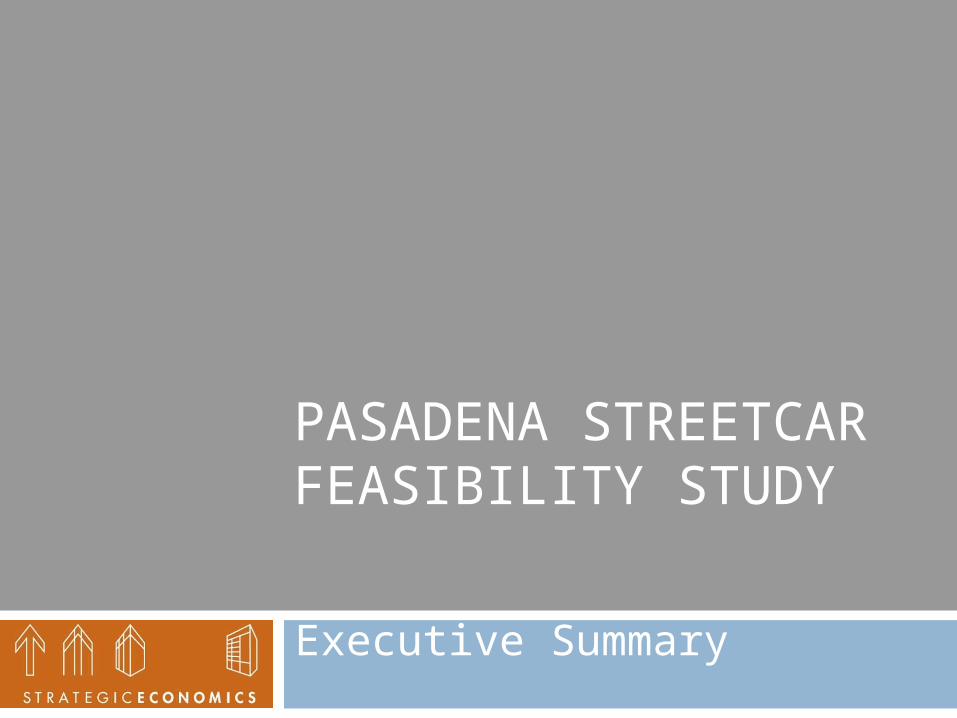
Potential Benefits for Pasadena:Linking Downtown Districts

Potential Benefits for Pasadena Improved Parking Performance
Diminishes desire to drive between districts
Reduces congestion from inter-district trips
Increased Tourism Competitiveness “Brands” the area Widens access to dining and
entertainment options, especially for car-free convention visitors
Easier Commuting Provides additional alternative to
walking/driving for downtown residents Improves access to some destinations far
from Gold Line stations

Potential Benefits for Pasadena
Increased Retail Competitiveness Unifies Downtown shopping and entertainment
districts, encourages cross-shopping Creates larger mass of retail to compete against
regional competitors Lends iconic branding to Downtown Enhances access to lunchtime shopping/dining
for workers in Downtown Proposed alignment creates additional visibility
and foot traffic on relatively underperforming blocks north and south of Colorado Boulevard
Potential Benefits for Pasadena

Potential Benefits for Pasadena
Boosts Development Potential Streetcar proximity increases sales, rents, and
property sales prices Higher attainable prices/rents increase
development potential Reduced parking need allows higher density
Frees space and expensive construction costs

Case Study: Portland, Oregon First leg constructed
2001 in Pearl District Part of major
redevelopment project including high-density up-zoning of former industrial area
Linked employment, education, residential
2.4 miles, $54.5 million Significant parking bond
financing
Portland Streetcar Funding Sources
Total Funding (in Millions of Dollars)
Parking Garage Bonds $28.5LID $9.6TIF $7.5Federal $5.0Parking Revenue $2.0ST Railcar Procurement $0.2Tax Breaks Agreement $0.9HUD $0.5Interest $0.4
Total $54.5

Case Study: Portland, Oregon Outcomes:
Ridership: Double projected Retail: Significant foot traffic;
included in marketing as a major amenity
Parking reduction: average .95 spaces per residential unit
Development: Developers built to 90% of regulated maximum density near line, versus 43% 3 blocks away
Main Lesson: Streetcar provided a major boost to redevelopment by linking it internally and to other districts
Source: Center for Transit-Oriented Development

Case Study: Tampa, Florida Opened 2002 as a tourist
amenity connector Cruise ship docks, Channelside
District, Ybor City nightlife area 2.3 miles, $57.6 million Outcomes:
Retailers report increased sales 313% median value increase
along line 2002-2008 Functions primarily as a tool for
tourist movement and tourism branding
Main Lesson: Funding was only possible with many sources (see at right)
Tampa Streetcar Funding Sources
Total Funding (in Millions of Dollars)
Federal CMAQ $14.3
Tampa Direct Contribution (Gas Taxes)
$13.8
Federal 5307 Urbanized Area Formula
$6.8
Federal 5309 New Starts $4.9
State Intermodal Funds $4.3
Local Land Sale Proceeds $4.2
Other State Funding $2.0
Federal TSCP $1.9
State DDR $1.2
State CMAQ $1.1
Federal STP $1.0
State Urban Transit Funds $1.0
HART (Local Transit Agency) $0.8
Other Local Funding $0.3
Total $57.6

Case Study: Seattle, Washington South Lake Union – redevelopment
area 1.3 miles in first phase, $52 million Billionaire Paul Allen and the mayor
strongly advocated for line Local assessment passed more
easily due to presence of two large landowners
Outcomes: Ridership exceeded expectations
40% Property values increased 50-85%
Main Lesson: Local advocacy was key to implementation
Portland Streetcar Funding Sources
Total Funding (in Millions of Dollars)
LID $25.7
Federal $14.9
Surplus Property Sales $8.5
State $3.0
Total $52.1

Case Study Lessons Learned Implementation requires powerful, interested
advocates and property owner enthusiasm In most instances local funding came from
multiple sources Value boosts – and local funding capture – are
easiest to achieve when opportunity exists for new development
Streetcar benefits are strongest within 2-3 blocks of line
Positive but uneven impacts occurred in all cities for ridership, retail, tourism, parking needs, and real estate development
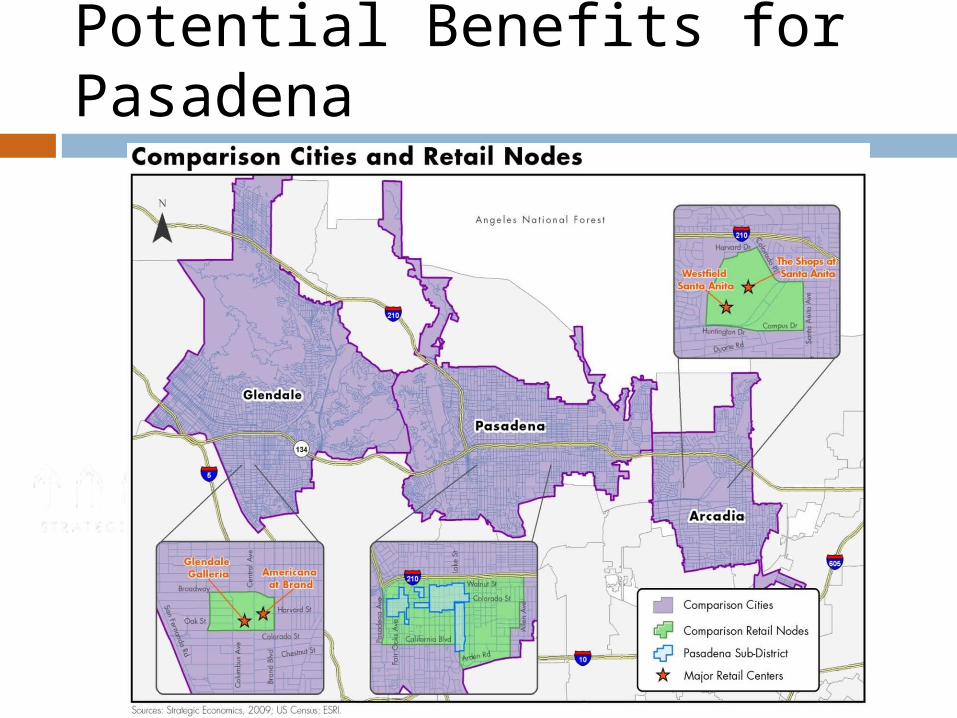
Costs and Funding/Financing
Capital Costs Costs for construction and
vehicle purchase Requires large, immediately-
available funds Obtain funds via grants or
bonding against future revenues Operating Costs
Costs for system operations and maintenance
Requires ongoing funding streams
Top: Portland streetcar infrastructureBottom: Passenger loading in PortlandSource: Center for Transit-Oriented Development

Capital Costs
CAPITAL COST ESTIMATES
Modern Low Floor Cars
Vintage Replica Cars
Main Alignment(10 minute headways, 6 vehicles)
~$88 m ~$70 m
Green Street Extension +$18 m + $18 m
California Boulevard Extension +$11.5 m +$11.5 m
Assumes one-way couplet on Union and Green Streets, two-way service on Lake Avenue
Numbers and types of vehicles are most easily-flexible cost centers
Minimum of 5 vehicles are needed for ten-minute service frequency (4 in regular service and 1 spare)
However, 6 vehicles are recommended due to 24-30 month acquisition time and the risk of having no spares if a vehicle is in a collision

Financing and Funding: Capital Cost Funding Sources
•Memoranda provide detailed information on 36 potential sources for capital and operating costs•Most promising sources are listed below

Financing and Funding: Capital Cost Funding Sources
Federal Sources: Reasonable expectation of $25 million to $40
million for a competitive project Various funding programs come and go
For example, latest round of $25 million “Urban Circulator Grants” are now exhausted
General increase in “livability” project funding
Significant local match required Case study cities assembled 10% - 50% of project
costs from a variety of sources
Must apply for Federal funds through Metro

Financing and Funding: Capital Cost Funding Sources
Local Sources: Value Capture “Value capture” sources derive revenue from value
boosts occurring near the streetcar Can bond against future revenues
Most typical mechanism is a local “benefit assessment district” Voted by affected property owners Community Facilities District or Special Assessment District
Captures a portion of streetcar-driven value boosts Property values reflect increased rents/sales prices, which
reflect increased business sales or residential demand

Financing and Funding: Capital Cost Funding Sources
Hypothetical Value Capture Scenario
Shows assessment per square foot required to raise $20m to $30m
Includes value of existing and likely future development
“Growth Cap” reflects future development with/without current housing unit restrictions
At highest rate: Mid-sized commercial space pays $400 annually Typical condominium pays $125 annually
Bonding Amount $20,000,000 $30,000,000Assessment per SF With Growth Cap $0.0529 $0.0794
Assessment per SF Without Growth Cap $0.0445 $0.0667

Financing and Funding: Capital Cost Funding Sources
Other Potential Local Sources: Redevelopment TIF: If prioritized and approved,
$10m to $15m potential Parking revenue Measure R funds Advertising and naming rights Pasadena Water and Power
Operator, power subsidy, and/or ridership rebates on utility fees
Institutional cooperation/contributions Etc.

Financing and Funding: Capital Cost Scenarios
Hypothetical Capital Cost Funding Scenarios

Operating Costs
10 minute frequency: ~$4,000,000 annually
Costs vary based on: Travel speed, frequency, number of stops, length of line,
hours of service, annual operating hours, and assumed cost per hour of revenue service ($140-$170 is reasonable)

Financing and Funding:Operating Cost Funding Sources Some operating cost sources overlap with capital cost
sources – cannot overload these sources Must provide ongoing revenue Most promising sample sources listed below

Recommended Next Steps
Determine whether to pursue Form a structure for moving project forward…
…others have used a non-profit corporation
Comprehensively gauge property and business owner support
Identify highest-potential local funding sources Confirm availability of funding Apply for Federal funding as available

PASADENA STREETCAR FEASIBILITY STUDY
Executive Summary