Embed Size (px)
Citation preview

This file is part of the following reference:
Sharp, Michael Francis (2015) Parvalbumin: characterisation of the cross-reactive major fish allergen.
PhD thesis, James Cook University.
Access to this file is available from:
http://researchonline.jcu.edu.au/43788/
The author has certified to JCU that they have made a reasonable effort to gain permission and acknowledge the owner of any third party copyright material
included in this document. If you believe that this is not the case, please contact [email protected] and quote
http://researchonline.jcu.edu.au/43788/
ResearchOnline@JCU
Parvalbumin:
Characterisation of the cross-reactive major fish allergen
Thesis submitted by
Michael Francis Sharp
Bachelor of Science (Hons)
In February of 2015
For the degree of Doctor of Philosophy
College of Public Health, Medical and Veterinary Sciences
James Cook University, Townsville,
Australia

2
Principal Advisor
Associate Professor Andreas Lopata
Co- Supervisor
Professor Dean Jerry
Financial Support
Australian Post Graduate Award
School of Pharmacy and Molecular Sciences top-up scholarship
ARC Future Fellowship (awarded to Associate Professor Andreas Lopata)
i
ACKNOWLEDGEMENTS
Firstly, I would like to thank the person who gave me this opportunity to get me out of
my comfort zone by travelling thousands of kilometers to the tropics and work on this
interesting topic, my supervisor Associate Professor Andreas Lopata. His guidance and
support has allowed me to grow not just as a scientist, but as a person and I am truly
grateful. I would like to thank Professor Dean Jerry for his added support and ideas, I
don’t believe I could have had a greater advisory team.
I would like to thank Professor Jim Burnell and Dr. Luke Norbury for kick starting my
experiments at the start of the candidature. If it wasn’t for them I may be still twiddling
my thumbs wondering where to start. Again I would like to thank Andreas, Jim and Dr
Fiona Baird for the teaching opportunities they gave me. Teaching was an enjoyable and
productive distraction.
To our tightknit research team, for the guidance, support, and friendship from Fiona,
Martina, Shan Shan, Shruti, Sandip and Nik I am again truly grateful.
To the most welcoming group of mates from University Hawks football club who I
spent many hours with when escaping my work.
I would like to thank my Mother Jo, Father Colin, my Grandparents Jen and Joe and the
rest of my family and friends which I was reluctant to move away from, for their never
ending support and encouragement, which gave me the strength to keep going when
times were tough. And most of all, I would like to thank my beautiful wife, Sarah, who
has been with me every step of this amazing journey.
Finally I would like to dedicate the dissertation to my late Grandfather Joe, who passed
away during my candidature. He is the person behind who I am today and will forever
inspire me to wonder.
ii
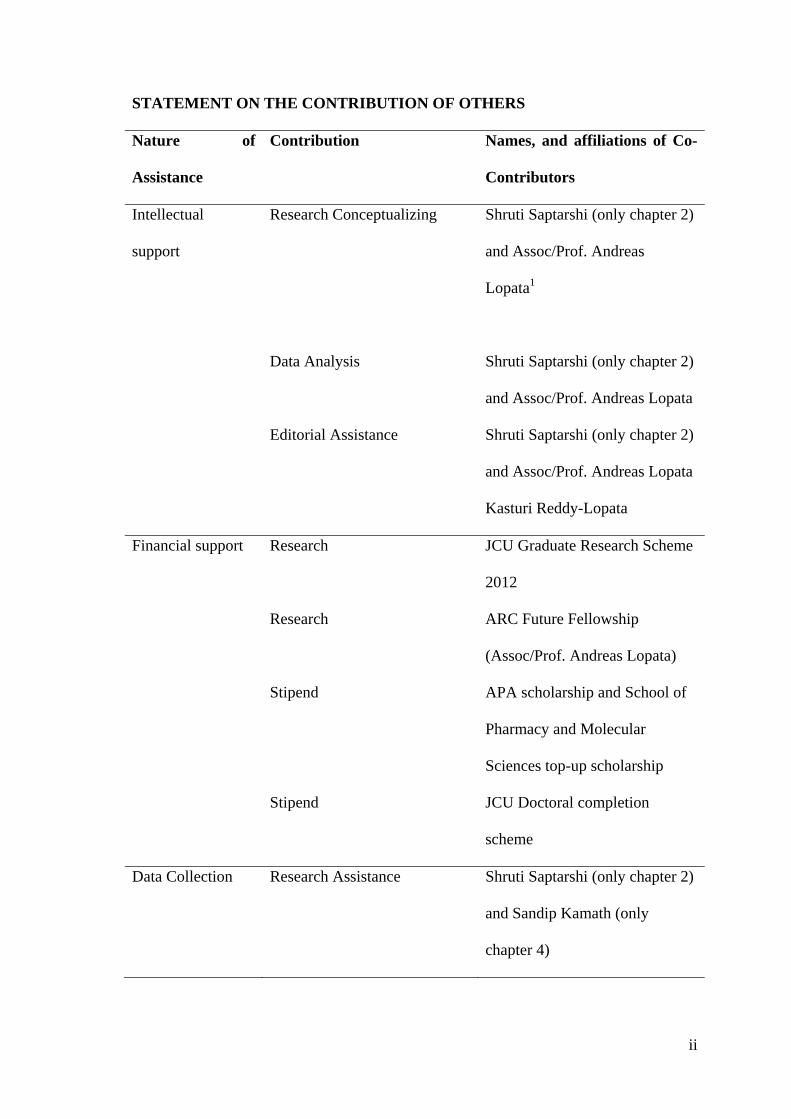
STATEMENT ON THE CONTRIBUTION OF OTHERS
Nature of
Assistance
Contribution Names, and affiliations of Co-
Contributors
Intellectual
support
Research Conceptualizing Shruti Saptarshi (only chapter 2)
and Assoc/Prof. Andreas
Lopata1
Data Analysis Shruti Saptarshi (only chapter 2)
and Assoc/Prof. Andreas Lopata
Editorial Assistance Shruti Saptarshi (only chapter 2)
and Assoc/Prof. Andreas Lopata
Kasturi Reddy-Lopata
Financial support Research JCU Graduate Research Scheme
2012
Research ARC Future Fellowship
(Assoc/Prof. Andreas Lopata)
Stipend APA scholarship and School of
Pharmacy and Molecular
Sciences top-up scholarship
Stipend JCU Doctoral completion
scheme
Data Collection Research Assistance Shruti Saptarshi (only chapter 2)
and Sandip Kamath (only
chapter 4)

iii
DECLARATION ON ETHICS
This research presented and reported in this thesis was conducted in accordance with the
National Health and Medical Research Council (NHMRC) National Statement on
Ethical Conduct in Human Research, 2007. The proposed research study received
human research ethics approval from the JCU Human Research Ethics Committee
Approval Number H4313
COPYRIGHT STATEMENT
Every reasonable effort has been made to gain permission and acknowledge the owners
of copyright material. I would be pleased to hear from any copyright owner who has
been omitted or incorrectly acknowledged.

iv
CONTENTS
ACKNOWLEDGEMENTS ................................................................................... i
STATEMENT ON THE CONTRIBUTION OF OTHERS ................................. ii
DECLARATION ON ETHICS ........................................................................... iii
COPYRIGHT STATEMENT .............................................................................. iii
CONTENTS ......................................................................................................... iv
PUBLICATIONS ARISING FROM THESIS ..................................................... x
LIST OF FIGURES ............................................................................................. xi
LIST OF TABLES ............................................................................................. xiii
LIST OF ABBREVIATIONS ............................................................................ xiv
ABSTRACT ....................................................................................................... xvi
Introduction to fish allergy .................................................................. 1 CHAPTER 1
1.1 General introduction ........................................................................................... 2
1.2 Demographics and prevalence ........................................................................... 2
1.2.1 Children ...................................................................................................... 2
1.2.2 Adults .......................................................................................................... 6
1.3 Clinical features, exposure routes and mechanisms of fish allergy ................... 8
1.4 Classification of fish ........................................................................................ 12
1.5 Fish Allergens .................................................................................................. 13
1.5.1 The major fish allergen parvalbumin ........................................................ 13
1.5.2 IgE Epitopes and Cross-reactivity ............................................................ 14
1.5.3 Other Fish Allergens ................................................................................. 17

v
1.6 Non-IgE mediated reactions to fish .................................................................. 19
1.7 Diagnosis and management of fish allergy ...................................................... 20
1.8 Conclusion ........................................................................................................ 25
1.9 Research objectives .......................................................................................... 27
Antibody reactivity to the major fish allergen parvalbumin is CHAPTER 2
determined by isoforms and impact of thermal processing ............................................ 28
2.1 Introduction ...................................................................................................... 29
2.1.1 Aims .......................................................................................................... 30
2.2 Materials and methods ..................................................................................... 31
2.2.1 Fish samples .............................................................................................. 31
2.2.2 Preparation of protein extracts .................................................................. 31
2.2.3 Protein quantification ................................................................................ 31
2.2.4 SDS-PAGE analysis ................................................................................. 32
2.2.5 Immunoblotting ........................................................................................ 32
2.2.6 Inhibition-ELISA ...................................................................................... 32
2.2.7 Amino acid sequence alignment of parvalbumin and epitope analysis .... 35
2.2.8 Phylogenetic analysis of fish parvalbumin amino acid sequences. .......... 35
2.3 Results .............................................................................................................. 36
2.3.1 Protein profiles of fish extracts and effect of heat treatment .................... 36
2.3.2 Monoclonal antibody reactivity to parvalbumin in raw and heated fish
extracts .................................................................................................................. 37

vi
2.3.3 Monoclonal antibody cross-reactivity of carp parvalbumin against heated
fish extracts ............................................................................................................. 40
2.3.4 Epitope analysis of monoclonal antibody between bony and cartilaginous
fish .................................................................................................................. 41
2.3.5 Phylogenetic relationships of fish parvalbumins ...................................... 42
2.4 Discussion ........................................................................................................ 45
2.4.1 Future direction ......................................................................................... 47
Analysis of immunological cross reactivity between parvalbumins CHAPTER 3
using four polyclonal anti-fish parvalbumin IgG antibodies .......................................... 48
3.1 Introduction ...................................................................................................... 49
3.1.1 Aims .......................................................................................................... 50
3.2 Materials and methods ..................................................................................... 51
3.2.1 Fish protein extraction and parvalbumin purification ............................... 51
3.2.2 Production and purification of polyclonal anti-parvalbumin antibodies .. 53
3.2.3 Polyclonal antibody inter-antigen cross reactivity .................................... 54
3.2.4 Antibody screening of fish protein extracts .............................................. 54
3.2.5 Immunoblot Analysis ................................................................................ 55
3.3 Results .............................................................................................................. 57
3.3.1 Fish extract analysis .................................................................................. 57
3.3.2 Antigen selection and purification ............................................................ 59
3.3.3 Cross reactivity of generated polyclonal antibodies ................................. 59
3.3.4 Antibody reactivity against fish extract panel .......................................... 62

vii
3.4 Discussion ........................................................................................................ 71
3.4.1 Future directions ....................................................................................... 75
Characterisation and identification of two different novel allergenic CHAPTER 4
parvalbumin isoforms from Barramundi ........................................................................ 76
4.1 Introduction ...................................................................................................... 77
4.1.1 Aims .......................................................................................................... 78
4.2 Materials and methods ..................................................................................... 80
4.2.1 Patient sera ................................................................................................ 80
4.2.2 Fish collection ........................................................................................... 80
4.2.3 Protein extraction ...................................................................................... 80
4.2.4 Sodium dodecyl sulfate polyacrylamide gel electrophoresis (SDS-PAGE)
and immunoblot analysis ........................................................................................ 81
4.2.5 Identification of allergens by mass spectrometry ..................................... 82
4.2.6 Two-dimensional electrophoresis of raw extract ...................................... 83
4.2.7 RNA isolation and cDNA synthesis ......................................................... 83
4.2.8 PCR amplification and sequencing ........................................................... 83
4.2.9 Recombinant protein expression and purification .................................... 86
4.2.10 IgE enzyme-linked immunosorbent assay (ELISA) ................................. 87
4.2.11 3D modeling of parvalbumin isoforms ..................................................... 87
4.2.12 Data analysis ............................................................................................. 87
4.3 Results .............................................................................................................. 89
4.3.1 SDS-PAGE and immunoblot analysis of IgE binding proteins. ............... 89

viii
4.3.2 Analysis of parvalbumin isoforms amino acid sequences translated from
cDNA. .................................................................................................................. 91
4.3.3 Comparison of IgE binding from adults and children against barramundi
extracts. .................................................................................................................. 94
4.4 Discussion ........................................................................................................ 99
4.4.1 Conclusion and future direction .............................................................. 103
Antibody epitope mapping of allergenic beta-1 parvalbumin isoform CHAPTER 5
from Barramundi ......................................................................................................... 104
5.1 Introduction .................................................................................................... 105
5.1.1 Aims ........................................................................................................ 106
5.2 Materials and methods ................................................................................... 107
5.2.1 Patient sera .............................................................................................. 107
5.2.2 Recombinant parvalbumin ...................................................................... 107
5.2.3 IgE and IgG4 immunoblot analysis ......................................................... 107
5.2.4 Peptide inhibition of IgE and IgG4 ......................................................... 108
5.2.5 3D modeling of parvalbumin isoforms ................................................... 109
5.2.6 Data analysis ........................................................................................... 109
5.3 Results ............................................................................................................ 111
5.3.1 Fish allergic patient IgE and IgG4 binding to rLat c 1.01 ....................... 111
5.3.2 IgE and IgG4 epitope analysis of Lat c 1.01 ........................................... 114
5.4 Discussion ...................................................................................................... 122
5.4.1 Conclusions and future directions ........................................................... 124

ix
General discussion ........................................................................... 126 CHAPTER 6
REFERENCES ............................................................................................................ 132
APPENDIX A .............................................................................................................. 144

x
PUBLICATIONS ARISING FROM THESIS
At the time of this thesis submission, four journal manuscripts describing the research
findings from Chapters 1, 2, 3 and 4 were published as well as one book chapter
(Chapter 4). A manuscript for chapter 5 is in preparation.
Sharp M. F. and Lopata A. L., 2013. Fish Allergy: In Review. Clin. Rev.
Allergy Immunol. (Chapter 1)
Sharp M. F. and Lopata A. L., 2013. Chapter 12: Muscle Proteins in Asian
Seabass – Parvalbumin’s Role as a Physiological Protein and Fish Allergen. In
Jerry D. R. (Ed.), CRC Press, pp. 293-307. (Chapter 4)
Saptarshi S. R.1, Sharp M. F.1, Kamath S. D. and Lopata A. L., 2014. Antibody
reactivity to the major fish allergen parvalbumin is determined by isoforms and
impact of thermal processing. Food Chem. 148, 321-328. (Chapter 2; 1These
authors contributed equally to this manuscript)
Sharp M. F., Kamath S. D., Koeberl M., Jerry D. R., O’Hehir R. E., Campbell
D. E. and Lopata A. L., 2014. Differential IgE binding to isoallergens from
Asian seabass (Lates calcarifer) in children and adults. Mol. Immunol. 62, 77-
85. (Chapter 4)
Sharp M. F., Stephen J. N., Kraft L., Weiss T., Kamath S. D., Lopata A. L.,
2015. Immunological cross-reactivity between four distant parvalbumins—
Impact on allergen detection and diagnostics. Mol Immunol. 63(2), 437-448.
(Chapter 3)
xi
LIST OF FIGURES
Figure 1.1 The top ten marine fish captured as of 2008, .................................................. 6
Figure 1.2 Amino acid sequence alignment .................................................................... 16
Figure 1.3 Diagnostic decision tree on how to proceed from the suspicion of fish-related
allergic symptoms .......................................................................................... 23
Figure 2.1 Sodium dodecyl sulphate polyacrylamide gel electrophoresis (SDS-PAGE)
of raw (A) and heat-processed (B) protein extracts of bony and cartilaginous
fish. ................................................................................................................ 37
Figure 2.2 Immunoblot analysis of raw (A) and heat-processed (B) protein extracts from
bony and cartilaginous fish using monoclonal anti-parvalbumin antibody ... 39
Figure 2.3 Inhibition ELISA ........................................................................................... 41
Figure 2.4 (A) The potential PARV-19 epitope ............................................................. 42
Figure 2.5 The evolutionary history of a variety of parvalbumins ................................. 43
Figure 3.1 Coomassie stained SDS-PAGE profile of all 45 raw (A) and heated (B) fish
muscle extracts from 17 different fish orders ................................................ 58
Figure 3.2. The evolutionary history of a selection of fish parvalbumin ........................ 60
Figure 3.3 A Purification chromatograms of parvalbumin ............................................. 61
Figure 3.4 Inhibition ELISA’s for the evaluation of the generated anti-parvalbumin
polyclonal antibodies ..................................................................................... 62
Figure 3.5 Immunoblots using anti-barramundi (blue), anti-basa (yellow), anti-pilchard
(green) and anti-salmon (red) polyclonal antibodies ..................................... 65
Figure 3.6 Allergogram of all raw extract immunoblots grading the strength of binding
....................................................................................................................... 66
Figure 3.7 Immunoblot with anti-pilchard parvalbumin antibody against both raw and
heated pilchard extract. .................................................................................. 67

xii
Figure 3.8 Indirect ELISA’s using anti-barramundi, anti-basa, anti-pilchard and anti-
salmon polyclonal antibodies ......................................................................... 69
Figure 4.1 The extracted barramundi proteins ................................................................ 90
Figure 4.2 Two-dimensional electrophoresis analysis of raw barramundi extract. ........ 91
Figure 4.3 Space filling models of both Lat c 1.0101 and Lat c 1.0201 based on the
template 4cpv. ................................................................................................ 93
Figure 4.4 Generated recombinant parvalbumin isoforms ............................................. 94
Figure 4.5 ELISA for serum IgE reactivity .................................................................... 96
Figure 4.6 Comparison of the IgE ELISAs of raw and heated protein extract and both β1
and β2 recombinant parvalbumins ................................................................. 98
Figure 5.1 A) IgE and IgG4 immunoblots against barramundi recombinant β1
parvalbumin ................................................................................................. 112
Figure 5.2 ELISA for serum IgE (black) and IgG4 (grey) reactivity to purified
recombinant Lat c 1.01 ................................................................................ 113
Figure 5.3 ELISA inhibition with the synthetic peptides and individual paediatric
patient serum IgE (black) and IgG4 (grey) ................................................... 115
Figure 5.4 ELISA inhibition with synthetic peptides and individual adult patient serum
IgE (black) and IgG4 (grey) .......................................................................... 116
Figure 5.5 A) IgE Inhibition ELISA using all 24 patients (purple) and 5 negative
patients (black) ............................................................................................. 118
Figure 5.6 A) IgG4 Inhibition ELISA using all 24 patients (purple) and five negative
patients (black) ............................................................................................. 119
Figure 5.7 A) Multiple alignment of the five known parvalbumin sequences that have
IgE epitopes elucidated ................................................................................ 121
xiii
LIST OF TABLES
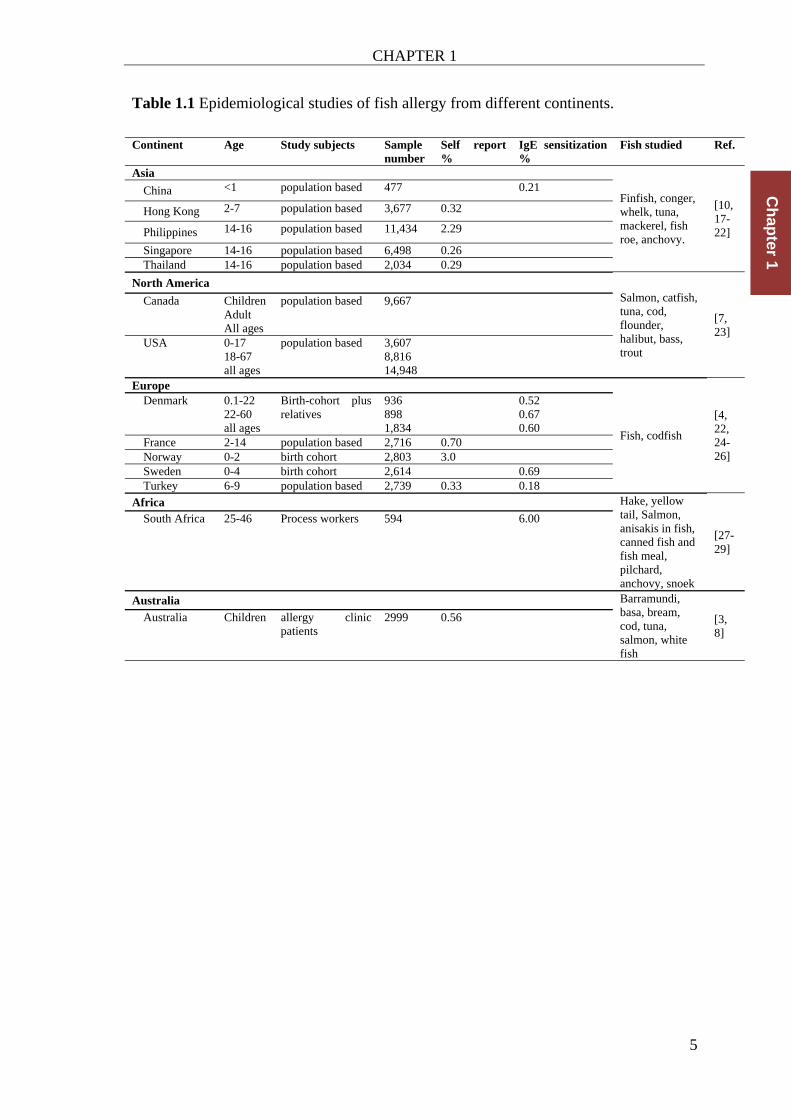
Table 1.1 Epidemiological studies of fish allergy from different continents. .................. 5
Table 1.2 Different routes and environments of exposures to fish species and allergens ..
......................................................................................................................... 9
Table 1.3 Selection of allergenic proteins characterised in 24 fish species representing 8
different orders and their biochemical characteristics (PV = parvalbumin) .. 18
Table 2.1 Biological classification and scientific names of fish species analyzed in this
study. .............................................................................................................. 34
Table 3.1 List of fish species used in this study ............................................................. 52
Table 3.2 Analysis of raw and heated extracts from the indirect ELISA. Ticks represent
greater binding to raw, heated, no difference (neutral) or negative binding. 70
Table 4.1 Summary of clinical histories and laboratory data of children ‘C’ and adult
‘A’ patients used in the study. ....................................................................... 85
Table 4.2 Summary of immunoblot IgE reactivity between adult and paediatric patients.
....................................................................................................................... 95
Table 5.1 Clinical history and laboratory data of paediatric and adult patients analysed.
..................................................................................................................... 110

xiv
LIST OF ABBREVIATIONS
g Microgram
L Microlitre
µm Micrometre
aa Amino acid
ab Antibody
ag Antigen
Amp Ampicillin
BSA Bovine serum albumin
C Degrees centigrade
C-terminal Carboxyl terminus domain of an amino acid sequence/protein
Ca2+ Calcium ions
Da Dalton
dH2O Distilled water
DNA Deoxyribonucleic acid
ELISA Enzyme-linked immunosorbent assay
g Gram
h Hour
H2O Water
HCl Hydrochloric acid
HRP Horseradish peroxidase
Ig Immunoglobulin
IMAC Immobilised metal affinity chromatography
IPTG Isopropyl-β-D-thiogalactopyranoside
kDa One thousand Daltons
L Litre
M Molarity
mAb Monoclonal antibody
Mg2+ Magnesium ion
Mg Milligram
mM Millimolar
MW Molecular weight
N-terminal Amino terminal domain of an amino acid sequence/protein

xv
NaCl Sodium chloride
NaOH Sodium hydroxide
nm Nanometre
OD Optical density
pAb Polyclonal antibody
PAGE Polyacrylamide gel electrophoresis
PBS Phosphate buffered saline
PBS-T PBS with 0.05% (v/v) Tween 20
PCR Polymerase chain reaction
pH Negative algorithm of hydrogen ion concentration
SDS Sodium dodecyl sulphate
TBS Tris-buffered saline
TBS-T TBS with 0.05% (v/v) Tween 20
TEMED N,N,N',N'-tetramethylethylenediamine
TH2 Effector T-cells involved in the initiation of humoral immune responses
Tris Tris(hydroxymethyl)aminomethanene
UV Ultraviolet
V Voltage
v/v Volume per volume
w/v Weight per volume
WHO World Health Organisation
xvi
ABSTRACT
Fish are the largest and most diverse group of vertebrates. Fish are also a part of the
eight food groups that cause the majority of IgE mediated food reactions. Detection
tools for fish allergens and fish allergy diagnostics are however limited due to the great
diversity of fish species, despite fish allergy and its major allergen parvalbumin being
well documented. Currently the best treatment strategy for fish allergy is avoidance. The
most commonly studied fish are cod, carp and Atlantic salmon as they are frequently
consumed in North America and Europe. However much less is known about fish
allergens in the Australasian region, although fish is widely consumed in this region.
The major fish allergen is parvalbumin, a small calcium binding protein found in the
muscles of vertebrates which are the biggest group of animal derived food allergens,
part of the EF Hand domain protein family. Fish can express multiple parvalbumin
isoforms which may differ greatly in amino acid sequence that further complicates the
diagnosis of fish allergy and the detection of these allergens. In this PhD thesis, fish
allergen detection methods will be evaluated in addition to the characterisation of novel
fish allergens from the Australasian region to improve current diagnostic and detection
methods and future development of immunotherapies for fish allergy sufferers.
Firstly, the evaluation of the cross-reactivity of parvalbumin from a variety of bony and
cartilaginous fish, from the Asia-Pacific region was performed with the monoclonal
anti-parvalbumin antibody PARV-19. The presence of monomeric and oligomeric
parvalbumin was demonstrated in all fish analysed, except for gummy shark, which is a
cartilaginous fish. Heat processing of this allergen greatly affected its antibody
reactivity. While heating caused a reduction in antibody reactivity to multimeric forms
of parvalbumins for most bony fish, a complete loss of reactivity was observed for all
cartilaginous fish except for the elephant shark. Molecular analysis demonstrated that
xvii
the observed cross-reactivity between parvalbumin from diverse fish species is due to
the molecular phylogenetic association of this major fish allergen.
A more comprehensive phylogenetic analysis was performed with all currently known
parvalbumin sequences to determine possible candidate antigens for new cross-reactive
antibodies. Polyclonal rabbit antibodies were raised against parvalbumins from
frequently consumed barramundi (Lates calcarifer), basa (Pangasius bocourti), pilchard
(Sardinops sagax) and Atlantic salmon (Salmo salar). These were evaluated for cross-
reactivity against a panel of 45 fish extracts, including raw, heated and canned fish.
Anti-barramundi parvalbumin proved to be the most cross-reactive antibody followed
by anti-pilchard and anti-basa antibody. In contrast the anti-salmon antibody was very
specific and only reacted to salmonidae and very few other fish. All analysed fish
species, except mahi mahi, swordfish, yellowfin tuna and all five canned fish had
parvalbumin detected in raw extracts. However antibody reactivity to many species was
heat liable or susceptible to denaturation, demonstrating that these parvalbumins have
most likely conformational epitopes, which lose antibody reactivity after heat treatment.
Frequent allergic reactions to ingested barramundi among adults and children initiated
further characterisation of allergenic proteins from this frequently ingested barramundi.
Serum samples from 17 fish allergic adults and children from Australia were analysed
by ELISA and immunoblotting for IgE antibody reactivity to raw and heated
barramundi proteins. The molecular analysis of the identified allergens included mass
spectrometric analysis, genetic sequencing and generation of recombinant allergens.
Two novel parvalbumin isoforms (isoallergens) of the β-type were identified as the only
allergens in barramundi and subsequently designated as Lat c 1.0101 and Lat c 1.0201
after registration with the International Union of Immunological Societies (IUIS). These
two isoallergens are differentially expressed in barramundi tissue but bind IgE from the

xviii
same patients. However these heat stable parvalbumin allergens from barramundi seem
to have differential IgE binding capacity between adults and paediatric patients. IgE and
IgG4 epitopic regions of Lat c 1.0101 were elucidated by using 7 overlapping peptides,
which were analysed by immunoarray with serum of fish allergic patients. IgE and IgG4
binding epitopes were compared to assess to the possibility of designing future novel
immunotherapeutics for fish allergy.
In conclusion this dissertation has demonstrated the generation of highly cross-reactive
anti-parvalbumin antibodies that could be used for the detection of allergenic fish
parvalbumin in contaminated food products. These cross-reactivity studies also
highlight the limitations of using antibodies for parvalbumin detection in processed fish.
The in depth molecular and immunological characterisation of novel isoallergens from
barramundi has widened the knowledge of fish allergy in the Asian Pacific region and
improves current diagnostic approaches and the information gained from elucidating
antibody epitopes can be used in the future development of specific immunotherapies
for fish allergy sufferers.
1
CHAPTER1
Introductiontofishallergy
Details of publication on which this
chapter is based
Nature and extent of the intellectual
input of each author, including the
candidate
Sharp M. F. and Lopata A. L., 2014.
Fish allergy: in review. Clin. Rev.
Allergy Immunol. 46, 258-71.
Sharp wrote the first draft of the paper
which was revised with editorial input from
Lopata. Sharp developed the figures and
tables.

CHAPTER 1
2
Ch
apter 1
1.1 General introduction
Seafood plays an important role in human nutrition and health, but can provoke serious
IgE-antibody mediated adverse reactions in susceptible individuals. A marked increase
in allergic diseases is occurring in most major industrialized countries. The World
Allergy Organization reports that in 2008 20-30% of the world population was affected
by allergy of some type. The seafood allergy and anaphylaxis epidemic is particularly
serious. Seafood allergy, including shellfish and fish, is typically life-long affecting up
to 5% of all children and 2% of all adults. While shellfish and fish allergy are often
discussed concurrently, likely due to culinary habits, the allergenic proteins causing
allergic sensitization are entirely different and shellfish allergens are not discussed in
this study. Prevalence rates specifically to fish vary considerably between regions and
among children and adults. This chapter compares the different prevalence rates of fish
allergy and explores the possible underlying molecular and immunological causes,
resulting in better diagnostic approaches for improved management of this life-long
food allergy.
1.2 Demographics and prevalence
1.2.1 Children
Fish allergy has a significant adverse effect on anxiety and stress in the families of
affected children. Parental recall of dietary advice is variable and many tend to impose
more stringent dietary avoidance than that recommended. Despite this, subsequent
accidental reactions are common and demonstrated in over 20% of diagnosed children
[3]. Thus, the avoidance of fish in children may be more difficult than often presumed.
CHAPTER 1
3
Ch
apter 1
In Europe most of the populations based prevalence studies come from Spain, Portugal
and the Scandinavian countries. In Norway, adverse food reactions were reported in a
population based study among 3623 children and nearly 3% of all reactions were
attributed to fish by the age of 2 years [4]. Thus fish allergy in Norway is almost as
common as allergy to egg among children, while fish allergy is more common in
children from Finland [5]. In Spain, a study among 355 children with diagnosed IgE
mediated food allergy reported that fish allergy began predominantly before the second
year of life [6].
In the USA allergy to seafood was reported by about 5.9% of 14,948 individuals, with
about 0.4% accounting for fish and 0.2% for both, shellfish and fish allergy [7]. The
major species reported causing allergic reactions are salmon, tuna, catfish and cod
followed by flounder, halibut, trout and bass. The majority of allergic subjects reacted
to multiple fish species (67%).
In Australia a retrospective study in a tertiary clinic among 2999 children with food
allergy demonstrated the prevalence of fish allergy (5.6%), with white fish, tuna and
salmon being the most implicated fish species [8].
Fish allergy is common, not only in the Western civilization, but also in Asian countries
where allergic reactions to fish are significant among children and adults [9] (Table
1.1). A study from Singapore of 227 children with food hypersensitivity confirmed that
fish are significant sensitizers in approximately 13% of children. Interestingly, the first
intake of fish seems to be very early in life in the Asian diet, with an average age of
exposure as low as 7 months. A subsequent prevalence study in the Southeast Asia
region used a survey previously developed by Sicherer et al. [7] to compare the
occurance of fish allergy among school children. The population-based study among

CHAPTER 1
4
Ch
apter 1
11,434 Filipino, 6,498 Singaporean and 2,034 Thai established that 2.29%, 0.26% and
0.29% of the children suffered from allergic sensitization to fish, respectively [10].
While the prevalence of fish allergy differed among these three Asian countries, females
where overall more likely to be sensitized compared to males for all children combined.
Nevertheless, most allergies appeared to be of mild nature as less than one third actually
sought medical consultation. In most cases allergic symptoms occurred on first
exposure and usually in later childhood. The majority of sensitized Filipino (>50%)
were 11-16 years at the time of their first reaction. The most frequently reported fish to
cause allergic reactions were anchovy and mackerel scad. Over one-third of sensitized
children reported multiple-fish allergy, most probably due to the major cross-reactive
fish allergen parvalbumin [11-13]. However, the majority of children demonstrated
mono-sensitivity to one or the other fish species. Interestingly anchovy and mackerel
scad are the 1st and 5th most common marine fish captured worldwide (Figure 1.1),
highlighting that other populations with high consumption of these species might be of
increased risk of developing fish allergy. There are considerable country specific
differences, which give insights into the impact of cultural behaviors on developing a
specific food allergy. While anchovies are used in all three countries to prepare fish
sauce, in the Philippines these fish are prepared by drying and salting. This increased
immunological reactivity of heated food allergens has previously been described for
peanut [14] and also for the fish pilchard [15]. The molecular impact of heating fish
allergens is discussed further below. Importantly, children with fish allergy, similar to
peanut allergy, will predominately remain clinically reactive throughout their life. A
follow-up study by Priftis et al. [16] reported that 65.5% of fish-sensitized children
maintained their sensitization into school age and are at increased risk for wheezing
illness and hyperactive airways.
CHAPTER 1
5
Ch
apter 1
Table 1.1 Epidemiological studies of fish allergy from different continents.
Continent Age Study subjects Sample number
Self report %
IgE sensitization %
Fish studied Ref.
Asia
Finfish, conger, whelk, tuna, mackerel, fish roe, anchovy.
[10, 17-22]
China <1 population based 477 0.21
Hong Kong 2-7 population based 3,677 0.32
Philippines 14-16 population based 11,434 2.29
Singapore 14-16 population based 6,498 0.26 Thailand 14-16 population based 2,034 0.29
North America
Salmon, catfish, tuna, cod, flounder, halibut, bass, trout
[7, 23]
Canada Children Adult All ages
population based 9,667
USA 0-17 18-67 all ages
population based 3,607 8,816 14,948
Europe
Fish, codfish
[4, 22, 24-26]
Denmark 0.1-22 22-60 all ages
Birth-cohort plus relatives
936 898 1,834
0.52 0.67 0.60
France 2-14 population based 2,716 0.70 Norway 0-2 birth cohort 2,803 3.0 Sweden 0-4 birth cohort 2,614 0.69 Turkey 6-9 population based 2,739 0.33 0.18
Africa Hake, yellow tail, Salmon, anisakis in fish, canned fish and fish meal, pilchard, anchovy, snoek
[27-29]
South Africa
25-46 Process workers 594 6.00
Australia Barramundi, basa, bream, cod, tuna, salmon, white fish
[3, 8]
Australia Children allergy clinic patients
2999 0.56

CHAPTER 1
6
Ch
apter 1
It is to note that prevalence data generated using a survey of self-reported fish allergy
are usually higher as when confirmed by specific fish IgE tests. The diagnostic
problems and improved approaches are discussed below under ‘diagnosis and
management of fish allergy’.
Figure 1.1 The top ten marine fish captured as of 2008, diplayed in million tonnes [30]
1.2.2 Adults
A recent study by Vierk et al. [31] provided population-based prevalence data for
American adults from a Food Safety Survey of over 4,400 individuals. The prevalence
of fish allergy was found to be 0.7% and 0.6% among respondents with self-reported
fish allergy and self-reported doctor diagnosed fish allergy, respectively. Overall, there
was no difference in the prevalence of fish allergy between age or race/ethnic groups.
However, significantly more black than white respondents reported a fish allergy. A
similar observation was made by Sicherer et al. [7] in a telephone survey of 14,948
individuals with a prevalence of fish allergy of approximately 0.4%. The reasons for
these unexpected observations are not apparent and require further studies among this
ethnic group. A recent comparable survey in Canada among 9,667 individuals
demonstrated a similar prevalence of fish allergy of 0.51% [23].
CHAPTER 1
7
Ch
apter 1
In Asia fish allergy seems to be also high as documented by a study from Singapore
among 74 adults with IgE mediated food allergy, where fish allergy was 4.1 % however
less common than crustacean allergy (33.8%) [18].
A study in South Africa determined from a questionnaire of 105 subjects with
convincing history of seafood allergy found that the four most common bony fish
species causing IgE mediated allergic reactions were hake (24.8%), yellowtail (21.9%),
salmon (15.2%) and mackerel (15.2%) [32]. Clinical symptoms reported included
gastrointestinal, respiratory and dermatological related allergic symptoms. Subsequently
the allergenicity of five fish species was investigated among ten fish-allergic consumers
[11]. Pilchard displayed the strongest IgE reactivity, followed by anchovy, snoek, hake
and yellowtail. Interestingly most of these IgE reactivities increased after heat treatment
[11]. These findings confirmed previous observations on the heat stability and activity
of fish allergens[33].
Among adults, exposure to high concentrations of fish allergens and in particular heat-
processed fish is observed in various working environments. Occupational sensitization
to fish was first reported in 1937 by De Besche in a fisherman who developed allergic
symptoms when handling codfish [34]. Since then various other fish species have been
reported to cause occupational allergy and asthma including trout, salmon, pilchard,
anchovy, plaice, hake, tuna, haddock, cod and pollock [35]. Various studies from South
Africa and Norway report the prevalence of occupational asthma between 7-8% [28, 35-
37] and protein contact dermatitis from 3-11% [35]. The Food and Agriculture
Organization reports that over 45 million people are directly involved in fishery and
aquaculture production worldwide (Food and Agriculture Organisation, 2010), making
work-related reactions to fish allergens in various contexts an important consideration.

CHAPTER 1
8
Ch
apter 1
1.3 Clinical features, exposure routes and mechanisms of fish allergy
The main clinical manifestations of allergic reactions to fish include vomiting and
diarrhea whilst the most extreme form of reaction is life-threatening anaphylactic shock
(Table 1.2). Patients with fish allergy can however also react to aerosolized proteins
generated by cooking or processing of fish resulting in dyspnea, wheezing, tightness of
the throat, urticaria, edema and light-headedness [6, 28, 38-42]. Asthma appears to be a
risk factor for fatal anaphylaxis to food [43], and conversely, food allergy is a risk factor
for life-threatening asthma [16, 44].
The major route of sensitization to fish is however through the gastrointestinal tract.
This mechanism was confirmed for codfish allergens in animal [45] and human studies
[46]. The use of antacid medication that increased stomach pH can result in incomplete
digestion and thereby increase exposure to and uptake of allergenic fish proteins or
peptides. Challenge experiments on patients, without clinical sensitivity, demonstrated
absorption of biologically active fish allergens within 10 min of ingestion. Fish digested
at pH 3.0, as compared to normal stomach pH 2.0, revealed comparable reactivity
patterns as undigested extracts. However, the nature of the allergen or allergen fragment
was not identified in this study. These experiments confirm not only the very high
biochemical stability of fish allergens, but also their rapid uptake through the
gastrointestinal tract. If patients require antacid medication, this rapid uptake of fish
allergens could be of concern and should be discussed with the patient.

CHAPTER 1
9
Ch
apter 1
Table 1.2 Different routes and environments of exposures to fish species and allergens
Route of exposure
Allergen exposure Domestic Occupational
Clinical symptoms
Fish Species implicated Ref.
Ingestion Ingestion of - angiodema sea bream, [47-49] - raw - rhitinitis eel, - cooked - oral allergy pilchard, - processed syndrome salmon, fish - urticaria cod - anaphylaxis - nausea - gastrointesinal Skin Dermal - urticaria cod, [50-52] contact from - angiodema herring, - unprotected sardine, handling
swordfish
- preparation Inhalation Inhalation of
- asthma plaice, [6, 29, 35,
53] wet aerosols - rhinitis salmon, from - skin rash hake, - fish heading pilchard, - degutting anchovy, - boiling tuna, trout, sole, pomfret, yellowfin, salmon
In addition to uptake via the gastrointestinal tract, reactions to inhaled proteins are an
important aspect of fish allergy in both the domestic and occupational environment. In
domestic settings, a Spanish study reported 11% of children from a group of 197
allergic children experienced repeated allergic reactions upon incidental inhalation of
fish odors or vapors, even while on strict fish avoidance. In most cases, these episodes
occurred at home when other people were eating fish [40]. Similarly, a South African
study of 105 individuals with self-reported seafood allergy, reported 30% of individuals
with allergic symptoms after handling or inhaling seafood in the domestic home
environment [54].
In the workplace environment, occupational allergy and asthma is reported among
workers processing a variety of fish species including trout, salmon, pilchard, anchovy,

CHAPTER 1
10
Ch
apter 1
plaice, hake, tuna, haddock, cod and pollock [35, 55, 56]. Symptoms manifest mainly as
upper and lower airway respiratory symptoms and dermatitis, whereas anaphylaxis is
rarely seen with this type of exposure. Various studies from South Africa and Norway
report the prevalence of occupational asthma between 7-36% [28, 35-37] and for
occupational protein contact dermatitis, from 3-11% [35, 57]. Therefore work-related
reactions to fish allergens in various contexts are an important consideration particularly
as it is estimated that up to 15% of the asthmatic population in the USA and Europe
have occupational asthma [58, 59]. Atopy, smoking and level of exposure are
significant risk factors for allergic sensitization and the development of occupational
asthma. Fish antigen exposure levels of more than 30 ng/m3 have shown significant
correlation with sensitization and work-related asthma symptoms [28]. A similar study
quantified raw fish allergens from an open-air fish market and detected allergen
concentrations ranging from 2-25 ng/m3, very similar to the levels identified in the
occupational setting causing allergic sensitization [60]. From data on allergen exposure
available so far it can be expected that extended exposure to aerosolized fish allergens
can generate sensitization also in the domestic environment and probably also in
children. In general it is accepted that breaching of oral tolerance leads to food allergy,
however why adults develop de novo food allergy is as yet unknown, and inhalation of
fish allergens might be a relevant route of sensitization to consider [61, 62].
A number of fish allergens have been purified and characterised (Table 1.3) for
ingestion related sensitization. In contrast the fish proteins in aerosol responsible for
allergic sensitization have not yet been fully described [55]. IgE reactive proteins in
fresh, frozen and canned pilchard range from 12-250 kDa. Some of these proteins are
identified as monomeric (12 kDa) and oligomeric (36, 48 and 60kDa) forms of
parvalbumin, the major fish allergen in ingestion related allergy. Other fish allergens of

CHAPTER 1
11
Ch
apter 1
importance through the inhalational route might include glyceraldehyde-3-phosphate
dehydrogenase, which was recently identified in an exposed worker and in a murine
model of inhalational fish allergy [15]. In addition to allergens deriving directly from
fish tissue, other contaminants such as the fish parasite Anisakis have been implicated
in occupational sensitization [12, 28, 63, 64]. The major allergen seems to be
tropomyosin, which demonstrates cross-reactivity to other invertebrates but not to fish
[65, 66]. Future studies need to focus on the molecular characterisation of the
aerosolized fish allergen causing allergic sensitization and symptoms in the
occupational and domestic environment.
It is well recognized that food allergens are in general very heat stable. In addition it
seems that food processing and in particular heating can even increase allergenicity as
demonstrated for peanuts [67, 68]. Also the major fish allergen parvalbumin seems to
increase its allergenicity as demonstrated in a recent study by Beale et al [11], where
several IgE binding allergen variants of the major fish allergen parvalbumin where
identified in different fish species. This increased IgE reactivity seems also to be related
to stronger allergenicity of this allergen as shown in the subsequent development of the
first murine model for inhaled fish allergens [15]. Heat-treated pilchard allergens
significantly increased Th2 cytokines and specific IgE responses as compared to
untreated allergens. In contrast, raw pilchard allergens initiated a specific IgE response
to a novel fish allergen, glyceraldehyde-3-phosphate dehydrogenase. Interestingly
sensitized fish processing workers also recognized this IgE reactive allergen. This
murine model of inhalational fish allergy demonstrated for the first time that inhalation
exposure to fish allergens can generate a strong IgE mediated allergic sensitization to
parvalbumin.

CHAPTER 1
12
Ch
apter 1
This deep insight into the mechanism of inhaled fish allergy and the enhanced response
to heat treated parvalbumin is supported by recent studies on human cells. Enhanced
internalization of glycated allergens, such as ovalbumin, was recently studied in human
dendritic cells, which led to increased CD4+ T-cell immunogenicity of this protein [69,
70]. Heating of proteins in the presence of sugars such as glucose, result in the so-called
‘advanced glycation endproducts’ (AGEs), through the Maillard reaction. These AGEs
seem to stimulate the uptake of allergens by antigen-presenting cells through the
binding to scavenger receptors. In summary these studies give strong indications that
heated fish allergens are more allergenic than their un-heated counterparts and this
could be of considerable importance for better diagnostics but also the development of
novel therapeutics for this type of food allergy.
1.4 Classification of fish
Fish species can be divided into two main groups; the bony fish and cartilaginous fish.
Most edible fish belong to the bony fish (Osteichthyes), whereas sharks and rays are
cartilaginous and belong to a different class; Chondrichthyes. Most studies on fish
allergens have focused on cod, carp and salmon [71-77]. Although there are more than
32,400 different species of fish described [78], consumption depends heavily on
regional availability and can include under investigated fish such as basa, barramundi
and elephant shark.
The class of bony fish can be further divided into 45 orders. The most commonly
consumed bony fish belong to the orders Clupeiformes (herrings and sardines),
Salmoniformes (salmons and trouts), Cypriniformes (carps), Gadiformes (cods, hakes
and whiting), Siluriformes (catfish) and Perciformes (perches, mackerels and tunas).
The later order Perciformes itself comprises of 156 diverse families and is the largest
order of vertebrates with over 9,300 species [78]. The top marine fish species captured

CHAPTER 1
13
Ch
apter 1
include representatives from most of these orders (Figure 1.1) [30]. However, less than
0.5% of all known fish species have been analysed for their allergens on molecular level
and demonstrates unexpected large diversities as detailed below.
1.5 Fish Allergens
1.5.1 The major fish allergen parvalbumin
The Baltic cod was the first food source in the early 1970s to be ever analysed for the
molecular nature of the offending allergen. The major allergen identified was
subsequently named Gad c 1, a parvalbumin protein that regulates calcium switching in
muscular skeletal cells [79-81]. Parvalbumin represents the major clinical cross-reactive
fish allergen with 90% of fish allergic patients reacting to this protein [72, 82, 83].
Furthermore, this allergen forms the biggest group of animal derived food allergens, the
EF Hand domain family (http://www.meduniwien.ac.at/allergens/allfam/), with over 63
allergens currently reported.
Parvalbumin is not only present in lower vertebrates such as fish and frog, where it can
be an allergen [84, 85], but is also found in higher vertebrates including humans,
demonstrating that parvalbumin plays a vital role in basic vertebrate calcium physiology
[86]. Parvalbumins can be found as one of two distinct isoform lineages; α and β. Fish
often contain both α and β parvalbumin, however the majority of allergenic
parvalbumins reported belong to the β lineage (Table 1.1). Furthermore, most fish
express 2 or more different β parvalbumin isoforms, which are subsequently named β1,
β2 and so forth [71]. These β isoforms can differ significantly in amino acid sequence as
demonstrated for Atlantic salmon (Salmo salar) where their β1 and β2 isoforms have
only 64% identity. The differences in β parvalbumin isoforms in one species can result
in a fish allergic patient reacting to one isoform more than another, which adds to the

CHAPTER 1
14
Ch
apter 1
complexity of diagnosing fish allergy and detecting allergenic parvalbumin [76]. In
addition dimeric as well as polymeric forms of parvalbumin have also been reported to
bind IgE antibody and these allergens form higher molecular weight aggregates of
approximately 24 kDa and 48 kDa [87, 88]. The allergenicity of parvalbumin has been
studied in a number of fish species and as of 2012 the allergome database
(www.allergome.org) has 218 allergenic isoforms of fish parvalbumin listed, while only
27 of these isoforms are actually registered with the World Health Organization (WHO)
or International Union of Immunological Societies (IUIS). This registration
substantiates the prevalence and specific molecular nature of this allergen according to
specific guidelines by WHO and IUIS and has only been achieved for just over 10% of
all current studies. More detailed molecular studies on fish allergens will assist in the
development of better diagnostics and potential immunotherapeutics.
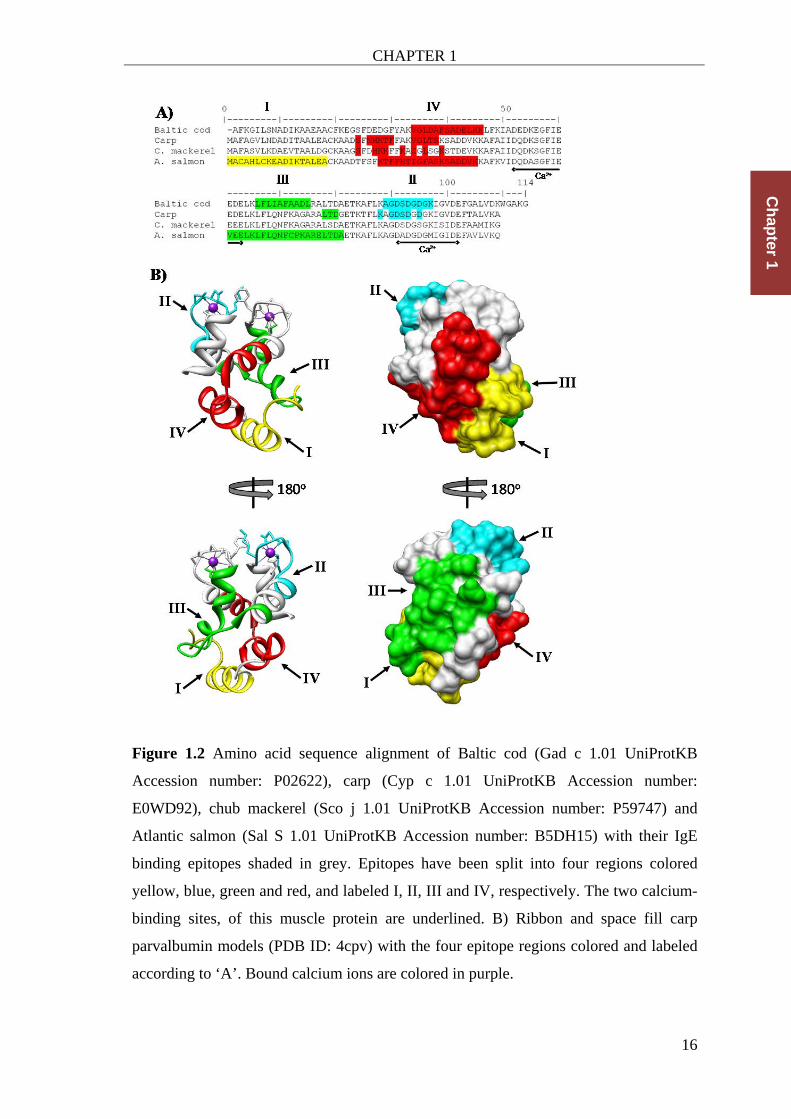
1.5.2 IgE Epitopes and Cross-reactivity
Thus far there have been four attempts to identify the IgE epitopes of allergenic
parvalbumins (Figure 1.2A). Parvalbumin from Baltic cod (Gad c 1), carp (Cyp c 1),
chub mackerel (Sco j 1) and Atlantic salmon (Sal s 1) were analysed for their specific
IgE epitopes. Allergic patient IgE was used in various techniques including phage
display library, overlapping immunogenic peptides and tryptic digests of parvalbumin to
map out these epitopes [73, 75, 76, 89]. These four fish parvalbumin display both linear
and conformational epitopes, however do not share identical residues. This may be due
to the polyclonal nature of IgE antibodies from different patients as well as the varying
techniques utilized to identify these epitopes. In summary, the four parvalbumin
allergens currently analysed on molecular level demonstrate very different IgE binding
epitopes [12, 75, 76, 82]. While the secondary and tertiary structures of parvalbumins
are highly conserved among fish, their primary structure, or amino acid sequence,
CHAPTER 1
15
Ch
apter 1
differs substantially. Epitope alignment of these four fish parvalbumins, using two
different computer models, allows the identification of highly antigenic (region IV) in
contrast to species-specific proteins regions (region I). Indeed the later can be confirmed
by reports of mono-sensitivity to salmonids [90, 91]. This phenomenon could account
for fish allergy sufferers having only about a 50% chance of being cross-reactive to
another fish species [92] and is significantly lower than the rate of shellfish cross-
reactivity which is up to 75% [92, 93]. Further studies need to confirm that the
identified protein region IV is responsible for sensitivity to multiple fish species, and
would be of great importance for improved diagnostics. The most recent parvalbumin
epitope study was of Atlantic cod parvalbumin (Gad m 1), the study concluded that IgE
epitopes to Gad m1 are highly variable and may be patient specific [94].
CHAPTER 1
16
Ch
apter 1
Figure 1.2 Amino acid sequence alignment of Baltic cod (Gad c 1.01 UniProtKB
Accession number: P02622), carp (Cyp c 1.01 UniProtKB Accession number:
E0WD92), chub mackerel (Sco j 1.01 UniProtKB Accession number: P59747) and
Atlantic salmon (Sal S 1.01 UniProtKB Accession number: B5DH15) with their IgE
binding epitopes shaded in grey. Epitopes have been split into four regions colored
yellow, blue, green and red, and labeled I, II, III and IV, respectively. The two calcium-
binding sites, of this muscle protein are underlined. B) Ribbon and space fill carp
parvalbumin models (PDB ID: 4cpv) with the four epitope regions colored and labeled
according to ‘A’. Bound calcium ions are colored in purple.

CHAPTER 1
17
Ch
apter 1
1.5.3 Other Fish Allergens
In addition to parvalbumin, other fish allergens have been characterised such as the
hormone vitellogenin from Beluga caviar [95, 96] and collagen and gelatin isolated
from skin [97, 98] and muscle tissues of fish [99]. The allergenicity of isinglass derived
from fish swim bladder used for filtering beer has also been investigated, demonstrating
that the gelatin content of isinglass to be harmless to fish allergic subjects. However,
small amount of allergenic parvalbumins were detected in isinglass at levels up to 414.7
mg/kg which might be of importance for very sensitive patients [100]. In addition,
enzymes such β-enolase and aldolase from cod, Atlantic salmon and tuna have been
submitted to WHO and IUIS as fish allergens. It is to note that there seems to be no
cross-reactive allergens between fish and shellfish [12, 93]. In addition to these
allergens derived from fish themselves, contaminants such as the parasite Anisakis can
cause allergic reactions [12, 101]. Exposure to proteins from live or dead Anisakis can
cause allergic reactions. The thirteen allergens characterised in Anisakis include
tropomyosin, as well as paramyosin and protease inhibitors. Allergens from Anisakis
appear not to be destroyed by heat or cooking and so allergic reactions may be triggered
by dead parasites in fish that have been well cooked. A recent study demonstrated that
these parasites can also cause considerable allergic sensitization among fish processing
workers [64, 102]. While the identified allergens seen not to cross-react to fish
allergens, possible allergic reactions to ingested fish could be directed to the
contaminating parasite Anisakis and be falsely diagnosed as fish allergy [12].

CHAPTER 1
18
Ch
apter 1
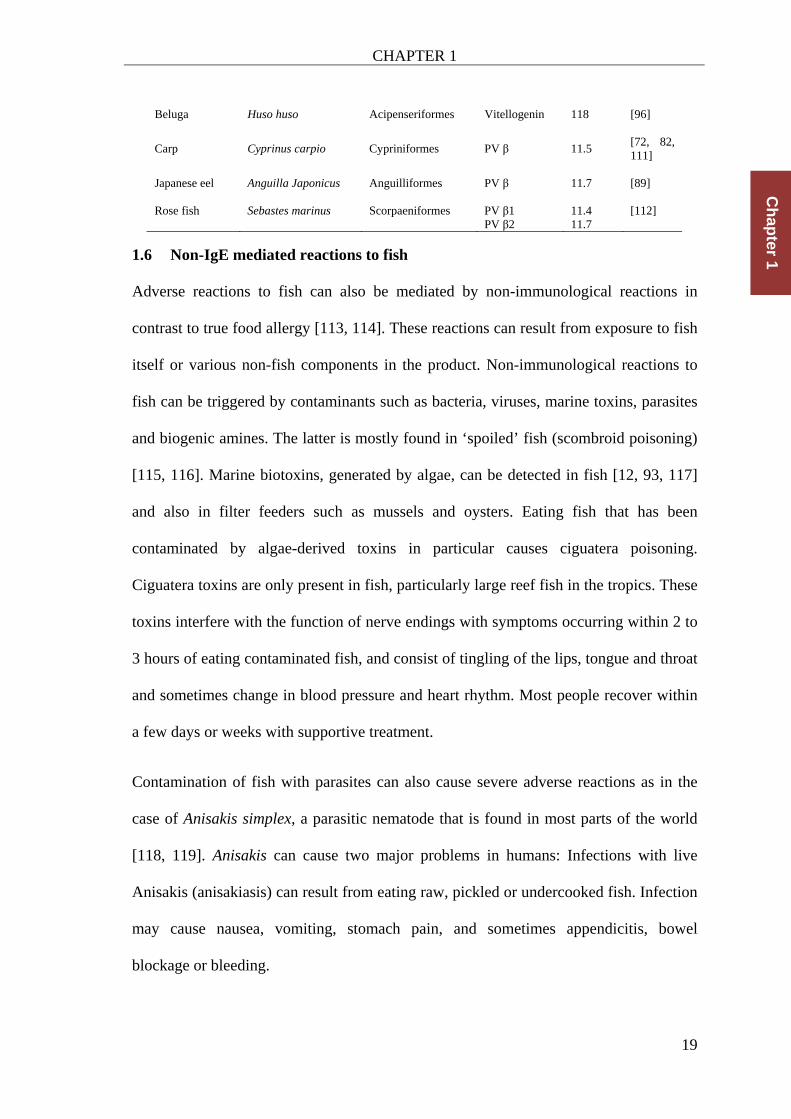
Table 1.3 Selection of allergenic proteins characterised in 24 fish species representing 8
different orders and their biochemical characteristics (PV = parvalbumin)
Common Name Scientific Name Order
Allergen identified Isoform
MW (kDa)
Ref.
Atlantic mackerel
Scomber Scombrus Perciformes PV β 11.5 [103]
Big eye tuna Thunnus obesus Perciformes Collagen 120-240 [97] Chub mackerel Scomber japonicus Perciformes PV β 11.5 [103] Japanese jack mackerel
Trachurus Japonicus Perciformes PV β 11.3 [104]
Skipjack tuna Katsuwonus pelamis Perciformes PV β 11.4 [89] Swordfish Xiphias gladius Perciformes PV β 11.5 [105] Yellowfin tuna Thunnus albacares Perciformes PV β 11.5 [13] Enolase β 47.1 Aldolase
Alaska pollock Theragra charlcogramma
Gadiformes PV β 11.5 [74]
Atlantic cod Gadus morhua Gadiformes PV β1 11.5 [71] PV β2 11.5 [71] PV β3 11.5 [106] PV β4 11.5 [106] Enolase β Aldolase Baltic cod Gadus callarias Gadiformes PV β 12.1 [73]
European hake Merluccius merluccius
Gadiformes PV β 11.3 [11, 107]
Atlantic herring Clupea harengus Clupeiformes PV β1 11.7 [108] PV β2 11.7 [108] PV β3 11.8 [108] Japanese sardine
Sardinops melanostictus
Clupeiformes PV β 11.9 [33, 89]
Pacific pilchard Sardinops sagax Clupeiformes PV β 11.9 [11] Atlantic salmon Salmo salar Salmoniformes PV β1 11.9 [77] Enolase β 47.3 Aldolase Rainbow trout Oncorhynchus mykiss Salmoniformes PV β1 11.8 PV β1 11.3 Vitellogenin - [109] Japanese flounder
Paralichthys olivaceus
Pleuronectiformes PV β 11.6 [89, 104]
Whiff Lepidorhombus whiffiagonis
Pleuronectiformes PV β 11.7 [110]
CHAPTER 1
19
Ch
apter 1
1.6 Non-IgE mediated reactions to fish
Adverse reactions to fish can also be mediated by non-immunological reactions in
contrast to true food allergy [113, 114]. These reactions can result from exposure to fish
itself or various non-fish components in the product. Non-immunological reactions to
fish can be triggered by contaminants such as bacteria, viruses, marine toxins, parasites
and biogenic amines. The latter is mostly found in ‘spoiled’ fish (scombroid poisoning)
[115, 116]. Marine biotoxins, generated by algae, can be detected in fish [12, 93, 117]
and also in filter feeders such as mussels and oysters. Eating fish that has been
contaminated by algae-derived toxins in particular causes ciguatera poisoning.
Ciguatera toxins are only present in fish, particularly large reef fish in the tropics. These
toxins interfere with the function of nerve endings with symptoms occurring within 2 to
3 hours of eating contaminated fish, and consist of tingling of the lips, tongue and throat
and sometimes change in blood pressure and heart rhythm. Most people recover within
a few days or weeks with supportive treatment.
Contamination of fish with parasites can also cause severe adverse reactions as in the
case of Anisakis simplex, a parasitic nematode that is found in most parts of the world
[118, 119]. Anisakis can cause two major problems in humans: Infections with live
Anisakis (anisakiasis) can result from eating raw, pickled or undercooked fish. Infection
may cause nausea, vomiting, stomach pain, and sometimes appendicitis, bowel
blockage or bleeding.
Beluga Huso huso Acipenseriformes Vitellogenin 118 [96]
Carp Cyprinus carpio Cypriniformes PV β 11.5 [72, 82, 111]
Japanese eel Anguilla Japonicus Anguilliformes PV β 11.7 [89] Rose fish Sebastes marinus Scorpaeniformes PV β1 11.4 [112] PV β2 11.7

CHAPTER 1
20
Ch
apter 1
Finally ingredients, such as spices and monosodium glutamate, added during processing
and canning of fish can also cause adverse reactions. Importantly all of these substances
can trigger clinical symptoms, which are similar to true allergic reactions including
respiratory symptoms, urticaria and headache. Due to this similarity in clinical reactions
of affected consumer and worker, it is of critical importance to differentiate adverse
reactions from true fish allergy and comprehend the underlying mechanisms of allergic
reactions and molecular nature of these allergens. Adverse reactions to fish are however
too manifold to be discussed in detail in this review and referred to other articles [12,
120, 121].
1.7 Diagnosis and management of fish allergy
In vitro diagnostic methods of fish allergy include in vivo skin prick test (SPT) as well
as in vitro quantification of specific IgE antibodies using assays such as the
ImmunoCAP (Thermo Fisher) and immunoblotting to identify the specific IgE binding
allergens. One example of commercial in vitro assays to quantify specific IgE to
allergens is the ImmunoCAP system, which offers currently 27 different fish species
and two recombinant fish allergens from carp and cod. However, a direct comparison of
all these fish species for their IgE reactivity has not been conducted. While these types
of assays contain the majority of possible allergens found in the individual fish species,
possible variations of parvalbumin concentrations cannot be taken into account. These
parvalbumin variations have recently being analysed in seven fish species by Kuehn et
al [108] and demonstrated over ten-fold lower concentrations of the major fish allergen
in tuna compared to herring, which could impact on the sensitivity of various diagnostic
tests.
It is well accepted that the level of serum IgE antibodies is directly related to the
severity of allergic reactions and previous studies by Sampson et al [122] tried to

CHAPTER 1
21
Ch
apter 1
predict clinical reactivity based on specific IgE levels. For cod-fish, a diagnostic level of
IgE that can predict clinical reactivity in a US population, with >95% certainty, was
identified as 20 KUA/l. It is however questionable if this seemingly high value can be
extrapolated to other fish species and other populations as IgE values as low as 1 kU/l
could be determined in patients with anaphylactic reactions to pilchard and anchovy
[11].
Patients who generate IgE antibodies to one parvalbumin often react to parvalbumin of
other fish species, demonstrating the importance of parvalbumin as a cross-reactive
major fish allergen [82]. Approximately one third of children and two thirds of adults
appear to react to multiple types of fish [7, 83, 123, 124]. Van Do et al [13]
demonstrated in 10 patients, using a combination of SPT, ImmunoCAP and
immunoblotting, that Gad c 1, Sal s 1, The c 1, herring, and wolfish contained the most
potent cross-reacting allergens, whereas halibut, flounder, tuna, and mackerel were the
least allergenic in the current study. It is suggested that the latter fish species could
probably be tolerated by some of the tested patients. However, allergic reactions to only
one specific type of fish have been reported such as to salmonids where patients react to
trout and salmon but not to cod, carp, herring or redfish [90, 91]. Asero et al. [125]
described a patient that was monosensitive to tropical sole but did not react to lemon
sole, cod, salmon, tuna and swordfish. Fish monosensitivity has also been seen in a
patient who reacted to tilapia and basa, but not to cod. Subsequent analysis showed that
the patient reacted to an unknown allergen but not to parvalbumin [126]. These few
studies demonstrate that monosensitivity to fish is not uncommon and most prominent
in children; however the molecular nature of responsible allergens is yet to be fully
elucidated. Recent findings by Gill et al. [127] indicate that reactivity to specific

CHAPTER 1
22
Ch
apter 1
allergens is associated with disease risk, confirming the importance of molecular
identification of causative allergens.
Skin prick testing (SPT) if frequently used as a first test to confirm or refute allergic
reactions to fish as it provides a rapid, safe and inexpensive method for screening
patients. Nevertheless, these types of tests are considered to be not very specific with a
positive predictive value often below 50% [128]. Skin prick tests are of particular
challenge for fish allergy due to the large variety of fish species being implicated and
the fact that the majority of patients seem to demonstrate monosensitivity to specific
species. To improve the specificity and sensitivity of this test Van do [13] compared the
SPT reactivity of the recombinant with the natural parvalbumins from salmon, cod and
pollock. Surprisingly only one of the ten patients recognized the recombinant versions
of the natural parvalbumins, which were in contrast recognized by nine of the patients.
The poor response obtained in using recombinant parvalbumin in SPT is possible due to
conformational masking of high-affinity IgE-binding motifs (Figure 1.2B). These
studies suggest that the IgE reactivity to recombinant parvalbumin has to be
investigated in more detail in future studies to use these allergens in in vitro and in vivo
tests.
The gold standard for diagnosing food allergy is still the double-blind, placebo-
controlled food challenge. A recent review by Niggemann and Beyer [1] proposes
various decision trees to approach food challenges including seafood-allergic patients.
A similar decision tree is suggested for fish allergy, which includes non-immunological
adverse reactions triggered by toxins and parasites (Figure 1.3). There is limited
information on the establishment of threshold values for elucidating allergic reactions to
fish. A recent study [46] demonstrated that for codfish, very small amounts of less than
3 mg protein could trigger allergic reactions, which is less than previously reported

CHAPTER 1
23
Ch
apter 1
[129]. A similar quantity was used to confirm allergy to yellowtail in a study on seven
fish allergic patients from South Africa [32].
One target for the development of immunotherapeutics for fish allergy is the muscle
protein parvalbumin, which is the major allergen recognized by over 90% of patients
with fish allergies [12, 82, 130-132]. The major IgE-binding epitopes of parvalbumin
are considered to be conformational epitopes as detailed in the studies above [75]. These
antibody epitopes appear to be dependent on the functional reactivity of the binding
sites for Ca2+ and Mg2+. Conformational changes in these protein regions using
recombinant technologies can result in hypoallergenic parvalbumin as has been recently
Suspicion of fish related clinical symptoms (from history)
fish specific IgE or SPT
n egative positive
diagnostic decision point for sIgE or SPT
below above
oral food challenge
negative positive
no diet for allergenavoidance
diet for allergen avoidance
test for toxins and parasites in food source
Figure 1.3 Diagnostic decision tree on how to proceed from the suspicion of fish-related
allergic symptoms to confirmation using laboratory based and clinical approaches,
modified from Niggemann et al [1] and Mehl et al [2]

CHAPTER 1
24
Ch
apter 1
demonstrated for carp [131]. Although still immunogenic, as demonstrated through
specific IgG responses in mice, the reactivity measured by SPT in patients was
markedly reduced. This novel hypoallergenic protein forms the basis for safer novel
forms of future vaccination against fish allergy. Nevertheless, it has to be highlighted
that the immunological reactivity of recombinant allergens are not necessarily identical
to native allergens. Van der Ventel et al. [15] demonstrated in an inhalant murine model
that the recombinant parvalbumin from carp is not as reactive as parvalbumin from
pilchard. In addition, heated parvalbumin was much more allergenic than raw
parvalbumin and other allergens, in addition to parvalbumin, seem to be relevant.
While heating appears to increase allergenicity of some of the fish allergens,
commercial heat processes, used to generate canned fish, seem to have a different effect.
A recent descriptive study from Australia demonstrated that more than 20% of children
allergic to salmon or tuna were able to tolerate the fish in canned form. Importantly this
was associated with a reduction in SPT size in most patients, implying that the
consumption of canned fish may have resulted in the induction of tolerance in these
patients [133].
One molecular indicator of a successful allergen immunotherapy is an increase in
allergen specific IgG4 serum levels. IgG4 can indicate one or both of two scenarios; (1) a
blocking antibody which out-competes allergen specific IgE and (2) a marker of
tolerance as studies have shown that successful immunotherapy will often lead to
elevated IgG4 serum levels [134-136]. However, the role of IgG4 in allergy and specific
immunotherapy is not completely understood due to IgG4 being a highly variable
antibody which has many roles in the immune system, many which are yet to be defined
[134, 137].

CHAPTER 1
25
Ch
apter 1
While immunotherapy for fish allergy is still in development, management of fish
allergy is generally directed at avoidance of the offending foods and prompt recognition
and treatment of acute allergic reactions. In addition, reactions to hidden food allergens
through inhalation of the fish allergens or via skin contact can also pose problems [38,
40]. In a recent study, 22.7% of 530 food-related reactions were due to hidden allergens,
with 35% of fish allergic patients having reacted to fish proteins hidden in other foods
or to fish vapors [38] .
In general, management of food allergies, including fish allergy, still primarily relies on
avoidance. The labeling of foods containing materials derived from fish has already
become mandatory in some countries such as the USA, Europe (EU) and Japan. While
in vitro assays for currently 14 food allergens in the EU are available, the detection of
parvalbumin is much more problematic as these allergens show very high biochemical
and immunological variability among the different fish species as detailed above [138,
139]. Currently there is only one commercial test available to detect the presence of fish
DNA, but is limited to twelve fish species (www.r-biopharm.com). Labeling regulations
have limitations because of accidental cross-contamination with allergens through
shared equipment in production lines or the unknown presence of a hidden fish allergen
such as clarification agents derived from fish bladders used in wine and beer [140].
1.8 Conclusion
Fish allergy can cause serious health effects and in addition has a significant adverse
effect on anxiety and stress among adults but also in families with allergic children.
There seems to be strong geographical differences in the prevalence of fish allergy,
possible due to different cultural dietary habits and type of food processing. The later
might even enhance allergenicity of fish allergens due to advanced glycation end-
products as demonstrated in vitro and utilizing murine models. More detailed
CHAPTER 1
26
Ch
apter 1
immunological studies are needed to characterize the impact of heating on fish allergens
to develop better food processing technologies to reduce their allergenicity.
The majority of allergic reactions to fish are caused by the major allergen parvalbumin.
Immunological cross-reactivity between the vast varieties of fish species seems to be
determined by the degree of amino acid homology and in addition number of allergen
isoforms and variants present in some of the highly allergenic species. In addition the
concentration of this major allergen varies significantly among the different fish species
and might impact on patients’ sensitivity to one or multiple species. Future comparative
studies need to investigate the molecular and immunological similarity of parvalbumins
among the different fish groups and families, with focus on B- and T-cell epitopes, to
allow the generation of group-specific recombinant allergens for better identification of
patients with multiple fish reactivity.
The route of sensitization to fish allergens seems to initiate differential immunological
reactions to additional allergens as demonstrated in the occupational environment,
which needs to be addressed for a complete diagnosis of fish allergy.
The current diagnosis and management of fish allergy are hampered by the lack of
detailed information of the molecular nature of these allergens, the enormous variety of
allergenic fish species consumed and the subsequent lack of suitable tests to detect
specific allergens in food products. In the absence of commercial IgE or SPT’s assays to
a specific fish species it is suggested to quantify specific IgE to important fish species,
including Atlantic cod, Atlantic salmon, Pacific pilchard, European hake, basa and
barramundi as these species cover the broad molecular spectrum of the major allergen
parvalbumin. In addition lipopolysaccharide free protein extracts, preferably raw and
heat-treated, of the specific fish species could be used for SPT.

CHAPTER 1
27
Ch
apter 1
Future comparative studies on the clinical reactivity to different fish species among
different populations will improve diagnosis and management of this life-long allergy.
The development of better recombinant and hypoallergenic parvalbumins is an
important basis for more sensitive and specific in vivo and in vitro diagnostics and safer
novel forms of vaccination against fish allergy.
1.9 Research objectives
Detailed review of current fish allergy literature has highlighted the lack of effective
detection tools for fish allergen. Most of the literature is derived from studies on species
from Europe and North America. Therefore in this thesis there will be a focus of
detection and characterisation of fish allergens from the Asia-Pacific region.
The first objective is to evaluate the most common fish allergen detection tool, the
monoclonal PARV-19 antibody, directed against frog parvalbumin antibody, using a
collection of regional fish species.
The second objective is to generate more effective antibodies and assess their cross-
reactive properties against an extensive range of fish species from the Asia-pacific
region.
The third objective is to characterize the important novel allergens from the Australian
iconic fish species, barramundi (Lates calcarifer).
The final objective is to characterize antibody interactions on a molecular scale of the
barramundi major allergen parvalbumin by mapping its antibody epitopes.

28
CHAPTER2
Antibodyreactivitytothemajorfishallergenparvalbuminis
determinedbyisoformsandimpactofthermalprocessing
Details of publication on which this
chapter is based
Nature and extent of the intellectual input
of each author, including the candidate
Saptarshi S. R.1, Sharp M. F.1, Kamath
S. D. and Lopata A. L., 2014. Antibody
reactivity to the major fish allergen
parvalbumin is determined by isoforms
and impact of thermal processing. Food
Chem. 148, 321-328
Saptarshi, Sharp and Lopata co-developed the
research question. Saptarshi and Sharp
collected the data and performed the data
analyses with assistance from Kamath.
Saptarshi wrote the first draft of the paper
which was revised with editorial input from
Sharp and Lopata. Saptarshi and Sharp
developed the figures and tables. Both
Saptarshi and Sharp have been noted as equal
contributors to this publication
CHAPTER 2
29
Ch
apter 2
2.1 Introduction
Fish is one of the eight prominent foods known to cause allergy [12]. Being an
excellent source of proteins and omega fatty acids, the consumption of fish has
increased greatly. However, allergy to fish is also increasing, affecting up to 0.2% of the
general population. Fish allergy is also an important concern in the seafood processing
environment. A recent study reported that prevalence of fish allergies can be as high as
8% among fish processing workers [28]. Along with consumption and handling of fish
allergens, patients can also react to aerosolized fish proteins generated during cooking
or processing [42, 141]. Clinical manifestations of fish allergy may include symptoms
ranging from wheezing, tightness of the throat, urticaria, vomiting, diarrhea etc. to the
life threatening reaction called anaphylaxis. The major fish allergen has been identified
as parvalbumin, an EF hand calcium binding protein [11, 82]. Parvalbumins are
globular proteins about 12kDa in size and are abundant in lower vertebrates such as
amphibians and fish [142]. These are water soluble and remarkably stable over a broad
temperature and pH range [75, 143]. Parvalbumins are abundant in the white muscle
tissue of fish, however lower concentrations have also been reported in fish dark muscle
tissue [33, 144]. Fish exhibit differences in their environmental habitats and their
overall muscle composition. Multiple isoforms of parvalbumin can be expressed in a
single fish species during its different developmental stages. [71, 145, 146] For
example, fresh-water carp has been reported to express up to eight isoforms of
parvalbumin, differing slightly in molecular weight and isoelectric properties [145]. The
detection of fish parvalbumin is challenging compared to other food allergens; this can
be attributed to the high biochemical and immunological variability among the different
fish species [112, 141]. Fish consumption strongly depends on regional availability.
Most studies on characterisation of parvalbumins have been conducted on fish

CHAPTER 2
30
Ch
apter 2
commonly consumed in the northern hemisphere. Several fish species such as
barramundi, flathead, gummy shark are indigenous to the Asia-pacific region. However
data on fish allergens in these species is limited. Moreover, not much research has been
conducted on the comparison of the diversity of parvalbumin isoforms across different
orders of fish or impact of heat processing on their antibody reactivity.
2.1.1 Aims
The aim of this chapter was to compare parvalbumin distribution profiles, specific
antibody reactivity and cross-species recognition across 12 different orders of fish and
study the impact of heat-processing on the mono and polymeric forms of these
parvalbumins. Bioinformatic tools were used to show that molecular phylogenetic
classification of fish based on the amino acid sequence of parvalbumin, can be linked to
the immunological cross-reactivity of this allergen. Furthermore the deduction of
different antibody binding sites of parvalbumin for bony and cartilaginous fish was
investigated which can aid in designing specific antibodies for better detection of
parvalbumin against different orders of fish species.

CHAPTER 2
31
Ch
apter 2
2.2 Materials and methods
2.2.1 Fish samples
Nineteen species of fish commonly consumed in the Asian-Pacific region (see Table
2.1) were analysed. Fresh fillets of each species were purchased from the local fish
market and transported on ice to the laboratory. All samples were stored at -80 ºC prior
to processing.
2.2.2 Preparation of protein extracts
Fifty grams of fish white muscle was homogenized in 100 mL of phosphate buffered
saline (PBS, 10mM, pH 7.2) using an Ultra Turrax blender (IKA, Staufen, Germany)
and extracted overnight with gentle tumbling at 4° C. The crude extract was centrifuged
at 5000g for 30 min at 4° C and filter sterilized using 0.2 μm cellulose acetate filter
membranes (Sartorius, Germany) is referred to as ‘raw extract’. To standardize the heat-
processing an aliquot of raw extracts were heated at 95 ºC for 15 min in a water bath.
Precipitated proteins were removed by centrifugation at 5000 g for 15 minutes and the
resulting referred to as ‘heated extract’. The prepared protein extracts were stored at -80
°C until further analysis.
2.2.3 Protein quantification
Protein concentrations were determined for the raw and heated extracts using the Quick
Start™ Bradford assay kit (Bio-Rad, USA). Readymade bovine serum albumin
standards (Bio-Rad, USA, 0.125- 2.00 mg/ml) were used and the absorbance was
determined at 595nm using a Multiskan Ascent®, (Pathtech, Australia) micro plate
reader.

CHAPTER 2
32
Ch
apter 2
2.2.4 SDS-PAGE analysis
Protein profiles for raw and heated fish extracts were obtained using sodium dodecyl
sulphate-polyacrylamide gel electrophoresis (SDS-PAGE). Fish proteins (25μg) were
diluted in 5X Laemmli sample buffer containing 2- mercaptoethanol, heated for 5min
and loaded on a 12% Tris-Glycine gel. Precision Plus protein standards (Bio-Rad, USA)
were used to estimate the molecular weights of individual proteins, using the Mini-
PROTEAN® Tetra Cell (Bio-Rad, USA) system at 170V. Proteins were visualized by
Coomassie Brilliant Blue R-250 (Bio-Rad, USA) staining.
2.2.5 Immunoblotting
The presence of different parvalbumins in raw and heated samples was determined by
immunoblotting. Fish protein extracts (5μg) were separated using SDS-PAGE and then
transferred to activated PVDF membrane (Bio-Rad, USA) using the Semi-dry Trans
Blot electrophoretic transfer system (Bio-Rad, USA) for 10min at 10V. After blocking
with 5% (w/v) skim milk (in TBS) for 1 h at room temperature, membranes were
incubated for 1hr with the primary monoclonal anti-parvalbumin antibody (PARV-19;
Sigma, USA) diluted 1:3000 in 1% skim milk and TBS. Membranes were subsequently
washed in TBS with 0.5% Tween -20 (TBS-T) and incubated with secondary anti-
mouse IgG HRP labelled antibody (Sigma, USA). The protein-antigen interaction was
visualized using Enhanced Chemiluminescence substrate (Sigma, USA) followed by
exposure to photographic film (GE Healthcare, Australia).
2.2.6 Inhibition-ELISA
To analyze the cross-species antibody reactivity for the different fish parvalbumins an in
house developed inhibition ELISA was performed. Briefly, 10 μg/ml of heated carp
extract was coated on a 96-well high binding plate (Costar, USA) and incubated
CHAPTER 2
33
Ch
apter 2
overnight at 4ºC and subsequently blocked with 5% skim milk in TBS for 1 h at room
temperature. The Primary antibody PARV-19 (diluted 1:1000) was mixed with
increasing concentrations of inhibitors, ranging from 0-1000μg/ml for 1 h at 37ºC in
separate microcentrifuge tubes. This antibody-antigen mixture was then added to the 96-
well plate and incubated for a further 1 h at 37ºC. Following three washing steps with
TBS-T plates were incubated with the secondary antibody (Rabbit anti-mouse
monoclonal antibody; Sigma, USA) for 1 h at room temperature and washed three times
and binding visualized using 3,3’, 5,5’-tetramethylbenzidine (TMB) substrate for HRP
(BD Biosciences, USA). The reaction was stopped using 2 M sulphuric acid and the
absorbance measured at 450 nm. The percent inhibition was calculated as 100-
[(O.D.450 nm of antibody with inhibitor/O.D.450 nm of antibody without inhibitor) x
100].

CHAPTER 2
34
Ch
apter 2
Table 2.1 Biological classification and scientific names of fish species analysed in this
study.
Common name Order Family Scientific name
Bony fish
Snapper Perciformes Sparidae Pagrus auratus
Silver bream Perciformes Sparidae Acanthopagrus australis
Yellowtail kingfish Perciformes Carangidae Seriola lalandi
Barramundi Perciformes Latidae Lates calcarifer
Blue fin tuna Perciformes Scombridae Thunnus maccoyii
Slimy mackerel Perciformes Scombridae Scomber australasicus
Orange roughy Beryciformes Trachichthyidae Hoplostethus atlanticus
Tiger flathead Beryciformes Platycephalidae Neoplatycephalus richardsoni
Atlantic salmon Salmoniformes Salmonidae Salmo salar
Rainbow trout Salmoniformes Salmonidae Onchorynchus mykiss
Carp Cypriniformes Cyprinidae Cyprinus carpio
Pilchard Clupeiformes Clupeidae Sardinops neopilchardus
Rock ling Ophidiiformes Ophidiidae Genypterus blacodes
Atlantic cod Gadiformes Gadidae Gadus morhua
Cartilaginous fish
Skate Rajiformes Rajidae Raja cerva
Gummy shark Carchariniformes Triakidae Mustelus antarcticus
Sparsely spotted stingaree
Myliobatiformes Urolophidae Urolophus paucimaculatus
Blacktip shark Carchariniformes Carcharhinidae Carcharias limbatus
Elephant shark Chimaeriformes Callorhinchidae Callorhynchus milii

CHAPTER 2
35
Ch
apter 2
2.2.7 Amino acid sequence alignment of parvalbumin and epitope analysis
Two multiple alignments of parvalbumin amino acid sequences were performed using
Clustal Omega (http://www.ebi.ac.uk/Tools/msa/clustalo/). The first alignment
consisted of 9 bony fish from 4 different orders (Gadiformes, Perciformes,
Cypriniformes and Salmoniformes), which generated a bony fish consensus sequence.
The second alignment used the two known cartilaginous fish parvalbumin amino acid
sequences that also generated a consensus sequence. The difference between the two
consensus sequences was calculated using BLOSUM 62 scoring. Possible antigenic
sites in the bony fish consensus sequence were estimated using the epitope-predicting
tool Antigenic (http://emboss.bioinformatics.nl/cgi-bin/emboss).
2.2.8 Phylogenetic analysis of fish parvalbumin amino acid sequences.
Phylogenetic analysis of 38 fish parvalbumin isoforms was conducted using the
Neighbour- Joining method using the software MEGA5. The bootstrap consensus tree
inferred from 10000 replicates was taken to represent the evolutionary history of fish
parvalbumins.

CHAPTER 2
36
Ch
apter 2
2.3 Results
2.3.1 Protein profiles of fish extracts and effect of heat treatment
Proteins present in raw and heat-processed extracts of 19 fish species (see Table 1) were
separated effectively using SDS-PAGE (F). Most raw fish extracts showed presence of
two or more protein bands in the molecular weight range of 10-15kDa except silver
bream and elephant shark extracts which displayed a single band. Both light and dark
tuna extracts showed no bands. The profile for the higher molecular weight protein
bands in the range of 37-75kDa was similar for most fish species. To analyze the effects
of heat-processing, the fish protein extraction parameters such as osmolality, pH
extraction buffer volume, specimen weight, heating temperature and heating time were
kept constant. This allowed direct comparison of the effect of heating on different
shellfish species without any bias. Heating of the fish extracts denatured many heat
labile proteins although all fish extracts showed presence of heat stable proteins around
37kDa and multiple heat stable proteins at 10-15kDa. However, mackerel, Atlantic
salmon, silver bream and blacktip shark displayed only one heat stable protein band in
the 10-15 kDa weight range. Interestingly, heated dark and light tuna protein extracts
had two distinct bands at 12-13 kDa, which were not present in the raw extracts.

CHAPTER 2
37
Ch
apter 2
Figure 2.1 Sodium dodecyl sulphate polyacrylamide gel electrophoresis (SDS-PAGE)
of raw (A) and heat-processed (B) protein extracts of bony and cartilaginous fish. The
common names are depicted under each lane. See Table 2.1 for complete list of
scientific names.
2.3.2 Monoclonal antibody reactivity to parvalbumin in raw and heated fish extracts
Immunoblotting with the monoclonal antibody against the raw extracts of the various
fish showed several bands in the molecular weight range of 10-15kDa, demonstrating
the presence of parvalbumin isoforms (Figure 2.2A). Some fish species, such as

CHAPTER 2
38
Ch
apter 2
snapper, yellowtail, barramundi and carp demonstrated parvalbumin isoforms with very
similar molecular weights, while other species seemed to have only one dominant
isoform, as observed for mackerel, flathead, Atlantic salmon and cod. Few species, such
as rainbow trout and pilchard showed presence of additional higher molecular weight
parvalbumin isoforms. In contrast, no bands were observed for Yellow fin tuna (light
meat and dark meat) and gummy shark. The heated fish extracts demonstrated
prominent monoclonal antibody binding to most; lower molecular weight parvalbumin
forms (Figure 2.2B). Heating had the most profound effect on yellow fin tuna, which
demonstrated strong bands. In contrast, cartilaginous fish lost all antibody reactivity
after heating and none of the five species showed parvalbumin bands except elephant
sharp that showed presence of one band. Comparison of the location and band intensity
of the different parvalbumin forms by densitometric analysis resulted in a detailed
allergogram, allowing the specific evaluation of impact of heat-processing on antibody
recognition. The higher molecular weight antibody reactivity, particularly in raw
extracts, was most likely due to the presence of polymeric forms of monomeric
parvalbumins, in molecular weight range of 11.5 kDa to 13.5 kDa

CHAPTER 2
39
Ch
apter 2
Figure 2.2 Immunoblot analysis of raw (A) and heat-processed (B) protein extracts
from bony and cartilaginous fish using monoclonal anti-parvalbumin antibody (I).The
common names of each fish species are shown under each lane. See Table 2.1 for
complete list of scientific names. Calculated molecular weights of monomeric and
polymeric forms of parvalbumin are presented in the allergogram (II) for raw (A) and
heat-processed (B) fish, facilitating the analysis of parvalbumin. Antibody binding is
graded as mild, moderate or intense.

CHAPTER 2
40
Ch
apter 2
2.3.3 Monoclonal antibody cross-reactivity of carp parvalbumin against heated fish extracts
The cross-reactivity of 19 fish species was evaluated by performing a quantitative
inhibition ELISA using heated carp extract as coating antigen (Figure 2.3A). The
decrease in reactivity of monoclonal antibody to the immobilized carp allergen 231
extract, comprising of two strong parvalbumin forms, was used as a measure of
immunological cross-reactivity against other heated fish extracts used as inhibitors.
Carp extract as expected, was able to completely abolish antibody reactivity at about
500 g/ml, while only 5 of the 19 fish species where able to inhibit the antibody
reactivity by over 50% in a dose depended manner. The concentrations needed to reach
50% inhibition varied significantly from about 20 g/ml for carp to about 450 g/ml for
rockling (Figure 3.2B). In contrast none of the other 14 fish extracts where able to
achieve inhibitions above 40%, even at the highest inhibitor concentration.

CHAPTER 2
41
Ch
apter 2
Figure 2.3 Inhibition ELISA for the quantification of the monoclonal anti-parvalbumin
antibody cross-reactivity between carp parvalbumin (coating antigen) and 19 different
fish parvalbumins (A). The inhibition dose response curves for the 19 fish demonstrate
that only 5 species achieved over 50% inhibition, with homologous carp parvalbumin
being the strongest inhibitor. The protein concentrations to reach 50% inhibition show
great differences with rock ling requiring over 20 times more parvalbumin compared to
homologues carp (B).
2.3.4 Epitope analysis of monoclonal antibody between bony and cartilaginous fish
The multiple alignments of fish parvalbumin amino acid sequences demonstrated
regions of high consensus in bony and cartilaginous fish, situated at the two calcium
binding sites. However, the amino acid sequences are less conserved at the N-terminal
region, demonstrated by values under 4 in the BLOSUM 62 score graph of (Figure 2.4).

CHAPTER 2
42
Ch
apter 2
The program ‘Antigenic’ predicted the most antigenic site, the most likely target for this
monoclonal antibody to be between positions T13, 39 and K39.
Figure 2.4 (A) The potential PARV-19 epitope predicted using ‘Antigenic’ analysis is
boxed in red. The aggregate BLOSUM 62 score was calculated from the two consensus
sequences generated for bony and cartilaginous fish. Bony fish consensus is shown
under the chart with the four known IgE epitopes highlighted in green. (B) Ribbon and
space fill models of carp parvalbumin (PDB ID: 4cpv), with the predicted epitope
coloured in red. Bound calcium ions are shaded in green.
2.3.5 Phylogenetic relationships of fish parvalbumins
The phylogenetic analysis of fish parvalbumin demonstrated relationships between
isoforms from specific taxonomic orders. For example, Gadiformes, Perciformes and
Cypriniformes form two distinct clades each and three out of four Salmoniformes form
another clade (Figure 2.5). All the α-parvalbumins, which also include the only two

CHAPTER 2
43
Ch
apter 2
cartilaginous fish parvalbumins with known amino acid sequences, grouped close to the
higher vertebrate parvalbumins.
Figure 2.5 The evolutionary history of a variety of parvalbumins is inferred using the
Neighbour-Joining method. The bootstrap consensus tree inferred from 10000 replicates
is taken to represent the evolutionary history of the taxa analysed. Branches
corresponding to partitions reproduced in less than 50% bootstrap replicates are
collapsed. The percentage of replicate trees in which the associated taxa clustered
together in the bootstrap test (10,000 replicates) is shown next to the branches. The tree
is drawn to scale, with branch lengths in the same units as those of the evolutionary

CHAPTER 2
44
Ch
apter 2
distances used to infer the phylogenetic tree. The evolutionary distances were computed
using the Poisson correction method and are in the units of the number of amino acid
substitutions per site. The analysis involved 38 parvalbumin amino acid sequences. All
positions containing gaps and missing data were eliminated. There were a total of 99
positions in the final dataset. Evolutionary analyses were conducted in MEGA5. For
convenience each order is shaded a separate colour.

CHAPTER 2
45
Ch
apter 2
2.4 Discussion
The major fish allergen parvalbumin is a highly diverse protein and exists as multiple
isoforms in different fish species [141]. The present study analyses for the first time,
parvalbumins in a comprehensive range of fish from the Asia-Pacific region. This study
has made use of anti-frog parvalbumin antibody PARV-19, widely used for the
identification of this major allergen [100, 112]. Immunoblotting experiments confirmed
the presence of multiple bands of parvalbumin isoforms in the molecular weight range
of 10-15 kDa for most raw and heated fish extracts. Characteristic parvalbumin
oligomers were also detected by the monoclonal antibody in raw extracts of eight fish
including mackerel, flathead, trout, carp, rock ling, pilchard and skate. Multimeric
formation of parvalbumin can be attributed to the presence of readily reducible cysteine
residues in the protein [147]. Heat processing of the fish extracts affected the antibody
recognition of parvalbumins for some fish species. For example, while no bands were
observed in raw extracts of tuna, monomeric as well as oligomeric parvalbumin was
detected in the heated extracts. Similarly heating also led to oligomer formation of
parvalbumin in orange roughy extract. Oligomeric parvalbumin from flathead, rainbow
trout and skate was found to be heat labile. These results highlight the difference in
thermal stability of parvalbumin across different genera of fish and confirm that, heat
processing has profound effect on antibody reactivity of different parvalbumins.
The 32,400 different types of fish can be largely grouped as bony (Osteichthyes) which
comprises of most edible fish and cartilaginous (Chondrichthyes) which include sharks
and rays [78]. Parvalbumin has been described as a pan-allergen in a majority of bony
fish varieties such as cod, carp and salmon [11, 71-73, 75-77]. Interestingly reports on
allergenic parvalbumin from cartilaginous fish are limited [148, 149]. Parvalbumins
from sharks have been suggested to be structurally different to those of bony fish [150].

CHAPTER 2
46
Ch
apter 2
The monoclonal antibody reactivity to the cartilaginous fish extracts used in our study
was found to be minimal with no binding detected for gummy shark. This reactivity was
completely lost for the heated extracts demonstrating that shark parvalbumin may be
heat labile. The inhibition assay further confirmed the low cross reactivity of this
allergen between cartilaginous and bony fish. Interestingly, the antibody was capable of
binding to parvalbumins in raw as well as heated extract of the elephant shark. The
elephant shark is a chimera fish. A recent study suggested that parvalbumin from
elephant shark may be more similar to bony fish parvalbumin [151]. The inability of the
monoclonal antibody to detect shark parvalbumin may be because of the dissimilarity in
the amino acid sequence homology of parvalbumins from bony and cartilaginous fish.
The cross-reactivity among fish is most likely due to the molecular phylogenetic
association of parvalbumin, though Fæste & Plassen [138] in their study with anti-cod
antibodies have suggested that cross reactivity may be based on habitat (fresh-water or
saltwater) of fish. Detailed molecular analysis of parvalbumins from fish used in the
present study, and phylogenetic grouping of thirty eight available parvalbumin amino
acid sequences was used to understand the cross-reactive nature of parvalbumin in
different fish. For example, amino acid sequences of the order Perciformes group
together (Figure 2.5) correlating with the three species of fish (barramundi, snapper,
silver bream) that cross-reacted with carp parvalbumin in the inhibition assay. These
fish showed up to 50% inhibition of the monoclonal antibody to carp parvalbumin.
Currently there is a lack of parvalbumin sequences available from the orders
Ophidiiformes (rockling) and Beryciformes (orange roughy), and this made it difficult
to analyse the molecular relationships and cross-reactivity of these species with the
Perciformes or carp. Interestingly the two known cartilaginous fish parvalbumins
(leopard shark and thornback ray) clustered close to the α-parvalbumins of higher
CHAPTER 2
47
Ch
apter 2
vertebrates such as humans and chicken away from other bony fish. This not only
explains the lack of binding of the monoclonal antibody to cartilaginous fish
parvalbumin in our study, but may also explain the current reports on their low
allergenicity [152].
In summary, the monoclonal antibody used in the present study reacted to all fish
species except gummy shark, demonstrating that the parvalbumin epitope for this
antibody must be in a relatively conserved region of this allergenic protein. The effect
of heating on fish allergens must be taken into account when designing future
diagnostics. This study also identified a specific antibody target at the N-terminal region
of parvalbumin, allowing the distinction of bony from cartilaginous fish.
2.4.1 Future direction
Knowledge gained from this chapter can be used to aid in predicting immunological
cross-reactivity by performing parvalbumin phylogenetic analysis. This could be used to
generate fish order-specific detection tools to further our resources in detecting this
major fish allergen in foods. This chapter has also highlighted the cross reactive
limitations of monoclonal antibodies as they are very specific to distinct protein regions.
In chapter 3 polyclonal antibodies will be generated against multiple phylogenetically
diverse parvalbumins and analysed against a large panel of Asian-pacific fish.

48
CHAPTER3
Analysisofimmunologicalcrossreactivitybetween
parvalbuminsusingfourpolyclonalanti‐fishparvalbumin
IgGantibodies
Details of publication on which this
chapter is based
Nature and extent of the intellectual input
of each author, including the candidate
Sharp MF, Stephen JN, Kraft L, Weiss
T, Kamath SD, Lopata AL.
Immunological cross-reactivity between
four distant parvalbumins—Impact on
allergen detection and diagnostics. Mol
Immunol 2015, 63(2): 437-448.
The authors Sharp and Lopata co-developed
the research question. Sharp and Stephen
collected the data and performed the data
analyses. Sharp wrote the first draft of the
paper, which was revised with editorial input
from Lopata, Kamath, Kraft and Weiss.
Sharp developed the figures and tables.

CHAPTER 3
49
Ch
apter 3
3.1 Introduction
Fish are the largest and most diverse group of vertebrates. Fish are also a part of the
eight food groups that cause the majority of IgE mediated food reactions [92]. Despite
fish allergy being common and well documented, detection of fish allergens and allergic
sensitization is difficult due to species diversity [141].
Parvalbumin, a small calcium binding protein, is the major allergen identified in most
fish species [84, 141]. Parvalbumins range between 10 and 15 kDa in size and have low
isoelectric points ranging from 3.5 to 5. Fish may express multiple parvalbumins
(isoforms), which can be seen as monomeric, dimeric or oligomeric forms and may
differ significantly in primary structure [153, 154]. Although differences in parvalbumin
primary structure, they have highly conserved tertiary structures and calcium binding
residues located on paired α-helices (EF-Hand motif) [84]. Current methods of detecting
fish allergens include real-time PCR [155] and antibody based assays that detect either
fish proteins or the allergens themselves [138, 139, 156]. The most investigated
antibody against parvalbumin is the commercial monoclonal anti-frog parvalbumin,
PARV-19 [112, 154]. This antibody has been evaluated against fish parvalbumins from
North America, Europe and Australasia and has been found to cross-react to most but
not all parvalbumins [153, 157, 158]. PARV-19 has also been compared to other
monoclonal and polyclonal antibodies generated against Atlantic cod, carp, pilchard and
anchovy [139, 157]. Lee et al. [157] demonstrates recently that polyclonal anti-cod
antibody seemed to be the most cross-reactive, most likely due to its polyclonal nature,
however this antibody still could not detect all fish including mahi mahi, swordfish and
albacore tuna.

CHAPTER 3
50
Ch
apter 3
Despite structural and functional similarities between fish parvalbumins their amino
acid sequence differ greatly, for example, two different parvalbumin isoforms are
expressed in both Atlantic salmon (Salmo salar) and barramundi (Lates calcarifer)
each, which the former only shares 64% and the later 67% amino acid sequence identity
[77, 153]. This verifies that is not only difficult to detect interspecific parvalbumin
forms using antibodies, but also intraspecific parvalbumins as they can differ greatly.
Detection of fish parvalbumins is further complicated by the impact of food processing
such as cooking and canning, which may degrade or alter tertiary and quaternary
structures of parvalbumin, inhibiting the detection by antibodies [108].
Parvalbumin cross-reactivity has been linked with their phylogenetic relationships [138,
154]. In this study, four polyclonal antibodies are generated against parvalbumin from
four phylogenetically diverse fish species; Atlantic salmon (Salmoniformes),
barramundi (Perciformes), basa/catfish (Siluriformes) and pilchard (Clupeoformes).
Cross-reactivity of these antibodies is analysed among 40 different fish species across
17 orders and their ability to detect the major allergen parvalbumin evaluated across
commonly consumed fish species.
3.1.1 Aims
The aim of this chapter is to generate four polyclonal antibodies against
phylogenetically diverse parvalbumin from four diverse fish species, Atlantic salmon
(Salmoniformes), barramundi (Perciformes), basa (Siluriformes) and pilchard
(Clupeoformes). Cross-reactivity of these antibodies will be analysed against a large
panel of Asian-pacific fish to evaluate the possibility of these being used in combination
as detection tools.

CHAPTER 3
51
Ch
apter 3
3.2 Materials and methods
3.2.1 Fish protein extraction and parvalbumin purification
Fish samples were collected from seafood retailers in Townsville and Melbourne,
Australia. Samples were stored at -80oC until further use. Details of fish species
collected can be seen in Table 3.1. Raw extracts were produced by homogenizing 50g of
muscle fillet in 100 mL of phosphate buffered saline (PBS, 10mM, pH 7.4) and
extracted over 3h with gentle tumbling at 4°C. The crude extracts were subjected to
centrifugation at 5000g for 30 min at 4°C and filter sterilized using 0.2 µm cellulose
acetate filter membrane (Sartorius, Germany). Heated extracts were produced by
heating 50g of heating white muscle at 95°C for 15 min in PBS followed by gentle
tumbling at 4°C for 3 hours. The crude heated extracts were subjected to centrifugation
at 5000g for 30 min at 4°C and filter sterilized using 0.2 µm cellulose acetate filter
membrane. Protein concentrations for each extract was estimated by using the Pierce®
660 protein assay (Thermo Scientific, Rockford, USA) and extracts were aliquoted and
stored at -80°C.
Parvalbumin was purified from heated Barramundi, Basa, Pilchard and Atlantic salmon
extracts using anion exchange chromatography. The selection of these antigens is based
on their phylogenetic diversity as seen in Figure 3.2 as well as popular consumption.
These extracts were dialysed against 25 mM Tris pH 8.0 and 1mL of the dialysed
extract loaded on to a 5mL DEAE sepharose anion exchange column (BioRad
Laboratories, Hercules, USA). Fractions were eluted with a linear salt gradient of
25mM Tris and 1M NaCl pH 8.0. A constant flow rate was set at 1.5mL per minute
using BioRad DuoFlow system. Elution profile was generated using UV214 with
BioRad QuadTech UV spectrophotometer.
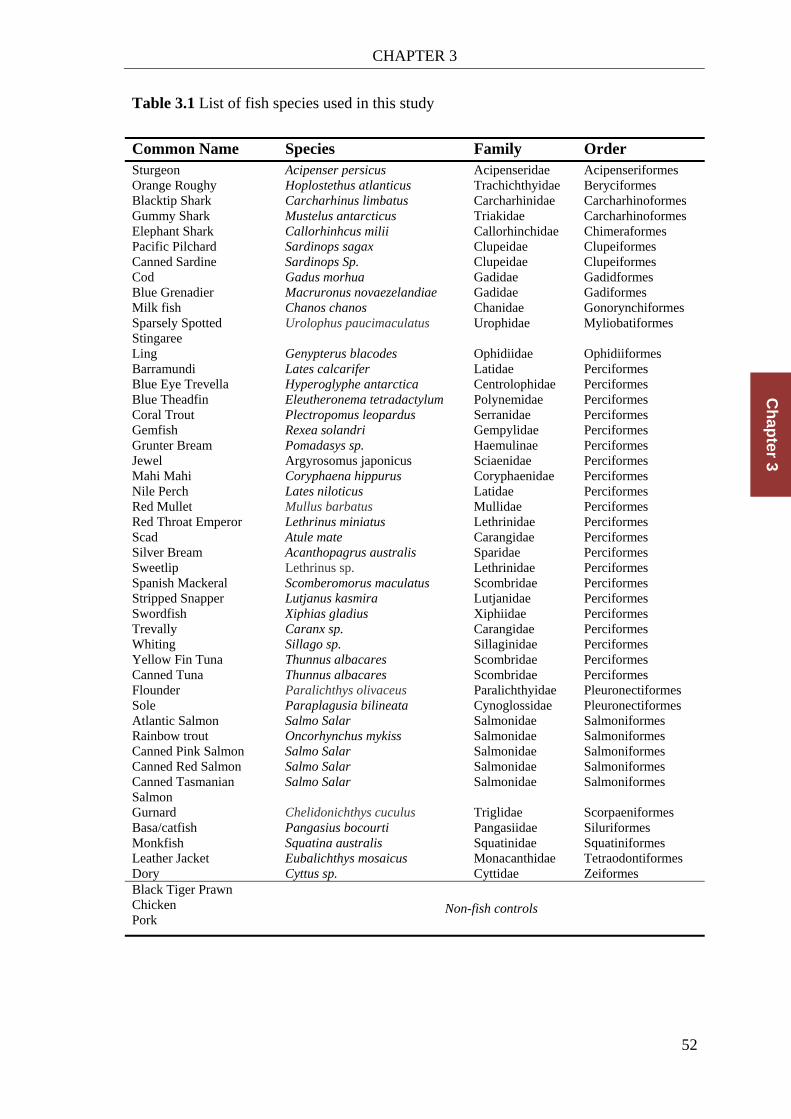
CHAPTER 3
52
Ch
apter 3
Table 3.1 List of fish species used in this study
Common Name Species Family Order Sturgeon Acipenser persicus Acipenseridae Acipenseriformes Orange Roughy Hoplostethus atlanticus Trachichthyidae Beryciformes Blacktip Shark Carcharhinus limbatus Carcharhinidae Carcharhinoformes Gummy Shark Mustelus antarcticus Triakidae Carcharhinoformes Elephant Shark Callorhinhcus milii Callorhinchidae Chimeraformes Pacific Pilchard Sardinops sagax Clupeidae Clupeiformes Canned Sardine Sardinops Sp. Clupeidae Clupeiformes Cod Gadus morhua Gadidae Gadidformes Blue Grenadier Macruronus novaezelandiae Gadidae Gadiformes Milk fish Chanos chanos Chanidae Gonorynchiformes Sparsely Spotted Stingaree
Urolophus paucimaculatus Urophidae Myliobatiformes
Ling Genypterus blacodes Ophidiidae Ophidiiformes Barramundi Lates calcarifer Latidae Perciformes Blue Eye Trevella Hyperoglyphe antarctica Centrolophidae Perciformes Blue Theadfin Eleutheronema tetradactylum Polynemidae Perciformes Coral Trout Plectropomus leopardus Serranidae Perciformes Gemfish Rexea solandri Gempylidae Perciformes Grunter Bream Pomadasys sp. Haemulinae Perciformes Jewel Argyrosomus japonicus Sciaenidae Perciformes Mahi Mahi Coryphaena hippurus Coryphaenidae Perciformes Nile Perch Lates niloticus Latidae Perciformes Red Mullet Mullus barbatus Mullidae Perciformes Red Throat Emperor Lethrinus miniatus Lethrinidae Perciformes Scad Atule mate Carangidae Perciformes Silver Bream Acanthopagrus australis Sparidae Perciformes Sweetlip Lethrinus sp. Lethrinidae Perciformes Spanish Mackeral Scomberomorus maculatus Scombridae Perciformes Stripped Snapper Lutjanus kasmira Lutjanidae Perciformes Swordfish Xiphias gladius Xiphiidae Perciformes Trevally Caranx sp. Carangidae Perciformes Whiting Sillago sp. Sillaginidae Perciformes Yellow Fin Tuna Thunnus albacares Scombridae Perciformes Canned Tuna Thunnus albacares Scombridae Perciformes Flounder Paralichthys olivaceus Paralichthyidae Pleuronectiformes Sole Paraplagusia bilineata Cynoglossidae Pleuronectiformes Atlantic Salmon Salmo Salar Salmonidae Salmoniformes Rainbow trout Oncorhynchus mykiss Salmonidae Salmoniformes Canned Pink Salmon Salmo Salar Salmonidae Salmoniformes Canned Red Salmon Salmo Salar Salmonidae Salmoniformes Canned Tasmanian Salmon
Salmo Salar Salmonidae Salmoniformes
Gurnard Chelidonichthys cuculus Triglidae Scorpaeniformes Basa/catfish Pangasius bocourti Pangasiidae Siluriformes Monkfish Squatina australis Squatinidae Squatiniformes Leather Jacket Eubalichthys mosaicus Monacanthidae Tetraodontiformes Dory Cyttus sp. Cyttidae Zeiformes Black Tiger Prawn
Non-fish controls Chicken Pork
CHAPTER 3
53
Ch
apter 3
Fractions were collected for all peaks throughout the gradient and subsequently
analysed by electrophoresis and immunoblotting. Parvalbumin was purified from heated
Barramundi, Basa, Pilchard and Atlantic salmon extracts using anion exchange
chromatography. The selection of these antigens is based on their phylogenetic diversity
as seen in Figure 3.2 as well as popular consumption. These extracts were dialysed
against 25 mM Tris pH 8.0 and 1mL of the dialysed extract loaded on to a 5 mL DEAE
sepharose anion exchange column (BioRad Laboratories, Hercules, USA). Fractions
were eluted with a linear salt gradient of 25mM Tris and 1M NaCl pH 8.0. A constant
flow rate was set at 1.5 mL per minute using BioRad DuoFlow system. Elution profile
was generated using UV214 with BioRad QuadTech UV spectrophotometer. Fractions
were collected for all peaks throughout the gradient and subsequently analysed by
electrophoresis and immunoblotting. Parvalbumin containing peaks were pooled,
dialysed against 100 mM ammonium bicarbonate, lyophilized and stored at -20oC until
further use.
3.2.2 Production and purification of polyclonal anti-parvalbumin antibodies
Polyclonal antiserum was raised against the purified parvalbumins by injecting two
rabbits per antigen subcutaneously with 500µg of antigen in Freund's complete
adjuvant. Further doses of 500µg in Freund’s incomplete adjuvant were given at week
3, 6 and 9 and final bled performed at week 10. Antiserum production was performed at
the South Australian health and medical research institute (SAHMRI). The
immunoglobulin G fraction of the rabbit sera was purified using Pierce Protein A
Agarose resin (Thermo Fisher Scientific, USA). Both antibodies to each fish species
demonstrated very similar reactivity by ELISA and therefore were pooled for
subsequent experiments.

CHAPTER 3
54
Ch
apter 3
3.2.3 Polyclonal antibody inter-antigen cross reactivity
An inhibition ELISA was performed using the four purified fish parvalbumins against
the four generated antibodies. In brief, four ELISA plates were coated overnight at 4oC
with 0.1 µg per well of pure parvalbumins from barramundi, basa, pilchard and Atlantic
salmon in coating buffer (50 mM carbonate buffer, pH 9.6). Wells were blocked with
5% skim milk in phosphate buffered saline + 0.05% Tween-20 (PBS-T) for 1h at room
temperature and subsequently washed 3 times with PBS-T. Polyclonal anti-parvalbumin
antibodies were preabsorbed with inhibitors for 2 h at room temperature. Antibody
concentration was 200 ng/mL and inhibitor concentrations were 0.01, 0.1, 1, 10, 50 and
100 µg/mL. This mixture was then added to the wells (100 µL) and incubated at room
temp for 1 h. Wells were washed with PBS-T and 100 µL of Anti-Rabbit IgG (H+L),
HRP Conjugate (Promega, USA) diluted 1:20,000 in 1% skim milk was added to each
well and incubated at room temperature for 30 mins. Wells were washed with PBS-T
and assay was visualized using 3,3’,5,5’-tetramethylbenzidine (TMB) substrate for HRP
(BD Biosciences, USA). The reaction was stopped using 1M Hydrochloric acid and the
absorbance measured at 450 nm. The percent inhibition was calculated as 100 + [O.D.
450 nm of antibody with inhibitor/O.D. 450 nm of antibody without inhibitor] + 100.
3.2.4 Antibody screening of fish protein extracts
Protein profiles for raw and heated fish extracts were obtained using SDS-PAGE. Fish
proteins (10 μg) were diluted in 5X sample buffer containing Dithiothreitol 14 mM
(DTT), heated for 5 mins at 100oC and loaded on a 15% polyacrylamide SDS gel.
Precision Plus protein standards (Bio-Rad, USA) were used to estimate the molecular
weights of individual proteins, using the Mini-PROTEAN® Tetra Cell (Bio-Rad, USA)
system at 170 V for 70 mins. Proteins were visualized by Coomassie Brilliant Blue R-
250 (Bio-Rad, USA) staining.

CHAPTER 3
55
Ch
apter 3
Immunoblotting process involved the transfer of SDS-PAGE separated proteins onto
PVDF membrane using semidry blot system (BioRad) at 11 V for 15 mins. Membranes
were blocked with 5% skim milk in PBS-T for 1 h, and then incubated with the rabbit
anti-fish parvalbumin polyclonal antibodies diluted in 1% skim in PBS-T at a
concentration of 200 ng/mL (Antibodies were pooled according to their respective
antigen as there were two rabbit per antibody). Membranes were washed 3x with PBS-T
and incubated with anti-rabbit IgG HRP conjugate diluted 1:20,000 in 1% skim milk
(Promega, USA). Membranes were washed a final 3x with PBS-T and antibody
reactivity was visualized using ECL method.
Further screening of the fish protein extracts involved an indirect ELISA. Wells of
ELISA plates (96 well) were coated with 5 µg of each protein extract in triplicates in
carbonate buffer, pH 9.6, overnight at 4oC. Plates were then blocked with 5% skim milk
in PBS-T and washed 3 times with PBS-T. Plates were then incubated with incubated
with the rabbit anti-fish parvalbumin polyclonal antibodies diluted in 1% skim in PBS-T
at a concentration of 200 ng/mL for 1 h at room temperature and washed another 3x.
Plates were finally incubated with anti-rabbit IgG HRP conjugate diluted 1:20,000 in
1% skim milk (Promega, USA) for 30 mins then subsequently washed 5x with PBS-T
and the assays were visualized using 3,3’,5,5’-tetramethylbenzidine (TMB) substrate for
HRP (BD Biosciences, USA). The reaction was stopped using 1 M Hydrochloric acid
and the absorbance measured at 450 nm. Cut-off values were determined using the
mean of 3 non-fish extracts plus 2 times the standard deviation.
3.2.5 Immunoblot Analysis
The binding capacity of the polyclonal antibodies on immunoblots was determined by
comparing densitometric values of each band against the antigen homologous to the

CHAPTER 3
56
Ch
apter 3
antibody. Densitometric analysis was performed using TotalLab Quant. Strong,
moderate and weak binding were determined by values greater than 80%, greater than
40% and less than 40% of the homologous antigen value, respectively.

CHAPTER 3
57
Ch
apter 3
3.3 Results
3.3.1 Fish extract analysis
Proteins present in raw and heat-processed extracts from 45 diverse fish sources local to
the Asia-Pacific region (see Table 1) were separated using SDS-PAGE (Figure 3.1).
Protein profiles differ between each raw fish extract, in particular the 10-15 kDa region.
Twenty-eight raw extracts have two or more bands in this region, whereas 11 show only
one band. All canned fish show no distinct bands and Spanish mackerel is the only other
fish to have no bands in this region even in the raw extract. The profile for the higher
molecular weight protein bands in the range of 37-75 kDa was similar for most fish
species. Heating of the fish extracts denatured many heat labile proteins although all
fish extracts showed the presence of heat stable proteins of about 37 kDa and most
showed heat stable proteins at 10-15 kDa. Eight protein extracts showed no bands in the
10-15 kDa region including the sparsely spotted stingaree, yellowfin tuna and
swordfish, all of which had bands in this region in the raw extracts. Interestingly a band
was present in heated Spanish mackerel extract. This band may be visible now due to
the concentrating effect of heat treatment on heat stable proteins. No distinct bands can
be seen in any of the canned extracts. Furthermore, only 18 fish species had
parvalbumin detected by PARV-19, with basa being the only species with multiple
(two) parvalbumin isoforms. The PARV-19 immunoblot also detected oligomeric
parvalbumin in gemfish and rainbow trout. Complete amino acid sequences are only
known for 10 out of the 40 fish species analysed, demonstrating the diversity of the fish
analysed in this study.

CHAPTER 3
58
Ch
apter 3
Figure 3.1 Coomassie stained SDS-PAGE profile of all 45 raw (A) and heated (B) fish
muscle extracts from 17 different fish orders. C) PARV-19 anti-parvalbumin
immunoblots against all raw extracts. Three non-fish (black tiger prawn, chicken and
pork) were used as negative controls.

CHAPTER 3
59
Ch
apter 3
3.3.2 Antigen selection and purification
The selection of antigens for the generation of antibodies was performed using multiple
criteria. Firstly, there must be distant phylogenetic relationships between fish
parvalbumins as seen in Figure 3.2, to cover even distantly related groups. Secondly, the
fish must be commonly consumed in the Asia-pacific region. Lastly the fish had to be
from different taxonomic orders. The optimum species fulfilling these criteria are
barramundi (Lates calcarifer), basa (Catfish; Pangasius bocourti), pilchard (Sardinops
sagax) and Atlantic salmon (Salmo salar). The purification of these parvalbumins was
performed using anion exchange chromatography. Eluted barramundi and basa
parvalbumin isoforms showed similar ionic properties as they were the first proteins
eluted along the salt gradient (Figure 3.3. Ai and ii). This may be due to pilchard
parvalbumin having a higher isoelectric point of 6.0, greater than most other known
beta-parvalbumins. In contrast, Atlantic salmon parvalbumin was the only heated
protein from the salmon extract to bind to the column. Two clear parvalbumin isoforms
were purified from barramundi and basa and only one visible parvalbumin from both
pilchard and Atlantic salmon (Figure 3.3 B).
3.3.3 Cross reactivity of generated polyclonal antibodies
Polyclonal antibodies were generated in rabbits against parvalbumin from barramundi,
basa, pilchard and salmon. Inhibition ELISA’s were performed using these antibodies to
evaluate their cross-reactivity between the four purified antigens (Figure 3.4). The anti-
barramundi antibodies appear to be the most cross-reactive as all the antigens reached
50% inhibition in the assays. The next most cross-reactive were the anti-basa antibodies
which were inhibited by pilchard and salmon parvalbumin, however barramundi
parvalbumin was unable to reach 50% inhibition Only salmon parvalbumin reached
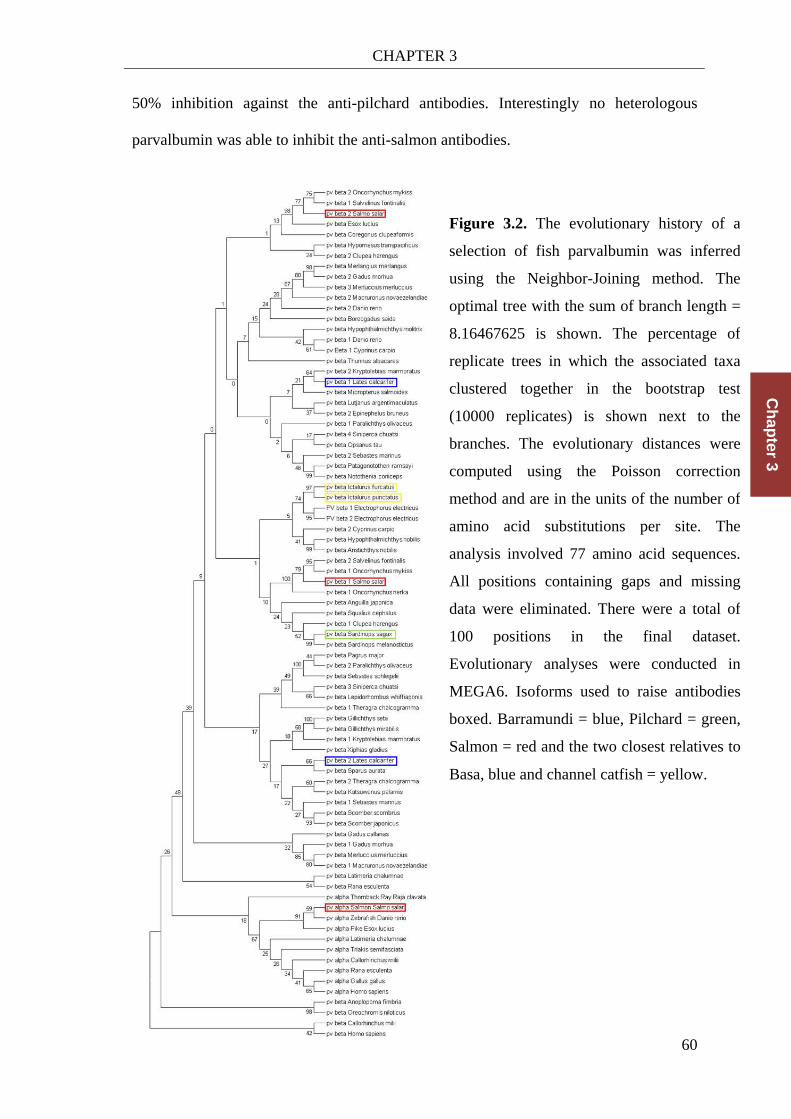
CHAPTER 3
60
Ch
apter 3
50% inhibition against the anti-pilchard antibodies. Interestingly no heterologous
parvalbumin was able to inhibit the anti-salmon antibodies.
Figure 3.2. The evolutionary history of a
selection of fish parvalbumin was inferred
using the Neighbor-Joining method. The
optimal tree with the sum of branch length =
8.16467625 is shown. The percentage of
replicate trees in which the associated taxa
clustered together in the bootstrap test
(10000 replicates) is shown next to the
branches. The evolutionary distances were
computed using the Poisson correction
method and are in the units of the number of
amino acid substitutions per site. The
analysis involved 77 amino acid sequences.
All positions containing gaps and missing
data were eliminated. There were a total of
100 positions in the final dataset.
Evolutionary analyses were conducted in
MEGA6. Isoforms used to raise antibodies
boxed. Barramundi = blue, Pilchard = green,
Salmon = red and the two closest relatives to
Basa, blue and channel catfish = yellow.

CHAPTER 3
61
Ch
apter 3
Figure 3.3 A Purification chromatograms of parvalbumin from barramundi (i), basa (ii),
pilchard (iii) and Atlantic salmon (iv) heated extracts using anion exchange
chromatography. B Peaks containing pure parvalbumin (*) were separated by SDS-
PAGE and stained with Coomassie blue.

CHAPTER 3
62
Ch
apter 3
Figure 3.4 Inhibition ELISA’s for the evaluation of the generated anti-parvalbumin
polyclonal antibodies cross-reactivity against the four antigens they were raised against.
Error bars demonstrate the standard error of the mean of the three replicates from the
two rabbit immunized per antigen.
3.3.4 Antibody reactivity against fish extract panel
Specific binding strengths between the antibodies and different fish extracts are
summarized in Figure 3.6. The anti-barramundi antibody was the most reactive as it
detected 22/45 extracts followed by anti-pilchard (20/45), anti-basa (16/45) and salmon
(12/45). Predictably, anti-barramundi parvalbumin detects the most Perciformes
parvalbumin (13/21), as barramundi is a Perciformes. Only six fish were detected by all
the antibodies including orange roughy, milkfish, grunter bream, stripped snapper,
whiting and basa. Inversely, 20 fish extracts were not detected by any of the antibodies,
including the five canned fish extracts, large Perciformes (mahi mahi, Spanish

CHAPTER 3
63
Ch
apter 3
mackerel, swordfish and yellowfin tuna) as well as the five cartilaginous fish (blacktip
shark, gummy shark, elephant shark, sparsely spotted stingaree and monkfish). The anti-
barramundi and anti-pilchard antibodies demonstrated similar binding profiles, with
both reacting synonymously to 18 fish species and the only antibodies to detect
parvalbumin from gurnard, flounder, and leather jacket. The anti-barramundi antibody
demonstrated exclusive specificity by detecting parvalbumin from barramundi and blue
eye trevella extract by immunoblotting. In addition the anti-salmon antibody was the
only one to detect Atlantic salmon and sturgeon and the anti-pilchard antibody the only
one to detect sole.
Interestingly the generated antibodies detected multiple parvalbumin isoforms (2 bands
in the 10-15 kDa range) in 10 of the 45 fish extracts analysed (Figure 3.6) Orange
roughy and whiting had both of their parvalbumin isoforms detected by all the
antibodies. In contrast basa parvalbumin isoform 2 was only detected by anti-basa
antibodies. In addition higher molecular weight oligomeric forms of parvalbumin were
also present, with parvalbumin dimers seen in grunter, Nile perch and silver bream and
a tetramer present in pilchard. Interestingly the anti-pilchard antibody only recognizes
tetrameric parvalbumin from raw pilchard extract, however only dimeric and
monomeric parvalbumin is detected in the heated pilchard extract (Figure 3.7).

CHAPTER 3
64
Ch
apter 3

CHAPTER 3
65
Ch
apter 3
Figure 3.5 Immunoblots using anti-barramundi (blue), anti-basa (yellow), anti-pilchard
(green) and anti-salmon (red) polyclonal antibodies against all raw fish extracts. Three
non-fish (black tiger prawn, chicken and pork) were used as negative controls.

CHAPTER 3
66
Ch
apter 3
Figure 3.6 Allergogram of all raw extract immunoblots grading the strength of binding
to isoform 1 (lowest molecular weight), isoform 2 (higher molecular weight) and
oligomer (weight above 20 kDa). Binding grading was determined by comparing
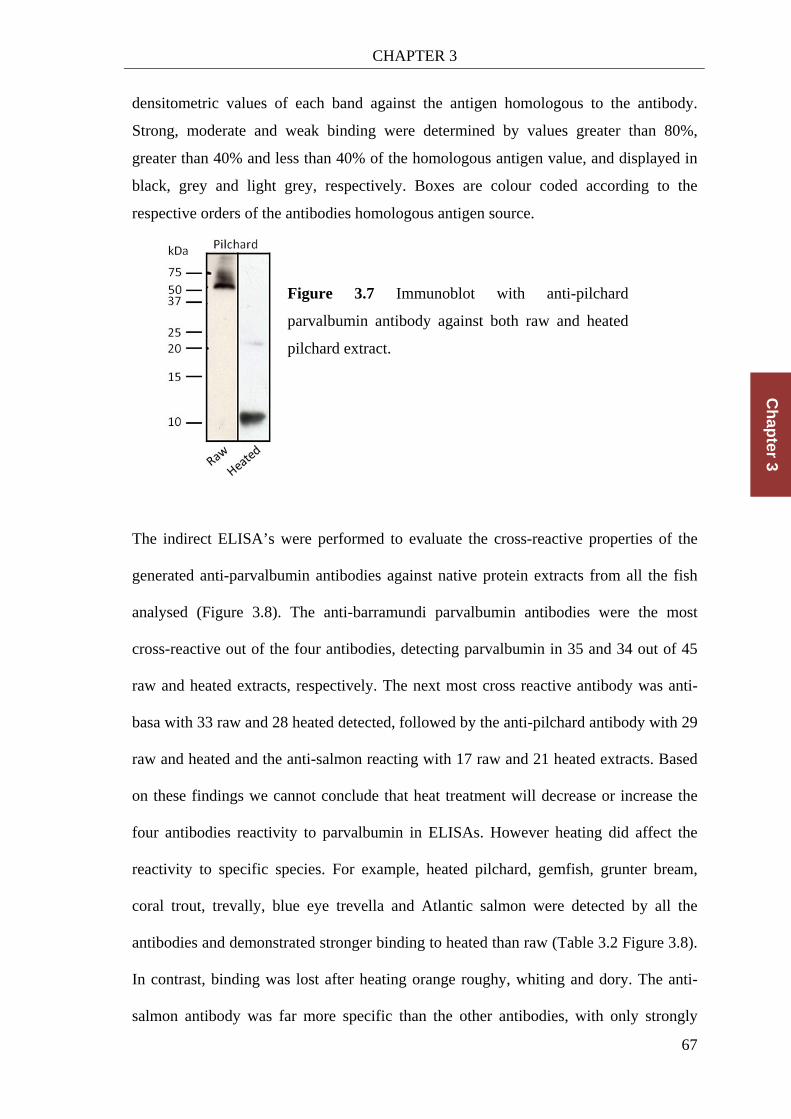
CHAPTER 3
67
Ch
apter 3
densitometric values of each band against the antigen homologous to the antibody.
Strong, moderate and weak binding were determined by values greater than 80%,
greater than 40% and less than 40% of the homologous antigen value, and displayed in
black, grey and light grey, respectively. Boxes are colour coded according to the
respective orders of the antibodies homologous antigen source.
Figure 3.7 Immunoblot with anti-pilchard
parvalbumin antibody against both raw and heated
pilchard extract.
The indirect ELISA’s were performed to evaluate the cross-reactive properties of the
generated anti-parvalbumin antibodies against native protein extracts from all the fish
analysed (Figure 3.8). The anti-barramundi parvalbumin antibodies were the most
cross-reactive out of the four antibodies, detecting parvalbumin in 35 and 34 out of 45
raw and heated extracts, respectively. The next most cross reactive antibody was anti-
basa with 33 raw and 28 heated detected, followed by the anti-pilchard antibody with 29
raw and heated and the anti-salmon reacting with 17 raw and 21 heated extracts. Based
on these findings we cannot conclude that heat treatment will decrease or increase the
four antibodies reactivity to parvalbumin in ELISAs. However heating did affect the
reactivity to specific species. For example, heated pilchard, gemfish, grunter bream,
coral trout, trevally, blue eye trevella and Atlantic salmon were detected by all the
antibodies and demonstrated stronger binding to heated than raw (Table 3.2 Figure 3.8).
In contrast, binding was lost after heating orange roughy, whiting and dory. The anti-
salmon antibody was far more specific than the other antibodies, with only strongly

CHAPTER 3
68
Ch
apter 3
binding to Atlantic salmon, rainbow trout (both are salmoniformes) and heated pilchard.
Interestingly, this antibody did not bind to rainbow trout by immunoblotting, indicating
conformational changes impacting on antibody reactivity. Other fish extracts
demonstrated similarly increased reactivity in the ELISA analysis. For instance, raw and
heated extracts were exclusive detected from blacktip shark, elephant shark, blue
grenadier, sparsely spotted stingaree, blue threadfin, jewel, sweet lip, rainbow trout,
monkfish, gummy shark (raw only), Dory (raw only) and Spanish mackerel (heat only).
In contrast, Gurnard was not detected by ELISA, however detected weakly by anti-
barramundi and anti-pilchard antibody in the immunoblot analysis.

CHAPTER 3
69
Ch
apter 3
Figure 3.8 Indirect ELISA’s using anti-barramundi, anti-basa, anti-pilchard and anti-
salmon polyclonal antibodies against all raw and heated fish extracts. The cut-off is
derived from two standard deviations above the mean reactivity of 3 non-fish extracts
and indicated by the dotted line (O.D.: Anti-barramundi=0.08, Anti-basa=0.00, Anti-
pilchard=0.00 and anti-salmon=0.11). n=1.

CHAPTER 3
70
Ch
apter 3
Table 3.2 Analysis of raw and heated extracts from the indirect ELISA. Ticks represent
greater binding to raw, heated, no difference (neutral) or negative binding.
Anti-barramundi Anti-basa Anti-pilchard Anti-salmon
raw
heated
neutral
negative
raw
heated
neutral
negative
raw
heated
neutral
negative
raw
heated
neutral
negative
Sturgeon Orange roughy Blacktip shark Gummy shark Elephant shark Pilchard Canned sardine Blue grenadier Cod Milk fish Sparsely spotted stingaree Ling Barramundi Blue eye trevella Blue threadfin Coral trout Gemfish Grunter bream Jewel Mahi mahi Nile perch Red mullet Red throat emperor Scad Silver bream Spanish mackerel Stripped snapper Sweetlip Swordfish Trevally Whiting Yellow fin tuna Canned tuna Flounder Sole Atlantic salmon Rainbow trout Canned pink salmon Canned red salmon Canned Tasmanian salmon Gurnard Basa/catfish Monkfish Leather jacket Dory Black tiger prawn Chicken Pork
CHAPTER 3
71
Ch
apter 3
3.4 Discussion
Parvalbumin, the major allergen from fish is a diverse protein that is expressed in many
forms in different fish species [12, 141, 159]. The diversity of these highly allergenic
parvalbumin proteins has proven it difficult to be detected by any one single cross-
reactive antibody. In the present study, four polyclonal antibodies were generated
against purified parvalbumin from barramundi, basa, pilchard and Atlantic salmon and
were evaluated for their cross-reactivity against a diverse collection of fish species.
Immunoblotting analysis using PARV-19 against the present group of fish extract
demonstrated the need of multiple anti-parvalbumin antibodies as PARV-19 detected
only 18 out of the 45 raw extracts. The selection of the four antigens for the antibody
production was based on the molecular phylogenetic tree. These antigens coming from
four distinct orders of fish, Perciformes (barramundi), Siluriformes (catfish),
Clupeiformes (pilchard) and Salmoniformes (Atlantic salmon). Parvalbumins from
Atlantic salmon (2 isoforms), pilchard (1 isoform) and barramundi (2 isoforms) have
previously been characterised as allergens [11, 77, 153] and SDS-PAGE profiles
demonstrate the presence of 2 isoforms from basa. Inter-antigen cross-reactivity
analysis demonstrated that the anti-barramundi antibodies were the most cross-reactive.
The phylogenetic tree shows the 2 barramundi isoforms being the most distantly related
from each other, suggesting that the specific polyclonal antibodies raised may have the
greatest cross-reactivity. The next most diverse antibody should be the Atlantic salmon
isoforms, however the anti-salmon antibodies were surprisingly the least cross-reactive.
These findings are supported by clinical studies where fish allergic patients can be
monosensitive to Salmonids [90, 91, 160], which could attributed to salmon
parvalbumin having a different IgE epitope at the N-terminal of parvalbumin [76, 141,
160]. This phenomenon may also be occurring for the rabbit antibodies analysed in this

CHAPTER 3
72
Ch
apter 3
study. The most antigenic region of salmon parvalbumin could be the N-terminal
region, which is known to be the least conserved region as it does not contain any
calcium binding sites and subsequently possible generating a very specific antibody
[154]. The anti-salmon antibody reacts therefore strongly to heated pilchard extract in
the indirect ELISA, correlating with the close phylogenetic relationship between β1
salmon parvalbumin and pilchard parvalbumin.
Analyzing the fish extracts by ELISA using the generated polyclonal antibodies
demonstrated binding to nearly all species, excluding mahi mahi, swordfish, yellowfin
tuna and the five canned fish extracts. Parvalbumin from Spanish mackerel was only
detected by the indirect ELISA method using the anti-barramundi antibody against heat
extract. Mahi mahi, Spanish mackerel, swordfish and yellowfin tuna are all large
perciformes and as demonstrated by SDS-electrophoresis, they express little or no
visible proteins in the 10-15 kDa region. This suggests that the lack of antibody binding
to these fish may be due to low expression levels rather than a lack of cross-reactivity. It
has been previously demonstrated that swordfish, mackerel and tuna express less
parvalbumin than other fish [105, 108] and is due to their high content of dark muscle
which contains less parvalbumin [33]. A recent study by Lee et al [157] validated our
findings for mahi mahi as the polyclonal antibodies was also unable to detect mahi mahi
parvalbumin, probably due to low expression levels.
Some fish seem to have heat labile parvalbumin, including Orange roughy, gummy
shark, whiting, dory, sole and flounder, as their ELISA signals were all decreased after
heat treatment.
In addition some parvalbumin proteins seem to have conformational epitopes,
demonstrated by the lack of immunoblot binding despite having good signals for raw

CHAPTER 3
73
Ch
apter 3
and heated extract by ELISA and included blacktip shark, elephant shark, sparsely
spotted stingaree, blue grenadier, blue threadfin, Spanish mackerel, sweetlip, rainbow
trout and monkfish.
Raw pilchard extract demonstrated high molecular weight parvalbumin oligomers
(possibly a tetramer) and is detected by anti-barramundi, anti-basa and anti-pilchard
antibodies. Interestingly, after heating tetrameric pilchard parvalbumin was reduced to
the monomeric form and a low binding dimer at about 24 kDa. Pilchard parvalbumin
has previously been shown by Beale et al. [11] and Saptarshi et al. [154] (Chapter 2) to
have oligomeric parvalbumins that were reduced to dimmers and monomers after
heating. Some fish species where not detected by any antibodies in ELISA or by
immunoblotting and included mahi mahi, swordfish, yellowfin tuna and the five canned
fish.
It is well known that the process of canning subjects the fish to extreme heating and
pressure, which leads to degradation of protein [161, 162]. This is evident by the SDS-
PAGE profiles of the five canned fish extracts, which demonstrated no distinct protein
bands. The canning process has been previously shown to decrease also patient IgE
antibody binding due to protein degradation [162], which is also evident in our
experiments where all four polyclonal IgG antibodies are unable to detect parvalbumin
in the canned extracts, even though two of the antibodies were raised against the
specific fish species, pilchard and salmon. A different approach must be used to detect
allergens from canned fish with antibodies, such as described in Lopata et al [139], to
be raised against canned pilchard which in turn reacted to canned pilchard extract.
Heated treated pilchard parvalbumin retains its allergenicity as demonstrated in the
subsequent murine model developed [15].
CHAPTER 3
74
Ch
apter 3
While most edible fish species belong to the group of bony fish, several cartilaginous
species are consumed in the Asian-Pacific region including the analysed Blacktip shark,
elephant shark, gummy shark, sparsely spotted stingaree and monkfish. However
reports on allergenic parvalbumin from cartilaginous fish are limited [148, 149] and
attempts to detect parvalbumin from cartilaginous fish with cross-reacting antibodies
not being very successful [154]. As expected all five cartilaginous fish species where
not detected by immunoblotting, however all were detected by the indirect ELISA
method, demonstrating that antibody binding to parvalbumin was lost under denaturing
conditions. Cartilaginous fish parvalbumin, which mostly is of the alpha-lineage and is
considered to have significantly different biophysical properties to bony fish
parvalbumin, may have led to the lower antibody binding observed [141, 150].
Excluding cartilaginous fish and the canned fish extracts leaves only the bony fish
extracts. All antibodies were effective in detecting parvalbumin from bony fish. In
particular, the anti-barramundi antibodies which detected 32 out of 35 bony fish, these
were followed by anti-basa (28/35), anti-pilchard (28/35) and the least cross-reactive
anti-salmon (24/35). This demonstrates that these antibodies greatest application may be
to detect bony-fish parvalbumin.
In this study, it has been demonstrated that the generation of highly cross-reactive anti-
parvalbumin antibodies can be used for the characterisation allergenic fish parvalbumin
and its detection in contaminated food products. All analysed 40 fish species across 17
orders, except mahi mahi, swordfish and yellowfin tuna had parvalbumin detected in
raw extracts (92.5% of all species analysed). Furthermore, antibody reactivity to several
fish seems to be susceptible to denaturation of allergens during heating, demonstrating
that these parvalbumins have most likely conformational epitopes, which lose antibody
reactivity after heat treatment. The lack of detecting parvalbumins in some species is

CHAPTER 3
75
Ch
apter 3
probably due to the low expression of this protein or being of the alpha-parvalbumin
lineage as for most cartilaginous fish. This cross-reactivity study also shows that
processing of fish, especially canning, can have an impact on antibody recognition in
ELISA, possibly similar to IgE binding in vivo.
3.4.1 Future directions
In this chapter, 40 Australasian fish parvalbumins were screened for cross-reactivity
with four anti-parvalbumin antibodies. The allergens in many of these fish have not
been characterised, even though some are commonly consumed in the region. One fish
in particular, barramundi (L. calcarifer), is commonly eaten in South East Asia and
Australia and is known to have IgE reactive proteins that are yet to be characterised [3].
This chapter also demonstrated that antibodies against barramundi parvalbumin were
highly cross reactive, furthering the interest in allergens from barramundi. In chapter 4,
allergens from barramundi will be characterised using a fish allergic cohort of paediatric
and adults patients.
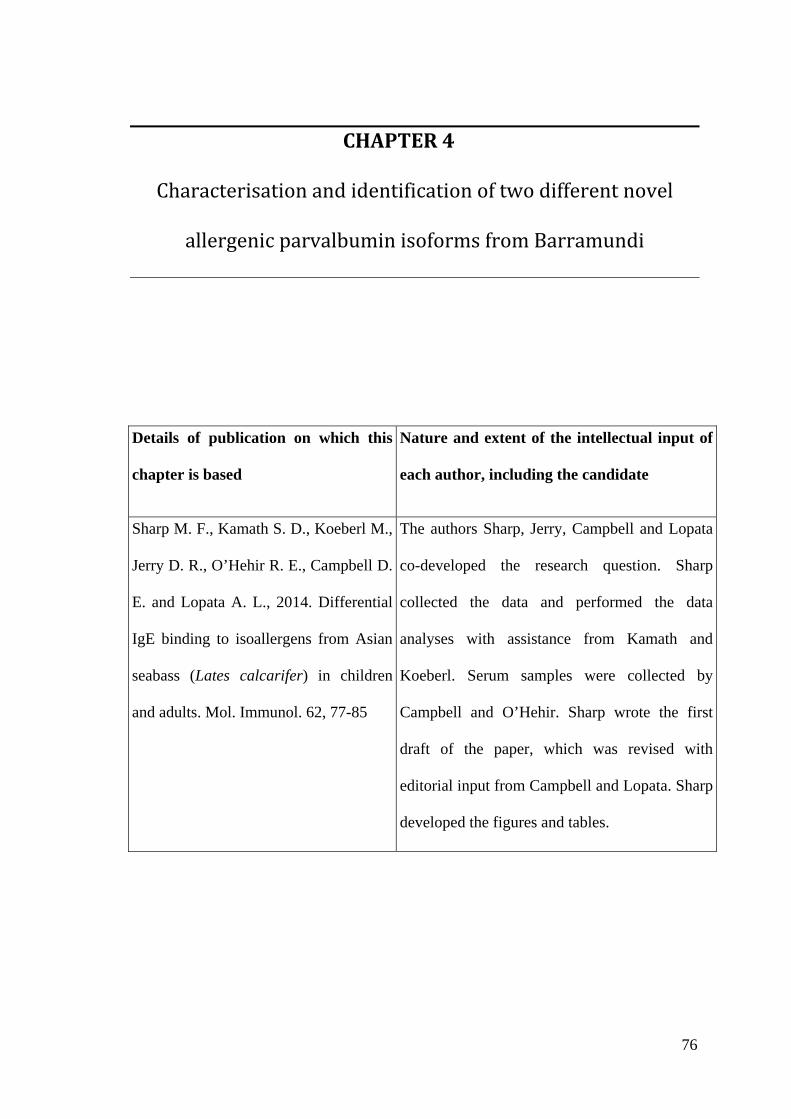
76
CHAPTER4
Characterisationandidentificationoftwodifferentnovel
allergenicparvalbuminisoformsfromBarramundi
Details of publication on which this
chapter is based
Nature and extent of the intellectual input of
each author, including the candidate
Sharp M. F., Kamath S. D., Koeberl M.,
Jerry D. R., O’Hehir R. E., Campbell D.
E. and Lopata A. L., 2014. Differential
IgE binding to isoallergens from Asian
seabass (Lates calcarifer) in children
and adults. Mol. Immunol. 62, 77-85
The authors Sharp, Jerry, Campbell and Lopata
co-developed the research question. Sharp
collected the data and performed the data
analyses with assistance from Kamath and
Koeberl. Serum samples were collected by
Campbell and O’Hehir. Sharp wrote the first
draft of the paper, which was revised with
editorial input from Campbell and Lopata. Sharp
developed the figures and tables.

CHAPTER 4
77
Ch
apter 4
4.1 Introduction
Consumption of fish and its products is growing globally due to its nutritional value and
global cultural diversity. This has however contributed to in an increased incidence of
allergic reactions to fish [141] on the background of an overall significant increase in
food allergy prevalence over the past two decades [163]. Fish Allergy is one of the eight
most common food allergies with prevalence rates in the general population ranging
between 0.2% and 2.3% [7, 10]. Unlike food allergy to milk and egg, fish allergy is
rarely outgrown and may be a more common food allergy in adults than children [7, 22,
23]. Additionally, fish allergy, and allergen avoidance impacts negatively on the quality
of life of fish allergic individuals and has been shown to result in anxiety and stress in
families of affected children [3].
Individuals with fish allergy may be allergic to a defined species or to many species of
fish, and it is therefore of significant clinical importance to be able to define and
characterize major allergens amongst and within specific fish species. Comparative IgE
reactivity between adults and children to selected fish allergens has not been previously
investigated.
The major allergens characterised in bony fish are the calcium binding muscle protein
parvalbumins, which are small, heat stable proteins with molecular weights ranging
from 10-15 kDa. Parvalbumins appear to occur as two genetically distinct lineages,
alpha and beta [84], which can differ up to 36% in amino acid sequence, such as
described in Atlantic salmon [77]. How these differences might influence allergenicity
has not been investigated. Moreover, most allergenic parvalbumins have been
characterised in only European fish species, and very little is known about allergenic
fish in the Asian-Pacific region [154].

CHAPTER 4
78
Ch
apter 4
The Asian seabass (Lates calcarifer), also known as Barramundi, is one of the most
valued and consumed fish species in the Asian-Pacific region, and increasingly exported
to Europe and North-America, due largely to successful aquaculture methodology [164,
165]. It is also a fish associated with clinical allergy in the Australian setting. A recent
retrospective study in Australia among 2,999 children with food allergy demonstrated a
prevalence of 5.6% for fish allergy, listing ‘Barramundi’ as one of the most frequent
species implicated [133].
Barramundi parvalbumin is highly cross-reactive against parvalbumin-specific
antibodies, as seen in Chapter 2 and 3. Expression of parvalbumin in barramundi has
previously been investigated as a possible indicator of fish growth and it has been
established that two parvalbumin isoforms are present in the muscle tissue (β1 and β2)
[166]. Beta 1 parvalbumin is also present in other tissue such as the kidney, small
intestine, skin, spleen, liver, heart, gill, eye and in high concentration in the brain [167],
while β2 expression is limited to skeletal muscle.
The aim of this study was to identify and characterize allergenic proteins from
barramundi and to compare the IgE reactivity to these major allergens in paediatric and
adult fish allergic patients. Identified allergens were characterised on molecular level
using proteomic and gene technology approaches and generation of recombinant
isoallergens. Molecular characterisation of important food allergens is essential to
improving in vivo and in vitro diagnostics approaches and for the management of
individuals with fish allergy.
4.1.1 Aims
The aim of the chapter is characterize allergens from barramundi (Lates calcarifer)
using a fish allergic patient cohort of children and adults. Fish allergic patient IgE will
CHAPTER 4
79
Ch
apter 4
be used in immunoblot and ELISA’s in tandem with mass spectrometry will be used to
identify allergens from barramundi. Recombinant allergens will then be generated for
isolation and further analysis of the allergens.
CHAPTER 4
80
Ch
apter 4
4.2 Materials and methods
4.2.1 Patient sera
Subjects were selected on the basis on a convincing recent history of an IgE mediated
reaction (including urticaria, angioedema, stridor, cough, wheeze, hypotension and/ or
gastrointestinal symptoms of vomiting and/or diarrhoea) to any Australian- Asian
Pacific fish which occurred within 2 hours of ingestion and confirmation of fish
reactivity by prick-to-prick testing or specific IgE to tuna, salmon cod, and trout.
Human ethics for this study was approved by the Sydney Children’s Hospital Network
ethics committee (HREC) (Table 4.1).
4.2.2 Fish collection
Barramundi (Lates calcarifer) was collected from the Aquaculture Genetics research
group of the School of Marine and Tropical Biology, James Cook University, QLD
Australia and subsequently filleted and stored at -80oC until further use.
4.2.3 Protein extraction
Raw extract was produced by homogenizing 50 g of the barramundi white muscle fillet
in 100 mL of phosphate buffered saline (PBS, 10mM, pH 7.4) and extracted over 3 h
with gentle tumbling at 4°C. The crude extract was subjected to centrifugation at 5000 g
for 30 min at 4°C and filter sterilized using 0.2 µm cellulose acetate filter membrane
(Sartorius, Germany). Heated extract was produced by heating 50 g of white muscle at
95°C for 15 min in PBS followed by gentle tumbling at 4°C for 3 h. The crude heated
extract was subjected to centrifugation at 5000 g for 30 min at 4°C and filter sterilized
using 0.2 µm cellulose acetate filter membrane. Protein concentration of each extract
was estimated by using the Pierce® 660 protein assay (Thermo Scientific, Rockford,
USA) and extracts were aliquoted and stored at -80°C.

CHAPTER 4
81
Ch
apter 4
4.2.4 Sodium dodecyl sulfate polyacrylamide gel electrophoresis (SDS-PAGE) and immunoblot analysis
Raw and heated protein extracts and purified recombinant parvalbumin isoforms were
separated on a 15% polyacrylamide gel, and subsequently stained with Coomassie
brilliant blue R-250 (BioRad laboratories, Hercules, USA).
Immunoblots were performed with the protein samples using anti-frog parvalbumin
monoclonal antibody (mAb), PARV-19 (Sigma-Aldrich) and anti-barramundi
parvalbumin polyclonal antibody (pAb) generated in rabbit (in-house). Proteins samples
were separated on 0.75 mm thick 15% polyacrylamide gel and transferred to PVDF
membrane using semidry electrophoresis and blocked with casein blocking buffer for 1
h at room temperature. Membranes were incubated for 1h at room temperature with the
mAb and pAb in dilutions of 1:3,000 and 1:40,000 in 20% casein blocking buffer in
PBS/0.05% tween (PBS-T), respectively. Membranes were washed 3-times with PBS-T
and subsequently incubated for 30 min with corresponding HRP tagged anti-mouse
(1:80,000) and anti-rabbit (1:40,000) IgG antibodies. Membranes were washed a further
3-times in PBS-T, blots were then incubated for 5 min with 1 mL of Pierce® Western
blotting enhanced chemiluminescence (ECL) substrate (Thermo Scientific, Rockford,
USA) Bands were visualized through exposure to ECL Hyperfilm (GE Healthcare
Biosciences, Little Chalfont, UK) in the dark room and developed using standard X-ray
film developing techniques.
Immunoblots using IgE from allergic patient sera against raw and heated protein extract
and recombinant β1 and β2 parvalbumin isoforms were performed by separating the
proteins on a 15% polyacrylamide gel. Proteins were then transferred to a nitrocellulose
membrane (BioRad laboratories, Hercules, USA) using semidry electrophoresis and
blocked in casein blocking buffer (Sigma-Aldrich, St. Louis, USA) for 1 h at room
CHAPTER 4
82
Ch
apter 4
temperature. Sera were diluted 1:20 in 20% casein blocking buffer in PBS-T.
Membranes were placed into slot blot manifold and the diluted serum aliquoted into the
slots. Membranes were incubated with sera for 16 h at 4°C and subsequently washed 6-
times with 4% casein blocking buffer in PBS-T at room temperature. Membranes were
then incubated with a horseradish peroxidase labeled goat anti-human IgE antibody
(Genetex, Irvine, USA) diluted 1:20,000 in 20% casein blocking buffer in PBS-T for 1 h
at room temperature. Membranes were washed 5-times with 4% casein blocking buffer
in PBS-T at room temperature and IgE binding visualized by performing ECL technique
as described above.
4.2.5 Identification of allergens by mass spectrometry
The two IgE reactive bands were excised from the SDS gel and were destained with
ammonium bicarbonate:acetonitrile, reduced with 10 mM Dithiothreitol and alkylated
with 20 mM Iodoacetamide. Gels bands were washed, dried then underwent trypsin
digestion (100 ng) overnight. Peptides were extracted from gel with acetonitrile:formic
acid, then concentrated prior to analysis. Peptides were analysed using NanoLC system
(Eksigent Ultra nanoLC system) coupled with ESI Triple TOF 5600 MS system (AB
Sciex). Peptide were separate with Halo C18 column using a linear solvent gradient,
with steps, from H2O:CH3CN (95:5; + 0.1% formic acid) to H2O:CH3CN (5:95; +
0.1% formic acid) with independent flow (300-400 nL/min) over an 80 min period.
Analysis of LC/MS/MS data was generated using ProteinPilot v4.2 searched with
Paragon method. The data was searched against Lates proteins (taken from SwissProt).
This work was undertaken at APAF the infrastructure provided by the Australian
Government through the National Collaborative Research Infrastructure Strategy
(NCRIS).
CHAPTER 4
83
Ch
apter 4
4.2.6 Two-dimensional electrophoresis of raw extract
Two-dimensional electrophoresis analysis experiment was conducted with PARV-19
mAb anti-parvalbumin immunoblotting, 160 µg of desalted and lyophilized fish protein
was resuspended in 150 μL of IPG rehydration buffer (8M Urea, 2% CHAPS, 50mM
Dithiothreitol (DTT), 0.2% (w/v) Biolyte 3/10 ampholytes (BioRad) and bromophenol
blue. Samples were actively rehydrated into 7 cm pH 3-10 IPG strips (Bio-Rad) at room
temperature for 12 h. Isoelectric focusing (IEF) was performed using a Protean IEF cell
(Bio-Rad) for a total of 10,000V hours with a rapid voltage ramp. Following IEF, the
IPG strips were incubated in equilibration buffer (6 M urea, 2% SDS, 0.375 M Tris-
HCl, pH 8.8, 20% glycerol) supplemented with 2% DTT for 15 min at room
temperature followed by incubation with 2.5% iodoacetamide in equilibration buffer for
another 15 min at room temperature. IPG strips were placed onto a 15% polyacrylamide
SDS gel, covered 0.5% agarose and separated by size at 200 V for 1 h. The protein
matrix was visualized using Coomassie blue and parvalbumin was identified by
immunoblotting using PARV-19 anti-parvalbumin mAb’s as described in 4.2.4.
4.2.7 RNA isolation and cDNA synthesis
RNA was extracted from 100 mg of barramundi muscle tissue according to the TRIzol®
reagent protocol (Invitrogen, Carlsbad, USA). RNA extracted was quantified using the
NanoDrop ND 1000 spectrophotmeter (Thermo Scientific, Waltham, USA) and the first
strand cDNA synthesized using the Bioline cDNA synthesis kit (Bioline, London, UK).
4.2.8 PCR amplification and sequencing
Isoform specific forward and reverse primers were designed from previously sequenced
Barramundi beta-1 and beta-2 parvalbumin with the addition of the restriction sites
BamH1 and EcoR1 at placed at the sense 5’ and 3’ ends, respectively (beta-1 forward

CHAPTER 4
84
Ch
apter 4
5’-GCGGGATCCGCATTCGCCGGAATCCTGA-3’, beta-1 reverse 5’-
GCCGAATTCTTAAACCTTGACCAAGGCAGCA-3’, beta-2 forward 5’-
CCGGGATCCGCCTTCTCAAATGTACTG-3’, beta-2 reverse 5’-
GCGGAATTCTTATGGCTTAACCAATGC-3’). Fragments of Barramundi cDNA
encoding both beta-1 and beta-2 parvalbumin were amplified by PCR using the specific
primers created with GoTaq® Hot Start polymerase (Promega, Madison, USA). PCR
products were gel-purified, cloned into the pCR2.1- TOPO vector (Invitrogen, Carlsbad,
USA) and sequenced (Macrogen, Seoul, South Korea) for subsequent deduction of
amino acid sequence.
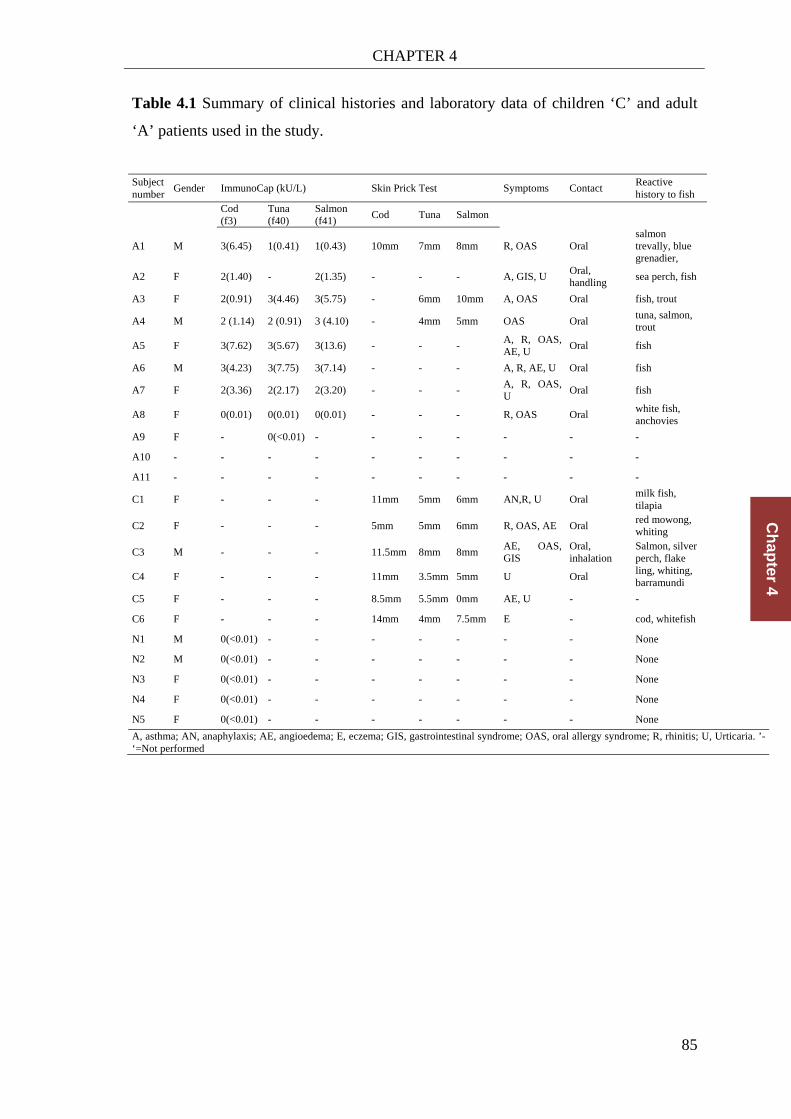
CHAPTER 4
85
Ch
apter 4
Table 4.1 Summary of clinical histories and laboratory data of children ‘C’ and adult
‘A’ patients used in the study.
Subject number
Gender ImmunoCap (kU/L) Skin Prick Test Symptoms Contact Reactive history to fish
Cod (f3)
Tuna (f40)
Salmon (f41)
Cod Tuna Salmon
A1 M 3(6.45) 1(0.41) 1(0.43) 10mm 7mm 8mm R, OAS Oral salmon trevally, blue grenadier,
A2 F 2(1.40) - 2(1.35) - - - A, GIS, U Oral, handling
sea perch, fish
A3 F 2(0.91) 3(4.46) 3(5.75) - 6mm 10mm A, OAS Oral fish, trout
A4 M 2 (1.14) 2 (0.91) 3 (4.10) - 4mm 5mm OAS Oral tuna, salmon, trout
A5 F 3(7.62) 3(5.67) 3(13.6) - - - A, R, OAS, AE, U
Oral fish
A6 M 3(4.23) 3(7.75) 3(7.14) - - - A, R, AE, U Oral fish
A7 F 2(3.36) 2(2.17) 2(3.20) - - - A, R, OAS, U
Oral fish
A8 F 0(0.01) 0(0.01) 0(0.01) - - - R, OAS Oral white fish, anchovies
A9 F - 0(<0.01) - - - - - - -
A10 - - - - - - - - - -
A11 - - - - - - - - - -
C1 F - - - 11mm 5mm 6mm AN,R, U Oral milk fish, tilapia
C2 F - - - 5mm 5mm 6mm R, OAS, AE Oral red mowong, whiting
C3 M - - - 11.5mm 8mm 8mm AE, OAS, GIS
Oral, inhalation
Salmon, silver perch, flake
C4 F - - - 11mm 3.5mm 5mm U Oral ling, whiting, barramundi
C5 F - - - 8.5mm 5.5mm 0mm AE, U - -
C6 F - - - 14mm 4mm 7.5mm E - cod, whitefish
N1 M 0(<0.01) - - - - - - - None
N2 M 0(<0.01) - - - - - - - None
N3 F 0(<0.01) - - - - - - - None
N4 F 0(<0.01) - - - - - - - None
N5 F 0(<0.01) - - - - - - - None
A, asthma; AN, anaphylaxis; AE, angioedema; E, eczema; GIS, gastrointestinal syndrome; OAS, oral allergy syndrome; R, rhinitis; U, Urticaria. ’-‘=Not performed

CHAPTER 4
86
Ch
apter 4
4.2.9 Recombinant protein expression and purification
The expression vector used was pPROEX HTb which contains ampicillin resistance
selectivity and N-terminal His(6) tag. The pCR2.1- TOPO vector containing the
parvalbumin inserts and the expression vector pPROEX HTb underwent double
restriction digest with BamH1 and EcoR1 according to manufacturer’s instructions
(Promega Co., Madison, USA). Cleaved parvalbumin insert and expression vector were
separated by electrophoresis on 1% agarose gel and purified using DNA Wizard
purification kit (Promega Co., Madison, USA). Insert was ligated into expression
plasmid using T4 ligase according to manufacturer’s instructions (Invitrogen, Carlsbad,
USA). Chemically competent NM522 E. coli cells were transformed with the ligated
recombinant plasmid by heat shock for 1 min at 42oC. Successfully transformed cells
were selected by their ampicillin resistance and cultured in Luria Broth (LB) overnight
at 37oC as a starter culture. Fresh LB media was inoculated with the overnight starter
culture and incubated shaking at 37oC until turbidity had given an absorbance of 0.5 at
600 nm. Recombinant protein expression was then induced with a final concentration of
0.06 µM Isopropyl β-D-thiogalactoside (IPTG) and cultured for a further 3 h. Cultures
were centrifuged and cells were washed in 20 mM sodium phosphate, 0.5 M sodium
chloride, pH 7.4. Cells were subsequently centrifuged and supernatant discarded and
pellet resuspended in immobilized metal affinity chromatography (IMAC) binding
buffer (20 mM sodium phosphate, 0.5 M sodium chloride, 5 mM imidazole, pH 7.4).
Cells were lysed using 3 freeze-thaw cycles and by a French pressure cell and lysate
centrifuged and supernatant loaded onto HisTrap HP column (GE Healthcare
Biosciences, Little Chalfont, UK) washed with IMAC binding buffer and his-tagged
proteins were eluted with IMAC elution buffer (20mM sodium phosphate, 0.5 M
sodium chloride, 250 mM imidazole, pH 7.4) and purity confirmed on 15%

CHAPTER 4
87
Ch
apter 4
polyacrylamide SDS gel. Recombinant allergens were also analysed by immunoblotting
with anti-parvalbumin IgG’s and patient IgE as described in 4.2.4.
4.2.10 IgE enzyme-linked immunosorbent assay (ELISA)
The wells of a 96-well EIA/RIA plate (Costar, St. Louis, USA) were coated with 100
μL fish extract (1μg/mL in sodium carbonate/bicarbonate buffer pH 9.6), and incubated
overnight at 4˚C. All of the following incubations were performed for 1 h unless
otherwise stated and plates washed 4-times in PBS/0.05% Tween 20 (PBS-T) between
steps. Blocking was performed using 5% skim milk diluted in PBS-T. Serum, 100 μL
diluted 1:10 in 1% skim milk/PBS-T, was added to wells and incubated for 3 h at room
temperature while shaking (45 rpm). Rabbit anti-human IgE antibody (1:4000; Dako,
Glostrup, Denmark) and goat anti-rabbit IgG-HRP (1:1000; Promega, Madison, USA)
were added sequentially to wells and plates incubated at room temperature for 1 h with
gentle shaking. Plates were then washed 5-times in PBS-T, followed by 3 washes in
PBS (no Tween). IgE binding was detected using TMB (3,3’,5,5’-
Tetramethylbenzidine) substrate (BD, Franklin Lakes, USA) and reaction terminated
using 1 M HCl and the absorbance (O.D.) at 450 nm measured by spectrophotometry
(Molecular Devices, Sunnyvale, USA). Three non-fish allergic subjects were analysed
to determine the extent of non-specific binding. Experiment was performed once.
4.2.11 3D modeling of parvalbumin isoforms
Beta 1 and 2 parvalbumin isoforms were aligned to a carp parvalbumin template (PDB
ID: 4cpv) using SWISS-MODEL and protein modeled in UCSF Chimera version 1.7.
4.2.12 Data analysis
Cut-off values in indirect IgE ELISA were determined using the mean of three non-fish
allergic patients plus 2 times the standard deviation. For direct comparison between

CHAPTER 4
88
Ch
apter 4
protein samples each value from the IgE ELISA was divided by their corresponding cut-
off value and recorded as ‘fold increase’ in Figure 4.6. The Wilcoxon matched-pairs
signed rank test was used to compare overall serum IgE reactivity between raw and
heated extracts and recombinant parvalbumin isoforms. Analyses were performed using
GraphPad Prism version 5.04 for Windows (GraphPad, San Diego, CA).

CHAPTER 4
89
Ch
apter 4
4.3 Results
4.3.1 SDS-PAGE and immunoblot analysis of IgE binding proteins.
Raw, heated barramundi protein extracts and both β1 and β2 recombinant parvalbumin
isoforms were separated by SDS-PAGE and stained with Coomassie brilliant blue
(Figure 4.1). The two parvalbumin isoforms are highly expressed in barramundi as seen
in between 10 and 15 kDa in the raw extract. These isoforms were confirmed as
allergenic as they bind fish allergic patient serum IgE as seen in the immunoblot in
Figure 4.1D. Three adults (A2, 3 and 5) and three children (C1-3) show moderate
binding to parvalbumin in the raw extract, while patient A1, A10, A11 and C4 show
weak binding and patient C6 clearly binds strongly to both raw parvalbumin isoforms.
These isoforms are highly heat stable as there are only three strong bands in the heat
extract, two of them are suspected parvalbumin as their molecular weights is between
10 and 15 kDa. Heating does also not affect the allergenicity of parvalbumin as a near
identical binding pattern can be seen between the patients with the exception of patient
A10, who appears to bind stronger to heated than raw parvalbumin. Purified
recombinant β1 and β2 parvalbumins have calculated molecular weights of 14.83 and
14.95 kDa, respectively. This is higher when compared to their natural counterparts due
to their His-tag not being cleaved after purification. The IgE immunoblot again show a
similar binding pattern to the raw protein extract with the same patients demonstrating
binding. However patient A7 appears to bind to both recombinant parvalbumins, but
interestingly showed no binding to raw or heated extract. Furthermore, the rβ1 isoform
seems to assemble dimers with a molecular weight of about 30 kDa and patient C6 is
the only patient who reacts to this oligomer (Figure 4.4D). It confirmed the presence of
the two different barramundi parvalbumin allergens by mass spectrometry, with 3
peptides for both β1 and β2 (Figure 4.3 B).

CHAPTER 4
90
Ch
apter 4
Figure 4.1 The extracted barramundi proteins are separated by SDS-PAGE and stained
with coomassie brilliant blue (A) and have been detected via immunoblot with a
commercial anti-frog parvalbumin mAb, PARV-19 (B) and an in house rabbit anti-
barramundi parvalbumin pAb (C). Immunoblots using fish allergic patient sera against
raw (D) and heated barramundi extracts (E).
.

CHAPTER 4
91
Ch
apter 4
Figure 4.2 Two-dimensional electrophoresis analysis of raw barramundi extract. A)
Coomassie blue stained gel of 2D electrophoresis. B) Two-dimensional immunoblot
with a commercial anti frog parvalbumin mAb, PARV-19. Parvalbumin isoforms are
boxed in red.
4.3.2 Analysis of parvalbumin isoforms amino acid sequences translated from cDNA.
PCR primers were designed from previously sequenced Asian barramundi parvalbumin
[15] to amplify parvalbumin genes from a cDNA library generated from the muscle of
Australian barramundi. Amplicons were cloned into the sequencing vector and
demonstrated that the barramundi expresses two different beta parvalbumin isoforms,
β1 and β2. These two isoforms have identical calcium binding EF-hand residues. Beta-1
CHAPTER 4
92
Ch
apter 4
and beta-2 share similar physical properties such as their respective molecular weights
with 11.54 and 11.71 kDa, and theoretical isoelectric points of 4.50 and 4.48
respectively. Two-dimensional electrophoresis demonstrated that the parvalbumin
isoforms had a practical pI of 4 (Figure 4.2). Despite these similarities between the two
isoforms they share only 67% of their amino acid sequences. The space filling model
(Figure 4.3) demonstrates that despite differing by 33%, the two isoforms form similar
theoretical 3D structures. Sequences were submitted to GenBank and assigned
accession numbers KF021278 (β1) and KF021279 (β2).

CHAPTER 4
93
Ch
apter 4
Figure 4.3 Space filling models of both Lat c 1.0101 and Lat c 1.0201 based on the
template 4cpv. Residues that differ between the isoforms are shaded. B) Amino acid
sequence alignment of the β1 (Lat c 1.0101) and β2 (Lat c 1.0201) parvalbumin
isoforms from L. calcarifer compared to allergenic parvalbumin from Scomber
japonicus, Salmo salar, Cyprinus carpio and Gadus callarias with confirmed IgE
epitopes shaded in light. Identical amino acid residues between the two L. calcarifer
isoforms are shaded in dark. EF-hand calcium binding residues are boxed in green.
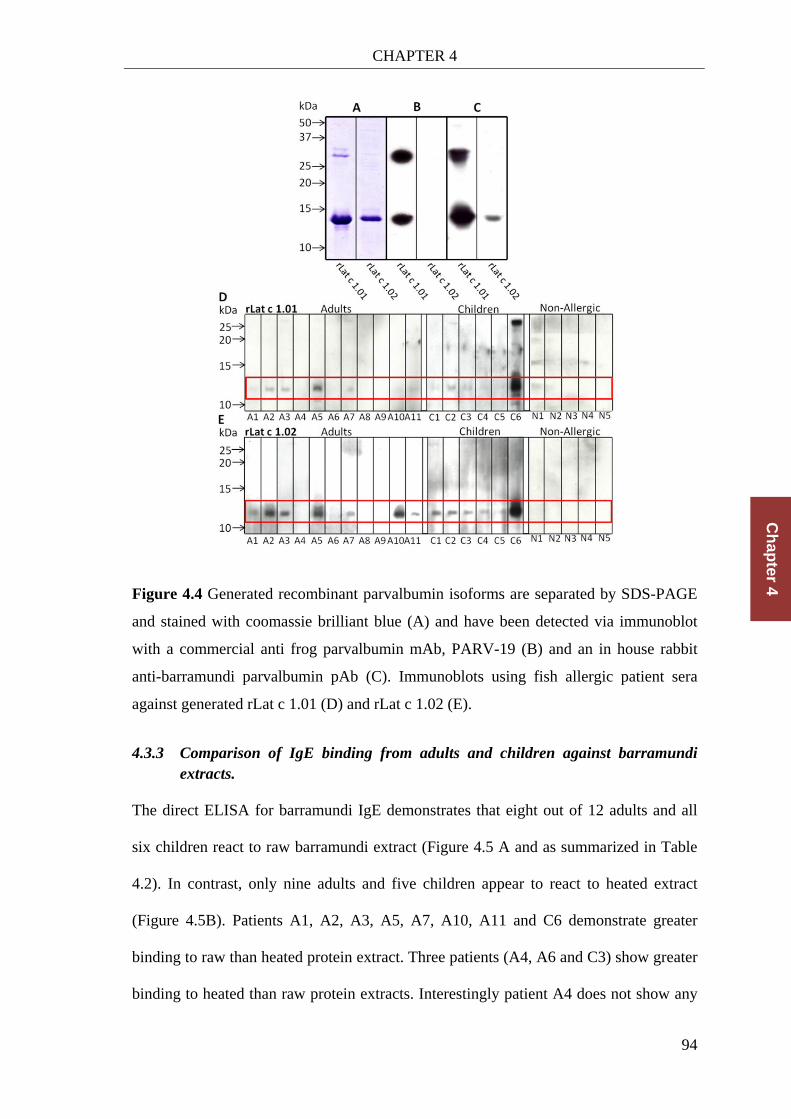
CHAPTER 4
94
Ch
apter 4
Figure 4.4 Generated recombinant parvalbumin isoforms are separated by SDS-PAGE
and stained with coomassie brilliant blue (A) and have been detected via immunoblot
with a commercial anti frog parvalbumin mAb, PARV-19 (B) and an in house rabbit
anti-barramundi parvalbumin pAb (C). Immunoblots using fish allergic patient sera
against generated rLat c 1.01 (D) and rLat c 1.02 (E).
4.3.3 Comparison of IgE binding from adults and children against barramundi extracts.
The direct ELISA for barramundi IgE demonstrates that eight out of 12 adults and all
six children react to raw barramundi extract (Figure 4.5 A and as summarized in Table
4.2). In contrast, only nine adults and five children appear to react to heated extract
(Figure 4.5B). Patients A1, A2, A3, A5, A7, A10, A11 and C6 demonstrate greater
binding to raw than heated protein extract. Three patients (A4, A6 and C3) show greater
binding to heated than raw protein extracts. Interestingly patient A4 does not show any

CHAPTER 4
95
Ch
apter 4
significant binding to raw extract however mounts a considerable response to heated
extract. Patients A8 and A9 did not show binding above the cut-off to raw or and only
marginally to the heated protein extract. Overall there is no significant difference
between IgE reactivity to raw and heated protein extracts. IgE reactivity between
recombinant β1 and β2 isoforms (Lat c 1.01 and Lat c 1.02, respectively) shows similar
ELISA profiles (Figure 4.5 C, D), with nine adult patients (A1-3, 5-7, 10-12) and all six
children resulting in OD values above the cut-off values. All patients with significantly
reactivity to both recombinant isoforms, excluding A6, seem to mount a marginally but
significant (p=0.0001) greater IgE response to rLat c 1.01 than Lat c 1.02. However,
there is no significant difference between the IgE reactivity of the children and adults
sample, despite all of the children reacting to all the extracts tested.
Table 4.2 Summary of immunoblot IgE reactivity between adult and paediatric patients.
Protein Sample
Reactive Adult Patient (out of 11)
Reactive Paediatric Patient (out of 6)
Raw 7 6 Heated 8 5 rBeta-1 8 6 rBeta-2 8 6
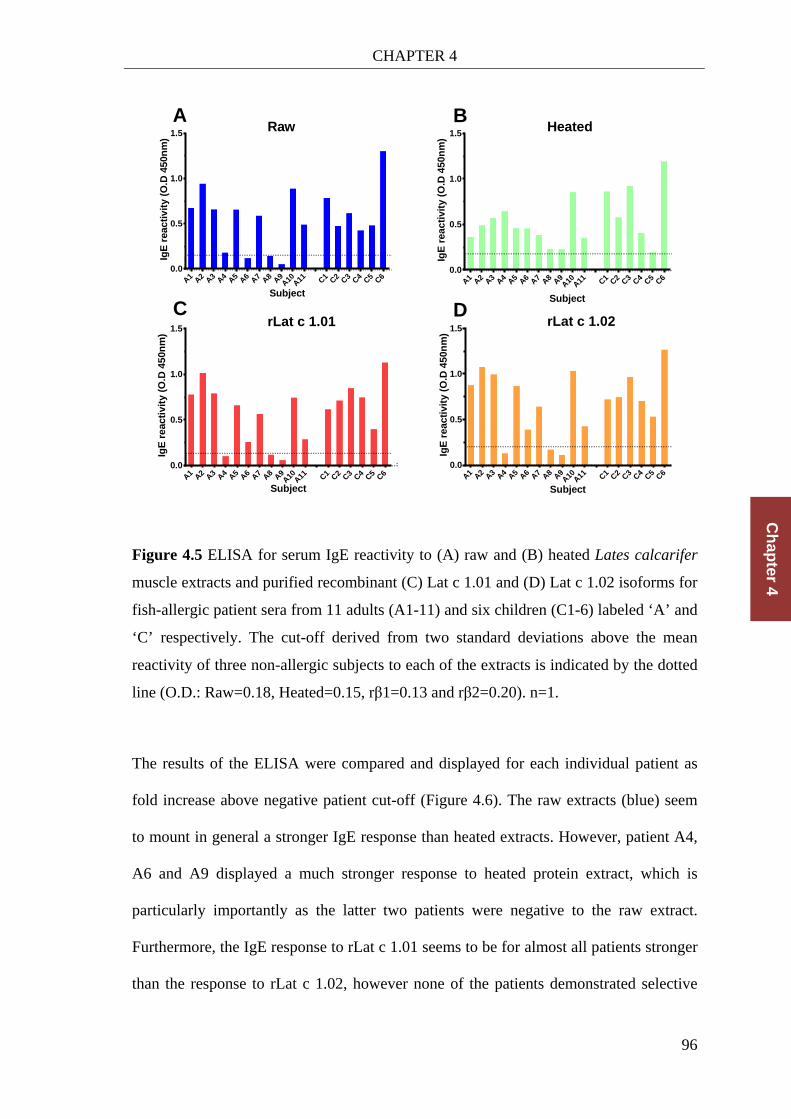
CHAPTER 4
96
Ch
apter 4
Figure 4.5 ELISA for serum IgE reactivity to (A) raw and (B) heated Lates calcarifer
muscle extracts and purified recombinant (C) Lat c 1.01 and (D) Lat c 1.02 isoforms for
fish-allergic patient sera from 11 adults (A1-11) and six children (C1-6) labeled ‘A’ and
‘C’ respectively. The cut-off derived from two standard deviations above the mean
reactivity of three non-allergic subjects to each of the extracts is indicated by the dotted
line (O.D.: Raw=0.18, Heated=0.15, rβ1=0.13 and rβ2=0.20). n=1.
The results of the ELISA were compared and displayed for each individual patient as
fold increase above negative patient cut-off (Figure 4.6). The raw extracts (blue) seem
to mount in general a stronger IgE response than heated extracts. However, patient A4,
A6 and A9 displayed a much stronger response to heated protein extract, which is
particularly importantly as the latter two patients were negative to the raw extract.
Furthermore, the IgE response to rLat c 1.01 seems to be for almost all patients stronger
than the response to rLat c 1.02, however none of the patients demonstrated selective
A1 A2 A3 A4 A5 A6 A7 A8 A9A10 A11 C1 C2 C3 C4 C5 C6
0.0
0.5
1.0
1.5
Subject
IgE
rea
ctiv
ity
(O.D
450
nm
)
A1 A2 A3 A4 A5 A6 A7 A8 A9A10 A11 C1 C2 C3 C4 C5 C6
0.0
0.5
1.0
1.5
Subject
IgE
rea
ctiv
ity
(O.D
450
nm
)
A1 A2 A3 A4 A5 A6 A7 A8 A9A10 A11 C1 C2 C3 C4 C5 C6
0.0
0.5
1.0
1.5
Subject
IgE
rea
ctiv
ity
(O.D
450
nm
)
A1 A2 A3 A4 A5 A6 A7 A8 A9A10 A11 C1 C2 C3 C4 C5 C6
0.0
0.5
1.0
1.5
IgE
rea
ctiv
ity
(O.D
450
nm
)
Subject
Raw Heated
rLat c 1.01 rLat c 1.02
A
C
B
D

CHAPTER 4
97
Ch
apter 4
reactivity. However, the response of patient A4, A6 and A9 are negative to these
recombinant parvalbumins. These three patients are the same patients who demonstrate
higher reactivity to heated extract (see above), indicating the possible presence of other
yet unidentified allergens in the heated barramundi protein extract. Following the IgE
immunoblot and ELISA experiments with these novel parvalbumin isoforms, the results
were submitted to the I.U.I.S. Allergen Nomenclature Sub-Committee as isoallergens.
β1 parvalbumin was subsequently designated Lat c 1.0101 and β2 parvalbumin was
designated Lat c 1.0201.

CHAPTER 4
98
Ch
apter 4
Figure 4.6 Comparison of the IgE ELISAs of raw and heated protein extract and both
β1 and β2 recombinant parvalbumins against 11 adults and 6 children fish allergic
patients. The graph was generated by dividing the O.D values with the cut-off O.D
value for each experiment.
CHAPTER 4
99
Ch
apter 4
4.4 Discussion
Fish allergy in Australia and the Pacific region is an important and increasing problem,
and there are currently limited diagnostic tools available to provide accurate specific
species diagnosis [141]. Barramundi is an important emerging aquaculture species and
is now commonly consumed throughout South East Asia and Australia, however prior
to this study specific barramundi allergens had not been characterised [165].
In this current study two novel allergenic parvalbumin isoallergens have been identified
in Barramundi. The two novel isoallergens Lat c 1.0101 and Lat c 1.0201 have been
registered with the IUIS. It was also demonstrated that the allergenicity to raw and
heated barramundi proteins and to recombinant forms of barramundi parvalbumin
isoallergens, as measured by IgE reactivity, differs between the β1 isoform and β2
isoform and between fish allergic adults and children.
In our study, heating of Barramundi resulted in a loss of higher molecular proteins and
stronger banding pattern in the 10 to 12 kDa region. Subsequent immunoblotting of
both raw and heated barramundi protein extracts with 17 fish allergic patients showed
two IgE binding proteins with molecular weights of about 12 kDa. The majority of
adults and children demonstrated IgE reactivity to these proteins. Previous studies on
various fish species, but not barramundi, identified parvalbumin as a major allergen [11]
and in addition other allergenic proteins including high molecular weight vitellogenin
and collagen [97] as well as the enzymes enolase and aldolase [168]. Interestingly our
study did not demonstrate any IgE binding to other proteins in raw and heated
Barramundi.
Further analysis of Barramundi extract using parvalbumin specific monoclonal and
polyclonal antibodies confirmed that these two 12 kDa proteins to be parvalbumin. The

CHAPTER 4
100
Ch
apter 4
monoclonal antibody in our study has been previously comprehensively investigated for
its ability to bind to fish parvalbumin and is known to detect most β isoforms of this
protein, but not α-parvalbumin, which is mostly present in sharks and rays [154] [157,
158, 169]. Importantly, this antibody only detects the β1 isoform of barramundi and
might have restricted the identification of parvalbumin isoforms in other studies [157].
In addition an in-house generated anti-barramundi parvalbumin polyclonal antibody
raised in rabbits was able to detect both parvalbumins in raw and heated Barramundi.
Parvalbumin is a very heat-stable protein and abundant in the white muscle tissue of
fish as previously described [84]. Several different isoforms can be expressed in a single
fish species as demonstrated for fresh-water carp during physiological development
[145].
Previous studies demonstrated IgE reactivity to multiple parvalbumins, however their
differential IgE binding capacity has not been investigated. This include Atlantic cod
[71], rainbow trout, redfish, carp [72], Atlantic herring, and Atlantic salmon [77], with
the two isoforms from the later differing the greatest from each other, sharing only 64%
of their primary structure. However Atlantic salmon parvalbumin isoforms differ little
in their biophysical properties such as size isoelectric point, where they only differ by
0.51 kDa and 0.54 pI units, respectively.
Sequence analysis of barramundi parvalbumins in our current study using recombinant
gene technology demonstrated that the novel β1 and β2 isoforms, share only 67% amino
acid identity, similar to salmon, but have near identical physical properties such as
molecular weight and isoelectric point (differing only by 0.12 kDa and 0.02 pI units).
The amino acid substitutions were mostly situated in the N-terminal region of the
parvalbumins, while the two calcium-binding sites remained over 90% identical in their
sequence. The generation of space-filling models for both isoforms showed that these

CHAPTER 4
101
Ch
apter 4
proteins were structurally very similar, even while over 30% of the amino acids were
different. This suggests that any differences in allergenicity between the two isoforms
most likely result from the variance in primary structure of the proteins, rather than
secondary or tertiary structure.
Previous gene expression studies on barramundi have demonstrated that the two
parvalbumin isoforms are differentially expressed throughout the body of this fish [167]
The β1 parvalbumin is present not just in the muscle but also in other tissues including
kidney, small intestine, skin, spleen, liver, heart, gill and eye, with the highest
concentration in the brain [167]. In contrast the β2 isoform is exclusively expressed in
the skeletal muscle. This study demonstrated that two heat-stable parvalbumin isoforms
are present in high concentration in barramundi muscle tissue.
Generation of recombinant proteins of the β1 and β2 parvalbumins enables the
comparison of the allergenicity of each discrete isoallergen, as physical separation of
the natural counterparts is extremely difficult, due to their similar biophysical
properties. Interestingly, the anti-frog parvalbumin monoclonal antibody appeared to
only detect the β1 recombinant isoform in the immunoblot, as mono- as well as dimeric
forms. The formation of β1 dimers was confirmed by the polyclonal antibody raised
against heated barramundi. Patient’s IgE binding did not show this selective
recognition, but demonstrated stronger reactivity to the β1 compared to β2 isoform of
parvalbumin in eight of 11 adults and in all children. The ELISA experiments
confirmed a significant increase in IgE reactivity to the β1 isoform. This increased IgE
reactivity might be explained by the differential expression of both isoforms, with the
β1 being ubiquitously expressed throughout all tissues, resulting in higher dietary
exposure in consumers and therefore higher sensitization.
CHAPTER 4
102
Ch
apter 4
Overall the immunogenicity of these isoforms did not appear to be affected by heating,
however eight fish allergic patients recognized raw extract marginally more than heated
extract. The effect of heating has been known to increase allergenicity of some food
allergens including peanut and shrimp [68, 170] and also for the fish pilchard [11].
However, in this study only three patients had greater IgE reactivity to heated protein
than raw. These results suggest that some patients may have antibodies to heat liable
antibody binding regions (conformational epitopes) of this major allergenic protein,
such as has been well described in egg allergens [171]. Furthermore, these three patients
are the same demonstrating no response to raw and the two recombinant parvalbumin
allergens, indicating the possible presence of other yet unidentified allergens in the
heated barramundi protein extract. Other potential allergens have been characterised in
fish including collagen [97], aldolase and enolase [168] which might contribute to IgE
binding in this in-solution assay, but are not necessarily detectable in the denaturing
immunoblot. To date, five fish parvalbumins have been investigated for their IgE
binding epitopes including carp (Cyp c 1.0101), Atlantic cod (Gad m 1.0101), Baltic
cod (Gad C 1.01), Atlantic salmon (Sal s 1.0101) and pacific mackerel (Sco j 1.0101)
[73, 75, 76, 89, 94]. From these studies one can conclude that parvalbumin may have up
to four different IgE binding epitopes, and that some have high homology and others are
very specific as seen in Atlantic salmon parvalbumin [141].
Previous studies have shown that carp has the highest homology with barramundi
parvalbumin, sharing 87% of their primary structures. Carp parvalbumin has three IgE
epitopes, two of which are conformational, which may render these epitopes more heat
labile [75]. In contrast linear epitopes are much less degraded by heat and has been
shown for a varied of food allergens including egg, milk and a variety of fruits [172].

CHAPTER 4
103
Ch
apter 4
4.4.1 Conclusion and future direction
In this study differential IgE binding patterns between raw and heated parvalbumin and
the two isoallergens appeared to be patient specific. There may be up to four different
IgE binding epitope as seen for other fish parvalbumins [141] and patients may detect
any combination of these which may result in differential IgE binding as seen in this
study. This finding merits further exploration in a larger population of Barramundi
allergic patients to see whether any common pattern of IgE epitope binding emerges.
This study has identified two novel Barramundi parvalbumin isoallergens and has also
demonstrated the importance of heat labile and stabile epitopes in barramundi
parvalbumin and that the barramundi isoallergens have differential IgE reactivity. This
suggests that the current limitations in diagnosing allergy to a specific fish species in
Australia and the Pacific region (especially for patients presenting with a clinical history
of reactivity to an unidentified or seemingly distantly related fish species) might be
overcome through molecular characterisation of important Australian and Pacific fish
allergens and exploration of more specific epitope binding by screening overlapping
peptides.

104
CHAPTER5
Antibodyepitopemappingofallergenicbeta‐1parvalbumin
isoformfromBarramundi
Details of publication on which this
chapter is based
Nature and extent of the intellectual input of
each author, including the candidate
Sharp, M. F., Stephen J. N., Kamath, S.
D., Campbell D. E., Lopata, A. L., 2015.
IgE antibody epitope mapping of the
major food allergen parvalbumin.
Manuscript in preparation.
The authors Sharp and Lopata co-developed the
research question. Sharp collected the data and
performed the data analyses with assistance
from Stephen and Kamath. Serum samples were
collected by Campbell. Sharp wrote the first
draft of the paper, which was revised with
editorial input from Lopata. Sharp developed the
figures and tables.

CHAPTER 5
105
Ch
apter 5
5.1 Introduction
Consumption of barramundi in the Asia-Pacific region is growing due to increased
availability from aquaculture industries and its culinary popularity [164, 165].
Unfortunately barramundi can cause allergic reactions in fish allergy sufferers [133].
Chapter 4 demonstrated that 88% of fish allergic patients in our cohort reacted to at
least one of the major parvalbumins isoallergens[153]. Lat c 1.0101 appeared to have
the greatest IgE reactivity and will be further investigated in this chapter with its
antibody epitopes to be analysed.
Currently there have been five studies mapping the IgE antibody binding epitopes of
parvalbumin from fish. Parvalbumin from Baltic cod (Gad c 1), carp (Cyp c 1), chub
mackerel (Sco j 1), Atlantic salmon (Sal s 1) and Atlantic cod (Gad m 1) have been
analysed for their specific IgE epitopes. Allergic patient IgE was used in various
techniques including phage display library, overlapping synthetic peptides and tryptic
digests of parvalbumin to map out these epitopes [73, 75, 76, 89, 94]. These five
parvalbumins analysed display both linear and conformational epitopes, however do not
share identical residues. Most recently, Perez-Gordo et al [94] reported only one
unanimous IgE epitope for Gad m 1, however additional epitopes were identified, which
were patient specific.
Identifying IgE epitopes may help develop and predict successful specific
immunotherapies (sIT) for allergy sufferers [173, 174]. An increase in specific IgG4
antibodies can also be an indicator of successful sIT due to this antibody being able to
out-compete IgE binding for the allergen[134]. However, a comparative study of the
IgE and IgG4 epitopes of a fish allergen has never been performed.

CHAPTER 5
106
Ch
apter 5
5.1.1 Aims
In this chapter the IgE and IgG4 reactivity to the β1 parvalbumin isoform from
barramundi (Lat c 1.01) will be investigated and compared using recombinant Lat c
1.01 and seven overlapping synthetic peptides by immunoblotting and inhibition
ELISA.
CHAPTER 5
107
Ch
apter 5
5.2 Materials and methods
5.2.1 Patient sera
Subjects were selected on the basis on a convincing recent history of an IgE mediated
reaction (including urticaria, angioedema, stridor, cough, wheeze, hypotension and/ or
gastrointestinal symptoms of vomiting and/or diarrhoea) to any Australian- Asian
Pacific fish which occurred within 2 hours of ingestion and confirmation of fish
reactivity by prick-to-prick testing or specific IgE (ImmunoCAP, Thermo Fisher
Scientific, Sweden) to tuna (Thunnus albacares), salmon (Salmo salar), and cod (Gadus
morhua). Human ethics for this study was approved by the Sydney Children’s Hospital
Network ethics committee (HREC) (Table 5.1). Patients were selected based on positive
IgE [153] reactivity to barramundi parvalbumin (rLat c 1.0101) (see Chapter 4)
5.2.2 Recombinant parvalbumin
Recombinant barramundi β1 parvalbumin was generated as previously described in
detail in Chapter 4 [153]. In brief, his-tagged β1 parvalbumin gene was cloned into the
expression vector pPROEX HTb that was used to transform NM522 E. coli cells.
Transformed cells were grown at 37oC and expression was induced with IPTG.
Recombinant parvalbumin was purified from cell lysate by IMAC using HisTrap HP
column (GE lifesciences).
5.2.3 IgE and IgG4 immunoblot analysis
Immunoblots were analysed for IgE and IgG4 binding using sera from fish allergic
patients against recombinant Lat c 1.01 by separating the allergen on a 15%
polyacrylamide gel. Proteins were then transferred to a nitrocellulose membrane
(BioRad laboratories, Hercules, USA) using semidry electrophoresis and blocked in
TBS-T-0.3% Tween-20 for 2 h at room temperature. Sera were diluted 1:20 in 0.1%
CHAPTER 5
108
Ch
apter 5
BSA in TBS-T. Membranes were placed into the slot blot manifold and the diluted
serum aliquoted into the slots. Membranes were incubated with sera for 16 h at 4°C and
subsequently washed six-times with TBS-T at room temperature. The IgE immunoblots
were incubated with a horseradish peroxidase labeled goat anti-human IgE antibody
(Genetex, Irvine, USA) diluted 1:10,000 in 0.1% BSA in TBS-T for 1 h at room
temperature. The IgG4 immunoblots were incubated with monoclonal Anti-Human IgG4
MAB1313 (Merck, USA) diluted 1:2000 for 1 h at room temperature. The IgE
immunoblot was washed five-times with TBS-T at room temperature and IgE binding
visualized by performing ECL technique as described in Chapter 4.2.4. The IgG4
immunoblot was washed three-times with TBS-T and then incubated with anti-mouse
IgG HRP labelled antibody (Sigma, USA) diluted 1:20,000 for 1 h. Immunoblots were
washed five-times with TBS-T and IgG4 binding was visualized by again performing
ECL technique.
5.2.4 Peptide inhibition of IgE and IgG4
Seven overlapping peptides, each 25 amino acids in length, with 16 amino acid
overhang were synthesized and purified to 95% homogeneity by Mimotopes. Antibody
binding to the peptides was measured by inhibition ELISA. The wells of a 96-well
EIA/RIA plate (Costar, St. Louis, USA) were coated with 20 μL recombinant β1
barramundi parvalbumin (1μg/mL in sodium carbonate/bicarbonate buffer pH 9.6), and
incubated overnight at 4˚C. All of the following incubations were performed for 1 h
unless otherwise stated, plates washed three-times in TBS/0.05% Tween 20 (TBS-T)
between steps and five times for final wash and antibodies were diluted in TBS-T 0.1%
BSA. Blocking was performed using 5% skim milk diluted in TBS-T. Primary
antibodies were preabsorbed with inhibitors for 2 h at room temperature. Patient serum
was diluted 1:10 and the inhibitor concentrations were 12.5 µg/mL. This mixture was

CHAPTER 5
109
Ch
apter 5
then added to the wells (20 µL) and incubated at room temperature. Wells were washed
and then incubated with 40 µL of Anti-Human IgE HRP conjugate (diluted 1:10,000,
Genetex Inc., USA) for serum IgE or mAb Anti-Human IgG4 MAB1313 (Merck, USA);
diluted 1:2000 was added to each well and incubated at room temperature. The final
well wash was performed for serum IgE plates. Serum IgG4 plates were incubated with
anti-mouse IgG HRP conjugate (Sigma-Aldrich, USA) diluted 1:20,000 at room
temperature and then washed. Assays were colourimetrically developed with TMB
substrate (BD Biosciences, USA). The reaction was stopped using 1 M Hydrochloric
acid and the absorbance measured at 450 nm. The percent inhibition was calculated as
100 + [O.D. 450 nm of antibody with inhibitor/O.D. 450 nm of antibody without
inhibitor] + 100.
5.2.5 3D modeling of parvalbumin isoforms
The allergens Gad c 1.01, Cyp c 1.01, Sal s 1.01, Sco j 1.01, Gad m 1.01 and Lat c 1.01
were aligned to the carp parvalbumin template (PDB ID: 4cpv) using SWISS-MODEL
and protein structure modeled in UCSF Chimera version 1.7.
5.2.6 Data analysis
Cut-off values for the indirect IgE ELISA were determined using the mean of three non-
fish allergic patients, plus two times the standard deviation. Multiple T-tests were used
to compare overall serum IgE and IgG4 reactivity to each peptide between the negative
and fish allergic patients. Analyses were performed using GraphPad Prism version 5.04
for Windows (GraphPad, San Diego, CA).

CHAPTER 5
110
Ch
apter 5
Table 5.1 Clinical history and laboratory data of paediatric and adult patients analysed.
Subject number
Gender ImmunoCap (kU/L) Skin Prick Test Symptoms Contact Reactive history to fish
Cod (f3)
Tuna (f40)
Salmon (f41)
Cod Tuna Salmon
A1 M 3(6.45) 1(0.41) 1(0.43) 10mm 7mm 8mm R, OAS Oral Salmon trevally, blue grenadier,
A2 F 2(1.40) - 2(1.35) - - - A, GIS, U Oral, handling
Sea perch, fish
A3 F 2(0.91) 3(4.46) 3(5.75) - 6mm 10mm A, OAS Oral Fish, trout
A4 F 3(7.62) 3(5.67) 3(13.6) - - - A, R, OAS, AE, U
Oral Fish
A5 M 3(4.23) 3(7.75) 3(7.14) - - - A, R, AE, U Oral Fish
A6 M 2(2.74) 3 (3.78) - - - - R, OAS Oral Snapper, tuna
A7 F 2(3.36) 2(2.17) 2(3.20) - - - A, R, OAS, U Oral Fish
A8 F - - - - - - - - Fish
A9 F - 13.9 25.8 - - - A, AN, U, R, OAS
Oral Trout
C1 M - - - 6mm 3mm 4mm OAS, GI Oral White fish
C2 F - - - 5mm 6mm 3mm U Oral Salmon
C3 M - - - 5mm 3mm 4mm AN, OAS Oral Trout, tuna, whitefish
C4 M - - - 8mm 3mm 3mm AN Oral Basa
C5 M - - - 6mm 0mm 2mm AE, U Oral Smoked salmon, fish finger
C6 M - - - 0mm 4mm 0mm AE, U Oral Bream
C7 F - - - 11mm 5mm 6mm AN,R, U Oral Milk fish, tilapia
C8 F - - - 8.5mm 5.5mm 0mm AE, U - -
C9 F - - - 5mm 5mm 6mm R, OAS, AE Oral Red mowong, whiting
C10 M - - - 11.5mm 8mm 8mm AE, OAS, GIS Oral, inhalation
Salmon, silver Perch, flake
C11 F - - - 11mm 3.5mm 5mm U Oral Ling, whiting, Barramundi
C12 M - - - 8mm 4.5mm 3.5mm OAS Oral White fish
C13 F - - - 4mm 5mm 5mm U Oral Salmon
C14 F - - - 10mm 5.5mm 3mm AN Oral Basa
C15 M - - - 0mm 0mm 0mm AN, GIS, OAS
Oral Basa, white fish
N1 M 0(<0.01) - - - - - - - None
N2 M 0(<0.01) - - - - - - - None
N3 F 0(<0.01) - - - - - - - None
N4 F 0(<0.01) - - - - - - - None
N5 F 0(<0.01) - - - - - - - None
A, asthma; AN, anaphylaxis; AE, angiodema; E, eczema; GIS, gastrointesinal syndrome; OAS, oral allergysyndrome; R, rhitinitis; U, Urticaria. ’-‘=Not performed
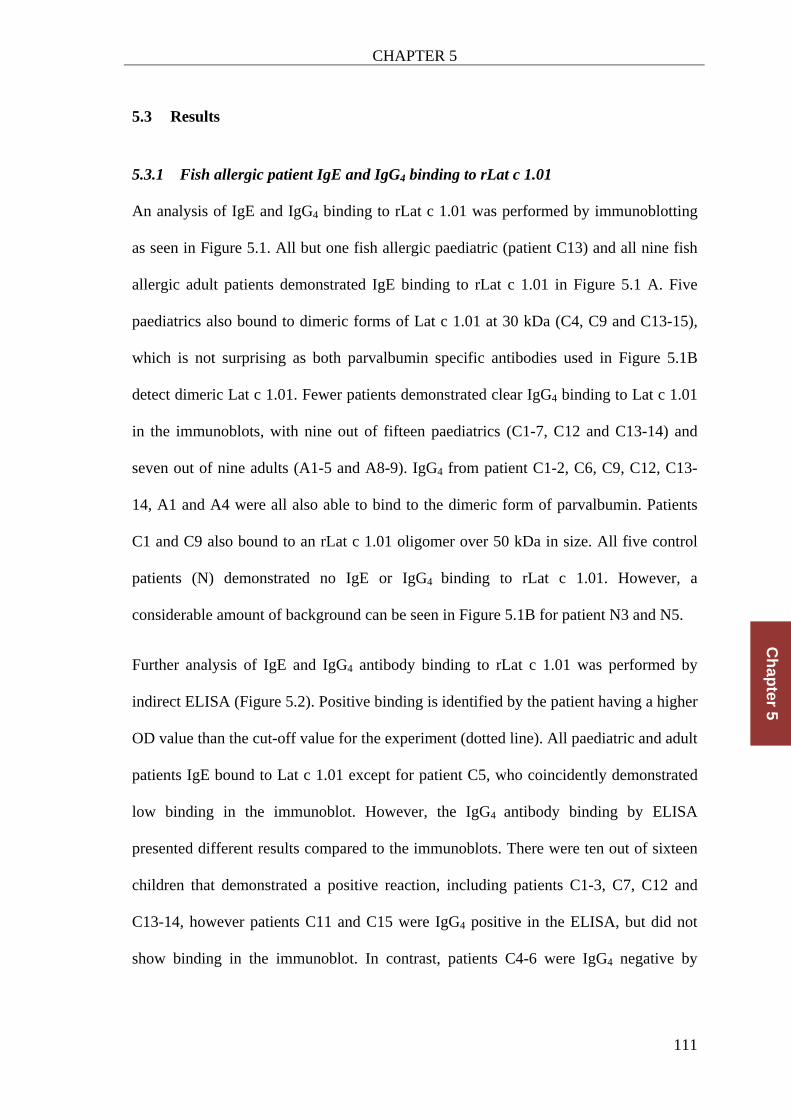
CHAPTER 5
111
Ch
apter 5
5.3 Results
5.3.1 Fish allergic patient IgE and IgG4 binding to rLat c 1.01
An analysis of IgE and IgG4 binding to rLat c 1.01 was performed by immunoblotting
as seen in Figure 5.1. All but one fish allergic paediatric (patient C13) and all nine fish
allergic adult patients demonstrated IgE binding to rLat c 1.01 in Figure 5.1 A. Five
paediatrics also bound to dimeric forms of Lat c 1.01 at 30 kDa (C4, C9 and C13-15),
which is not surprising as both parvalbumin specific antibodies used in Figure 5.1B
detect dimeric Lat c 1.01. Fewer patients demonstrated clear IgG4 binding to Lat c 1.01
in the immunoblots, with nine out of fifteen paediatrics (C1-7, C12 and C13-14) and
seven out of nine adults (A1-5 and A8-9). IgG4 from patient C1-2, C6, C9, C12, C13-
14, A1 and A4 were all also able to bind to the dimeric form of parvalbumin. Patients
C1 and C9 also bound to an rLat c 1.01 oligomer over 50 kDa in size. All five control
patients (N) demonstrated no IgE or IgG4 binding to rLat c 1.01. However, a
considerable amount of background can be seen in Figure 5.1B for patient N3 and N5.
Further analysis of IgE and IgG4 antibody binding to rLat c 1.01 was performed by
indirect ELISA (Figure 5.2). Positive binding is identified by the patient having a higher
OD value than the cut-off value for the experiment (dotted line). All paediatric and adult
patients IgE bound to Lat c 1.01 except for patient C5, who coincidently demonstrated
low binding in the immunoblot. However, the IgG4 antibody binding by ELISA
presented different results compared to the immunoblots. There were ten out of sixteen
children that demonstrated a positive reaction, including patients C1-3, C7, C12 and
C13-14, however patients C11 and C15 were IgG4 positive in the ELISA, but did not
show binding in the immunoblot. In contrast, patients C4-6 were IgG4 negative by

CHAPTER 5
112
Ch
apter 5
ELISA, but did bind in the blots. Lat c 1.01 positive adult IgG4 in the ELISA
experiment was only seen in patients A1, A4, A6 and A9.
Uniformly, patients C8-10 and A7 did not show IgG4 binding in either of the
experiments. Fewer patients IgG4 bound to rLat c 1.01 in the ELISA, with 13 out of 24
compared to 17 out of 24 in the immunoblot. This may be due to the high cut-off value
set in the ELISA due to high background readings of the negative control patients. A
comparison of IgE and IgG4 binding between the paediatric and adult cohort can be seen
in Figure 5.2B. Mean IgE binding for both paediatric and adult cohorts was significantly
higher than IgG4.
Figure 5.1 A) IgE and IgG4 immunoblots against barramundi recombinant β1
parvalbumin with the sixteen paediatric (C) and nine adult (A) fish allergic patients.
Five non-fish allergic patients were used as negative controls (N). B) Analysis of
recombinant β1 parvalbumin with coomassie stained SDS gel, immunoblots with
PARV-19 mAb and anti-barramundi parvalbumin polyclonal antibody. Parvalbumin
monomers, dimers and tetramers are boxed in red, green and blue, respectively.

CHAPTER 5
113
Ch
apter 5
Figure 5.2 ELISA for serum IgE (black) and IgG4 (grey) reactivity to purified
recombinant Lat c 1.01 for fish-allergic patient sera from fifteen children (C1-15) and
nine adults (A1-9) labeled ‘C’ and ‘A’ respectively. The cut-off derived from two
standard deviations above the mean reactivity of five non-allergic subjects to each of the
extracts is indicated by the dotted line (IgE=0.03, IgG4=0.20). n=1. B) Mean fold
increase values for all adult and children IgE and IgG4 against rLat c 1.01 from the
A
BC1 C2 C3 C4 C5 C6 C7 C8 C9
C10C11C12C13C14C15 A1 A2 A3 A4 A5 A6 A7 A8 A90.0
0.2
0.4
0.6
0.8
1.0
Subjects
Ab
sorb
ance
at
450n
mIgE
IgG4
Childre
n
Adults0
2
4
6
8
10
Fo
ld in
crea
se
IgE
IgG4
* ***
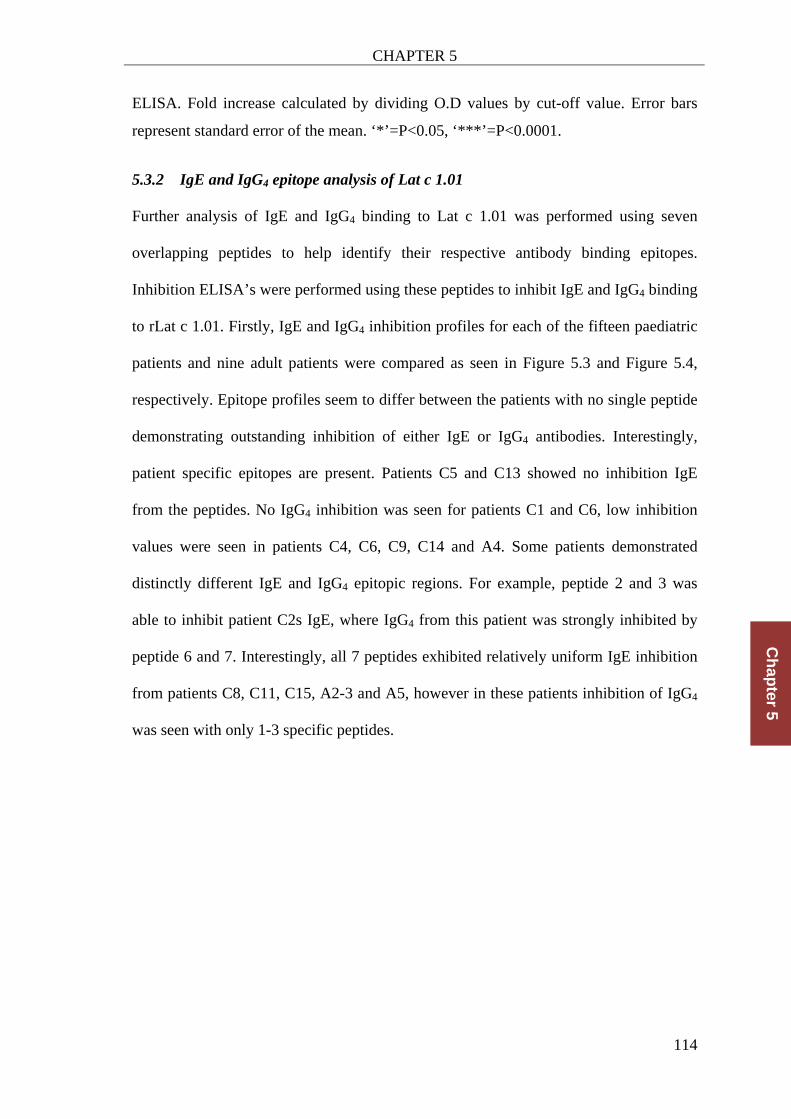
CHAPTER 5
114
Ch
apter 5
ELISA. Fold increase calculated by dividing O.D values by cut-off value. Error bars
represent standard error of the mean. ‘*’=P<0.05, ‘***’=P<0.0001.
5.3.2 IgE and IgG4 epitope analysis of Lat c 1.01
Further analysis of IgE and IgG4 binding to Lat c 1.01 was performed using seven
overlapping peptides to help identify their respective antibody binding epitopes.
Inhibition ELISA’s were performed using these peptides to inhibit IgE and IgG4 binding
to rLat c 1.01. Firstly, IgE and IgG4 inhibition profiles for each of the fifteen paediatric
patients and nine adult patients were compared as seen in Figure 5.3 and Figure 5.4,
respectively. Epitope profiles seem to differ between the patients with no single peptide
demonstrating outstanding inhibition of either IgE or IgG4 antibodies. Interestingly,
patient specific epitopes are present. Patients C5 and C13 showed no inhibition IgE
from the peptides. No IgG4 inhibition was seen for patients C1 and C6, low inhibition
values were seen in patients C4, C6, C9, C14 and A4. Some patients demonstrated
distinctly different IgE and IgG4 epitopic regions. For example, peptide 2 and 3 was
able to inhibit patient C2s IgE, where IgG4 from this patient was strongly inhibited by
peptide 6 and 7. Interestingly, all 7 peptides exhibited relatively uniform IgE inhibition
from patients C8, C11, C15, A2-3 and A5, however in these patients inhibition of IgG4
was seen with only 1-3 specific peptides.

CHAPTER 5
115
Ch
apter 5
Figure 5.3 ELISA inhibition with the synthetic peptides and individual paediatric
patient serum IgE (black) and IgG4 (grey) labeled C1-C15. Y-axis represents inhibition
of serum IgE and IgG4 binding to 20 ng of rβ1 parvalbumin with 250 ng of the seven
generated peptides (x-axis).
1 2 3 4 5 6 70
50
100
C1
Peptide
% In
hib
itio
n
IgEIgG4
1 2 3 4 5 6 70
50
100
C2
Peptide
% In
hib
itio
n
IgEIgG4
1 2 3 4 5 6 70
50
100
C3
Peptide
% In
hib
itio
n
IgEIgG4
1 2 3 4 5 6 70
50
100
C4
Peptide
% In
hib
itio
n
IgEIgG4
1 2 3 4 5 6 70
50
100
C5
Peptide
% In
hib
itio
n
IgEIgG4
1 2 3 4 5 6 70
50
100
C6
Peptide
% In
hib
itio
n
IgEIgG4
1 2 3 4 5 6 70
50
100
C7
Peptide
% In
hib
itio
n
IgEIgG4
1 2 3 4 5 6 70
50
100
C8
Peptide
% In
hib
itio
nIgEIgG4
1 2 3 4 5 6 70
50
100
C9
Peptide
% In
hib
itio
n
IgEIgG4
1 2 3 4 5 6 70
50
100
C10
Peptide
% In
hib
itio
n
IgEIgG4
1 2 3 4 5 6 70
50
100
C11
Peptide
% In
hib
itio
n
IgEIgG4
1 2 3 4 5 6 70
50
100
C12
Peptide%
Inh
ibit
ion
IgEIgG4
1 2 3 4 5 6 70
50
100
C13
Peptide
% In
hibi
tion
IgEIgG4
1 2 3 4 5 6 70
50
100
C14
Peptide
% In
hibi
tion
IgEIgG4
1 2 3 4 5 6 70
50
100
C15
Peptide
% In
hib
itio
n
IgEIgG4

CHAPTER 5
116
Ch
apter 5
Figure 5.4 ELISA inhibition with synthetic peptides and individual adult patient serum
IgE (black) and IgG4 (grey) labeled A1-A9. Y-axis represents inhibition of serum IgE
and IgG4 binding to 20 ng of rβ1 parvalbumin with 250 ng of the seven generated
peptides (x-axis).
Overall analysis of these peptides inhibiting patient IgE can be seen in Figure 5.5A.
Three peptides demonstrated inhibition of IgE binding significantly higher than the
negative controls, which were; peptide 1, 2 and 3 with respective mean inhibitions of
31.7%, 45.0% and 34.1%, and p values of 0.006, 0.030 and 0.008. Peptides 4 and 5 had
the two highest inhibition percentages with 46.93% and 46.94%, respectively; however
these values were not significantly higher than the negatives controls. Furthermore, no
peptide significantly inhibits IgE more than another of the peptides used. Figure 5.5B
presents the peptide-IgE inhibition data with the adults and children separated in blue
1 2 3 4 5 6 70
50
100
A1
Peptide
% In
hib
itio
n
IgEIgG4
1 2 3 4 5 6 70
50
100
A2
Peptide
% In
hib
itio
n
IgEIgG4
1 2 3 4 5 6 70
50
100
A3
Peptide
% In
hib
itio
n
IgEIgG4
1 2 3 4 5 6 70
50
100
A4
Peptide
% In
hib
itio
n
IgEIgG4
1 2 3 4 5 6 70
50
100
A5
Peptide
% In
hib
itio
n
IgEIgG4
1 2 3 4 5 6 70
50
100
A6
Peptide
% In
hib
itio
n
IgEIgG4
1 2 3 4 5 6 70
50
100
A7
Peptide
% In
hib
itio
n
IgEIgG4
1 2 3 4 5 6 70
50
100
A8
Peptide
% In
hib
itio
n
IgEIgG4
1 2 3 4 5 6 70
50
100
A9
Peptide%
Inh
ibit
ion
IgEIgG4
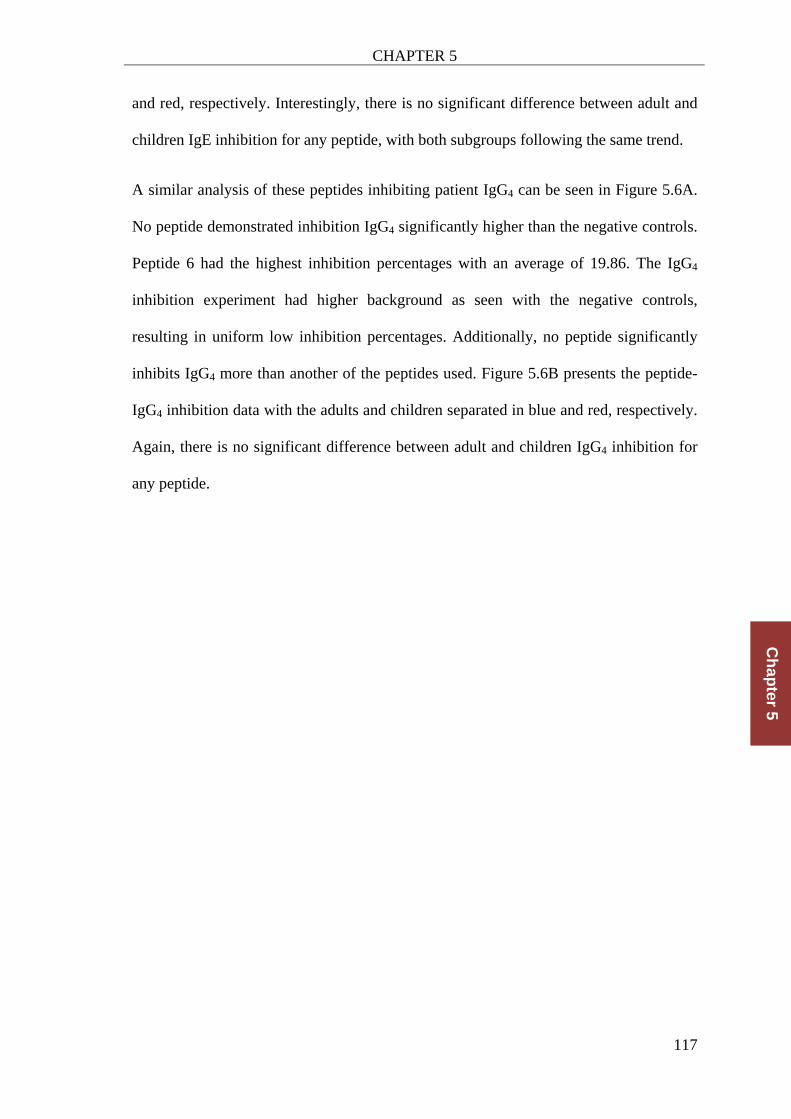
CHAPTER 5
117
Ch
apter 5
and red, respectively. Interestingly, there is no significant difference between adult and
children IgE inhibition for any peptide, with both subgroups following the same trend.
A similar analysis of these peptides inhibiting patient IgG4 can be seen in Figure 5.6A.
No peptide demonstrated inhibition IgG4 significantly higher than the negative controls.
Peptide 6 had the highest inhibition percentages with an average of 19.86. The IgG4
inhibition experiment had higher background as seen with the negative controls,
resulting in uniform low inhibition percentages. Additionally, no peptide significantly
inhibits IgG4 more than another of the peptides used. Figure 5.6B presents the peptide-
IgG4 inhibition data with the adults and children separated in blue and red, respectively.
Again, there is no significant difference between adult and children IgG4 inhibition for
any peptide.

CHAPTER 5
118
Ch
apter 5
Figure 5.5 A) IgE Inhibition ELISA using all 24 patients (purple) and 5 negative
patients (black). B) IgE Inhibition ELISA data has been separated with 15 paediatric
patients (red), the nine adult patients (blue) and negative patients in black. Y-axis
represents inhibition of serum IgE (diluted 1:10) binding to 20 ng recombinant rβ1
parvalbumin with 250 ng of the 7 generated peptides (x-axis). Error bars represent
standard error of the mean. * = P < .05, ** = P < .001.
1 2 3 4 5 6 70
50
100
Peptide
% In
hib
itio
n
Children IgE inhibitionAdult IgE inhibitionNegative
1 2 3 4 5 6 70
50
100
Peptide
% In
hib
itio
nInhibtion of IgENegative
A
B
** * *

CHAPTER 5
119
Ch
apter 5
Figure 5.6 A) IgG4 Inhibition ELISA using all 24 patients (purple) and five negative
patients (black). B) IgG4 Inhibition ELISA data has been separated with 15 paediatric
patients (red), the nine adult patients (blue) and negative patients in black. Y-axis
represents inhibition of serum IgG4 (diluted 1:10) binding to 20 ng recombinant rβ1
parvalbumin with 250 ng of the seven generated peptides (x-axis). Error bars represent
standard error of the mean.
To evaluate the proximity of potential IgE epitopes on Lat c 1.01, a multiple alignment
of the amino acid sequences of parvalbumins with known IgE epitopes and Lat c 1.01
A
B
1 2 3 4 5 6 70
50
100
% In
hib
itio
n
Children IgG4 inhibitionAdults IgG4 inhibitionNegative
Peptide
1 2 3 4 5 6 70
50
100
Peptide
% In
hib
itio
nInhibition of IgG4Negative

CHAPTER 5
120
Ch
apter 5
was performed, as well as 3D models generated for each protein (Figure 5.7). Peptides
1, 2 and 7 demonstrated significantly higher IgE inhibition than the negative serum and
these epitope regions are underlined in Figure 5.7A and shaded in Figure 5.7B in navy
blue. The dark shading represents the region where IgE most likely binds. The rationale
behind the gradient shading is that peptide 1 and 2 share nine amino acids
(AACQAADSF) and as these two peptides were able to inhibit IgE, it is more likely
that an epitope is in this nine amino acid region. Peptides 6 and 7 share 21 amino acids,
however peptide 7 was the only one which significantly inhibited IgE, leaving four
amino acids at the c-terminal which it not shared with peptide 6, suggesting an IgE
epitope at the c-terminal of the allergen. IgG4 epitopes were unable to be modelled due
to the peptides demonstrating no significant inhibition in these experiments.

CHAPTER 5
121
Ch
apter 5
Figure 5.7 A) Multiple alignment of the five known parvalbumin sequences that have
IgE epitopes elucidated. IgE epitopes are shaded in colour as follows; Baltic cod (Gad c
1.01) light blue, common carp (Cyp c 1.01) yellow, Atlantic salmon (Sal s 1.01) red,
chub mackerel (Sco j 1.01) green and Atlantic cod (Gad m 1.01) pink. Additionally the
β1 barramundi parvalbumin (Lat c 1.01) sequence is present with suspected IgE epitope
regions underlined in a navy blue gradient. Sequences of the overlapping peptides used
in this study are aligned under the multiple alignment. The two calcium binding sites are
boxed in orange. B) Protein models of the five parvalbumin allergens with their IgE
epitopes highlighted in their respective colours, as well as the barramundi allergen
analysed in this study.

CHAPTER 5
122
Ch
apter 5
5.4 Discussion
Understanding IgE epitopes is crucial for the development of future immunotherapies,
simultaneously, IgG4 antibodies play a key role in successful immunotherapy, however
this role is yet to be defined. Lat c 1.01 is a major allergen from the fish barramundi
[153], as it was characterised in the previous chapter. In this chapter binding
characteristics of IgE and IgG4 from fifteen paediatric and nine adult fish allergic
patients to Lat c 1.01 was analysed.
It is known that IgG4 producing B-cells can switch to an IgE B-cell, however not the
other way around as a consequence of the sequence order of the antibody isotypes are
situated on their chromosome [134, 136]. So it could be expected that allergen specific
IgG4 be present if there is IgE to the allergen, for example, the IgE negative controls
sera were also IgG4 negative. However immunoblot experiments in this chapter
demonstrated that all but one of the fish allergic patients had IgE binding to rLat c 1.01,
but only 17 out of 24 had specific IgG4 to the allergen, implying this isotype switch may
be the other way around. In some patients this may be explainable from their epitope
binding profiles. For example, patients C8, C10 and A6-seven demonstrated similar
epitope profiles, most with higher inhibition of IgE than IgG4 suggesting that the serum
IgE is out-competing the IgG4 in the immunoblot as they share the same epitopes.
Purification of both IgE and IgG4 from the sera would help to confirm this hypothesis.
Fewer patients demonstrated IgG4 binding in the ELISA which suggests IgG4 may
recognize sequential epitopes that are hidden in the tertiary structure of rLat c 1.01 as
the ELISA as performed under native conditions. The negative controls in the IgG4
immunoassays presented a considerable amount of background, which may have
resulted in false negatives in the ELISA. Fewer patients presented IgG4 binding to rLat
c 1.01 than IgE, demonstrating a dissociation between IgG4 and IgE in fish allergic
CHAPTER 5
123
Ch
apter 5
patients as reported previously [72]. Despite IgG4 being associated with allergic disease,
these experiments further support that specific IgE is the antibody that directly
correlates with allergic symptoms [134, 136].
Fish allergic patients in this study presented individual IgE and IgG4 epitope profiles
that differed between each patient. Specific IgE and IgG4 epitope profiles could be used
to predict the outcomes of specific immunotherapies. A study of milk allergy
demonstrated that patients who share IgE and IgG4 epitopes were more likely to
positively respond to their specific immunotherapy using whole allergens due to the
increase of serum IgG4 which acts as a competitive blocking antibody [173]. For
example, patients C3, C10, A6, A7 and A9 could successfully respond to this treatment
using this hypothesis, however this has not been clinically proven for fish allergy.
Patients who had different IgE and IgG4 epitopes may respond to a specific
immunotherapy that has been previously demonstrated to lower IgE reactivity to carp
allergen. This involves mutating the calcium binding sites of parvalbumin, which in turn
generated a hypoallergenic recombinant carp allergen that could lower the chance of
carp allergic patient having an anaphylaxis after ingesting this fish. [72, 131]. The
ability of recombinant carp allergen not to cause an allergic Th2 response via challenge
has also been demonstrated in mice [15].
IgE and IgG4 epitopes of Lat c 1.01 were analysed. Specific IgG4 allergen epitopes
could not be mapped and speculative IgE epitopes were identified in peptide 1, 2 and 7.
An IgE epitope may be shared by peptide 1 and 2 as they overlap, and the epitope in
peptide 7 must lay at the c-terminal as the first 21 amino acids of this peptide
overlapped with peptide 6. A sole IgE epitope at the C-terminal was also identified in
Gad m 1 in a study which concluded that most IgE epitopes are patient specific [94],
which in large has also been presented in this chapter. The IgE epitopes present in
CHAPTER 5
124
Ch
apter 5
peptides 1 and 2 cover two previously identified epitopes regions of importance. The
first is peptide 1 (N-terminal) which is situated in the least conserved region of fish
parvalbumin [141]. The only epitope previously mapped in this region is in Sal s 1 from
Atlantic salmon, which is possibly responsible for salmon specific fish allergy [76, 91,
175]. Patients who specifically identify this N-terminal epitope may have low cross-
reactivity to other fish due to the low amino acid homology in this region. However in
this study, no patient binds solely to this peptide. Peptide 2 aligns with a region that
seems to contain the most epitopes mapped from fish, including Baltic cod, Atlantic
salmon, chub mackerel and carp [141]. This is a highly cross-reactive region of
parvalbumin and patients who recognise peptide 2 would most likely react to many
other fish allergens. It is not surprising that this cross-reactive epitope has been
identified in Lat c 1.01 as barramundi parvalbumin has previously been characterised as
a highly cross-reactive antigen [175] (Chapter 3CHAPTER 3).
5.4.1 Conclusions and future directions
In this chapter IgE and IgG4 reactivity to Lat c 1.01 was analysed, demonstrating that
both of these antibodies isotypes from fish allergic patients detect barramundi allergen.
IgE and IgG4 epitopes of Lat c 1.01 are most likely patient specific. However two
regions at the each of the protein terminals contain general IgE epitopes. Further
analysis using more overlapping peptides and peptide alanine screening will increase
the resolution of the mapped Lat c 1.01 IgE epitopes. Patient epitope specificity has
demonstrated the importance of specific fish allergy diagnostics and immunotherapies,
where once a patient is diagnosed with fish allergy, further diagnosis may be needed to
identify which specific fish the patient is allergic to and the possible specific
immunotherapies that could be tailored for the fish allergy sufferer. Further studies on

CHAPTER 5
125
Ch
apter 5
fish allergen epitopes and cross-reactivity are needed to advance diagnostics and
immunotherapies for fish allergy.
126
CHAPTER6
Generaldiscussion
Fish plays an important role in human nutrition and health, but can provoke serious IgE-
antibody mediated adverse reactions in susceptible individuals. A marked increase in
allergic diseases is occurring in most major industrialized countries. The fish allergy
and anaphylaxis epidemic is particularly serious and is typically life-long, affecting up
to 0.2% of all children and 0.5% of all adults [7]. Prevalence rates specifically to fish
vary considerably between regions and among children and adults. Areas with high fish
consumption, such as South East Asia and Scandinavia, have a high prevalence of fish
allergy and up to 3% of children could be allergic to fish [141]. Greater than 65% of fish
allergic infants will continue to be allergic throughout their life [16], and as more
children becoming sensitized throughout childhood, most current prevalence studies
report more adults with fish allergy than children [7, 92]. Unlike many food allergies,
including peanut and egg where a patient is allergic to allergens from a specific species,
fish allergy can be caused by any fish allergen across any of the diverse 32,400 species
of fish. The major fish allergen is the muscle protein parvalbumin [82, 84], which is the
focus point of this thesis. This protein was analysed and characterised to be applied to
three key aspects of fish allergy; (1) detection of fish parvalbumin, (2) diagnosis of fish
allergy involving parvalbumin and (3) help to advance immunotherapies for fish allergy
sufferers.

CHAPTER 6
127
Ch
apter 6
The detection of this allergenic protein parvalbumin is often difficult due to its
structural diversity among various fish species [141]. Fish can express multiple
parvalbumin isoforms, which can differ greatly in primary structure. For example;
Atlantic salmon and barramundi express two parvalbumin isoforms. The Atlantic
salmon isoforms share only 64% of their primary structure and the barramundi isoforms
share only 67% [77, 167]. However their biophysical properties differ little as all
parvalbumins are small, soluble, acidic proteins, which can bind calcium ions.
Nevertheless, this disparity in primary structure of parvalbumin has led to no
commercial fish allergen detection tools currently available, such as fish parvalbumin
specific antibodies.
Presently, the most commonly available anti-parvalbumin antibody is a monoclonal
anti-frog parvalbumin antibody (PARV-19). This antibody has been extensively
analysed for its cross-reactivity to different fish parvalbumins throughout Europe and
North America [100, 112, 176]. However this antibody had not been analysed for fish
from the Asia-Pacific region. In fact, no fish parvalbumin cross-reactivity studies were
ever performed on Asian-Pacific fish. In Chapter 2, the cross-reactivity of parvalbumins
from Asian-Pacific bony and cartilaginous fish was analysed. The monoclonal antibody,
PARV-19, was evaluated as a detection tool and used it the cross-reactivity analysis.
This chapter demonstrated the presence of monomeric and oligomeric parvalbumin in
all fish analysed, except gummy shark, a cartilaginous fish. Heat processing of this
allergen affected its antibody reactivity, despite parvalbumin, like many food allergens,
being characterised as a heat stable allergen [143, 177]. Although, the differences in
antibody reactivity to heated fish extracts were seen in a reduction in reactivity to
multimeric forms of parvalbumins for most bony fish, a complete loss of reactivity was
only observed for cartilaginous fish.
CHAPTER 6
128
Ch
apter 6
The cross reactivity inhibition ELISA profiles from Chapter 2, showed that three of the
perciformes uniformly inhibited antibody binding to carp parvalbumin, suggesting
parvalbumin cross-reactivity has a molecular and phylogenetic relationship. This
prompted a phylogenetic analysis of fish parvalbumins that further demonstrated that
parvalbumin cross-reactivity among fish species is due to a molecular phylogenetic
association. This was an important finding for the generation of fish specific cross-
reactive antibodies that could be used for the detection of fish allergens. Candidate
antigens for new cross-reactive antibodies were selected using a more comprehensive
parvalbumin phylogenetic tree. A recent clinical study demonstrated that fish allergy is
quite specific, where most patients have IgE antibody against a small variety of fish
[178]. So, to generate a more comprehensive antibody detection tool, multiple antigens
were selected for the generation of polyclonal rabbit IgG antibodies. Previous attempts
to generate highly cross-reactive anti-parvalbumin antibodies involved using an antigen
from one single fish species, for example Atlantic cod or carp [157, 176]. In this study,
the antibodies were raised against parvalbumins from frequently consumed barramundi
(Lates calcarifer), basa (Pangasius bocourti), pilchard (Sardinops sagax) and Atlantic
salmon (Salmo salar). These were evaluated for cross-reactivity against a panel of 45
fish extracts (raw, heated and canned fish). Anti-barramundi parvalbumin proved to be
the most cross-reactive antibody, detecting 87.5% of the 40 species analysed, followed
by anti-pilchard and anti-basa antibody. In contrast the anti-salmon antibody was very
specific and only reacted to salmonidae and a few other species. The low cross-
reactivity of the anti-salmon antibody correlates with clinical studies which showed
monosensitivity to Salmonids [90, 91, 160]. An IgE epitope analysis of salmon
parvalbumin highlighted a specific epitope at the N-terminal of this protein. This region
is the least conserved primary structure in fish parvalbumin and may be the cause of the

CHAPTER 6
129
Ch
apter 6
clinical monsensitivity to salmonids and the specificity of the anti-salmon antibody
generated in Chapter 2 [76, 141, 160]. Collectively, the antibodies generated were able
to detect parvalbumin in raw extracts of all the analysed fish species, except mahi mahi,
swordfish, yellowfin tuna and all 5 canned fish. Mahi mahi, swordfish and yellowfin
tuna are all large fish that contain dark slow twitching muscle that has been shown to
express lower levels of parvalbumin [105, 108]. The canned fish appeared to have no
intact proteins which would result in the lack of antibody reactivity. The parvalbumin
tertiary structure has been known to change under food processing techniques [161,
162]. Canned fish and the large fish may be seen less allergenic to patients with
parvalbumin mediated fish allergy, however fish specific diagnostics would need to be
developed to prove that a patients are not allergic to these specific fish sources.
Antibody reactivity to many fish was heat liable or susceptible to denaturation,
demonstrating that some parvalbumins have most likely conformational epitopes, which
lose antibody reactivity after heat treatment. Heat treatment of barramundi extracts seen
in Chapter 4 exhibited varying allergenicity, where some patients had an increased IgE
reaction and some had a decreased reaction. The importance of heat treated fish in
relation to parvalbumin mediated fish allergy appears to be patient specific.
The cross-reactivity studies from Chapter 2 and 3 demonstrated parvalbumin from
barramundi to be highly cross-reactive, however at that point in time little was known
about the allergenicity of this parvalbumin, with only one fish allergy study involving
this commonly eaten fish [133]. Fourteen of the 17 patients analysed in Chapter 4
reacted to both parvalbumin isoforms. Patients had been previously diagnosed against
tuna, salmon or cod, further demonstrating how cross-reactive these barramundi
allergens are. Subsequently the two novel parvalbumins were submitted as official
allergens and designated Lat c 1.0101 and Lat c 1.0201 by the International Union of

CHAPTER 6
130
Ch
apter 6
Immunological Societies. These two isoallergens demonstrated different IgE reactivity,
with IgE binding stronger to Lat c 1.01, however every patient who had IgE bind to Lat
c 1.01 was also positive to Lat c 1.02.
The barramundi allergen Lat c 1.01 was further characterised by the evaluation of its
IgE and IgG4 binding abilities and the mapping of their respective antibody epitopes.
The analysis showed that specific IgG4 to Lat c 1.01 is only present when there is
specific IgE to the allergen, despite being known that IgG4 is expressed before IgE, due
their respective chromosomal positions [134, 136]. This further reiterates that it is the
specific IgE antibody that directly correlates with clinical symptoms, despite the known
interaction of IgG4 in allergy. The epitope analysis also demonstrated that IgE and IgG4
epitopes are patient specific. IgE and IgG4 shared epitopes were also patient specific;
this could change the response to a specific immunotherapy. An in depth molecular
diagnosis of fish allergy may be the future precursor to specific immunotherapies,
where IgE and IgG4 epitope profiles could help tailor a patient specific therapy. A
patient who shares these epitopes would more likely respond to allergen
immunotherapy, which has been previously demonstrated for milk [173]. A patient who
has different IgE and IgG4 epitopes may respond to a modified allergen immunotherapy
[72, 131, 179].
Throughout Chapter 4 and 5, fish allergic patient cohorts were separated into children
and adults. Consistently there were no significant differences in IgE binding between
the two groups. The lack of difference in IgE binding between children and adults may
be due to the fact that fish allergy, similar to shellfish and peanut allergy, is rarely
outgrown and continues into adulthood [7, 92].

CHAPTER 6
131
Ch
apter 6
The data presented in this thesis have demonstrated how allergenic fish parvalbumin has
very specific cross-reactive IgE binding profiles. In addition, fish can express multiple
parvalbumin isoforms that can differ greatly, which further complicates the
development of accurate detection and diagnostic methods. However, implications of
the allergen cross-reactive species-specific reactivity and the importance of molecular
characterisation of fish allergens outlined in this thesis are vital for the next generation
of fish allergen detection tools, diagnostics tools and specific fish allergen
immunotherapeutics.

132
REFERENCES
1. Niggemann, B., and Beyer, K. (2007). Diagnosis of Food Allergy in Children: Toward a Standardization of Food Challenge. J. Pediatr. Gastroenterol. Nutr. 45, 399-404 310.1097/MPG.1090b1013e318054b318050c318053.
2. Mehl, A., Rolinck-Werninghaus, C., Staden, U., Verstege, A., Wahn, U., Beyer, K., and Niggemann, B. (2006). The atopy patch test in the diagnostic workup of suspected food-related symptoms in children. J. Allergy Clin. Immunol. 118, 923-929.
3. Ng, I.E., Turner, P.J., Kemp, A.S., and Campbell, D.E. (2011). Parental perceptions and dietary adherence in children with seafood allergy. Pediatr. Allergy Immunol. 22, 720-728.
4. Eggesbø, M., Halvorsen, R., Tambs, K., and Botten, G. (1999). Prevalence of parentally perceived adverse reactions to food in young children. Pediatr. Allergy Immunol. 10, 122-132.
5. Kajosaari, M. (1982). Food allergy in Finnish children aged 1 to 6 years. Acta Paediatr. Scand. 71, 815-819.
6. Crespo, J.F., Pascual, C., Dominguez, C., Ojeda, I., Munoz, F.M., and Esteban, M.M. (1995). Allergic reactions associated with airborne fish particles in IgE-mediated fish hypersensitive patients. Allergy 50, 257-261.
7. Sicherer, S.H., Muñoz-Furlong, A., and Sampson, H.A. (2004). Prevalence of seafood allergy in the United States determined by a random telephone survey. J. Allergy Clin. Immunol. 114, 159-165.
8. Turner, P., Ng, I., Kemp, A.S., and Campbell, D.E. (2011). Seafood Allergy in Children. Clinical and Translational Allergy 1 36.
9. Chiang, W.C., Kidon, M.I., Liew, W.K., Goh, A., Tang, J.P.L., and Chay, O.M. (2007). The changing face of food hypersensitivity in an Asian community. Clin. Exp. Allergy 37, 1055-1061.
10. Connett, G.J., Gerez, I., Cabrera-Morales, E.A., Yuenyongviwat, A., Ngamphaiboon, J., Chatchatee, P., Sangsupawanich, P., Soh, S.E., Yap, G.C., Shek, L.P.C., et al. (2012). A Population-Based Study of Fish Allergy in the Philippines, Singapore and Thailand. Int. Arch. Allergy Appl. Immunol. 159, 384-390.
11. Beale, J.E., Jeebhay, M.F., and Lopata, A.L. (2009). Characterisation of purified parvalbumin from five fish species and nucleotide sequencing of this major allergen from Pacific pilchard, Sardinops sagax. Mol. Immunol. 46, 2985-2993.
12. Lopata, A.L., and Lehrer, S.B. (2009). New insights into seafood allergy. Curr. Opin. Allergy Clin. Immunol. 9, 270-277
13. Van Do, T., Elsayed, S., Florvaag, E., Hordvik, I., and Endresen, C. (2005). Allergy to fish parvalbumins: Studies on the cross-reactivity of allergens from 9 commonly consumed fish. J. Allergy Clin. Immunol. 116, 1314-1320.
14. Mondoulet, L., Paty, E., Drumare, M.F., Ah-Leung, S., Scheinmann, P., Willemot, R.M., Wal, J.M., and Bernard, H. (2005). Influence of Thermal

REFERENCES
133
Referen
ces
Processing on the Allergenicity of Peanut Proteins. J. Agric. Food Chem. 53, 4547-4553.
15. van der Ventel, M.L., Nieuwenhuizen, N.E., Kirstein, F., Hikuam, C., Jeebhay, M.F., Swoboda, I., Brombacher, F., and Lopata, A.L. (2011). Differential responses to natural and recombinant allergens in a murine model of fish allergy. Mol. Immunol. 48, 637-646.
16. Priftis, K.N., Mermiri, D., Papadopoulou, A., Papadopoulos, M., Fretzayas, A., and Lagona, E. (2008). Asthma symptoms and bronchial reactivity in school children sensitized to food allergens in infancy. J. Asthma 45, 590-595.
17. Thong, B.Y., Cheng, Y.K., Leong, K.P., Tang, C.Y., and Chng, H.H. (2005). Anaphylaxis in adults referred to a clinical immunology/allergy centre in Singapore. Singapore Med. J. 46, 529-534.
18. Thong, B.Y., Cheng, Y.K., Leong, K.P., Tang, C.Y., and Chng, H.H. (2007). Immediate food hypersensitivity among adults attending a clinical immunology/allergy centre in Singapore. Singapore Med. J. 48, 236-240.
19. Hajeb, P., and Selamat, J. (2012). A Contemporary Review of Seafood Allergy. Clin. Rev. Allergy Immunol. 42, 365-385.
20. Leung, T.F., Yung, E., Wong, Y.S., Lam, C.W.K., and Wong, G.W.K. (2009). Parent-reported adverse food reactions in Hong Kong Chinese pre-schoolers: epidemiology, clinical spectrum and risk factors. Pediatr. Allergy Immunol. 20, 339-346.
21. Chen, J., Hu, Y., Allen, K.J., Ho, M.H.K., and Li, H. (2011). The prevalence of food allergy in infants in Chongqing, China. Pediatr. Allergy Immunol. 22, 356-360.
22. Osterballe, M., Hansen, T.K., Mortz, C.G., Høst, A., and Bindslev-Jensen, C. (2005). The prevalence of food hypersensitivity in an unselected population of children and adults. Pediatr. Allergy Immunol. 16, 567-573.
23. Ben-Shoshan, M., Harrington, D.W., Soller, L., Fragapane, J., Joseph, L., St Pierre, Y., Godefroy, S.B., Elliott, S.J., and Clarke, A.E. (2010). A population-based study on peanut, tree nut, fish, shellfish, and sesame allergy prevalence in Canada. J. Allergy Clin. Immunol. 125, 1327-1335.
24. Rancé, F., Grandmottet, X., and Grandjean, H. (2005). Prevalence and main characteristics of schoolchildren diagnosed withfood allergies in France. Clin. Exp. Allergy 35, 167-172.
25. Kull, I., Bergström, A., Lilja, G., Pershagen, G., and Wickman, M. (2006). Fish consumption during the first year of life and development of allergic diseases during childhood. Allergy 61, 1009-1015.
26. Orhan, F., Karakas, T., Cakir, M., Aksoy, A., Baki, A., and Gedik, Y. (2009). Prevalence of immunoglobulin E-mediated food allergy in 6–9-year-old urban schoolchildren in the eastern Black Sea region of Turkey. Clin. Exp. Allergy 39, 1027-1035.
27. Jeebhay, M.F., Robins, T.G., and Lopata, A.L. (2004). World at work: fish processing workers. Occup. Environ. Med. 61, 471-474.
28. Jeebhay, M.F., Robins, T.G., Miller, M.E., Bateman, E., Smuts, M., Baatjies, R., and Lopata, A.L. (2008). Occupational allergy and asthma among salt water fish processing workers. Am. J. Ind. Med. 51, 899-910.
29. Jeebhay, M.F., Robins, T.G., Seixas, N., Baatjies, R., George, D.A., Rusford, E., Lehrer, S.B., and Lopata, A.L. (2005). Environmental exposure characterization of fish processing workers. Ann. Occup. Hyg. 49, 423-437.

REFERENCES
134
Referen
ces
30. Matheisen, A.M. (2010). The State of the World Fisheries. In Food and Agriculture Organisation, Volume FAO Fisheries and Agricultureof the Unitied Nations.
31. Vierk, K.A., Koehler, K.M., Fein, S.B., and Street, D.A. (2007). Prevalence of self-reported food allergy in American adults and use of food labels. J. Allergy Clin. Immunol. 119, 1504-1510.
32. Zinn, C., Lopata, A., Visser, M., and Potter, P.C. (1997). The spectrum of allergy to South African bony fish (Teleosti). Evaluation by double-blind, placebo-controlled challenge. S. Afr. Med. J. 87, 146-152.
33. Kobayashi, A., Tanaka, H., Hamada, Y., Ishizaki, S., Nagashima, Y., and Shiomi, K. (2006). Comparison of allergenicity and allergens between fish white and dark muscles. Allergy 61, 357-363.
34. BaagØE, K.H. (1948). FIRST NORTHERN CONGRESS OF ALLERGY. Allergy 1, 123-126.
35. Jeebhay, M.F., Robins, T.G., Lehrer, S.B., and Lopata, A.L. (2001). Occupational seafood allergy: a review. Occup. Environ. Med. 58, 553-562.
36. Bang, K.M., Hnizdo, E., and Doney, B. (2005). Prevalence of asthma by industry in the US population: A study of 2001 NHIS data. Am. J. Ind. Med. 47, 500-508.
37. Douglas, J.D., McSharry, C., Blaikie, L., Morrow, T., Miles, S., and Franklin, D. (1995). Occupational asthma caused by automated salmon processing. The Lancet 346, 737-740.
38. Anibarro, B., Seoane, F.J., and Mugica, M.V. (2007). Involvement of hidden allergens in food allergic reactions. J. Investig. Allergol. Clin. Immunol. 17, 168-172.
39. Eigenmann, P.A., and Zamora, S.A. (2002). An internet-based survey on the circumstances of food-induced reactions following the diagnosis of IgE-mediated food allergy. Allergy 57, 449-453.
40. James, J.M., and Crespo, J.F. (2007). Allergic reactions to foods by inhalation. Curr. Allergy Asthma Rep. 7, 167-174.
41. Roberts, G., Golder, N., and Lack, G. (2002). Bronchial challenges with aerosolized food in asthmatic, food-allergic children. Allergy 57, 713-717.
42. Sicherer, S.H., and Teuber, S. (2004). Current approach to the diagnosis and management of adverse reactions to foods. J. Allergy Clin. Immunol. 114, 1146-1150.
43. Bock, S.A., Muñoz-Furlong, A., and Sampson, H.A. (2001). Fatalities due to anaphylactic reactions to foods. J. Allergy Clin. Immunol. 107, 191-193.
44. Roberts, G., and Lack, G. (2003). Food allergy and asthma—what is the link? Paediatr. Respir. Rev. 4, 205-212.
45. Pali-Schöll, I., Yildirim, A.Ö., Ackermann, U., Knauer, T., Becker, C., Garn, H., Renz, H., Jensen-Jarolim, E., and Fehrenbach, H. (2008). Anti-acids lead to immunological and morphological changes in the intestine of BALB/c mice similar to human food allergy. Exp. Toxicol. Pathol. 60, 337-345.
46. Untersmayr, E., Vestergaard, H., Malling, H.-J., Jensen, L.B., Platzer, M.H., Boltz-Nitulescu, G., Scheiner, O., Skov, P.S., Jensen-Jarolim, E., and Poulsen, L.K. (2007). Incomplete digestion of codfish represents a risk factor for anaphylaxis in patients with allergy. J. Allergy Clin. Immunol. 119, 711-717.
47. Sugita, K., Kabashima, K., Nakashima, D., and Tokura, Y. (2007). Oral allergy syndrome caused by raw fish in a Japanese sushi bar worker. Contact Dermatitis 56, 369-370.
REFERENCES
135
Referen
ces
48. Pitsios, C., Dimitriou, A., Stefanaki, E., and Kontou-Fili, K. (2010). Anaphylaxis during skin testing with food allergens in children. Eur. J. Pediatr. 169, 613-615.
49. Pellegrino, K., LE, D.U., Artesani, M.C., Riccardi, C., Mancini, S., Bella, S., Alghisi, F., and Cavagni, G. (2012). Severe reaction in a child with asymptomatic codfish allergy: Food challenge reactivating recurrent pancreatitis. Ital. J. Pediatr. 38, 16.
50. Onesimo, R., Giorgio, V., Pill, S., Monaco, S., and Sopo, S.M. (2012). Isolated contact urticaria caused by immunoglobulin E-mediated fish allergy. Isr. Med. Assoc. J. 14, 11-13.
51. Pascual, C.Y., Reche, M., Fiandor, A., Valbuena, T., Cuevas, T., and Esteban, M.M. (2008). Fish allergy in childhood. Pediatr. Allergy Immunol. 19, 573-579.
52. Seitz, C.S., Brocker, E.B., and Trautmann, A. (2008). Occupational allergy due to seafood delivery: Case report. J. Occup. Med. Toxicol. 3, 11.
53. Dahlman-Höglund, A., Renström, A., Larsson, P.H., Elsayed, S., and Andersson, E. (2012). Salmon allergen exposure, occupational asthma, and respiratory symptoms among salmon processing workers. Am. J. Ind. Med. 55, 624-630.
54. Lopata, A.L., and Jeebhay, M.F. (2001). Seafood allergy in South Africa – studies in the domestic and occupational setting. Allergy & Clinical Immunology International 13, 204-209.
55. Jeebhay, M.F., and Cartier, A. (2010). Seafood workers and respiratory disease: an update. Curr. Opin. Allergy Clin. Immunol. 10, 104-113.
56. Jeebhay, M.F., and Lopata, A.L. (2012). Chapter 2 - Occupational Allergies in Seafood-Processing Workers. In Adv. Food Nutr. Res., Volume Volume 66, H. Jeyakumar, ed. (Academic Press), pp. 47-73.
57. Jeebhay, M.F., Lopata, A.L., and Robins, T.G. (2000). Seafood processing in South Africa: a study of working practices, occupational health services and allergic health problems in the industry. Occup Med (Lond) 50, 406-413.
58. Bardana Jr, E.J. (2008). 10. Occupational asthma. J. Allergy Clin. Immunol. 121, S408-S411.
59. Jeebhay, M.F., and Quirce, S. (2007). Occupational asthma in the developing and industrialised world: a review [State of the Art Series. Occupational lung disease in high- and low-income countries, Edited by M. Chan-Yeung. Number 1 in the series]. The International Journal of Tuberculosis and Lung Disease 11, 122-133.
60. Taylor, A.V., Swanson, M.C., Jones, R.T., Vives, R., Rodriguez, J., Yunginger, J.W., and Crespo, J.F. (2000). Detection and quantitation of raw fish aeroallergens from an open-air fish market. J. Allergy Clin. Immunol. 105, 166-169.
61. Chehade, M., Nowak-Wegrzyn, A., Kaufman, S.S., Fishbein, T.M., Tschernia, A., and LeLeiko, N.S. (2004). De novo food allergy after intestinal transplantation: a report of three cases. J. Pediatr. Gastroenterol. Nutr. 38, 545-547.
62. Asero, R., and Antonicelli, L. (2011). Does Sensitization to Foods in Adults Occur Always in the Gut? International Archives of Allergy and Applied Immunology
154, 6-14. 63. Nieuwenhuizen, N., Lopata, A.L., Jeebhay, M.F., Herbert, D.R., Robins, T.G.,
and Brombacher, F. (2006). Exposure to the fish parasite Anisakis causes

REFERENCES
136
Referen
ces
allergic airway hyperreactivity and dermatitis. J. Allergy Clin. Immunol. 117, 1098-1105.
64. Kirstein, F., Horsnell, W.G., Nieuwenhuizen, N., Ryffel, B., Lopata, A.L., and Brombacher, F. (2010). Anisakis pegreffii-induced airway hyperresponsiveness is mediated by gamma interferon in the absence of interleukin-4 receptor alpha responsiveness. Infect. Immun. 78, 4077-4086.
65. Bernardini, R., Mistrello, G., Novembre, E., Roncarolo, D., Zanotta, S., Lombardi, E., Cianferoni, A., Pucci, N., De Martino, M., and Vierucci, A. (2005). Cross-reactivity between IgE-binding proteins from Anisakis simplex and Dermatophagoides pteronyssinus. Int. J. Immunopathol. Pharmacol. 18, 671-675.
66. Jeong, K.Y., Hong, C.S., and Yong, T.S. (2006). Allergenic tropomyosins and their cross-reactivities. Protein Pept. Lett. 13, 835-845.
67. Gruber, P., Becker, W.-M., and Hofmann, T. (2005). Influence of the Maillard Reaction on the Allergenicity of rAra h 2, a Recombinant Major Allergen from Peanut (Arachis hypogaea), Its Major Epitopes, and Peanut Agglutinin. J. Agric. Food Chem. 53, 2289-2296.
68. Vissers, Y.M., Blanc, F., Skov, P.S., Johnson, P.E., Rigby, N.M., Przybylski-Nicaise, L., Bernard, H., Wal, J.-M., Ballmer-Weber, B., Zuidmeer-Jongejan, L., et al. (2011). Effect of Heating and Glycation on the Allergenicity of 2S Albumins (Ara h 2/6) from Peanut. PLoS ONE 6, e23998.
69. Ilchmann, A., Burgdorf, S., Scheurer, S., Waibler, Z., Nagai, R., Wellner, A., Yamamoto, Y., Yamamoto, H., Henle, T., Kurts, C., et al. (2010). Glycation of a food allergen by the Maillard reaction enhances its T-cell immunogenicity: Role of macrophage scavenger receptor class A type I and II. J. Allergy Clin. Immunol. 125, 175-183.e111.
70. Hilmenyuk, T., Bellinghausen, I., Heydenreich, B., Ilchmann, A., Toda, M., Grabbe, S., and Saloga, J. (2010). Effects of glycation of the model food allergen ovalbumin on antigen uptake and presentation by human dendritic cells. Immunology 129, 437-445.
71. Van Do, T., Hordvik, I., Endresen, C., and Elsayed, S. (2003). The major allergen (parvalbumin) of codfish is encoded by at least two isotypic genes: cDNA cloning, expression and antibody binding of the recombinant allergens. Mol. Immunol. 39, 595-602.
72. Swoboda, I., Bugajska-Schretter, A., Verdino, P., Keller, W., Sperr, W.R., Valent, P., Valenta, R., and Spitzauer, S. (2002). Recombinant carp parvalbumin, the major cross-reactive fish allergen: a tool for diagnosis and therapy of fish allergy. J. Immunol. 168, 4576-4584.
73. Elsayed, S., and Apold, J. (1983). Immunochemical analysis of cod fish allergen M: locations of the immunoglobulin binding sites as demonstrated by the native and synthetic peptides. Allergy 38, 449-459.
74. Van Do, T., Hordvik, I., Endresen, C., and Elsayed, S. (2005). Characterization of parvalbumin, the major allergen in Alaska pollack, and comparison with codfish allergen M. Mol. Immunol. 42, 345-353.
75. Untersmayr, E., Szalai, K., Riemer, A.B., Hemmer, W., Swoboda, I., Hantusch, B., Schöll, I., Spitzauer, S., Scheiner, O., Jarisch, R., et al. (2006). Mimotopes identify conformational epitopes on parvalbumin, the major fish allergen. Mol. Immunol. 43, 1454-1461.
76. Perez-Gordo, M., Lin, J., Bardina, L., Pastor-Vargas, C., Cases, B., Vivanco, F., Cuesta-Herranz, J., and Sampson, H.A. (2011). Epitope Mapping of Atlantic
REFERENCES
137
Referen
ces
Salmon Major Allergen by Peptide Microarray Immunoassay. International Archives of Allergy Immunology 157, 31-40.
77. Lindstrom, C.D., van Do, T., Hordvik, I., Endresen, C., and Elsayed, S. (1996). Cloning of two distinct cDNAs encoding parvalbumin, the major allergen of Atlantic salmon (Salmo salar). Scand. J. Immunol. 44, 335-344.
78. Froese, R., and Pauly, D. (2012). Fish Base. World Wide Web electronic publication www.fishbase.org.
79. Aas, K., and Elsayed, S.M. (1969). Characterization of a major allergen (cod): Effect of enzymic hydrolysis on the allergenic activity. J. Allergy 44, 333-343.
80. Aas, K., and Lundkvist, U. (1973). The radioallergosorbent test with a purified allergen from codfish. Clin. Allergy 3, 255-261.
81. Elsayed, S.M., and Aas, K. (1970). Characterization of a major allergen (cod.) chemical composition and immunological properties. Int. Arch. Allergy Appl. Immunol. 38, 536-548.
82. Bugajska-Schretter, A., Elfman, L., Fuchs, T., Kapiotis, S., Rumpold, H., Valenta, R., and Spitzauer, S. (1998). Parvalbumin, a cross-reactive fish allergen, contains IgE-binding epitopes sensitive to periodate treatment and Ca2+ depletion. J. Allergy Clin. Immunol. 101, 67-74.
83. Lim, D.L.-C., Keng Hwee, N., Fong Cheng, Y., Kaw Yan, C., Denise Li-Meng, G., Lynette Pei-Chi, S., Yoke Chin, G., Hugo, P.S.V.B., and Bee Wah, L. (2008). Parvalbumin -- the major tropical fish allergen. Pediatr. Allergy Immunol. 19, 399-407.
84. Arif, S.H. (2009). A Ca2+-binding protein with numerous roles and uses: Parvalbumin in molecular biology and physiology. BioEssays 31, 410-421.
85. Romano, C., Ferrara, A.M., Cislaghi, C., and Falagiani, P. (2000). Food allergy to frog. Allergy 55, 584-585.
86. Lehky, P., Blum, H.E., Stein, E.A., and Fischer, E.H. (1974). Isolation and Characterization of Parvalbumins from the Skeletal Muscle of Higher Vertebrates. J. Biol. Chem. 249, 4332-4334.
87. Das Dores, S., Chopin, C., Villaume, C., Fleurence, J., and Guéant, J.L. (2002). A new oligomeric parvalbumin allergen of Atlantic cod (Gad mI) encoded by a gene distinct from that of Gad cI. Allergy 57, 79-83.
88. Rosmilah, M., Shahnaz, M., Masita, A., Noormalin, A., and Jamaludin, M. (2005). Identification of major allergens of two species of local snappers: Lutjanus argentimaculatus (merah/ red snapper) and Lutjanus johnii (jenahak/ golden snapper). Tropical Biomedicine 22, 171-177.
89. Yoshida, S., Ichimura, A., and Shiomi, K. (2008). Elucidation of a major IgE epitope of Pacific mackerel parvalbumin. Food Chem. 111, 857-861.
90. Kuehn, A., Hutt-Kempf, E., Hilger, C., and Hentges, F. (2011). Clinical monosensitivity to salmonid fish linked to specific IgE-epitopes on salmon and trout beta-parvalbumins. Allergy 66, 299-301.
91. Vázquez-Cortés, S., Nuñez-Acevedo, B., Jimeno-Nogales, L., Ledesma, A., and Fernández-Rivas, M. (2012). Selective allergy to the salmonidae fish family: a selective parvalbumin epitope? Annals of Allergy, Asthma & Immunology 108, 62-63.
92. Sicherer, S.H., and Sampson, H.A. (2010). Food allergy. J. Allergy Clin. Immunol. 125, S116-S125.
93. Lopata, A.L., Hehir, R.E.O., and Lehrer, S.B. (2010). Shellfish allergy. Clin. Exp. Allergy 40, 850-858.

REFERENCES
138
Referen
ces
94. Perez-Gordo, M., Pastor-Vargas, C., Lin, J., Bardina, L., Cases, B., Ibáñez, M.D., Vivanco, F., Cuesta-Herranz, J., and Sampson, H.A. (2013). Epitope mapping of the major allergen from Atlantic cod in Spanish population reveals different IgE-binding patterns. Mol. Nutr. Food Res., n/a-n/a.
95. Escudero, R., Gamboa, P.M., Anton, J., and Sanz, M.L. (2007). Food allergy due to trout roe. Journal of Investigational Allergology and Clininical Immunology 17, 346-347.
96. Perez-Gordo, M., Sanchez-Garcia, S., Cases, B., Pastor, C., Vivanco, F., and Cuesta-Herranz, J. (2008). Identification of vitellogenin as an allergen in Beluga caviar allergy. Allergy 63, 479-480.
97. Hamada, Y., Nagashima, Y., and Shiomi, K. (2001). Identification of collagen as a new fish allergen. Bioscience Biotechnology Biochemistry 65, 285-291.
98. Sakaguchi, M., Toda, M., Ebihara, T., Irie, S., Hori, H., Imai, A., Yanagida, M., Miyazawa, H., Ohsuna, H., Ikezawa, Z., et al. (2000). IgE antibody to fish gelatin (type I collagen) in patients with fish allergy. J. Allergy Clin. Immunol. 106, 579-584.
99. Taylor, S.L., Kabourek, J L, Hefle, S L. (2004). Fish allergy: fish and products thereof. J. Food Sci. 69, R175-R180.
100. Weber, P., Steinhart, H., and Paschke, A. (2009). Competitive indirect ELISA for the determination of parvalbumins from various fish species in food grade fish gelatins and isinglass with PARV-19 anti-parvalbumin antibodies. J. Agric. Food Chem. 57, 11328-11334.
101. Audicana, M.T., and Kennedy, M.W. (2008). Anisakis simplex: from obscure infectious worm to inducer of immune hyersensitivity. Clinical Microbiology Reviews 21, 360-+.
102. Nieuwenhuizen, N., Lopata, A.L., Jeebhay, M.L.F., Herbert, D.R., Robins, T.G., and Brombacher, F. (2006). Exposure to the fish parasite Anisakis causes allergic airway hyperreactivity and dermatitis. J Allergy Clin Immun 117, 1098-1105.
103. Hamada, Y., Tanaka, H., Ishizaki, S., Ishida, M., Nagashima, Y., and Shiomi, K. (2003). Purification, reactivity with IgE and cDNA cloning of parvalbumin as the major allergen of mackerels. Food Chem. Toxicol. 41, 1149-1156.
104. Hamada, Y., Tanaka, H., Sato, A., Ishizaki, S., Nagashima, Y., and Shiomi, K. (2004). Expression and evaluation of IgE-binding capacity of recombinant Pacific mackerel parvalbumin. Allergol. Int. 53, 271-278.
105. Griesmeier, U., Vázquez-Cortés, S., Bublin, M., Radauer, C., Ma, Y., Briza, P., Fernández-Rivas, M., and Breiteneder, H. (2010). Expression levels of parvalbumins determine allergenicity of fish species. Allergy 65, 191-198.
106. Yan, M., Ulrike, G., Markus, S., Christian, R., Peter, B., Anja, E., Merima, B., Stefano, A., Martin, H., Sonia, V.-C., et al. (2008). Comparison of natural and recombinant forms of the major fish allergen parvalbumin from cod and carp. Mol. Nutr. Food Res. 52, S196-S207.
107. Carrera, M.n., Cañas, B., Vázquez, J.s., and Gallardo, J.M. (2010). Extensive De Novo Sequencing of New Parvalbumin Isoforms Using a Novel Combination of Bottom-Up Proteomics, Accurate Molecular Mass Measurement by FTICR−MS, and Selected MS/MS Ion Monitoring. J. Proteome Res. 9, 4393-4406.
108. Kuehn, A., Scheuermann, T., Hilger, C., and Hentges, F. (2010). Important variations in parvalbumin content in common fish species: a factor possibly contributing to variable allergenicity. International Archves of Allergy and Immunology 153, 359-366.
REFERENCES
139
Referen
ces
109. Makinen-Kiljunen, S., Kiistala, R., and Varjonen, E. (2003). Severe reactions from roe without concomitant fish allergy. Ann. Allergy. Asthma. Immunol. 91, 413-416.
110. Ulrike, G., Merima, B., Christian, R., Sonia, V.-C., Yan, M., Montserrat, F.-R., and Heimo, B. (2009). Physicochemical properties and thermal stability of Lep w 1, the major allergen of whiff. Mol. Nutr. Food Res. 9999, NA.
111. Bugajska-Schretter, A., Grote, M., Vangelista, L., Valent, P., Sperr, W.R., Rumpold, H., Pastore, A., Reichelt, R., Valenta, R., and Spitzauer, S. (2000). Purification, biochemical, and immunological characterisation of a major food allergen: different immunoglobulin E recognition of the apo- and calcium-bound forms of carp parvalbumin. Gut 46, 661-669.
112. Gajewski, K.G., and Hsieh, Y.H. (2009). Monoclonal antibody specific to a major fish allergen: parvalbumin. J. Food Prot. 72, 818-825.
113. Lopata, A.L., and Potter, P.C. (2000). Allergy and other adverse reactions to seafood. Allergy & Clinical Immunology International 12, 271-281.
114. Lehrer, S.B., Ayuso, R., and Reese, G. (2003). Seafood allergy and allergens: A review. Marine Biotechnology 5, 339-348.
115. Auerswald, L., Morren, C., and Lopata, A.L. (2006). Histamine levels in seventeen species of fresh and processed South African seafood. Food Chem. 98, 231-239.
116. Hungerford, J.M. (2010). Scombroid poisoning: A review. Toxicon 56, 231-243. 117. Lopata, A.L., and Potter, P.C. (2000). Allergy and other adverse reactions to
seafood. Allergy and Clinical Immunology International 12, 271-281. 118. Audicana, M.T., and Kennedy, M.W. (2008). Anisakis simplex: from obscure
infectious worm to inducer of immune hypersensitivity. Clin. Microbiol. Rev. 21, 360-379, table of contents.
119. Shamsi, S., Eisenbarth, A., Saptarshi, S., Beveridge, I., Gasser, R., and Lopata, A. (2011). Occurrence and abundance of anisakid nematode larvae in five species of fish from southern Australian waters. Parasitol. Res. 108, 927-934.
120. Lin, A.H., Florvaag, E., Van Do, T., Johansson, S.G.O., Levsen, A., and Vaali, K. (2012). IgE Sensitization to the Fish Parasite Anisakis simplex in a Norwegian Population: A Pilot Study. Scand. J. Immunol. 75, 431-435.
121. Sackesen, C., and Adalioglu, G. (2003). Hidden fish substance triggers allergy. J. Investig. Allergol. Clin. Immunol. 13, 216-217.
122. Sampson, H.A. (2001). Utility of food-specific IgE concentrations in predicting symptomatic food allergy. J. Allergy Clin. Immunol. 107, 891-896.
123. Bernhisel-Broadbent, J., Scanlon, S.M., and Sampson, H.A. (1992). Fish hypersensitivity: I. In vitro and oral challenge results in fish-allergic patients. J. Allergy Clin. Immunol. 89, 730-737.
124. Helbling, A., Haydel Jr, R., McCants, M.L., Musmand, J.J., El-Dahr, J., and Lehrer, S.B. (1999). Fish allergy: is cross-reactivity among fish species relevant? Double-blind placebo-controlled food challenge studies of fish allergic adults. Annals of Allergy, Asthma & Immunology 83, 517-523.
125. Asero, R., Mistrello, G., Roncarolo, D., Casarini, M., and Falagiani, P. (1999). True monosensitivity to a tropical sole. Allergy 54, 1228-1229.
126. Ebo, D.G., Kuehn, A., Bridts, C.H., Hilger, C., Hentges, F., and Stevens, W.J. (2010). Monosensitivity to pangasius and tilapia caused by allergens other than parvalbumin. J. Investig. Allergol. Clin. Immunol. 20, 84-88.
127. Gill, B.V., Rice, T.R., Cartier, A., Gautrin, D., Neis, B., Horth-Susin, L., Jong, M., Swanson, M., and Lehrer, S.B. (2009). Identification of crab proteins that

REFERENCES
140
Referen
ces
elicit IgE reactivity in snow crab–processing workers. J. Allergy Clin. Immunol. 124, 1055-1061.
128. Lee, L.A., and Burks, A.W. (2006). Food Allergies: Prevalence, Molecular Characterization, and Treatment/Prevention Strategies. Annu. Rev. Nutr. 26, 539-565.
129. Taylor, S.L., Hefle, S.L., Bindslev-jensen, C., Atkins, F.M., Andre, C., Bruijnzeel-koomen, C., Burks, A.W., Bush, R.K., Ebisawa, M., Eigenmann, P.A., et al. (2004). A consensus protocol for the determination of the threshold doses for allergenic foods: how much is too much? Clin. Exp. Allergy 34, 689-695.
130. O'Neil, C., Helbling, A.A., and Lehrer, S.B. (1993). Allergic reactions to fish. Clin. Rev. Allergy 11, 183-200.
131. Swoboda, I., Bugajska-Schretter, A., Linhart, B., Verdino, P., Keller, W., Schulmeister, U., Sperr, W.R., Valent, P., Peltre, G., Quirce, S., et al. (2007). A recombinant hypoallergenic parvalbumin mutant for immunotherapy of IgE-mediated fish allergy. J. Immunol. 178, 6290-6296.
132. Nieuwenhuizen, N.E., and Lopata, A.L. (2005). Fighting Food Allergy: Current Approaches. Ann. N. Y. Acad. Sci. 1056, 30-45.
133. Turner, P., Ng, I., Kemp, A., and Campbell, D. (2011). Seafood allergy in children: a descriptive study. Annals of Allergy, Asthma & Immunology 106, 494-501.
134. Aalberse, R.C., Stapel, S.O., Schuurman, J., and Rispens, T. (2009). Immunoglobulin G4: an odd antibody. Clin. Exp. Allergy 39, 469-477.
135. Ferreira, F., Wolf, M., and Wallner, M. (2014). Molecular Approach to Allergy Diagnosis and Therapy. Yonsei Med. J. 55, 839-852.
136. Aalberse, R. (2011). The role of IgG antibodies in allergy and immunotherapy. Allergy 66, 28-30.
137. van der Neut Kolfschoten, M., Schuurman, J., Losen, M., Bleeker, W.K., Martínez-Martínez, P., Vermeulen, E., den Bleker, T.H., Wiegman, L., Vink, T., Aarden, L.A., et al. (2007). Anti-Inflammatory Activity of Human IgG4 Antibodies by Dynamic Fab Arm Exchange. Science 317, 1554-1557.
138. Fæste, C.K., and Plassen, C. (2008). Quantitative sandwich ELISA for the determination of fish in foods. J. Immunol. Methods 329, 45-55.
139. Lopata, A., L., Jeebhay, M., F., Reese, G., Fernandes, J., Swoboda, I., Robins, T., G., and Lehrer, S., B. (2005). Detection of fish antigens aerosolized during fish processing using newly developed immunoassays. Int. Arch. Allergy Appl. Immunol. 138, 21.
140. Rolland, J.M., Apostolou, E., Deckert, K., de Leon, M.P., Douglass, J.A., Glaspole, I.N., Bailey, M., Stockley, C.S., and O’Hehir, R.E. (2006). Potential food allergens in wine: Double-blind, placebo-controlled trial and basophil activation analysis. Nutrition 22, 882-888.
141. Sharp, M.F., and Lopata, A.L. (2013). Fish Allergy: In Review. Clin. Rev. Allergy Immunol.
142. Girija, N., and Rehbein, H. (1988). Comparison of parvalbumin patterns from different fish species by isoelectric focusing of muscle extracts. Comparative Biochemistry and Physiology Part B: Comparative Biochemistry 91, 723-728.
143. Arif, S.H., Jabeen, M., and Hasnain, A.-U. (2007). Biochemical Characterization and Thermostable Capacity of Parvalbumins: The Major Fish Food Allergens. J. Food Biochem. 31, 121-137.

REFERENCES
141
Referen
ces
144. Wilwert, J.L., Madhoun, N.M., and Coughlin, D.J. (2006). Parvalbumin correlates with relaxation rate in the swimming muscle of sheepshead and kingfish. J. Exp. Biol. 209, 227-237.
145. Brownridge, P., de Mello, L.V., Peters, M., McLean, L., Claydon, A., Cossins, A.R., Whitfield, P.D., and Young, I.S. (2009). Regional variation in parvalbumin isoform expression correlates with muscle performance in common carp (Cyprinus carpio). J. Exp. Biol. 212, 184-193.
146. Huriaux, F., Collin, S., Vandewalle, P., Philippart, J.C., and Focant, B. (1997). Characterization of parvalbumin isotypes in white muscle from the barbel and expression during development. J. Fish Biol. 50, 821-836.
147. Ross, C., Tilghman, R.W., Hartmann, J.X., and Mari, F. (1997). Distribution of parvalbumin isotypes in adult snook and their potential applications as species-specific biomarkers. J. Fish Biol. 51, 561-572.
148. Cai, Q.-F., Liu, G.-M., Li, T., Hara, K., Wang, X.-C., Su, W.-J., and Cao, M.-J. (2010). Purification and Characterization of Parvalbumins, the Major Allergens in Red Stingray (Dasyatis akajei). J. Agric. Food Chem. 58, 12964-12969.
149. Rodríguez, V., Gracia, M.T., Iriarte, P., and Bartolomé, B. (2003). Allergy to dogfish. Allergy 58, 1315-1317.
150. Roquet, F., Declercq, J.-P., Tinant, B., Rambaud, J., and Parello, J. (1992). Crystal structure of the unique parvalbumin component from muscle of the leopard shark (Triakis semifasciata) : The first x-ray study of an [alpha]-parvalbumin. J. Mol. Biol. 223, 705-720.
151. Venkatesh, B., Kirkness, E.F., Loh, Y.H., Halpern, A.L., Lee, A.P., Johnson, J., Dandona, N., Viswanathan, L.D., Tay, A., Venter, J.C., et al. (2007). Survey sequencing and comparative analysis of the elephant shark (Callorhinchus milii) genome. PLoS Biol. 5, e101.
152. Koyama, H., Kakami, M., Kawamura, M., Tokuda, R., Kondo, Y., Tsuge, I., Yamada, K., Yasuda, T., and Urisu, A. (2006). Grades of 43 fish species in Japan based on IgE-binding activity. Allergol. Int. 55, 311-316.
153. Sharp, M.F., Kamath, S.D., Koeberl, M., Jerry, D.R., O’Hehir, R.E., Campbell, D.E., and Lopata, A.L. (2014). Differential IgE binding to isoallergens from Asian seabass (Lates calcarifer) in children and adults. Mol. Immunol. 62, 77-85.
154. Saptarshi, S.R., Sharp, M.F., Kamath, S.D., and Lopata, A.L. (2014). Antibody reactivity to the major fish allergen parvalbumin is determined by isoforms and impact of thermal processing. Food Chem. 148, 321-328.
155. Sun, M., Liang, C., Gao, H., Lin, C., and Deng, M. (2009). Detection of parvalbumin, a common fish allergen gene in food, by real-time polymerase chain reaction. J. AOAC Int. 92, 234-240.
156. Shibahara, Y., Uesaka, Y., Wang, J., Yamada, S., and Shiomi, K. (2013). A sensitive enzyme-linked immunosorbent assay for the determination of fish protein in processed foods. Food Chem. 136, 675-681.
157. Lee, P.-W., Nordlee, J.A., Koppelman, S.J., Baumert, J.L., and Taylor, S.L. (2011). Evaluation and Comparison of the Species-Specificity of 3 Antiparvalbumin IgG Antibodies. J. Agric. Food Chem.
158. Chen, L., Hefle, S.L., Taylor, S.L., Swoboda, I., and Goodman, R.E. (2006). Detecting Fish Parvalbumin with Commercial Mouse Monoclonal Anti-frog Parvalbumin IgG. J. Agric. Food Chem. 54, 5577-5582.

REFERENCES
142
Referen
ces
159. Kuehn, A., Swoboda, I., Arumugam, K., Hilger, C., and Hentges, F. (2014). Fish allergens at a glance: variable allergenicity of parvalbumins, the major fish allergens. Front Immunol 5, 179.
160. Peñas, E., Uberti, F., Baviera, G., Di Lorenzo, C., and Restani, P. (2014). Clinical monosensitivity to salmon and rainbow trout: a case report. Pediatr. Allergy Immunol. 25, 98-100.
161. Sletten, G., Van Do, T., Lindvik, H., Egaas, E., and Florvaag, E. (2010). Effects of Industrial Processing on the Immunogenicity of Commonly Ingested Fish Species. Int. Arch. Allergy Appl. Immunol. 151, 223-236.
162. Bernhisel-Broadbent, J., Strause, D., and Sampson, H.A. (1992). Fish hypersensitivity. II: Clinical relevance of altered fish allergenicity caused by various preparation methods. J. Allergy Clin. Immunol. 90, 622-629.
163. Prescott, S., and Allen, K.J. (2011). Food allergy: Riding the second wave of the allergy epidemic. Pediatr. Allergy Immunol. 22, 155-160.
164. Loughnan, S.R., Domingos, J.A., Smith-Keune, C., Forrester, J.P., Jerry, D.R., Beheregaray, L.B., and Robinson, N.A. Broodstock contribution after mass spawning and size grading in barramundi (Lates calcarifer, Bloch). Aquaculture.
165. Sharp, M.F., and Lopata, A.L. (2013). Chapter 12: Muscle Proteins in Asian Sea bass – Parvalbumin’s Role as a Physiological Protein and Fish Allergen. In Biology and Culture of Asian Seabass Lates Calcarifer, D.R. Jerry, ed. (CRC Press), pp. 293-307.
166. Wang, C.M., Lo, L.C., Feng, F., Zhu, Z.Y., and Yue, G.H. (2008). Identification and verification of QTL associated with growth traits in two genetic backgrounds of Barramundi (Lates calcarifer). Anim. Genet. 39, 34-39.
167. Xu, Y.X., Zhu, Z.Y., Lo, L.C., Wang, C.M., Lin, G., Feng, F., and Yue, G.H. (2006). Characterization of two parvalbumin genes and their association with growth traits in Asian seabass (Lates calcarifer). Anim. Genet. 37, 266-268.
168. Kuehn, A., Hilger, C., Lehners-Weber, C., Codreanu-Morel, F., Morisset, M., Metz-Favre, C., Pauli, G., de Blay, F., Revets, D., Muller, C.P., et al. (2013). Identification of enolases and aldolases as important fish allergens in cod, salmon and tuna: component resolved diagnosis using parvalbumin and the new allergens. Clin. Exp. Allergy 43, 811-822.
169. Liu, G.-M., Wang, N., Cai, Q.-F., Li, T., Sun, L.-C., Su, W.-J., and Cao, M.-J. (2010). Purification and characterization of parvalbumins from silver carp Hypophthalmichthy molitrix. J. Sci. Food Agric. 90, 1034-1040.
170. Shanti, K.N., Martin, B.M., Nagpal, S., Metcalfe, D.D., and Rao, P.V. (1993). Identification of tropomyosin as the major shrimp allergen and characterization of its IgE-binding epitopes. J. Immunol. 151, 5354-5363.
171. Mine, Y., and Zhang, J.W. (2002). Comparative Studies on Antigenicity and Allergenicity of Native and Denatured Egg White Proteins. J. Agric. Food Chem. 50, 2679-2683.
172. Thomas, K., Herouet-Guicheney, C., Ladics, G., Bannon, G., Cockburn, A., Crevel, R., Fitzpatrick, J., Mills, C., Privalle, L., and Vieths, S. (2007). Evaluating the effect of food processing on the potential human allergenicity of novel proteins: International workshop report. Food Chem. Toxicol. 45, 1116-1122.
173. Savilahti, E.M., Kuitunen, M., Valori, M., Rantanen, V., Bardina, L., Gimenez, G., Mäkelä, M.J., Hautaniemi, S., Savilahti, E., and Sampson, H.A. (2014). Use of IgE and IgG4 epitope binding to predict the outcome of oral immunotherapy in cow's milk allergy. Pediatr. Allergy Immunol. 25, 227-235.

REFERENCES
143
Referen
ces
174. Vickery, B.P., Lin, J., Kulis, M., Fu, Z., Steele, P.H., Jones, S.M., Scurlock, A.M., Gimenez, G., Bardina, L., Sampson, H.A., et al. (2013). Peanut oral immunotherapy modifies IgE and IgG4 responses to major peanut allergens. J. Allergy Clin. Immunol. 131, 128-134.e123.
175. Sharp, M.F., Stephen, J.N., Kraft, L., Weiss, T., Kamath, S.D., and Lopata, A.L. (2015). Immunological cross-reactivity between four distant parvalbumins—Impact on allergen detection and diagnostics. Mol. Immunol. 63, 437-448.
176. Lee, P.W., Nordlee, J.A., Koppelman, S.J., Baumert, J.L., and Taylor, S.L. (2012). Measuring parvalbumin levels in fish muscle tissue: Relevance of muscle locations and storage conditions. Food Chem. 135, 502-507.
177. Somkuti, J., Bublin, M., Breiteneder, H., and Smeller, L. (2012). Pressure–Temperature Stability, Ca2+ Binding, and Pressure–Temperature Phase Diagram of Cod Parvalbumin: Gad m 1. Biochemistry 51, 5903-5911.
178. Schulkes, K., Klemans, R., Knigge, L., de Bruin-Weller, M., Bruijnzeel-Koomen, C., Marknell deWitt, A., Lidholm, J., and Knulst, A. (2014). Specific IgE to fish extracts does not predict allergy to specific species within an adult fish allergic population. Clinical and Translational Allergy 4, 27.
179. Swoboda, I., Bugajska-Schretter, A., Valenta, R., and Spitzauer, S. (2002). Recombinant fish parvalbumins: Candidates for diagnosis and treatment of fish allergy. Allergy 57, 94-96.
144
APPENDIXA
Buffer Formulations
PBS 1L:
NaCl 8 g
KCl 0.2 g
Na2HPO4 1.44 g
KH2PO4 0.24 g
Adjust pH to 7.4
TBS 1L:
NaCl 8 g
Tris ((hydroxymethyl)aminomethane) 3 g
KCl 0.2 g
Adjust pH to 7.4
PBS/TBS-Tween:
PBS/TBS 1 L
Tween 20 0.5 mL
ELISA coating buffer:
0.1M Sodium Carbonate Buffer 50mL:
Na2CO3 0.53 g
Dissolve in de-ionised water 50mL

APPENDIX A
145
Ap
pen
dix A
0.1M Sodium Bicarbonate Buffer 50mL:
NaHCO3 0.42g
Dissolve in de-ionised water 50mL
Sodium Carbonate/Bicarbonate Coating Buffer pH 9.6 (25mL)
0.1M Na2CO3 2 mL
0.1M NaHCO3 4.25 mL
De-ionised water 18.75 mL
SDS-PAGE Buffers:
Resolving gel buffer (Buffer B):
2M Tris-HCl pH 8.8 75 mL
10% SDS 4 mL
De-ionised water 21 mL
Stacking gel buffer (Buffer C):
1M Tris-HCl pH 6.8 50 mL
10% SDS 4 mL
de-ionised water 46 mL
Acrylamide (Buffer A):
40% Acylamide-bis (Merck, USA)
Resolving gel 15% Acrylamide (x2)
Buffer A 3.75 mL
Buffer B 2.5 mL
de-ionised water 3.75 mL

APPENDIX A
146
Ap
pen
dix A
10% Ammonium Persulfate 200 µL
TEMED (Tetramethylethylenediamine) 10 µL
SDS-PAGE Running buffer 1L:
Tris 3 g
Glycine 14.4 g
SDS 1 g
Adjust to pH 8.3
Transfer buffer:
Tris 1.164 g
Glycine 0.58 g
10% SDS 750 µL
De-ionised water 160 mL
Methanol 40 mL
Two-dimensional electrophoresis
Rehydration/Sample buffer 10mL:
8M Urea 4.8 g
2% CHAPS 0.2 g
50mM Dithiothreitol (DTT) 77 mg
0.2%(w/v) Biolyte 3/10 ampholytes 20 mg
Trace of Bromophenol blue
Equilibration Buffer I 30mL:
6M Urea 10.8 g

APPENDIX A
147
Ap
pen
dix A
2% SDS 0.6 g
20% Glycerol 6 mL
0.375M Tris-HCl pH 8.8 1.37 g
2% (w/v) DTT 0.6 g (add and dissolve just before rehydration)
Equilibration Buffer II 30mL:6 M Urea 10.8 g
2% SDS 0.6 g
20% Glycerol 6 mL
0.375 M Tris-HCl pH 8.8 1.37 g
0.75 g Iodoacetamide (add and dissolve just before rehydration)
Overlay Agarose gel 50 mL:
Low melting point agarose gel 0.25 g
25 mM Tris 0.15 g
192 mM Glycine 0.72 g
0.1% SDS 0.05
Trace of Bromophenol blue
Chromatography buffers:
IMAC binding buffer 1 L
0.5M NaCl 29.22 g
20 mM Sodium Phosphate
5 mM Imidazole 0.34 g
Adjust to pH 7.4 and filter through 0.22 µm membrane

APPENDIX A
148
Ap
pen
dix A
IMAC elution buffer 1 L
0.5M NaCl 29.22 g
20 mM Sodium Phosphate
250 mM Imidazole 17 g
De-ionised water 1 L
Adjust to pH 7.4 and filter through 0.22 µm membrane
Tris binding buffer for Anion exchange chromatography 1 L:
25 mM Tris 3.03 g
De-ionised water 1 L
Adjust pH for specific protein (pH 7-9) and filter through 0.22 µm membrane
Tris elution buffer for Anion exchange chromatography 1 L:
25 mM Tris 3.03 g
1 M NaCl 58.44 g
De-ionised water 1 L
Adjust pH for specific protein (pH 7-9) and filter through 0.22 µm membrane
Bacterial broths and Agars:
Luria-Bertani (LB) Medium:
Tryptone 10 g
Yeast extract 5 g
NaCl 10 g
dH2O to 1000 ml
Adjust to pH 7.4 and autoclave at 121°C for 15 min. Store at 4°C until use.
APPENDIX A
149
Ap
pen
dix A
LB Agar:
LB Medium 500 ml
Agar 15 g
Antibiotics as required
Autoclave at 121°C for 15 min, cool to 50°C and aseptically add antibiotics before
pouring into petri plates
Ampicillin (100 mg/ml):
Ampicillin 10 g
ddH2O 100 ml
Dissolve ampicillin in water. Filter sterilise (0.22 μm) and store at -20°C in 1 ml
aliquots.