Embed Size (px)
DESCRIPTION
Jeremy-Neal-Partograph-Study-Presentation
Citation preview

10/9/13!
1!
Physiologic partograph to improve birth safety and outcomes among low-risk, nulliparous women with spontaneous labor onset
Jeremy L. Neal PhD, CNM, RN Assistant Professor The Ohio State University
!
Presentation Overview • Background & Significance!
• Introduction to Partograph!
• Partograph Use Examples!
Birth should be recognized as a normal physiologic process !
Providers should advocate for non-intervention in the absence of complications !
Scientific evidence should be incorporated into clinical practice !
To start…!
Background and
Significance
Why Nulliparous Women? • Term, nulliparous women carrying singleton, cephalic
presenting fetuses are of particular interest when strategizing to improve obstetrical care quality and outcomes (CDC, 2012; ACOG, 2000; Boyle et al, 2012; Main et al, 2004, 2006; Cleary et al, 1996)!
• 40% of all U.S. births are to nulliparous women; 1.6 million in 2011 (Martin et al, 2013)!
• ~97-98% of the variation in overall cesarean rates between institutions is d/t variation in cesareans to low-risk, nulliparous women (Brennen et al, 2009, 2011) !
• The course of the 1°labor largely dictates the course and management of subsequent labors!
Labor
• “The presence of uterine contractions of sufficient frequency, duration, and intensity to cause demonstrable effacement and dilation of the cervix” (ACOG, 2003)!
• 1st Stage = contraction onset → full dilatation!
! Latent phase = contraction onset → ‘active’ dilation onset!
! ‘Active’ phase = ‘active’ dilation → complete dilatation!
!

10/9/13!
2!
8
4 3
7 6 5
9 10
Friedman’s Active Phase: Nulliparae
Hrs
cm
5 10 15 0
2
4.9 ± 3.4 hrs (mean) (1955)!
Acceleration Phase (~2.5-4 cm) ≈ 2.1-2.4 hrs!
Phase of Max Slope (~4-9 cm) = 3.0-3.7 cm/hr![**computes to 1.35-1.67 hrs]!
(Friedman, 1955, 1978; Friedman & Kroll, 1971)!
4.6 ± 3.6 hrs (mean) (1971, 1978)!
Deceleration Phase (~9-10 cm) = 0.84-0.9 hr!
11.7 hrs (mean+2 SD) !(1955, 1971, 1978)!
Phase of Max Slope !(~4-9 cm) = 1.2 cm/hr!
“1 cm/hr rule”!
Nulliparous Labor Curve From ‘Active’ Labor Onset
2
Hrs
cm
5 10 15 0
Dilatations associated with ‘active’ labor onset (Cunningham et al, 2010; Gabbe et al, 2007; Varney et al, 2004)!
8
4 3
7 6
9 10
5
(Friedman, 1955, 1971, 1978)!
(Zhang, Troendle et al, 2010)!
7.3 hrs !(median)! 13.7 hrs
(90th %)!
(Zhang, Troendle et al, 2002)!
(Zhang, Landy et al, 2010)!
16.4 hrs (95th %)!
Nulliparous ‘Active’ Labor • Peisner & Rosen (1986) (n = 1060)!! Using Friedman’s 1.2 cm/hr criteria, low-risk, term, nulliparas with intact
membranes, cephalic presentation, and spontaneous labor were evaluated: !• At 3 cm, 75% were not ‘active’!• At 4 cm, 50% were not ‘active’!• At 5 cm, 25% were not ‘active’!
• Neal et al (In review) (n = 216)!! Using criteria put forth by the SOGC (1995), i.e., at > 3 cm dilatation,
adequate labor involves average dilation of > 0.5 cm/hr over any 4 hr time window:!
• 52.8% did not meet this expectation in the first 4 hrs after admission (average dilatation at admission ~3.5 cm)!
‘Cervicograph’ (adapted)
(Philpott, 1972; Philpott & Castle, 1972a, 1972b)
3 10 16 0
8
10
4
6
2 4 6 8 12 14
cm
Hrs
Alert line Action line
Low-risk, Rhodesian primigravidae at ! 3 cm at admission (n = 624) !
10.9% (n=68)
78.2% (n=488)
• Alert line = dilation expectation of ≥ 1 cm/hr meant to represent the slowest 10% (based on Friedman work)!
• Action line = if crossed, consider aggressive interventions (e.g., oxytocin)!
0.64 cm/hr
10.9% (n=68)
WHO Partograph WHO Partograph (adapted)
(WHO, 1994)!
3 10 16 0
8
10
4
6
2 4 6 8 12 14
cm
Hrs
Alert line Action line
11.7% (n=281)
69.1% (n=1656)
• Evaluated in large, multicenter trial in 1990s (n = 35,484)!• Reported on subgroup of low-risk, term, nulliparous women
with spontaneous labor onset admitted in ‘active’ labor, i.e., ≥ 3 cm dilatation + contractions (n = 2397)!
0.64 cm/hr!
19.2% (n=460)
10/9/13!
3!
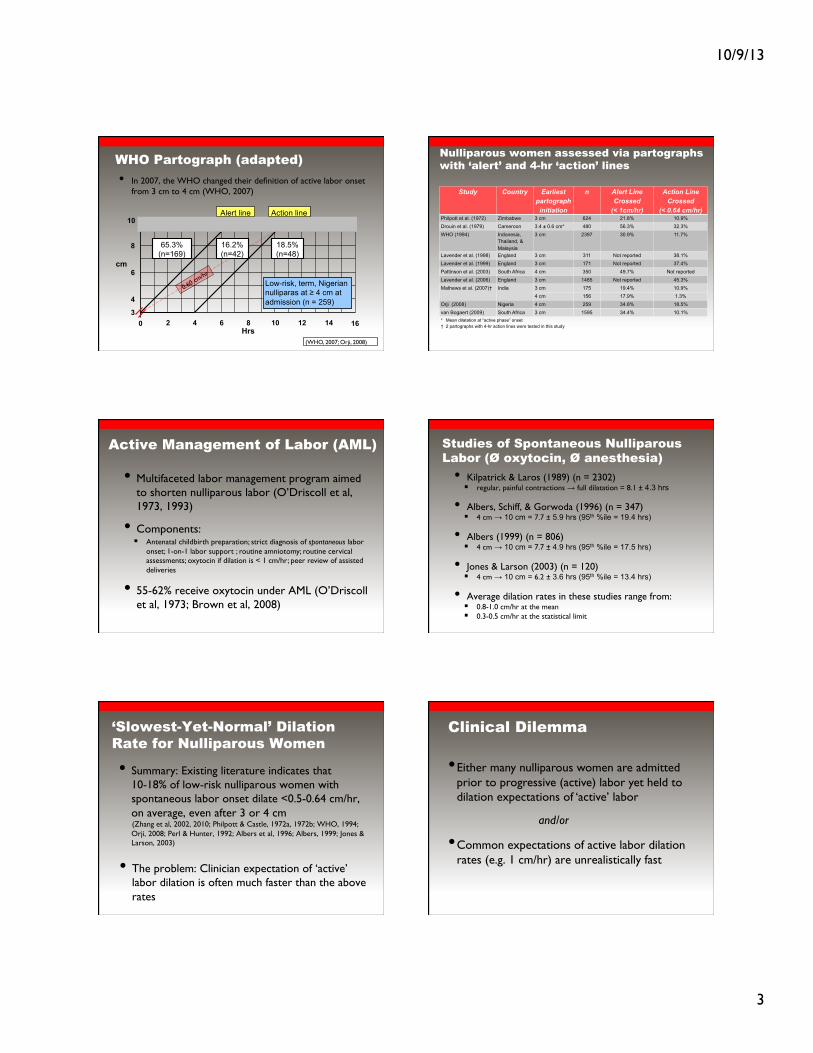
WHO Partograph (adapted)
(WHO, 2007; Orji, 2008)!
3 10 16 0 2 4 6 8 12 14
8
10
4
6 cm
Hrs
Alert line Action line
18.5% (n=48)
65.3% (n=169)
• In 2007, the WHO changed their definition of active labor onset from 3 cm to 4 cm (WHO, 2007)!
Low-risk, term, Nigerian nulliparas at ! 4 cm at admission (n = 259) !
0.60 cm/hr!
16.2% (n=42)
Nulliparous women assessed via partographs with ‘alert’ and 4-hr ‘action’ lines
Study! Country! Earliest partograph initiation!
n! Alert Line Crossed !
(< 1cm/hr)!
Action Line Crossed !
(< 0.64 cm/hr)!Philpott et al. (1972)! Zimbabwe! 3 cm! 624! 21.8%! 10.9%!
Drouin et al. (1979)! Cameroon! 3.4 ± 0.6 cm*! 480! 56.3%! 32.3%!
WHO (1994)! Indonesia, Thailand, & Malaysia!
3 cm! 2397! 30.9%! 11.7%!
Lavender et al. (1998)! England! 3 cm! 311! Not reported! 38.1%!
Lavender et al. (1999)! England! 3 cm! 171! Not reported! 37.4%!
Pattinson et al. (2003)! South Africa! 4 cm! 350! 49.7%! Not reported!Lavender et al. (2006)! England! 3 cm! 1485! Not reported! 45.3%!
Mathews et al. (2007)†! India! 3 cm! 175! 19.4%! 10.9%!
4 cm ! 156! 17.9%! 1.3%!
Orji (2008)! Nigeria! 4 cm! 259! 34.8%! 18.5%!
van Bogaert (2009)! South Africa! 3 cm! 1595! 34.4%! 10.1%!*! Mean dilatation at “active phase” onset!† 2 partographs with 4-hr action lines were tested in this study!
Active Management of Labor (AML)
• Multifaceted labor management program aimed to shorten nulliparous labor (O’Driscoll et al, 1973, 1993)!
• Components:!! Antenatal childbirth preparation; strict diagnosis of spontaneous labor
onset; 1-on-1 labor support ; routine amniotomy; routine cervical assessments; oxytocin if dilation is < 1 cm/hr; peer review of assisted deliveries!
• 55-62% receive oxytocin under AML (O’Driscoll et al, 1973; Brown et al, 2008)!
Studies of Spontaneous Nulliparous Labor (Ø oxytocin, Ø anesthesia)
• Kilpatrick & Laros (1989) (n = 2302)!! regular, painful contractions " full dilatation = 8.1 ± 4.3 hrs!
• Albers, Schiff, & Gorwoda (1996) (n = 347)!! 4 cm " 10 cm = 7.7 ± 5.9 hrs (95th %ile = 19.4 hrs)!
• Albers (1999) (n = 806)!! 4 cm " 10 cm = 7.7 ± 4.9 hrs (95th %ile = 17.5 hrs)!
• Jones & Larson (2003) (n = 120)!! 4 cm " 10 cm = 6.2 ± 3.6 hrs (95th %ile = 13.4 hrs)!
• Average dilation rates in these studies range from:!! 0.8-1.0 cm/hr at the mean!! 0.3-0.5 cm/hr at the statistical limit!
‘Slowest-Yet-Normal’ Dilation Rate for Nulliparous Women
• Summary: Existing literature indicates that 10-18% of low-risk nulliparous women with spontaneous labor onset dilate <0.5-0.64 cm/hr, on average, even after 3 or 4 cm !(Zhang et al, 2002, 2010; Philpott & Castle, 1972a, 1972b; WHO, 1994; Orji, 2008; Perl & Hunter, 1992; Albers et al, 1996; Albers, 1999; Jones & Larson, 2003)!
• The problem: Clinician expectation of ‘active’ labor dilation is often much faster than the above rates!
Clinical Dilemma
• Either many nulliparous women are admitted prior to progressive (active) labor yet held to dilation expectations of ‘active’ labor !
and/or !
• Common expectations of active labor dilation rates (e.g. 1 cm/hr) are unrealistically fast!

10/9/13!
4!
Consequences of Earlier Admission after Spontaneous Labor Onset
• Admissions at < 3 cm (vs. > 3 cm)!
# In-hospital labor time, oxytocin use, epidural use, dystocia diagnoses, & cesarean deliveries!
$ Satisfaction with birth experience!! !(McNiven et al., 1998; Impey et al., 2000; Rahnama et al., 2006)!
• Admissions at < 4 cm (vs. > 4 cm)!
# In-hospital labor time, oxytocin use, epidural use, active phase arrest, & cesarean deliveries!! !(Holmes et al., 2001; Bailit et al., 2005; Mikolajczyk et al., 2008)!
!
!p < 0.01 for all findings!
Timing of Admission to Hospital After Spontaneous Labor Onset
• Low-risk, nulliparas at ! 37 wks with a singleton, cephalic fetus admitted for spontaneous labor onset by their provider (n = 216)!! 114 (52.8%) were admitted in pre-active labor!! 102 (47.2%) were admitted in active labor!
• Women in pre-active labor were more likely to undergo:!! Oxytocin augmentation (84.2% v. 45.1%, respectively; OR 6.5, 95% CI
3.43-12.27)!! Cesarean delivery (15.8% v. 6.9%, respectively; OR 2.6, 95% CI 1.02-6.37)!
• In addition:!! All cesareans for dystocia (n = 10) were in pre-active group (p < 0.01) (7 of
10 were performed at ≤ 5 cm)!! In-hospital labor time >4 hrs longer in pre-active group (p < 0.001)!! Max temps during labor were higher in pre-active group (p = 0.026)!
!
!Neal et al (In review)!
Consequences of Unrealistically Fast Cervical Dilation Expectations
↑ diagnoses of dystocia, i.e., “slow, abnormal progression of labor” (ACOG, 2003)!
↑ intervention(s) to accelerate labor with inherent risks!
↑ unnecessary cesareans!
!
!
!
Dystocia
• “Slow, abnormal progression of labor” (ACOG, 2003)!
• In practice, diagnoses of dystocia are most often based on ambiguously defined delays in dilation beyond which labor augmentation is deemed justified!
• Consequence: Dystocia is known to be “over-diagnosed” (Cunningham et al, 2010) !
• Leading indication for primary cesareans accounting for as much as 50% of all nulliparous cesareans (ACOG, 2000, 2003; Cunningham et al, 2010)!
Oxytocin augmentation
• Dystocia over-diagnosis largely explains why approximately 50% of nulliparous women with spontaneous labor onset receive oxytocin augmentation during labor (Zhang et al, 2002, 2010; Treacy et al, 2006; Oscarsson et al, 2006) !
• This is concerning because oxytocin: !! is a “high-alert medication” (ISMP, 2008)!
! is the intervention most commonly associated with preventable adverse perinatal outcomes (Clark et al, 2008, 2009) !
! misuse is involved in half of all paid obstetric litigation claims (Clark, 2008) !
• Any overuse of oxytocin imposes unnecessary risk on the mother and fetus during labor !
Cesareans • U.S. cesarean rates among term, low-risk, nulliparous women with
vertex fetus = 26.4% (CDC, 2013)!
• Dystocia accounts for 50% of these (~13%) (ACOG, 2000, 2003; Cunningham et al, 2010)!
• 90% of primary cesareans are followed by repeats, thus, the majority of all cesareans are attributable to the diagnosis of dystocia that lead to the first (CDC, 2013) !
• Total cesarean rate in U.S. = 32.8% (Martin et al, 2013)!
! Highest rate = Louisiana (39.9%); Lowest rate = Alaska (22.4%)!
! Minnesota (26.8%); Ohio (31.2%)!
• The concern: the best birth outcomes occur with cesarean rates of 5-10% while rates higher than 15% are associated with excessive morbidities and mortality (WHO, 1995; Villar et al, 2006, 2007; Lumbiganon et al, 2010) !
10/9/13!
5!
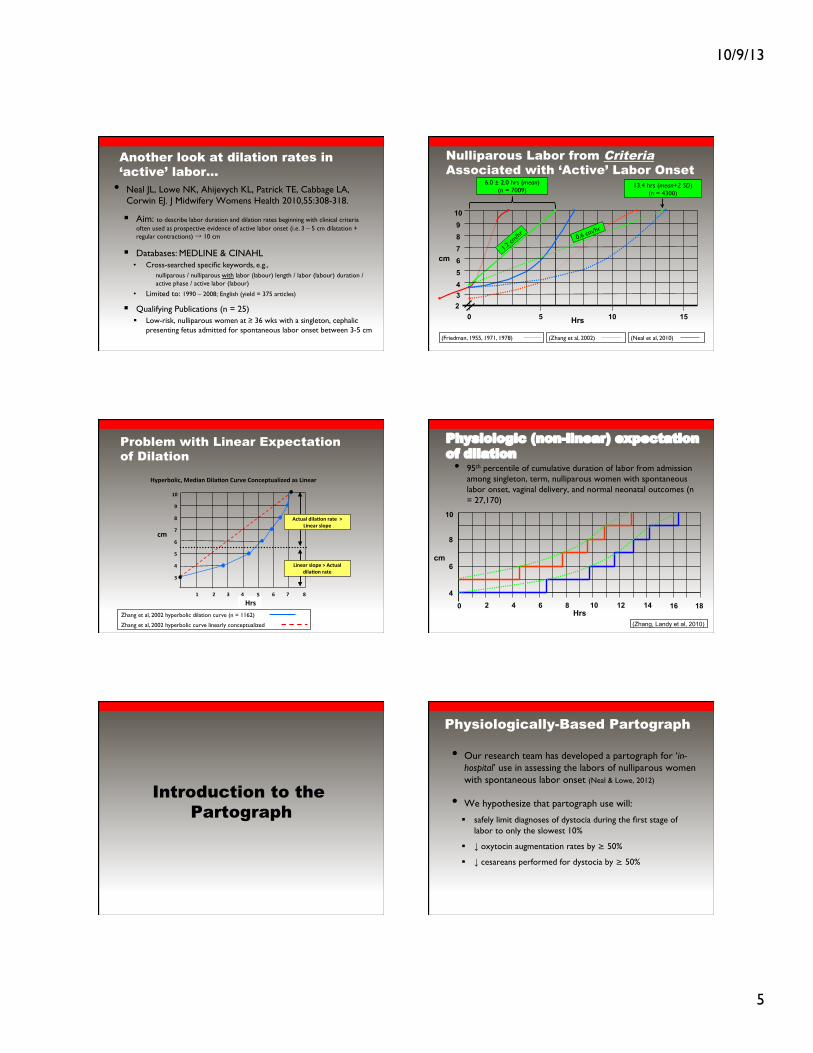
• Neal JL, Lowe NK, Ahijevych KL, Patrick TE, Cabbage LA, Corwin EJ. J Midwifery Womens Health 2010,55:308-318.!
! Aim: to describe labor duration and dilation rates beginning with clinical criteria often used as prospective evidence of active labor onset (i.e. 3 – 5 cm dilatation + regular contractions) → 10 cm!
! Databases: MEDLINE & CINAHL!• Cross-searched specific keywords, e.g.,!
nulliparous / nulliparous with labor (labour) length / labor (labour) duration / active phase / active labor (labour)!
• Limited to: 1990 – 2008; English (yield = 375 articles)!
! Qualifying Publications (n = 25)!! Low-risk, nulliparous women at ! 36 wks with a singleton, cephalic
presenting fetus admitted for spontaneous labor onset between 3-5 cm!
Another look at dilation rates in ‘active’ labor…
Nulliparous Labor from Criteria Associated with ‘Active’ Labor Onset
2
Hrs
cm
5 10 15 0
8
4 3
7 6
9 10
5
(Friedman, 1955, 1971, 1978)! (Zhang et al, 2002)!
13.4 hrs (mean+2 SD)!(n = 4300)!
0.6 cm/hr!
6.0 ± 2.0 hrs (mean)!(n = 7009)!
1.2 cm
/hr!
(Neal et al, 2010)!
Problem with Linear Expectation of Dilation
!!"#$
%
&
'
(
)
*
+
,-
, ) * + & ' % .
/0
"123#4567/8!93:7;<!=76;>5<!?@#A3!?5</32B@;67C3:!;$!D7<3;#
D7<3;#!$6523!E!F/B@;6!:76;>5<!#;B3
F/B@;6!:76;>5<!#;B3!!E!D7<3;#!$6523
Zhang et al, 2002 hyperbolic dilation curve (n = 1162) !
Zhang et al, 2002 hyperbolic curve linearly conceptualized !
Physiologic (non-linear) expectation of dilation
(Zhang, Landy et al, 2010)
• 95th percentile of cumulative duration of labor from admission among singleton, term, nulliparous women with spontaneous labor onset, vaginal delivery, and normal neonatal outcomes (n = 27,170)!
10 16 0 2 4 6 8 12 14 Hrs
8
10
4
6 cm
18
Introduction to the
Partograph
Physiologically-Based Partograph
• Our research team has developed a partograph for ‘in-hospital’ use in assessing the labors of nulliparous women with spontaneous labor onset (Neal & Lowe, 2012)!
• We hypothesize that partograph use will:!
! safely limit diagnoses of dystocia during the first stage of labor to only the slowest 10% !
! ! oxytocin augmentation rates by ≥ 50%!
! ! cesareans performed for dystocia by ≥ 50%!

10/9/13!
6!
Principles of Partograph
Principle 1.! Active labor onset must be accurately diagnosed before the rate of cervical dilation (cm/hr) is used to assess labor progression.!
Principle 2.! Expectations of cervical dilation (cm/hr) for the population must be appropriately-defined.!!
Principle 3.! Cervical dilation rates progressively accelerate throughout the majority of active labor.!!
Principle 4.! The time duration necessary to dilate from one centimeter to the next is more variable in earlier active labor than in more advanced active labor.!
Criteria for Partograph Use!
• Spontaneous labor onset !! regular, painful contractions (" 2 in 10 min)!! complete or near complete effacement!! membranes intact or ruptured!! bloody show absent or present !
• Initiated with labor and a qualifying cervical exam!! at 4 cm dilatation if being preceded by cervical change over
time (i.e., ≥ 1 cm in ≤ 2 hr window) = earliest start !! at ≥ 5 cm regardless of the rate of previous cervical change
= direct start!
• Initiated and continued only when no complications requiring urgent attention through intervention exist!
Partograph for Low-Risk, Nulliparous Women with Spontaneous Labor Onset"
x
o
1:00
pm
0
5:00
pm
4
4:00
pm
3
3:00
pm
2!
2:00
pm
1
x
o
3:15
pm
6:00
pm
5!
7:00
pm
6
8:00
pm
7
9:00
pm
8
Documenting Cervical Examinations
• Cervical exams are crude assessments that rely solely on the clinical experience and proprioceptive skill of the examiner!
• Clinicians accurately determine actual cervical dilatation in only half of all cases (Buchmann et al, 2007; Huhn et al, 2004; Phelps et al, 1995; Tuffnell et al, 1989) !
! Accurate to ± 1 cm in 90% of cases!
• On partograph: dilatations reported as a range are rounded down to the nearest integer dilatation, e.g., “4-5 cm” is rounded to 4 cm.!
Partograph Use Examples
Example 1: Labor remaining left of the dystocia line without delay

10/9/13!
7!
Example 2: Labor moving right of the dystocia line
Example 3: Labor remaining left of the dystocia line with delay
The ‘Big Picture’
• More than enough research evidence exists to support the revision of existing ‘active’ labor dilation rate expectations!
• Such physiologically-based revision should improve birth safety and outcomes by safely:!! ! diagnoses of dystocia during the first stage of labor !
! ! oxytocin augmentation rates!
! ! cesareans performed for dystocia!
• Midwives can take a lead in this area and our Hallmarks of Midwifery can be the guide !
References ACNM. Core Competencies for Basic Midwifery Practice, June 2007. Available at http://www.midwife.org !
ACOG Practice Bulletin Number 49, December 2003: Dystocia and augmentation of labor. Obstet Gynecol 2003;102(6):1445-1454.!
ACOG. Evaluation of Cesarean Delivery / [Developed Under the Direction of the Task Force on Cesarean Delivery Rates, Roger K. Freeman ... et al.]. Washington, D.C.: ACOG; 2000.!
Bailit JL, Dierker L, Blanchard MH, Mercer BM. Outcomes of women presenting in active versus latent phase of spontaneous labor. Obstet Gynecol 2005; 105:77-9.!
Battista LR, Wing DA. Abnormal labor and induction of labor. In: S. G. Gabbe, J. R. Niebyl and J. L. Simpson, editors. Obstetrics: Normal and Problem Pregnancies. Philadelphia:Churchill Livingstone; 2007.!
Boyle A, Reddy UM. Epidemiology of cesarean delivery: the scope of the problem. Semin Perinatol 2012;36:308-314.!
Brennan DJ, Robson MS, Murphy M, et al. Comparative analysis of international cesarean delivery rates using 10-group classification identifies significant variation in spontaneous labor. Am J Obstet Gynecol 2009;201:e1-e8.!
Brennan DJ, Murphy M, Robson MS, et al. The singleton, cephalic, nulliparous woman after 36 weeks of gestation: contribution to overall cesarean delivery rates. Obstet Gynecol 2011;117:273-279.!
Brown HC, Paranjothy S, Dowswell T, Thomas J. Package of care for active management in labour for reducing caesarean section rates in low-risk women. Cochrane Database Syst Rev 2008:CD004907.!
!
References Bugg GJ, Siddiqui F, Thornton JG. Oxytocin versus no treatment or delayed treatment for slow progress in the first stage of spontaneous labour. Cochrane Database Syst Rev . 2011:CD007123.!
Buchmann EJ, Libhaber E. Accuracy of cervical assessment in the active phase of labour. BJOG 2007;114(7):833-837. !
CDC. Healthy People 2020. Accessed August 1, 2013.!
CDC. Healthy People 2020 Summary of Objectives. Available at: http://www.healthypeople.gov/2020/topicsobjectives2020/pdfs/MaternalChildHealth.pdf. Accessed January 10, 2012. !
CDC. Rates of cesarean delivery – United States, 1993. MMWR 1995; 44(15):1-4.!
Clark SL, Simpson KR, Knox GE, Garite TJ. Oxytocin: new perspectives on an old drug. Am J Obstet Gynecol . 2009;200:35.e1-35.e6. !
Clark SL, Belfort MA, Dildy GA, Meyers JA. Reducing obstetric litigation through alterations in practice patterns. Obstet Gynecol . 2008;112:1279-1283. !
Cleary R, Beard RW, Chapple J, Coles J, Griffin M, Joffe M et al. The standard primipara as a basis for inter-unit comparisons of maternity care. Br J Obstet Gynaecol 1996; 103:223-9.!
Cunningham, FG, Leveno, KJ, Bloom, SL, Hauth, JC, Rouse, DJ, Spong, CY, editor. Williams obstetrics. 23rd ed. New York: McGraw-Hill; 2010.!
Friedman EA, editor. Labor: Clinical evaluation and management. 2nd ed. New York: Appleton-Century-Crofts; 1978.!
!
!

10/9/13!
8!
References Friedman EA, Kroll BH. Computer analysis of labor progression. III. Pattern variations by parity. J Reprod Med 1971; 6:179-83.!
Friedman EA. Primigravid labor: a graphicostatistical analysis. Obstet Gynecol 1955; 6:567-89.!
Holmes P, Oppenheimer LW, Wen SW. The relationship between cervical dilatation at initial presentation in labour and subsequent intervention. BJOG 2001; 108:1120-4.!
Huhn KA, Brost BC. Accuracy of simulated cervical dilation and effacement measurements among practitioners. Am J Obstet Gynecol 2004;191(5):1797-1799. !
Impey L, Hobson J, O'Herlihy C. Graphic analysis of actively managed labor: Prospective computation of labor progress in 500 consecutive nulliparous women in spontaneous labor at term. Am J Obstet Gynecol 2000; 183:438-43.!
Institute for Safe Medication Practices. ISMP's list of high-alert medications. 2008; Available at: http://www.ismp.org/tools/highalertmedications.pdf. Accessed July 28, 2011.!
Lumbiganon P, Laopaiboon M, Gülmezoglu AM, Souza JP, Taneepanichskul S, Ruyan P, et al. Method of delivery and pregnancy outcomes in Asia: the WHO global survey on maternal and perinatal health 2007-08. Lancet 2010;375(9713):490-499.!
Main EK, Moore D, Farrell B, Schimmel LD, Altman RJ, Abrahams C et al. Is there a useful cesarean birth measure? assessment of the nulliparous term singleton vertex cesarean birth rate as a tool for obstetric quality improvement. Am J Obstet Gynecol 2006; 194:1644-1652.!
!
References Main EK, Bloomfield L, Hunt G. Development of a large-scale obstetric quality-improvement program that focused on the nulliparous patient at term. Am J Obstet Gynecol 2004; 190:1747-1756.!
Martin JA, Hamilton BE, Sutton PD, Ventura SJ, Menacker F, Kirmeyer S. Births: final data for 2004. Natl Vital Stat Rep 2006; 55(1): 1-102. !
Martin JA, Hamilton BE, Ventura SJ, Osterman MJK, Mathews TJ. Births: Final data for 2011. Natl Vital Stat Rep. 2013;62(1):1-90.!
McNiven PS, Williams JI, Hodnett E, Kaufman K, Hannah ME. An early labor assessment program: A randomized, controlled trial. Birth 1998; 25:5-10.!
Mikolajczyk R, Zhang J, Chan L, Grewal J. Early versus late admission to labor/delivery, labor progress and risk of caesarean section in nulliparous women. Am J Obstet Gynecol 2008; 199:S49.!
Neal JL, Lamp JM, Buck JS, Lowe NK, Gillespie SL, Ryan SL. Outcomes of nulliparous women with spontaneous labor onset admitted to hospitals in pre-active versus active labor. Journal of Midwifery & Women’s Health (In review).!
Neal JL, Lowe NK, Ahijevych KL, Patrick TE, Cabbage LA, Corwin EJ. (2010). ‘Active labor’ duration and dilation rates among low-risk, nulliparous women with spontaneous labor onset: a systematic review. Journal of Midwifery & Women’s Health, 55(4), 308-318.!
Neal JL, Lowe NK, Patrick TE, Cabbage LA, Corwin EJ. (2010). What is the ‘slowest yet normal’ cervical dilation rate among nulliparous women with spontaneous labor onset? Journal of Obstetric Gynecologic and Neonatal Nursing, 39(4), 361-369.!
!
!
!
References Neal JL, Lowe NK. (2012). Physiologic partograph to improve birth safety and outcomes among low-risk, nulliparous women with spontaneous labor onset. Medical Hypotheses, 78(2), 319-326.!
O'Driscoll K, Meagher D, Boylan P, editors. Active management of labor: The Dublin experience. 3rd ed. Aylesbury, England: Mosby; 1993.!
O'Driscoll K, Stronge JM, Minogue M. Active management of labour. Br Med J 1973; 3:135-7.!
Orji E. Evaluating progress of labor in nulliparas and multiparas using the modified WHO partograph. Int J Gynaecol Obstet 2008; 102:249-52.!
Oscarsson ME, Amer-Wåhlin I, Rydhstroem H, Källén K. Outcome in obstetric care related to oxytocin use. A population-based study. Acta Obstet Gynecol Scand 2006;85(9):1094-1098. !
Peisner DB, Rosen MG. Transition from latent to active labor. Obstet Gynecol 1986; 68:448-51.!
Perl FM, Hunter DJ. What cervical dilatation rate during active labour should be considered abnormal? Eur J Obstet Gynecol Reprod Biol 1992; 45:89-92.!
Phelps JY, Higby K, Smyth MH, Ward JA, Arredondo F, Mayer AR. Accuracy and intraobserver variability of simulated cervical dilatation measurements. Am J Obstet Gynecol 1995;173(3):942-945. !
Philpott RH. Graphic records in labour. Br Med J 1972; 4:163-5.!
Philpott RH, Castle WM. Cervicographs in the management of labour in primigravidae. I. The alert line for detecting abnormal labour. J Obstet Gynaecol Br Commonw 1972; 79:592-8.!
Philpott RH, Castle WM. Cervicographs in the management of labour in primigravidae. II. The action line and treatment of abnormal labour. J Obstet Gynaecol Br Commonw 1972; 79:599-602.!
!
!
!
References Rahnama P, Ziaei S, Faghihzadeh S. Impact of early admission in labor on method of delivery. Int J Gynaecol Obstet 2006; 92:217-20.!
Society of Obstetricians and Gynaecologists of Canada. Policy statement number 40: Dystocia. 1995.!
Suzuki R, Horiuchi S, Ohtsu H. Evaluation of the labor curve in nulliparous Japanese women. Am J Obstet Gynecol . 2010;203:226.e1-226.e6. !
Treacy A, Robson M, O'Herlihy C. Dystocia increases with advancing maternal age. Am J Obstet Gynecol 2006;195(3):760-763.!
Tuffnell DJ, Bryce F, Johnson N, Lilford RJ. Simulation of cervical changes in labour: reproducibility of expert assessment. Lancet 1989;2(8671):1089-1090. !
Varney H, Kriebs JM, Gegor CL. Varney's Midwifery. Boston:Jones and Bartlett Publishers, Inc.; 2004.!
Villar J, Valladares E, Wojdyla D, Zavaleta N, Carroli G, Velazco A, et al. Caesarean delivery rates and pregnancy outcomes: the 2005 WHO global survey on maternal and perinatal health in Latin America. Lancet 2006;367(9525):1819-1829. !
Villar J, Carroli G, Zavaleta N, Donner A, Wojdyla D, Faundes A, et al. Maternal and neonatal individual risks and benefits associated with caesarean delivery: multicentre prospective study. BMJ 2007;335(7628):1025-1025.!
World Health Organization Health. Department of Reproductive Health and Research. Integrated management of pregnancy and childbirth. managing complications in pregnancy and childbirth: A guide for midwives and doctors. 2007.!
!
!
!
!
References World Health Organization. Division of Family Health. Maternal Health and Safe Motherhood Programme. Preventing prolonged labour: A practical guide. The partograph. Part I: Principles and strategy. 1994; WHO/FHE/MSM/93.8.!
World Health Organization. Division of Family Health. Maternal Health and Safe Motherhood Programme. Preventing prolonged labour: A practical guide. the partograph. Part II: User's manual. 1994; WHO/FHE/MSM/93.9.!
World Health Organization. Division of Family Health. Maternal Health and Safe Motherhood Programme. The partograph: The application of the WHO partograph in the management of labour. Report of a WHO multicentre study 1990-1991. 1994; WHO/FHE/MSM/94.4.!
World Health Organization. Joint interregional conference on appropriate technology for birth. Fortaleza, Brazil. April 22-26, 1985.!
World Health Organization. World Health Organization partograph in management of labour. World Health Organization maternal health and safe motherhood programme. Lancet 1994; 343:1399-404.!
Zhang J, Landy HJ, Branch DW, Burkman R, Haberman S, Gregory KD, et al. Contemporary patterns of spontaneous labor with normal neonatal outcomes. Obstet Gynecol 2010;116(6):1281-1287. !
Zhang J, Troendle J, Mikolajczyk R, Sundaram R, Beaver J, Fraser W. The natural history of the normal first stage of labor. Obstet Gynecol 2010; 115:705-10.!
Zhang J, Troendle JF, Yancey MK. Reassessing the labor curve in nulliparous women. Am J Obstet Gynecol 2002; 187:824-8.!
!
!
!


![[SẢN] W4.3 The Partograph Part I WHO 1993](https://img.pdfslide.us/doc/110x75/577cbcc51a28aba7118dc4c2/san-w43-the-partograph-part-i-who-1993.jpg)
![[SẢN] W4.3 The Partograph Part III WHO 1993](https://img.pdfslide.us/doc/110x75/577cbcc51a28aba7118dc4c3/san-w43-the-partograph-part-iii-who-1993.jpg)


![[SẢN] W4.3 - The partograph WHO 1993 - The Partograph Part II WHO 1993](https://img.pdfslide.us/doc/110x75/577cbcc01a28aba7118dc1c6/san-w43-the-partograph-who-1993-the-partograph-part-ii-who-1993-httpbsquochoaiga.jpg)