Embed Size (px)
Citation preview
Microbial Detection and Quantification Using the IntelliQube® from Douglas Scientific®
ABSTRACTNucleic Acid Testing (NAT) is the preferred method for detection and quantification of microorganisms. Evolving research has uncovered NAT methods which are increasingly accurate, reliable and economical. These methods are critical for their viability as part of future human diagnostics and food safety testing routines. To address these key needs, Douglas Scientific has developed the IntelliQube, a fully integrated liquid handling and real-time quantitative PCR instrument optimized for use with miniaturized reactions in 384- or 768-well Array Tape®. The study described here demonstrates the ability of the IntelliQube to process miniaturized reaction volumes reaction volumes down to 1.6 µL for commercially available NAT kits, while retaining detection sensitivity and dynamic range. The kits used in this study were obtained from Primerdesign Ltd, a manufacturer and supplier of quantitative real-time PCR kits for the detection and quantification of numerous pathogens.
INTRODUCTIONNucleic Acid Testing (NAT) is a powerful tool for the quantification of microorganisms. NATs are used in many fields, ranging from food safety to human diagnostics. The quantitative detection of pathogens can assist in the quality control of industrial processes to ensure there is no microbial contamination present. Likewise, NATs used in research can ultimately impact direct patient therapy in a timely and cost effective manner, which can reduce the extent of patient morbidity and mortality associated with microbial infections. Development of accurate and economical methods for microbial quantitative analysis is therefore of utmost importance for ensuring the safety of the food we eat and the proper diagnosis of infections. While several methods and instruments are on the market for this purpose, there remains an unmet need for a fully automated method of nucleic acid testing that gives research laboratories the flexibility and scalability necessary to economically expand availability of microbial quantitative analysis.
The IntelliQube from Douglas Scientific is designed to address this need by producing accurate and reliable results with walk-away automation that substantially reduces reagent expenditures and labor requirements. The IntelliQube is a fully integrated instrument that combines liquid handling with real-time quantitative PCR (qPCR) analysis in miniaturized reaction volumes. The system utilizes Array Tape in a unique and innovative 768-well format in place of microplates. Array Tape is a thin and flexible polypropylene consumable that, in combination with miniature reaction volumes (1.6 μL), enables both outstanding PCR performance and profound reagent savings.
In this study, the IntelliQube was used to perform miniaturized reactions by reducing the manufacturer-recommended volume of 20 µL down to 1.6 µL for three commercially available microbial quantitation kits, obtained from Primerdesign Ltd. The three kits target broad spectrum Escherichia coli, pathogenic Salmonella, and Human Papillomavirus 16. Reaction setup, thermal cycling, and real-time fluorescence detection were all performed inline on the IntelliQube. As-say performance was assessed using a standard curve over a concentration range of five logs. An additional comparative data set was also generated with the same assays using a ViiA™ 7 Real-Time PCR System (Thermo Fisher Scientific Inc.).
Microbial Detection and Quantification Using the IntelliQube from Douglas Scientific 1
PARTNERING WITH YOU TO MAKE THE WORLD A BET TER PLACE ®
Microbial Detection and Quantification Using the IntelliQube from Douglas Scientific 2
MATERIALS AND METHODSAssays and Reagents: Three standard assay kits were purchased from Primerdesign Ltd: Escherichia coli (All Strains) Cat. No. Path-E coli generic-standard; All pathogenic Salmonella Species Cat. No. Path-Salmonella invA-standard; and Human Papillomavirus 16 Cat. No. Path-HPV16-stan-dard. The lyophilized assay stocks in all three kits were rehydrated according to the manufacturer’s instructions to create a 20X stock. The positive control templates were rehydrated to a stock concentration of 1.25 x 10⁵ copies/µL using the template preparation buffer supplied with the kit. Serial dilutions from 1 x 10⁵ – 0.977 copies/reaction were prepared as described in Table 1. PerfeCTa® qPCR Toughmix®, Low Rox™ (Quanta BioSciences) was used according to the manufacturer’s instructions for all reactions. The assays were added at 2X concentration to the 2X master mix to achieve a final concentration of 1X in the PCR reaction.
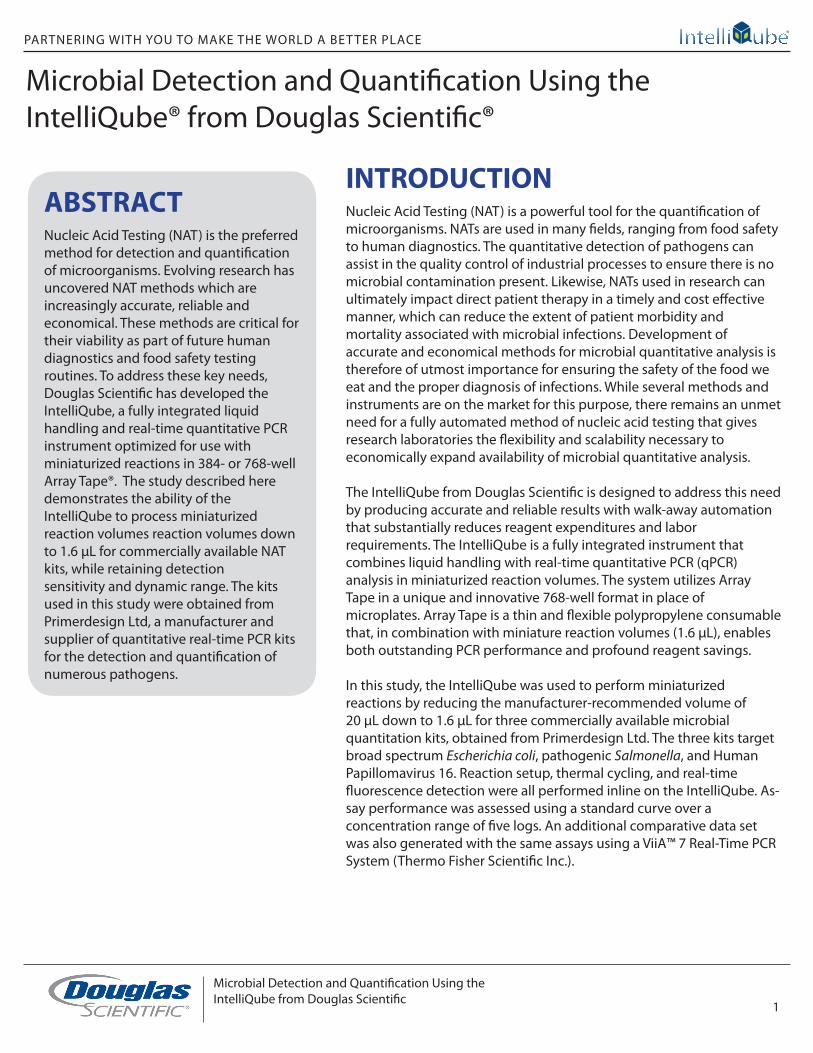
Instrumentation: The IntelliQube (Figure 1) was used for reaction set-up, thermal cycling, and real-time fluorescence detection. DNA samples (800 nL) were dispensed into 768-well Array Tape with the multi-channel, Pipette head from CyBi® Product Line. Master mix containing 2X assay (800 nL) was dispensed with the non-contact dispense jet to create 1.6 µL total volume reactions. A total of 16 replicates of each dilution were dispensed. Thermal cycling conditions are summarized in Table 2. Fluorescence values were obtained at the end of each cycle over the course of 50 cycles to generate real-time amplification curves. GenEx PCR Analysis Software (MultiD Analyses) was used for standard curve data analysis and estimation of Limit of Detection (LoD) and Limit of Quantification (LoQ) of each assay. Grubb’s statistical test was used to identify outliers.
In a second experiment looking at side-by-side performance of the IntelliQube (1.6 µL reactions) and a ViiA 7 qPCR instrument (20 µL reactions), a dilution series of 1 x 10⁵ – 10 copies/reaction was analyzed. The 20 µL reactions were setup following the assay kit protocols. Four and eight replicates per dilution were used on the ViiA 7 and IntelliQube, respectively. A comparison of PCR efficiencies and linearity of the assays was performed using the GenEx PCR Analysis Software.
Standard Dilution Factor
Concentration(copies/rxn)
1 N/A 100,000
2 1:10 10,000
3 1:10 1,000
4 1:2 500
5 1:2 250
6 1:2 125
7 1:2 62.5
8 1:2 31.25
9 1:2 15.625
10 1:2 7.8125
11 1:2 3.90625
12 1:2 1.953125
13 1:2 0.976563
Table 1: Serial dilution scheme of positive control templates.
Step Time Temp
Enzyme Activation 3 min. 95 ˚C
50 CyclesDenaturation 15 sec. 95 ˚C
Annealing/Extension 60 sec. 60 ˚C
Table 2: Thermal cycling conditions.
Figure 1. The IntelliQube is a fully integrated liquid handling and real-time quantitative PCR instrument optimized for use with miniaturized reactions in 384- or 768-well Array Tape.
Microbial Detection and Quantification Using the IntelliQube from Douglas Scientific 3
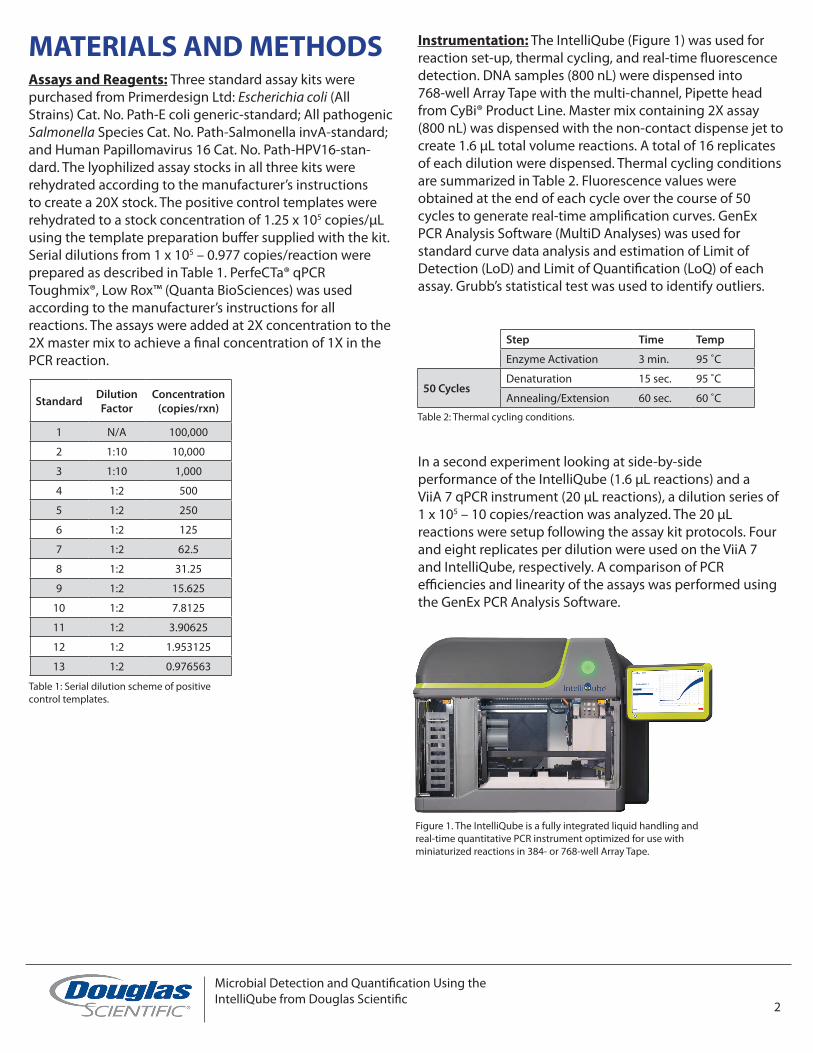
Results and DiscussionThree commercially available microbial detection kits from Primerdesign Ltd were successfully run on the IntelliQube. The positive control templates provided by each kit were used to assess assay performance in miniaturized 1.6 µL reactions. All three kits were tested over a dynamic range of five logs (105-0.977 copies/reaction). A standard curve was used to determine the LoD of each assay (Figure 2). The standard curve dilutions are plotted as Cq versus log10 concentration of the samples. All calculations assumed 95% confidence. The precision of the standard curve was assessed by calculating the Working-Hoteling confidence band, which is indicated in the graph by two dashed lines in red on each side of the best linear fit shown in blue. The spread of replicates was shown to increase with decreasing number of target molecules, as is expected due to sampling ambiguity. As the number of target molecules per reaction volume becomes lower, the reproducibility is compromised, which is best explained by the Poisson distribution.
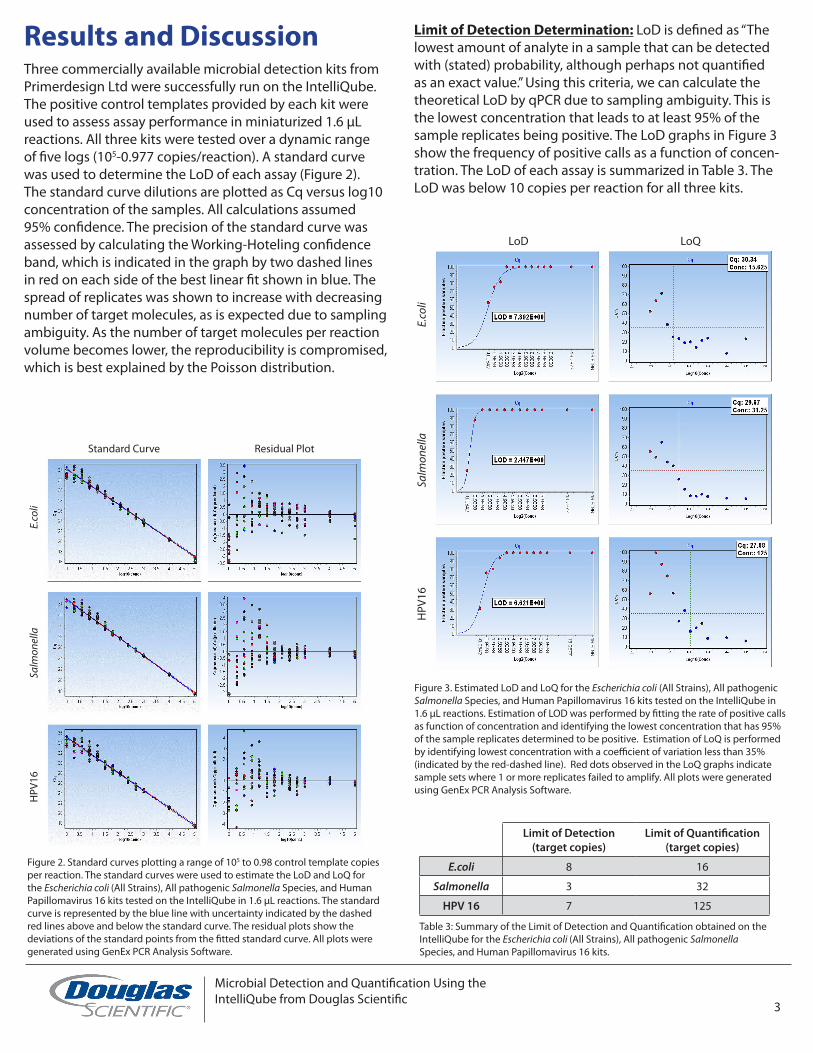
Limit of Detection Determination: LoD is defined as “The lowest amount of analyte in a sample that can be detected with (stated) probability, although perhaps not quantified as an exact value.” Using this criteria, we can calculate the theoretical LoD by qPCR due to sampling ambiguity. This is the lowest concentration that leads to at least 95% of the sample replicates being positive. The LoD graphs in Figure 3 show the frequency of positive calls as a function of concen-tration. The LoD of each assay is summarized in Table 3. The LoD was below 10 copies per reaction for all three kits.
Standard Curve Residual Plot
E.co
liSa
lmon
ella
HPV
16
Figure 2. Standard curves plotting a range of 105 to 0.98 control template copies per reaction. The standard curves were used to estimate the LoD and LoQ for the Escherichia coli (All Strains), All pathogenic Salmonella Species, and Human Papillomavirus 16 kits tested on the IntelliQube in 1.6 µL reactions. The standard curve is represented by the blue line with uncertainty indicated by the dashed red lines above and below the standard curve. The residual plots show the deviations of the standard points from the fitted standard curve. All plots were generated using GenEx PCR Analysis Software.
Figure 3. Estimated LoD and LoQ for the Escherichia coli (All Strains), All pathogenic Salmonella Species, and Human Papillomavirus 16 kits tested on the IntelliQube in 1.6 µL reactions. Estimation of LOD was performed by fitting the rate of positive calls as function of concentration and identifying the lowest concentration that has 95% of the sample replicates determined to be positive. Estimation of LoQ is performed by identifying lowest concentration with a coefficient of variation less than 35% (indicated by the red-dashed line). Red dots observed in the LoQ graphs indicate sample sets where 1 or more replicates failed to amplify. All plots were generated using GenEx PCR Analysis Software.
LoD LoQ
E.co
liSa
lmon
ella
HPV
16
Limit of Detection (target copies)
Limit of Quantification (target copies)
E.coli 8 16
Salmonella 3 32
HPV 16 7 125
Table 3: Summary of the Limit of Detection and Quantification obtained on the IntelliQube for the Escherichia coli (All Strains), All pathogenic Salmonella Species, and Human Papillomavirus 16 kits.
Microbial Detection and Quantification Using the IntelliQube from Douglas Scientific 4
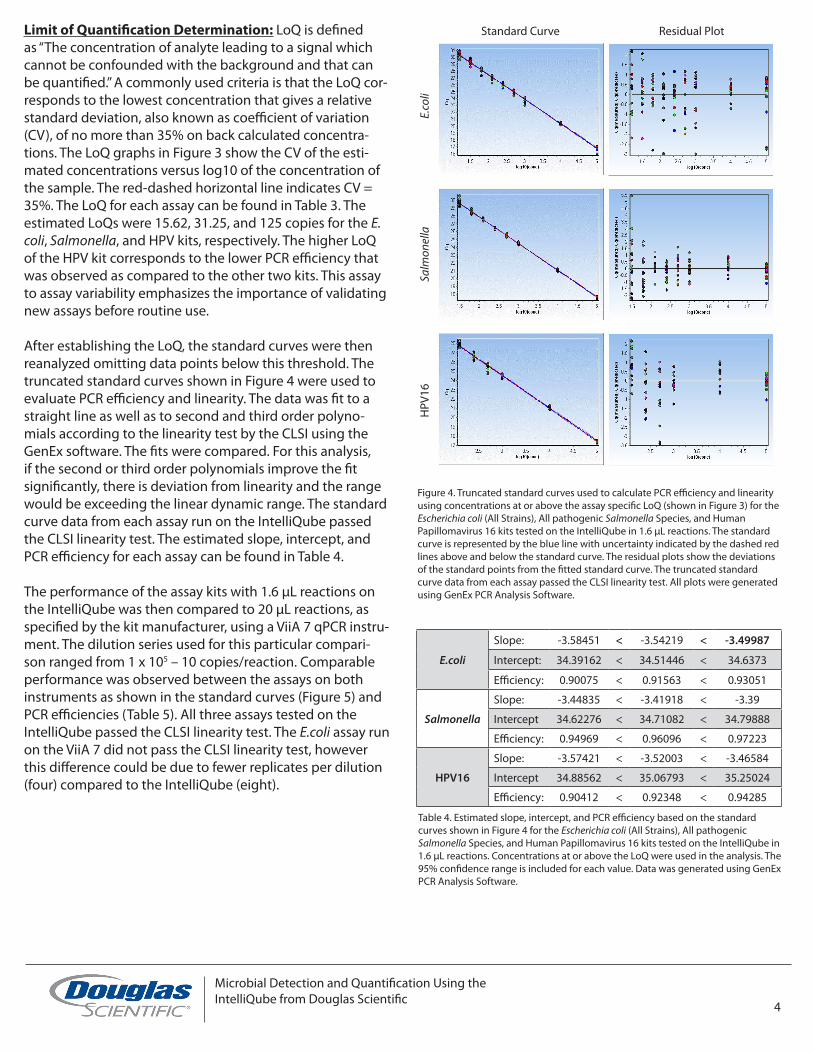
Limit of Quantification Determination: LoQ is defined as “The concentration of analyte leading to a signal which cannot be confounded with the background and that can be quantified.” A commonly used criteria is that the LoQ cor-responds to the lowest concentration that gives a relative standard deviation, also known as coefficient of variation (CV), of no more than 35% on back calculated concentra-tions. The LoQ graphs in Figure 3 show the CV of the esti-mated concentrations versus log10 of the concentration of the sample. The red-dashed horizontal line indicates CV = 35%. The LoQ for each assay can be found in Table 3. The estimated LoQs were 15.62, 31.25, and 125 copies for the E. coli, Salmonella, and HPV kits, respectively. The higher LoQ of the HPV kit corresponds to the lower PCR efficiency that was observed as compared to the other two kits. This assay to assay variability emphasizes the importance of validating new assays before routine use.
After establishing the LoQ, the standard curves were then reanalyzed omitting data points below this threshold. The truncated standard curves shown in Figure 4 were used to evaluate PCR efficiency and linearity. The data was fit to a straight line as well as to second and third order polyno-mials according to the linearity test by the CLSI using the GenEx software. The fits were compared. For this analysis, if the second or third order polynomials improve the fit significantly, there is deviation from linearity and the range would be exceeding the linear dynamic range. The standard curve data from each assay run on the IntelliQube passed the CLSI linearity test. The estimated slope, intercept, and PCR efficiency for each assay can be found in Table 4.
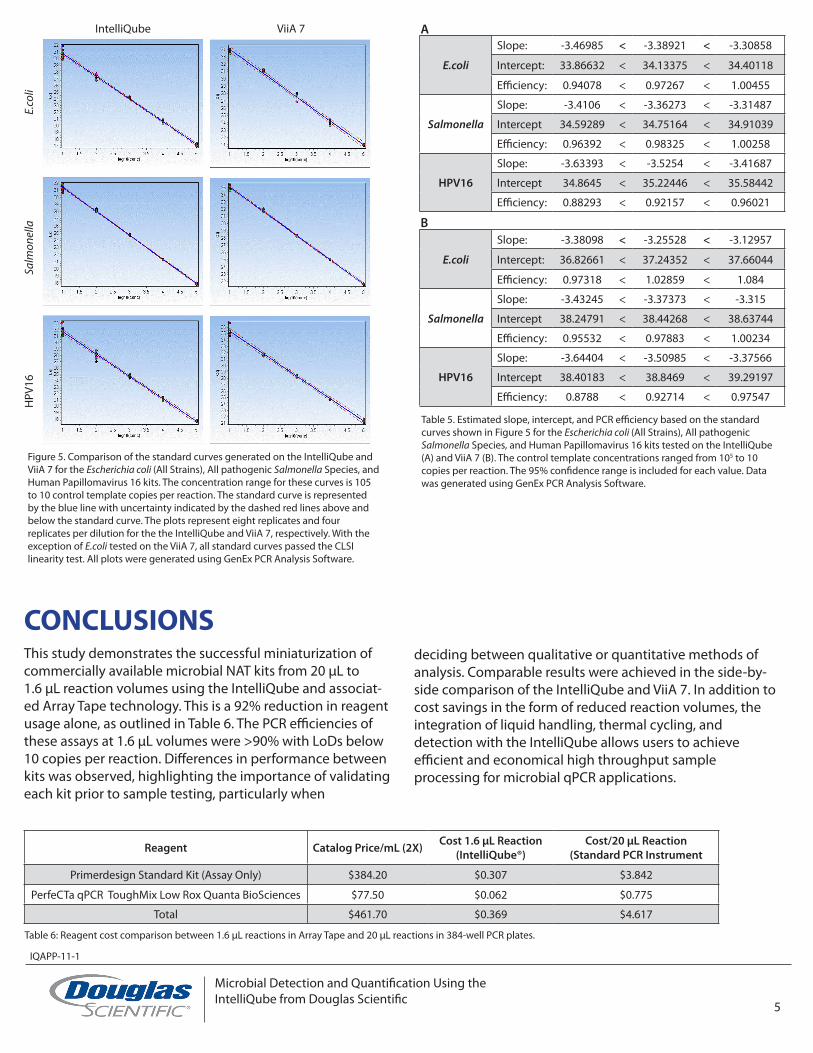
The performance of the assay kits with 1.6 µL reactions on the IntelliQube was then compared to 20 µL reactions, as specified by the kit manufacturer, using a ViiA 7 qPCR instru-ment. The dilution series used for this particular compari-son ranged from 1 x 10⁵ – 10 copies/reaction. Comparable performance was observed between the assays on both instruments as shown in the standard curves (Figure 5) and PCR efficiencies (Table 5). All three assays tested on the IntelliQube passed the CLSI linearity test. The E.coli assay run on the ViiA 7 did not pass the CLSI linearity test, however this difference could be due to fewer replicates per dilution (four) compared to the IntelliQube (eight).
Figure 4. Truncated standard curves used to calculate PCR efficiency and linearity using concentrations at or above the assay specific LoQ (shown in Figure 3) for the Escherichia coli (All Strains), All pathogenic Salmonella Species, and Human Papillomavirus 16 kits tested on the IntelliQube in 1.6 µL reactions. The standard curve is represented by the blue line with uncertainty indicated by the dashed red lines above and below the standard curve. The residual plots show the deviations of the standard points from the fitted standard curve. The truncated standard curve data from each assay passed the CLSI linearity test. All plots were generated using GenEx PCR Analysis Software.
Standard Curve Residual Plot
E.co
liSa
lmon
ella
HPV
16
E.coli
Slope: -3.58451 < -3.54219 < -3.49987
Intercept: 34.39162 < 34.51446 < 34.6373
Efficiency: 0.90075 < 0.91563 < 0.93051
Salmonella
Slope: -3.44835 < -3.41918 < -3.39
Intercept 34.62276 < 34.71082 < 34.79888
Efficiency: 0.94969 < 0.96096 < 0.97223
HPV16
Slope: -3.57421 < -3.52003 < -3.46584
Intercept 34.88562 < 35.06793 < 35.25024
Efficiency: 0.90412 < 0.92348 < 0.94285
Table 4. Estimated slope, intercept, and PCR efficiency based on the standard curves shown in Figure 4 for the Escherichia coli (All Strains), All pathogenic Salmonella Species, and Human Papillomavirus 16 kits tested on the IntelliQube in 1.6 µL reactions. Concentrations at or above the LoQ were used in the analysis. The 95% confidence range is included for each value. Data was generated using GenEx PCR Analysis Software.
Microbial Detection and Quantification Using the IntelliQube from Douglas Scientific 5
IQAPP-11-1
IntelliQube ViiA 7 E.
coli
Salm
onel
laH
PV16
Figure 5. Comparison of the standard curves generated on the IntelliQube and ViiA 7 for the Escherichia coli (All Strains), All pathogenic Salmonella Species, and Human Papillomavirus 16 kits. The concentration range for these curves is 105 to 10 control template copies per reaction. The standard curve is represented by the blue line with uncertainty indicated by the dashed red lines above and below the standard curve. The plots represent eight replicates and four replicates per dilution for the the IntelliQube and ViiA 7, respectively. With the exception of E.coli tested on the ViiA 7, all standard curves passed the CLSI linearity test. All plots were generated using GenEx PCR Analysis Software.
E.coli
Slope: -3.46985 < -3.38921 < -3.30858
Intercept: 33.86632 < 34.13375 < 34.40118
Efficiency: 0.94078 < 0.97267 < 1.00455
Salmonella
Slope: -3.4106 < -3.36273 < -3.31487
Intercept 34.59289 < 34.75164 < 34.91039
Efficiency: 0.96392 < 0.98325 < 1.00258
HPV16
Slope: -3.63393 < -3.5254 < -3.41687
Intercept 34.8645 < 35.22446 < 35.58442
Efficiency: 0.88293 < 0.92157 < 0.96021
Table 5. Estimated slope, intercept, and PCR efficiency based on the standard curves shown in Figure 5 for the Escherichia coli (All Strains), All pathogenic Salmonella Species, and Human Papillomavirus 16 kits tested on the IntelliQube (A) and ViiA 7 (B). The control template concentrations ranged from 105 to 10 copies per reaction. The 95% confidence range is included for each value. Data was generated using GenEx PCR Analysis Software.
A
E.coli
Slope: -3.38098 < -3.25528 < -3.12957
Intercept: 36.82661 < 37.24352 < 37.66044
Efficiency: 0.97318 < 1.02859 < 1.084
Salmonella
Slope: -3.43245 < -3.37373 < -3.315
Intercept 38.24791 < 38.44268 < 38.63744
Efficiency: 0.95532 < 0.97883 < 1.00234
HPV16
Slope: -3.64404 < -3.50985 < -3.37566
Intercept 38.40183 < 38.8469 < 39.29197
Efficiency: 0.8788 < 0.92714 < 0.97547
B
Reagent Catalog Price/mL (2X) Cost 1.6 µL Reaction (IntelliQube®)
Cost/20 µL Reaction (Standard PCR Instrument
Primerdesign Standard Kit (Assay Only) $384.20 $0.307 $3.842
PerfeCTa qPCR ToughMix Low Rox Quanta BioSciences $77.50 $0.062 $0.775
Total $461.70 $0.369 $4.617
Table 6: Reagent cost comparison between 1.6 µL reactions in Array Tape and 20 µL reactions in 384-well PCR plates.
CONCLUSIONSThis study demonstrates the successful miniaturization of commercially available microbial NAT kits from 20 µL to 1.6 µL reaction volumes using the IntelliQube and associat-ed Array Tape technology. This is a 92% reduction in reagent usage alone, as outlined in Table 6. The PCR efficiencies of these assays at 1.6 µL volumes were >90% with LoDs below 10 copies per reaction. Differences in performance between kits was observed, highlighting the importance of validating each kit prior to sample testing, particularly when
deciding between qualitative or quantitative methods of analysis. Comparable results were achieved in the side-by-side comparison of the IntelliQube and ViiA 7. In addition to cost savings in the form of reduced reaction volumes, the integration of liquid handling, thermal cycling, and detection with the IntelliQube allows users to achieve efficient and economical high throughput sample processing for microbial qPCR applications.


![Multid Presentation 2016[1]](https://img.pdfslide.us/doc/110x75/589aa6321a28abfc1a8b63cd/multid-presentation-20161.jpg)